Embed Size (px)
Citation preview
Asset Based Community Development &
Measuring Impact
ABCD Festival – Goa, India 2017
•Agenda
•Learning Objectives
•Learning Community Agreements
“However beautiful the strategy, you should occasionally look at the results.”
Winston Churchill
“The useful aspect of measurement is that it helps us make explicit our intentions and can be a strategy for learning.”
– Peter Block
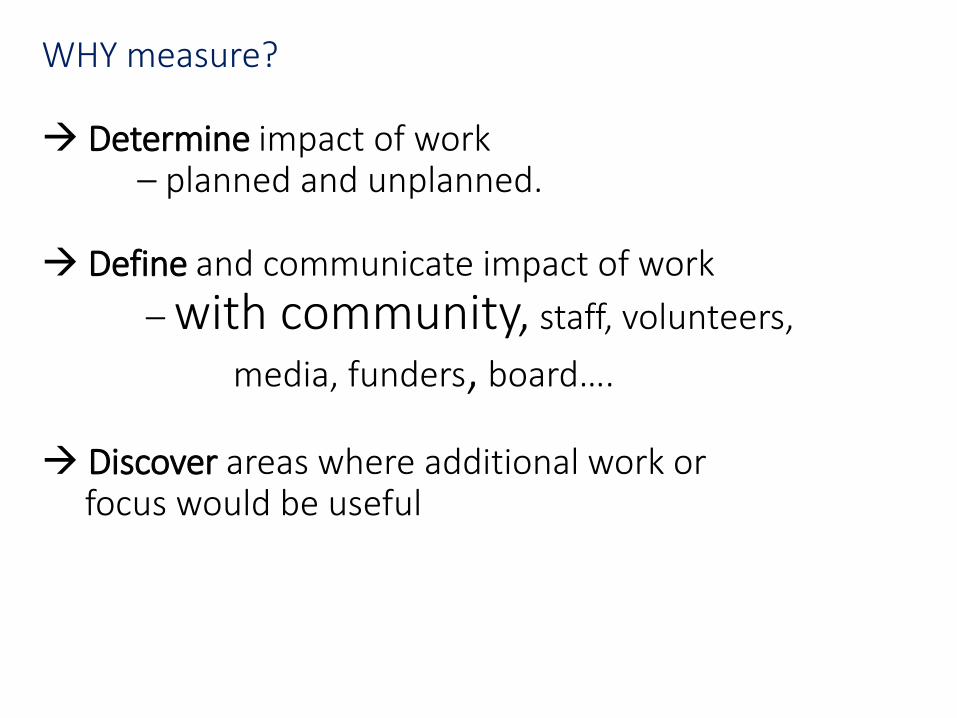
Why Measure?!?!?WHY measure?
Determine impact of work – planned and unplanned.
Define and communicate impact of work
– with community, staff, volunteers,
media, funders, board….
Discover areas where additional work orfocus would be useful
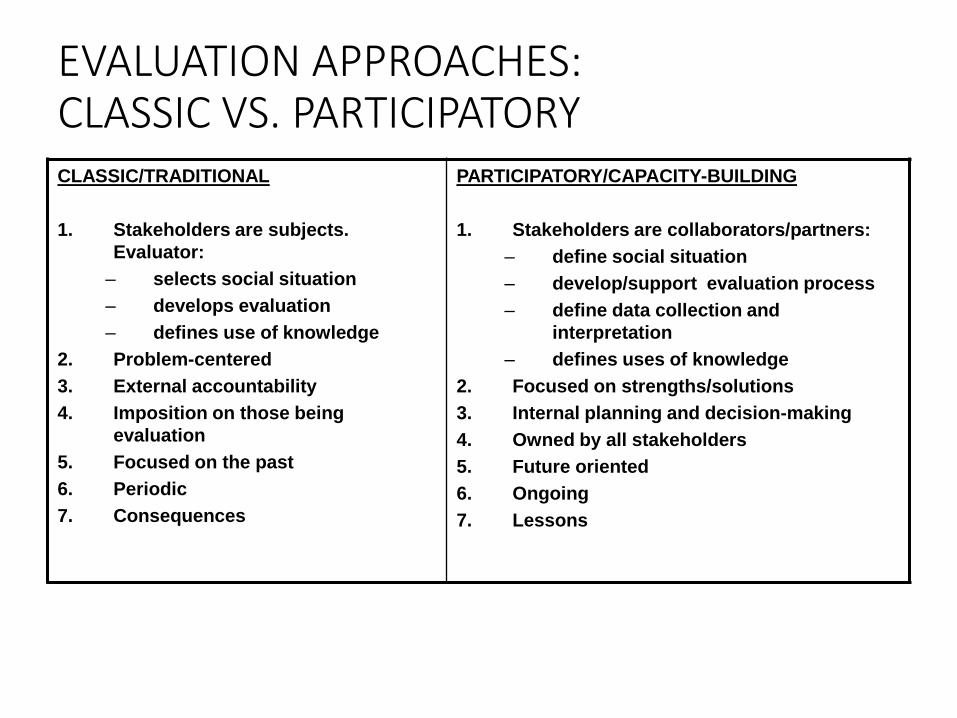
EVALUATION APPROACHES:CLASSIC VS. PARTICIPATORYCLASSIC/TRADITIONAL
1. Stakeholders are subjects.
Evaluator:
– selects social situation
– develops evaluation
– defines use of knowledge
2. Problem-centered
3. External accountability
4. Imposition on those being
evaluation
5. Focused on the past
6. Periodic
7. Consequences
PARTICIPATORY/CAPACITY-BUILDING
1. Stakeholders are collaborators/partners:
– define social situation
– develop/support evaluation process
– define data collection and
interpretation
– defines uses of knowledge
2. Focused on strengths/solutions
3. Internal planning and decision-making
4. Owned by all stakeholders
5. Future oriented
6. Ongoing
7. Lessons
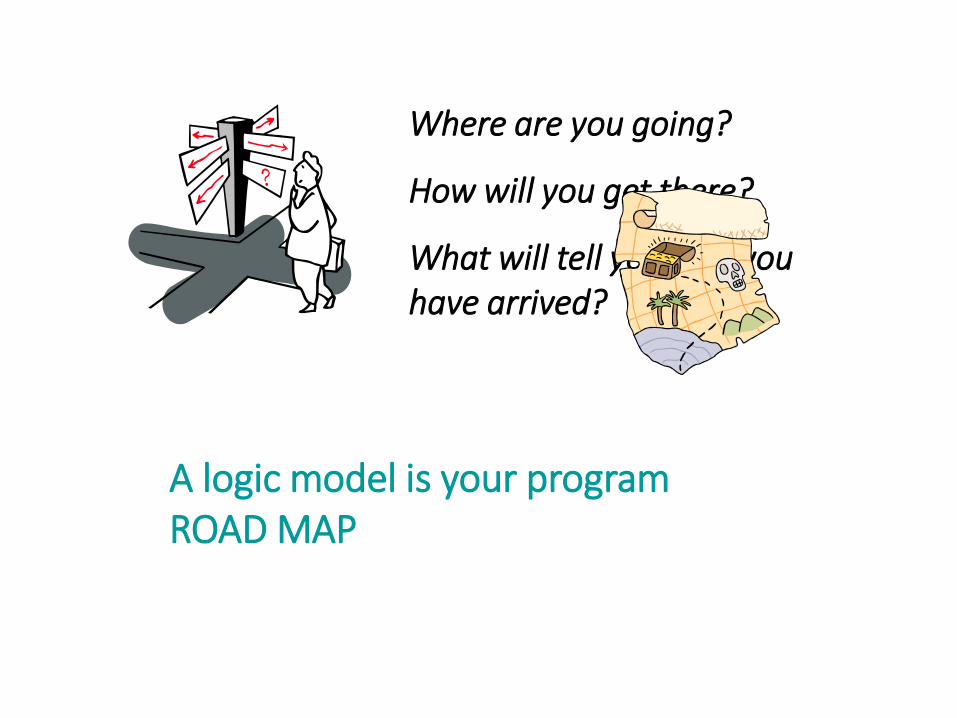
A logic model is your program ROAD MAP
Where are you going?
How will you get there?
What will tell you that youhave arrived?
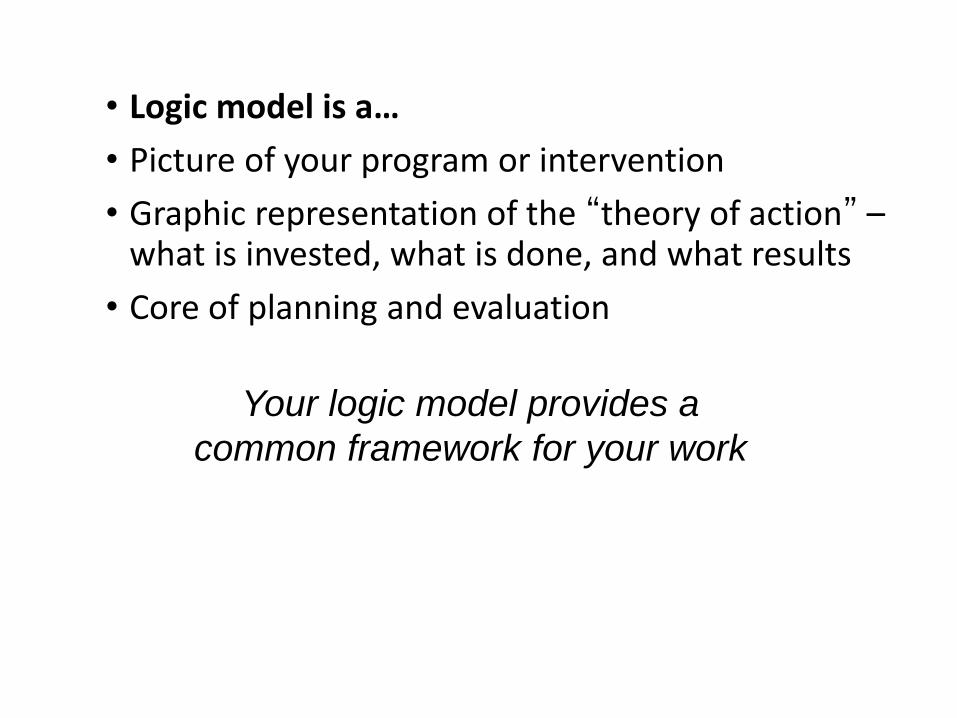
• Logic model is a…
• Picture of your program or intervention
• Graphic representation of the “theory of action” –what is invested, what is done, and what results
• Core of planning and evaluation
Your logic model provides a
common framework for your work
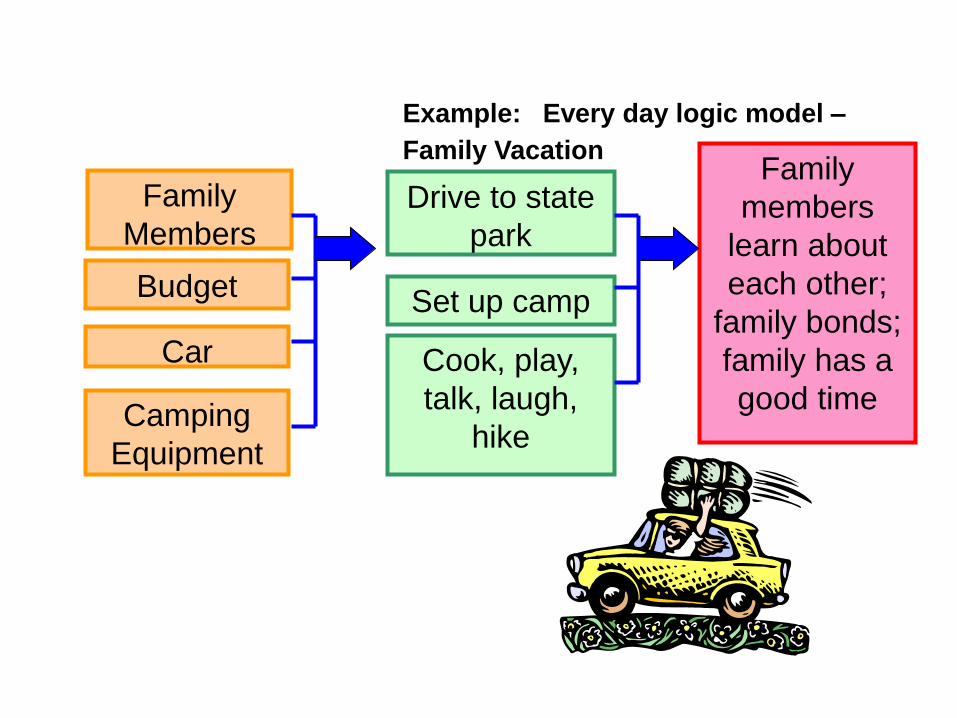
Family
Members
Budget
Car
Camping
Equipment
Drive to state
park
Set up camp
Cook, play,
talk, laugh,
hike
Family
members
learn about
each other;
family bonds;
family has a
good time
Example: Every day logic model –
Family Vacation
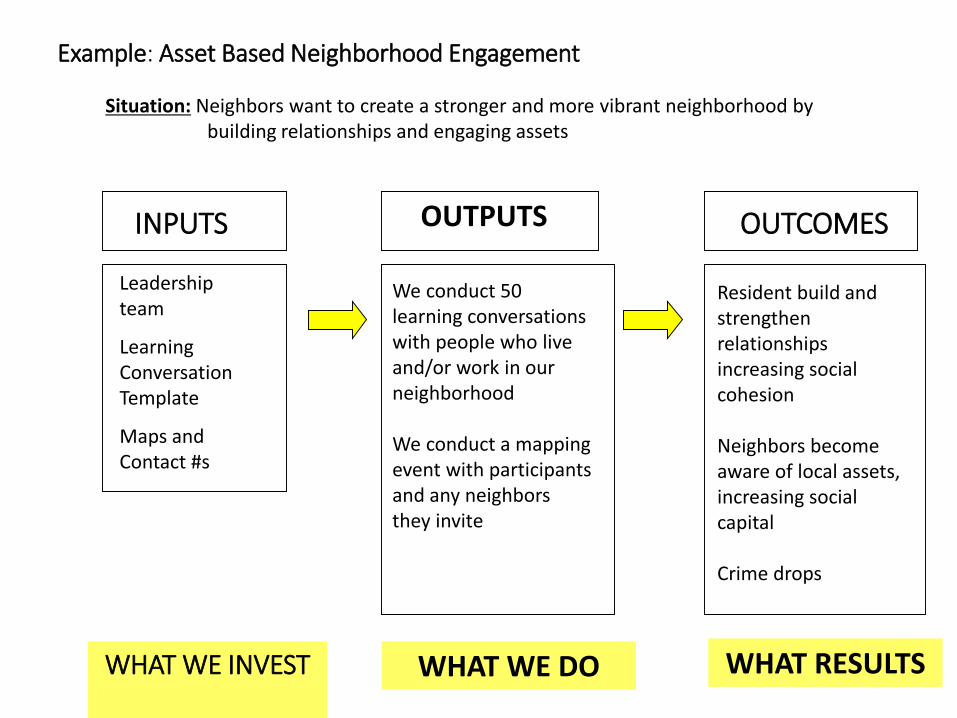
Situation: Neighbors want to create a stronger and more vibrant neighborhood by building relationships and engaging assets
INPUTS OUTPUTS OUTCOMES
Leadership team
Learning Conversation Template
Maps and Contact #s
We conduct 50 learning conversations with people who live and/or work in our neighborhood
We conduct a mapping event with participants and any neighbors they invite
Resident build and strengthen relationships increasing social cohesion
Neighbors become aware of local assets, increasing social capital
Crime drops
WHAT WE INVEST WHAT WE DO WHAT RESULTS
Example: Asset Based Neighborhood Engagement
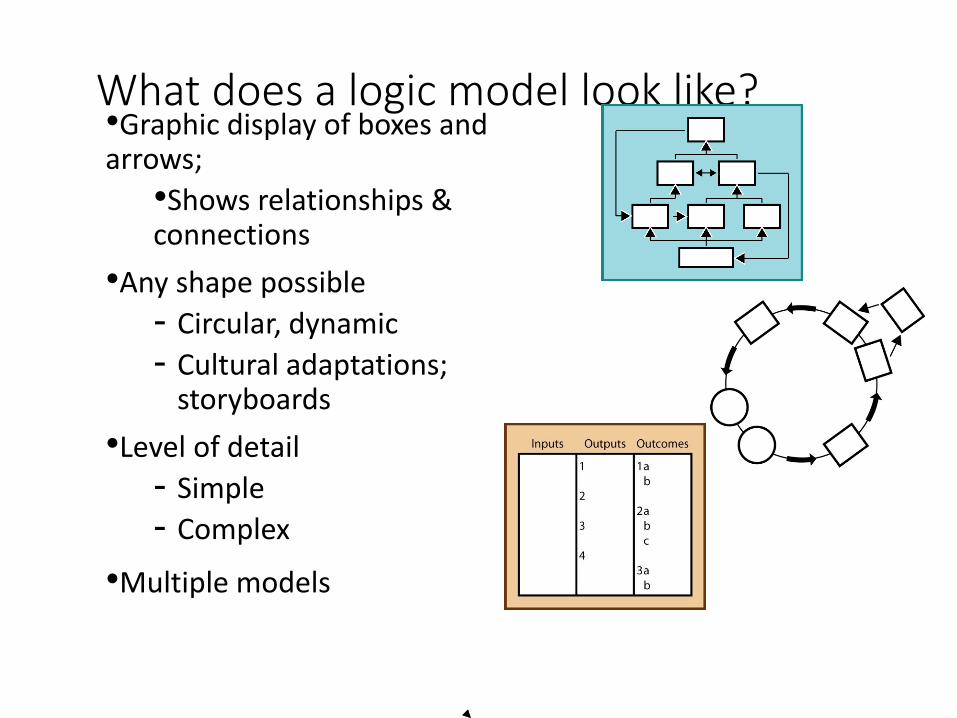
What does a logic model look like?•Graphic display of boxes and arrows;
•Shows relationships & connections
•Any shape possible
- Circular, dynamic
- Cultural adaptations; storyboards
•Level of detail
- Simple
- Complex
•Multiple models
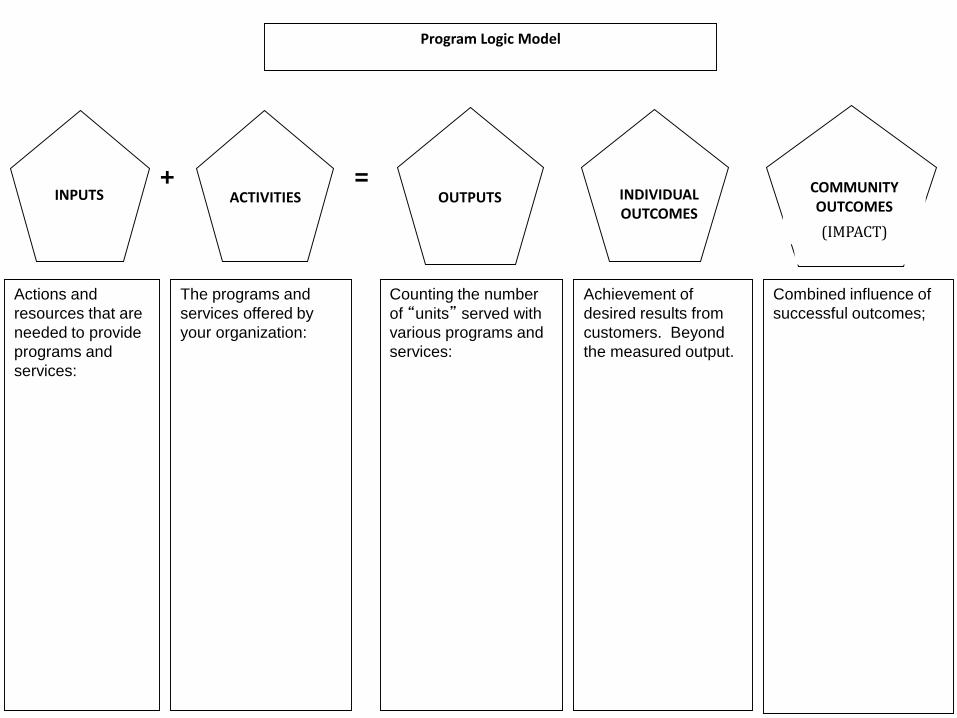
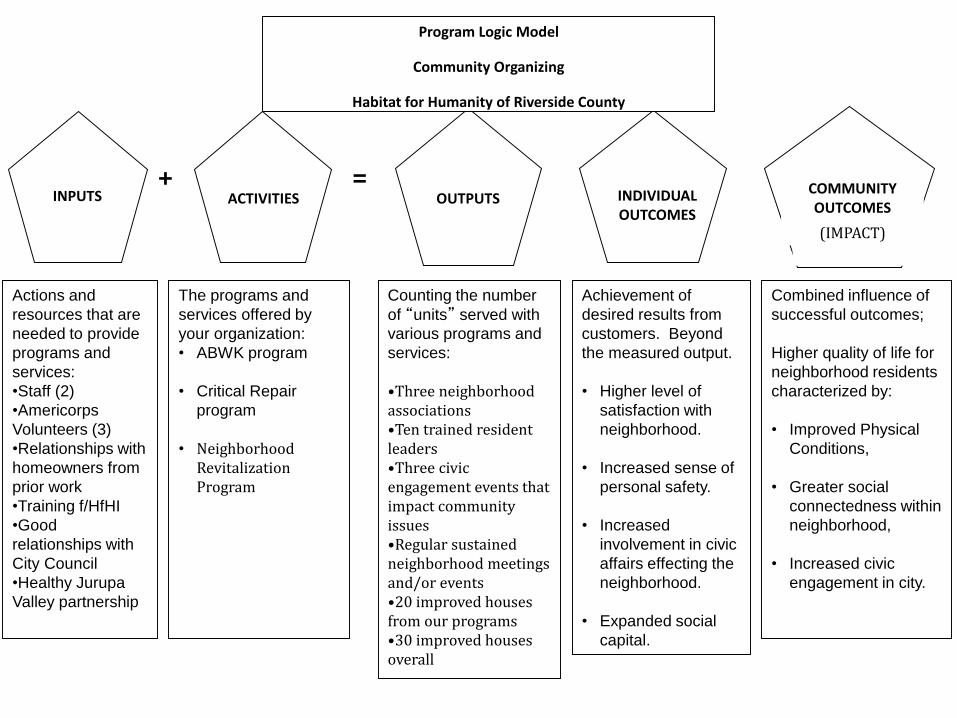
INDIVIDUALOUTCOMES
ACTIVITIESINPUTS OUTPUTSCOMMUNITY OUTCOMES
Actions and
resources that are
needed to provide
programs and
services:
The programs and
services offered by
your organization:
Counting the number
of “units” served with
various programs and
services:
Achievement of
desired results from
customers. Beyond
the measured output.
Combined influence of
successful outcomes;
Program Logic Model
(IMPACT)
+ =
INDIVIDUALOUTCOMES
ACTIVITIESINPUTS OUTPUTSCOMMUNITY OUTCOMES
Actions and
resources that are
needed to provide
programs and
services:
•Staff (2)
•Americorps
Volunteers (3)
•Relationships with
homeowners from
prior work
•Training f/HfHI
•Good
relationships with
City Council
•Healthy Jurupa
Valley partnership
The programs and
services offered by
your organization:
• ABWK program
• Critical Repair
program
• Neighborhood Revitalization Program
Counting the number
of “units” served with
various programs and
services:
•Three neighborhood associations•Ten trained resident leaders•Three civic engagement events that impact community issues•Regular sustained neighborhood meetings and/or events•20 improved houses from our programs•30 improved houses overall
Achievement of
desired results from
customers. Beyond
the measured output.
• Higher level of
satisfaction with
neighborhood.
• Increased sense of
personal safety.
• Increased
involvement in civic
affairs effecting the
neighborhood.
• Expanded social
capital.
Combined influence of
successful outcomes;
Higher quality of life for
neighborhood residents
characterized by:
• Improved Physical
Conditions,
• Greater social
connectedness within
neighborhood,
• Increased civic
engagement in city.
Program Logic Model
Community Organizing
Habitat for Humanity of Riverside County
(IMPACT)
+ =
Check your logic model
1. Is it meaningful?
2. Does it make sense?
3. Is it doable?
4. Can it be verified?
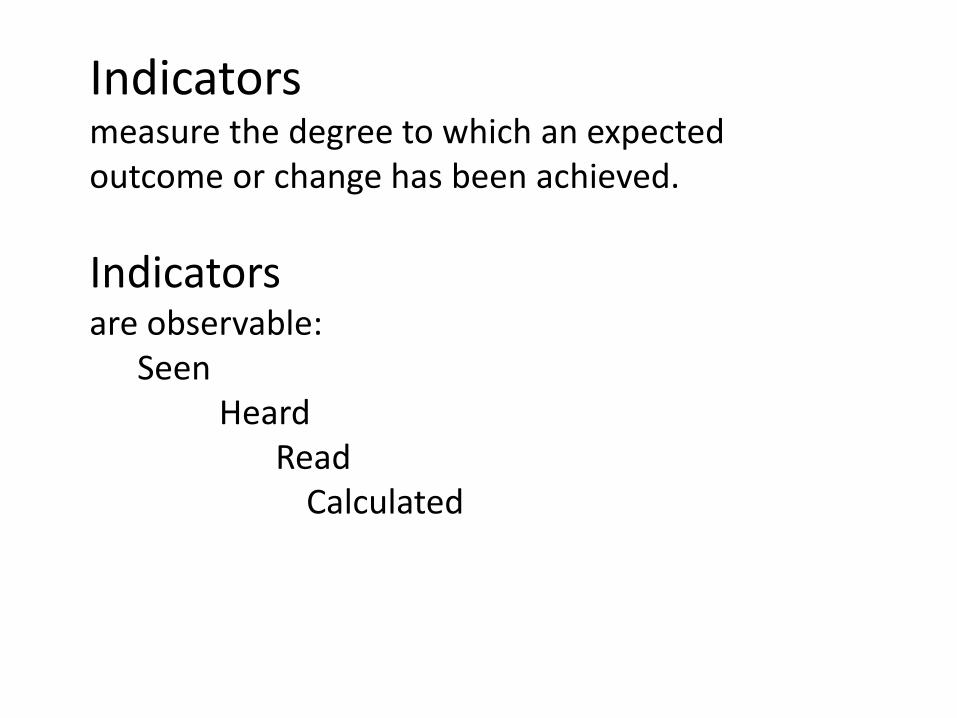
Indicators measure the degree to which an expected outcome or change has been achieved.
Indicators are observable:
Seen Heard
ReadCalculated
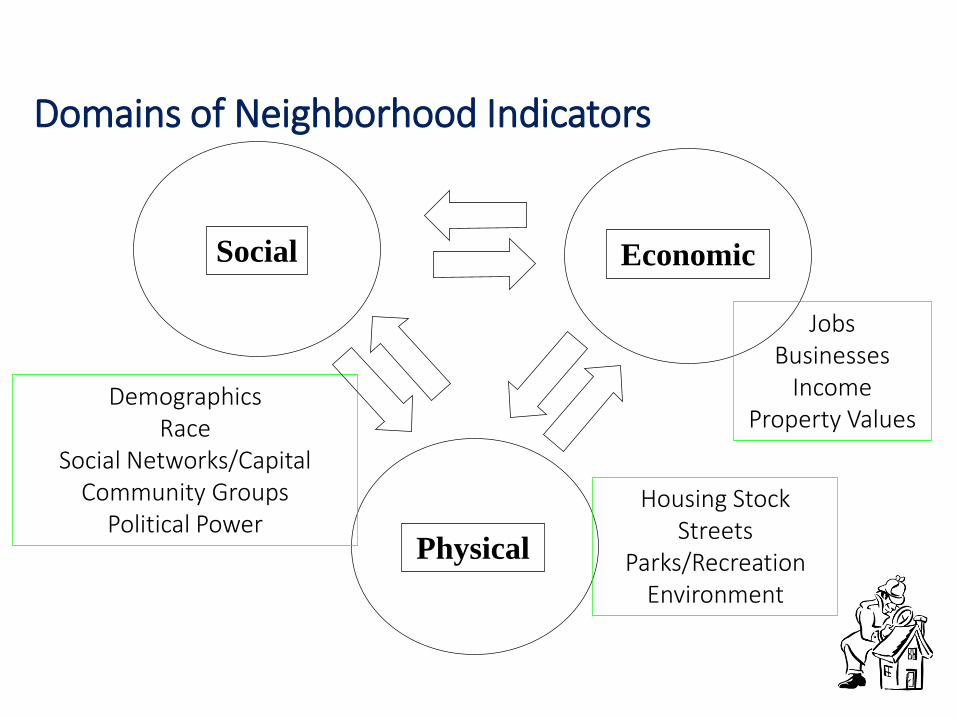
Domains of Neighborhood Indicators
Social Economic
Physical
DemographicsRace
Social Networks/CapitalCommunity Groups
Political PowerHousing Stock
StreetsParks/Recreation
Environment
JobsBusinesses
IncomeProperty Values
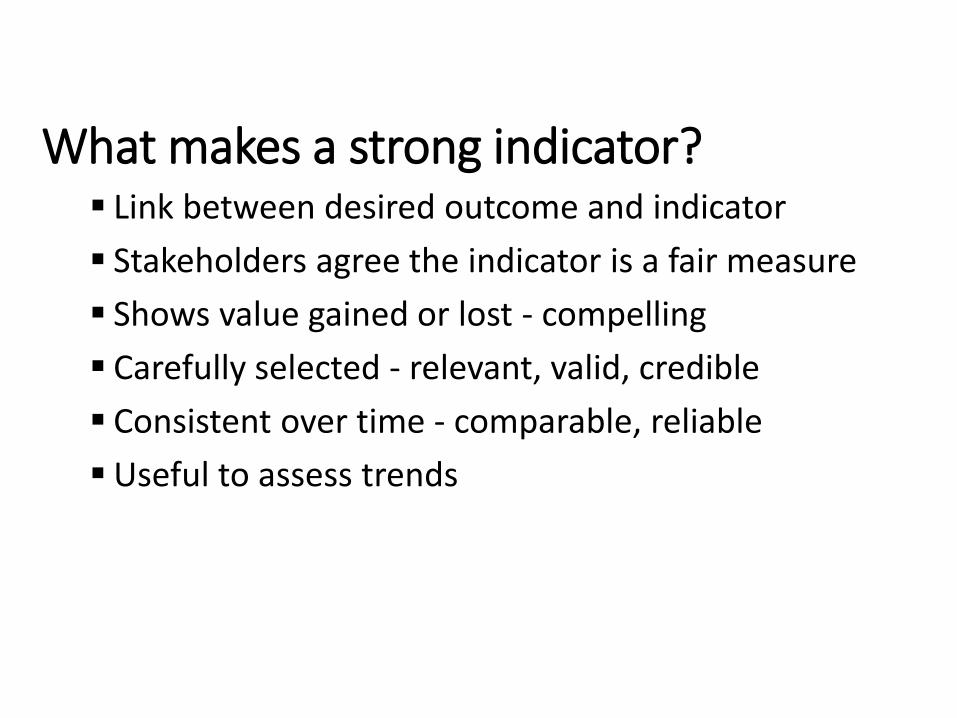
What makes a strong indicator? Link between desired outcome and indicator
Stakeholders agree the indicator is a fair measure
Shows value gained or lost - compelling
Carefully selected - relevant, valid, credible
Consistent over time - comparable, reliable
Useful to assess trends
What impacts does your ABCD work try to
achieve or influence?
What indicators would signify progress
towards achieve these impacts?
What data, or information, would measure
these indicators?
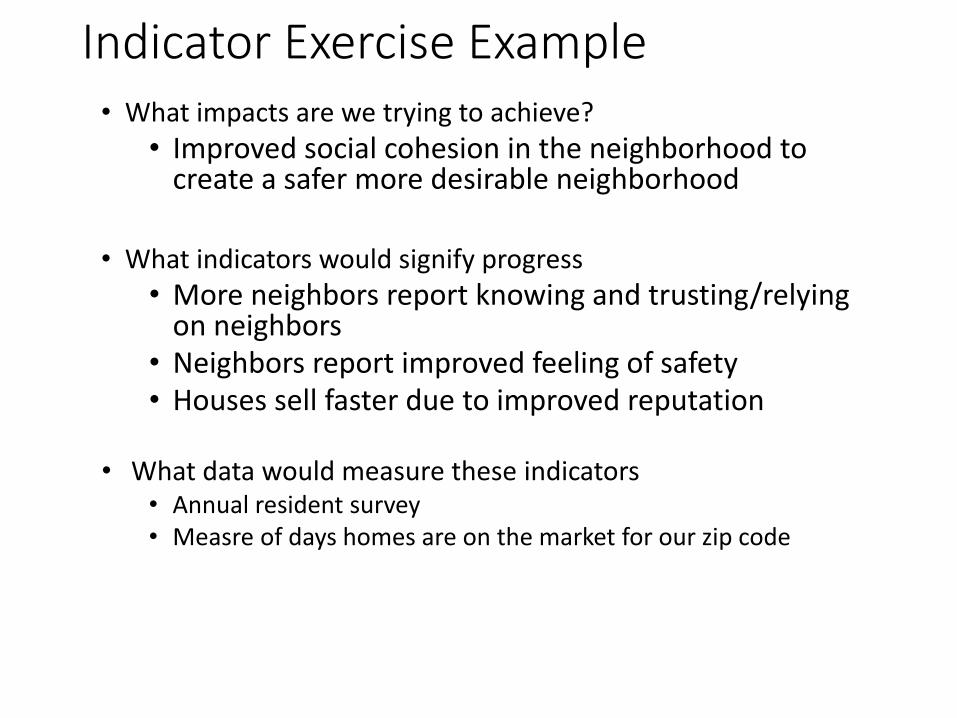
Indicator Exercise Example• What impacts are we trying to achieve?
• Improved social cohesion in the neighborhood to create a safer more desirable neighborhood
• What indicators would signify progress
• More neighbors report knowing and trusting/relying on neighbors
• Neighbors report improved feeling of safety• Houses sell faster due to improved reputation
• What data would measure these indicators• Annual resident survey• Measre of days homes are on the market for our zip code
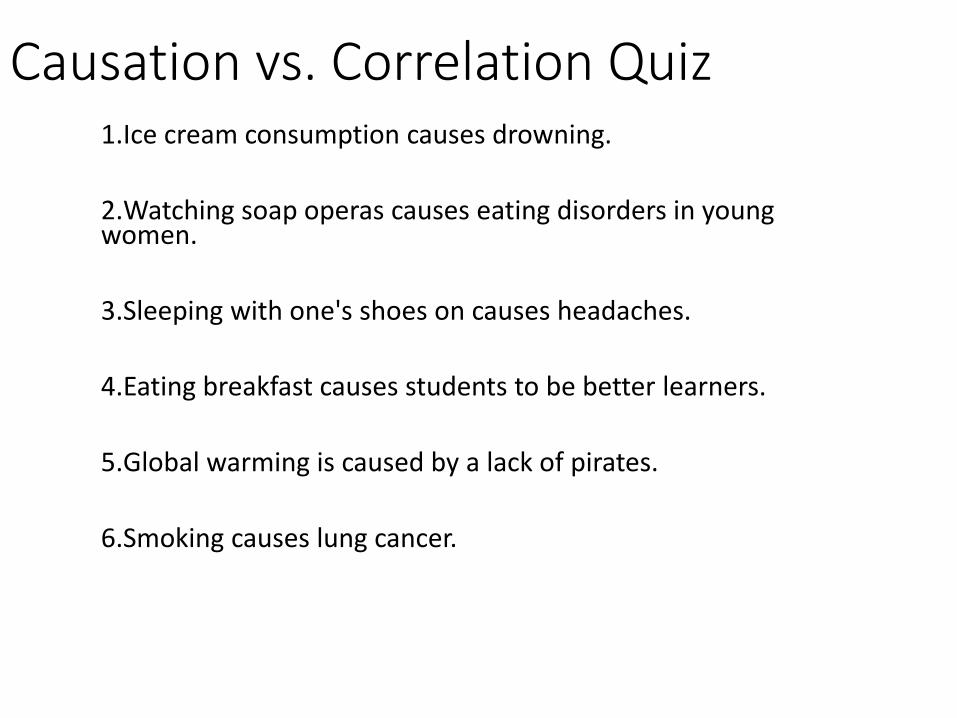
Causation vs. Correlation Quiz1.Ice cream consumption causes drowning.
2.Watching soap operas causes eating disorders in young women.
3.Sleeping with one's shoes on causes headaches.
4.Eating breakfast causes students to be better learners.
5.Global warming is caused by a lack of pirates.
6.Smoking causes lung cancer.
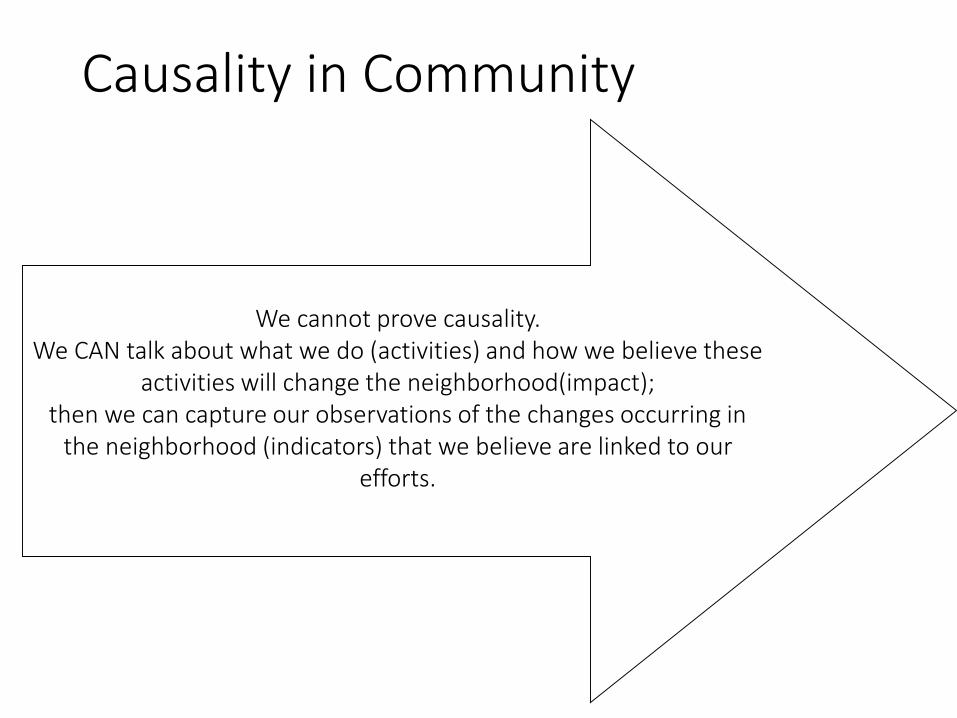
Causality in Community
We cannot prove causality.We CAN talk about what we do (activities) and how we believe these
activities will change the neighborhood(impact); then we can capture our observations of the changes occurring in
the neighborhood (indicators) that we believe are linked to our efforts.
Data Collection Tools and Indicators
The indicator is what you will measure.
The data collection method is the approach you will use to measure.
There are often several different ways to measure an indicator
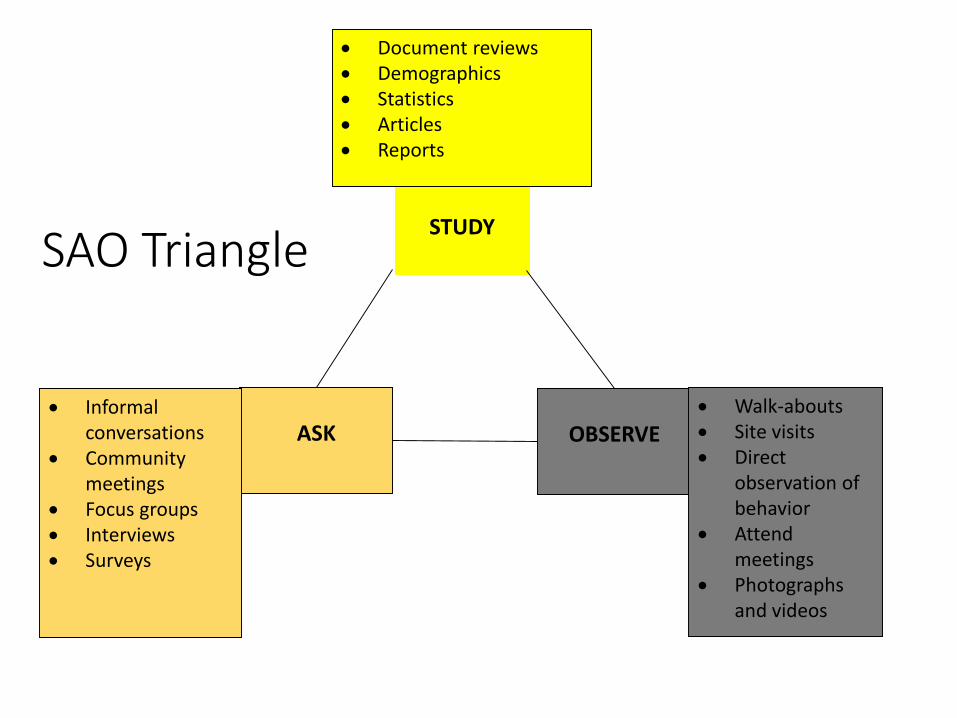
SAO TriangleSTUDY
ASK OBSERVE
Document reviews Demographics Statistics Articles Reports
Informal conversations
Community meetings
Focus groups Interviews Surveys
Walk-abouts Site visits Direct
observation of behavior
Attend meetings
Photographs and videos
Different Types of Data• Primary vs. Secondary
• Primary Data: data you create to answer a specific research question.
• Secondary Data: data someone else created for a different reason but you are going to use to answer your research question.
• Qualitative and Quantitative• Quantitative: how much and how many?
• Qualitative: how, how well and why?
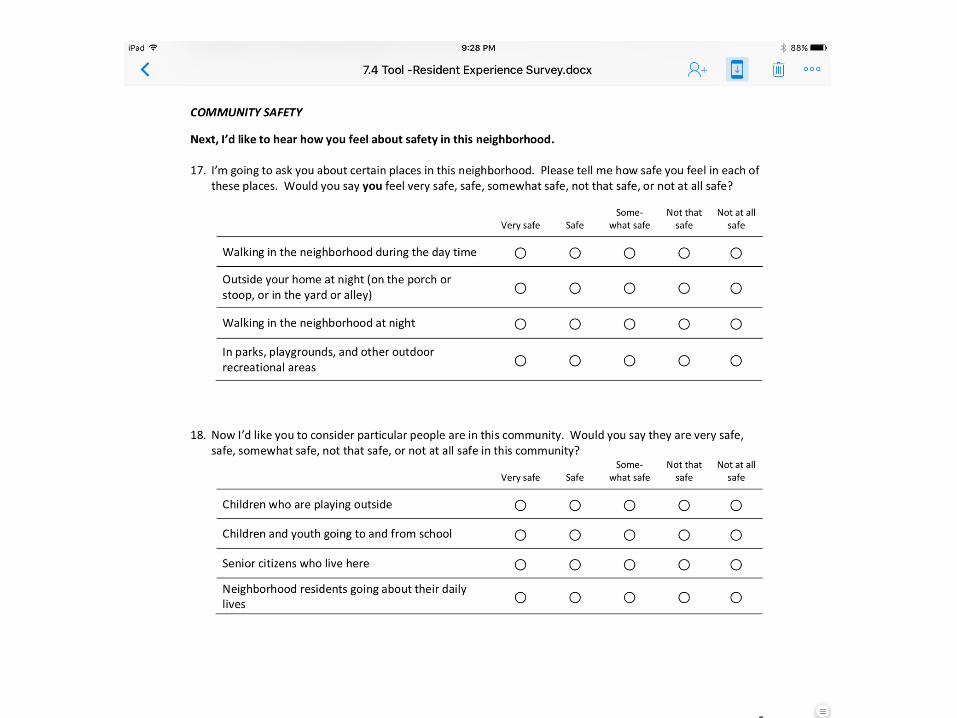
Surveys – what can we learn from people’s experiences and perceptions
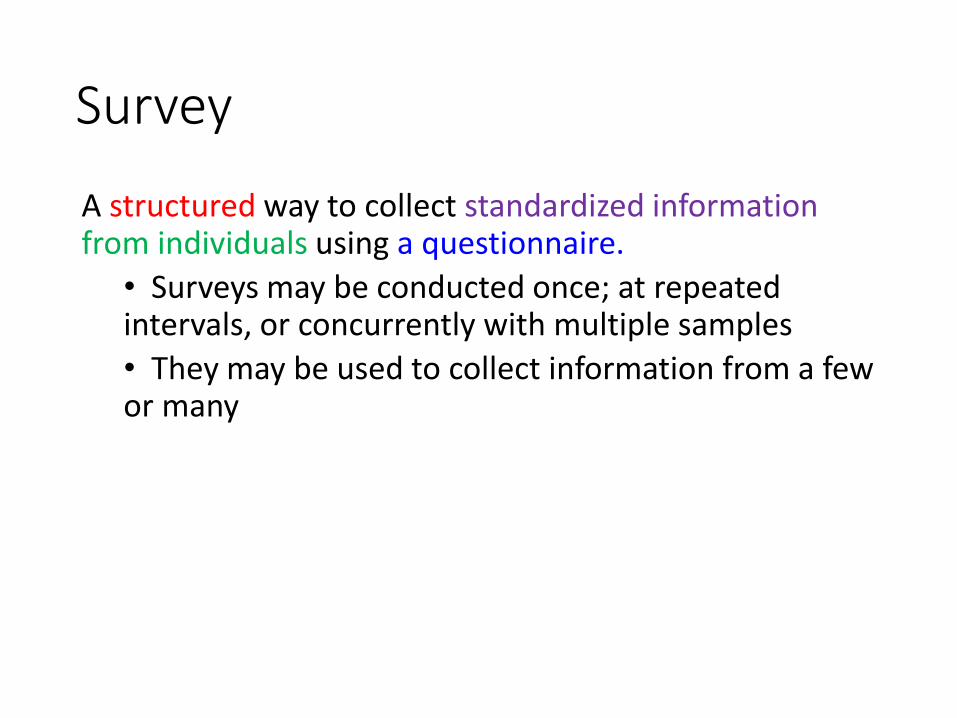
Survey
A structured way to collect standardized informationfrom individuals using a questionnaire.
• Surveys may be conducted once; at repeated intervals, or concurrently with multiple samples
• They may be used to collect information from a few or many
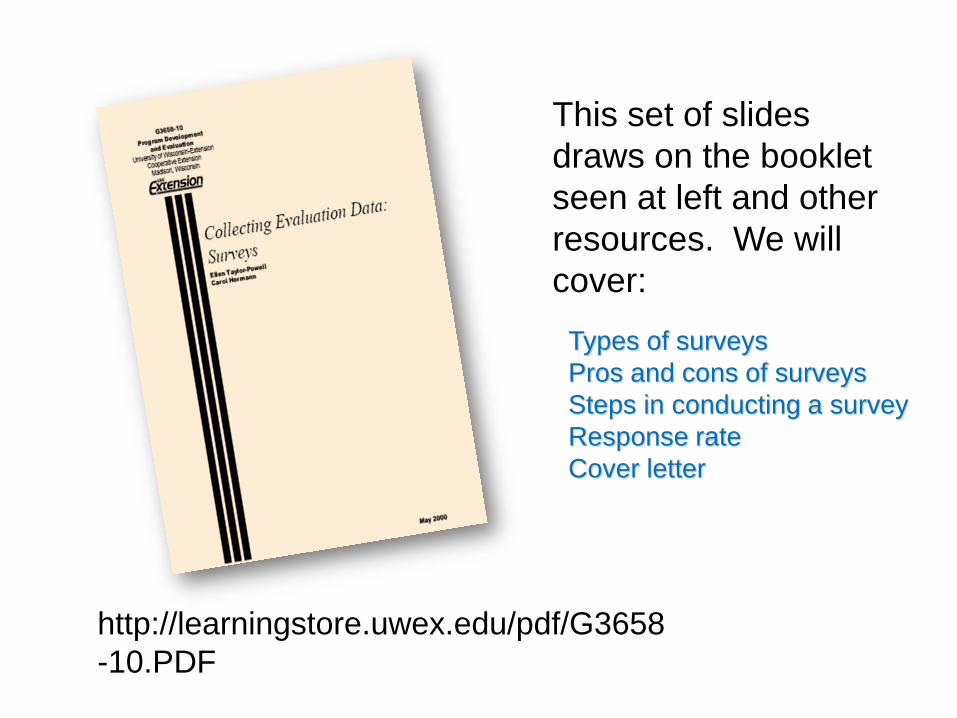
http://learningstore.uwex.edu/pdf/G3658
-10.PDF
This set of slides
draws on the booklet
seen at left and other
resources. We will
cover:
Types of surveys
Pros and cons of surveys
Steps in conducting a survey
Response rate
Cover letter
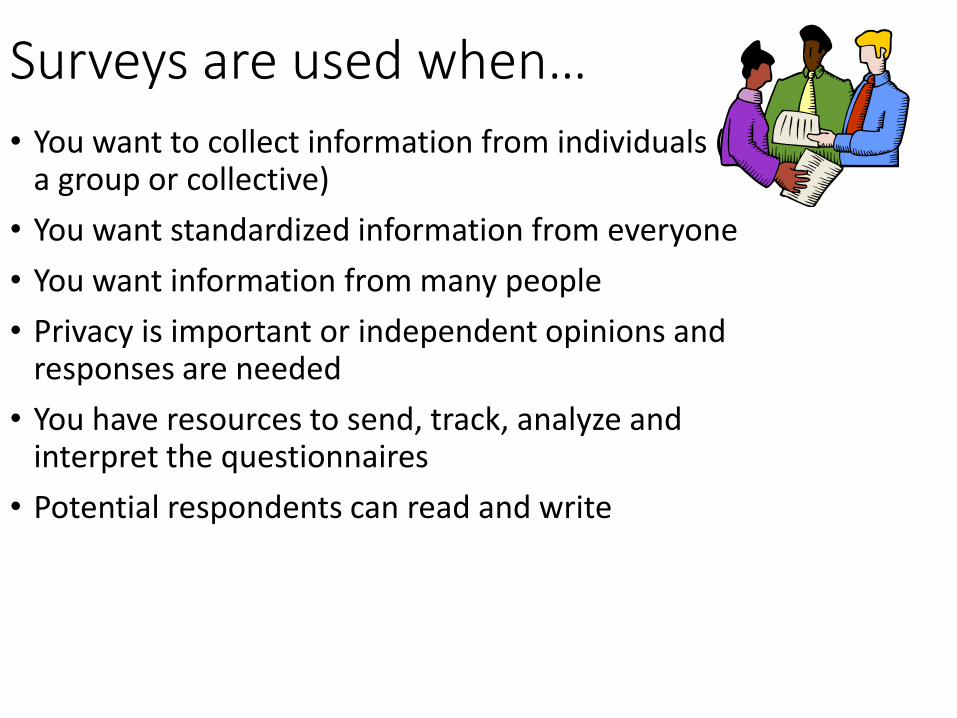
Surveys are used when…
• You want to collect information from individuals (vs. a group or collective)
• You want standardized information from everyone
• You want information from many people
• Privacy is important or independent opinions and responses are needed
• You have resources to send, track, analyze and interpret the questionnaires
• Potential respondents can read and write
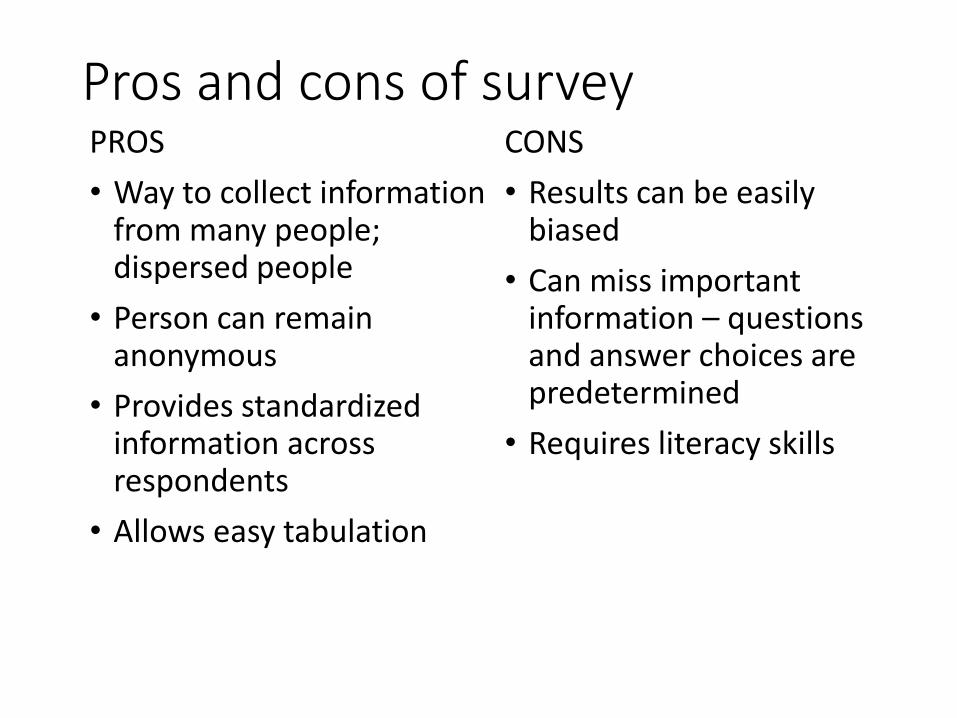
Pros and cons of surveyPROS
• Way to collect information from many people; dispersed people
• Person can remain anonymous
• Provides standardized information across respondents
• Allows easy tabulation
CONS
• Results can be easily biased
• Can miss important information – questions and answer choices are predetermined
• Requires literacy skills
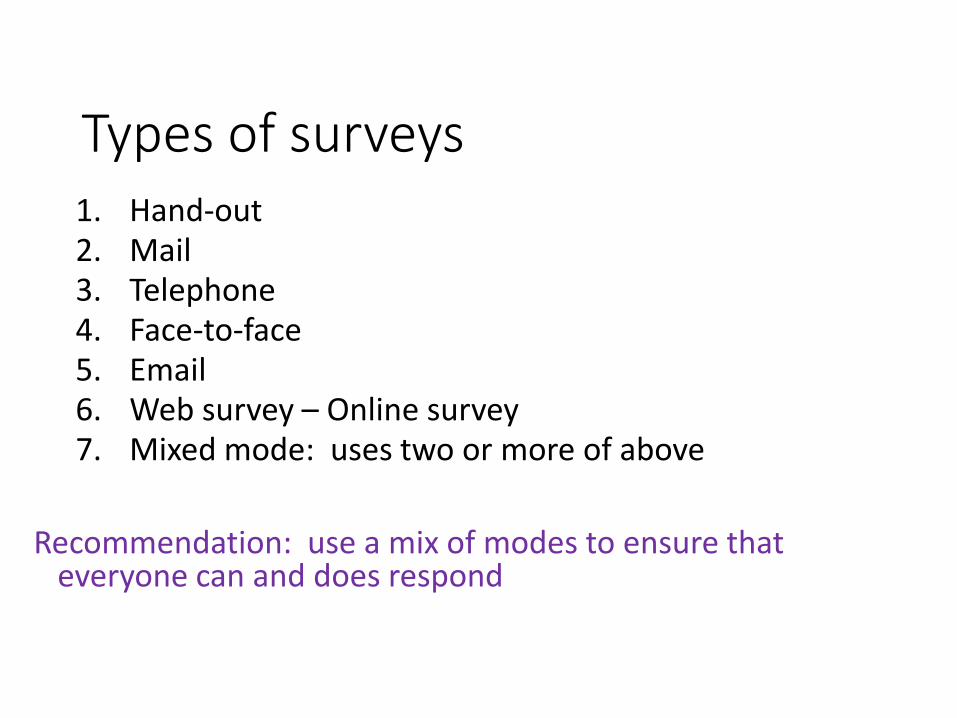
Types of surveys1. Hand-out2. Mail3. Telephone4. Face-to-face 5. Email6. Web survey – Online survey7. Mixed mode: uses two or more of above
Recommendation: use a mix of modes to ensure that everyone can and does respond
Take some time to plan your survey
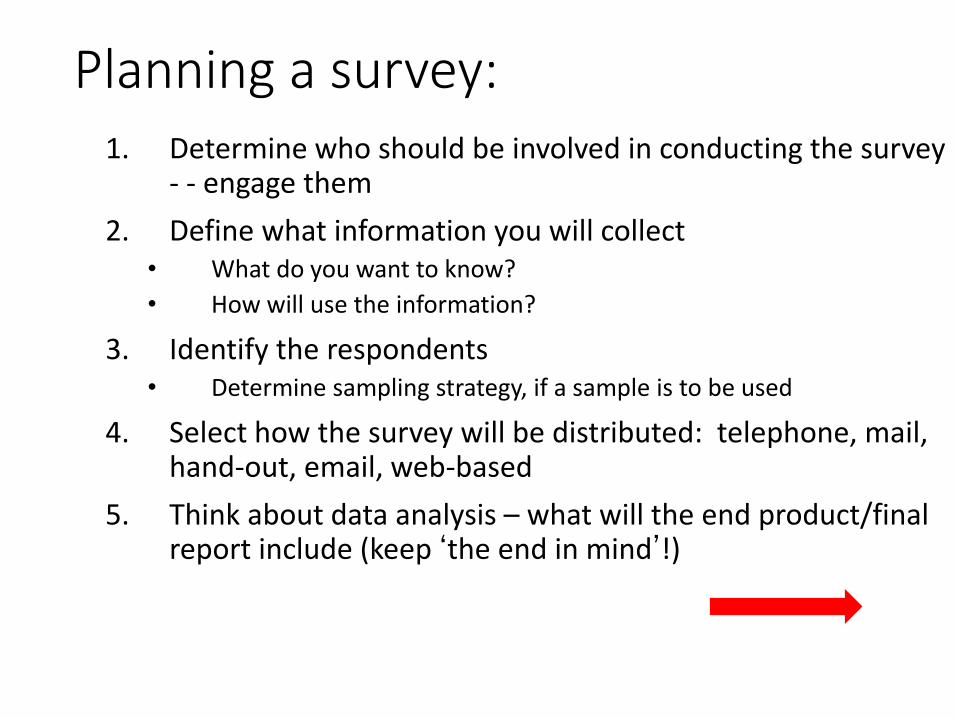
Planning a survey:1. Determine who should be involved in conducting the survey
- - engage them
2. Define what information you will collect • What do you want to know?
• How will use the information?
3. Identify the respondents• Determine sampling strategy, if a sample is to be used
4. Select how the survey will be distributed: telephone, mail, hand-out, email, web-based
5. Think about data analysis – what will the end product/final report include (keep ‘the end in mind’!)
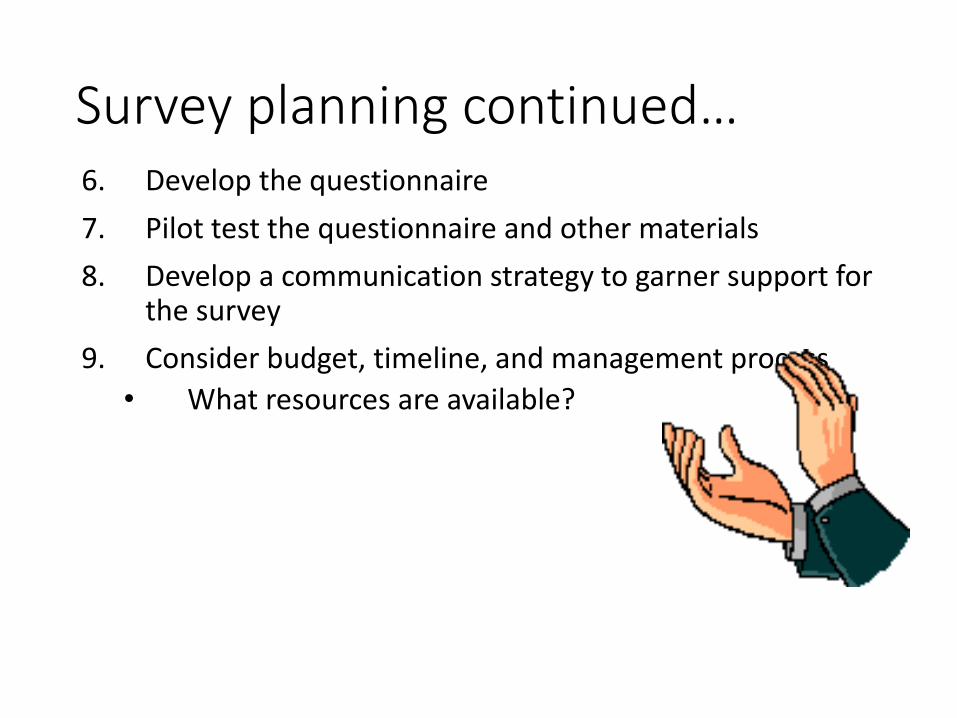
Survey planning continued…6. Develop the questionnaire
7. Pilot test the questionnaire and other materials
8. Develop a communication strategy to garner support for the survey
9. Consider budget, timeline, and management process
• What resources are available?
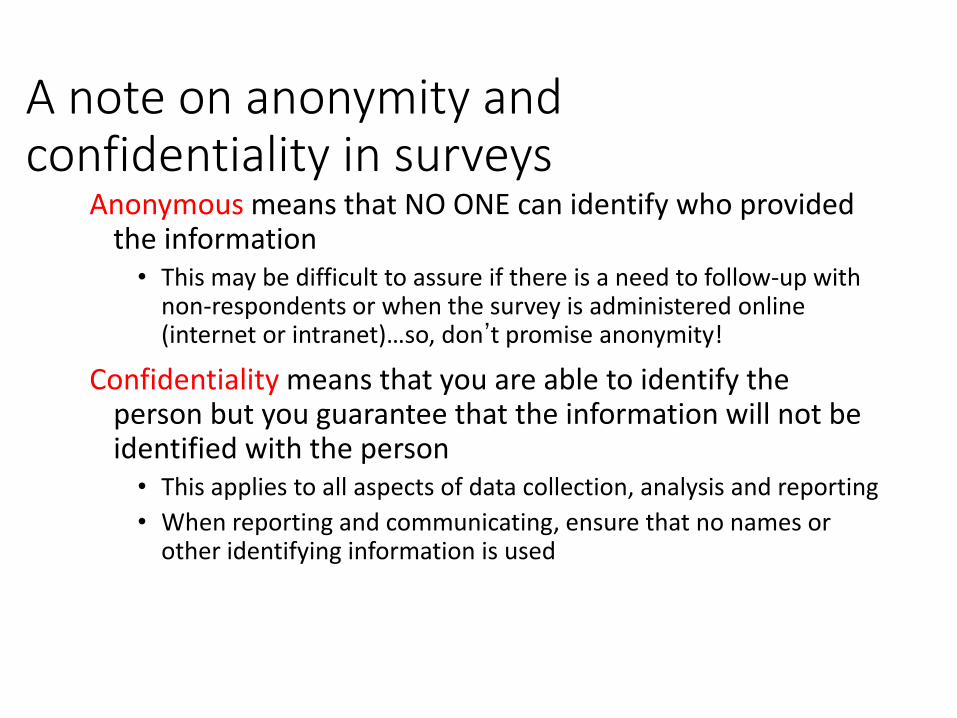
A note on anonymity and confidentiality in surveys
Anonymous means that NO ONE can identify who provided the information• This may be difficult to assure if there is a need to follow-up with
non-respondents or when the survey is administered online (internet or intranet)…so, don’t promise anonymity!
Confidentiality means that you are able to identify the person but you guarantee that the information will not be identified with the person• This applies to all aspects of data collection, analysis and reporting
• When reporting and communicating, ensure that no names or other identifying information is used
How many people do I need for the survey “to count?”
…it depends
• Go here to find “n”
RaoSoft Sample Size Calculator
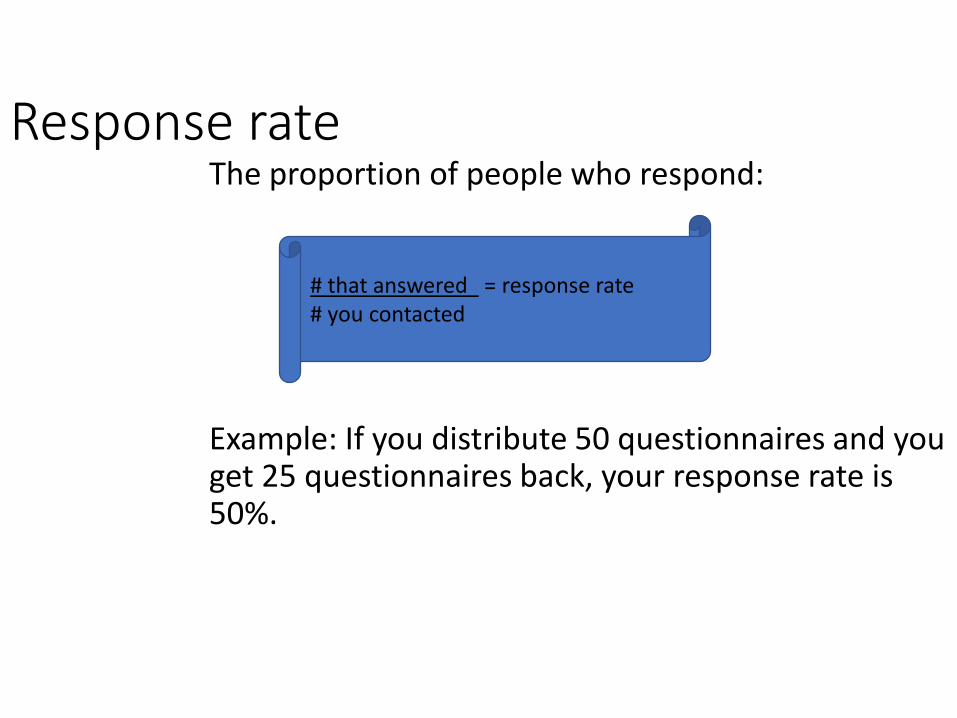
Response rateThe proportion of people who respond:
Example: If you distribute 50 questionnaires and you get 25 questionnaires back, your response rate is 50%.
# that answered = response rate# you contacted
Response rateHigh response rate promotes confidence in results.
Lower response rate increases the likelihood of biased results.
If your response is low, address it!
Determine how people who responded are different from those who didn’t respond.
Describe your results in terms of who did respond. Don’t imply that the results apply to anyone other than those who responded.
KEYS getting a high response rate
• The survey topic is of interest to the respondents
• Personalized request and communications related to the survey
• KISS: Keep It Short and Simple
• Follow-up
• Trust, respect, like the sponsor
Ways to increase response rate
• Generate positive publicity for your survey.
• Appeal to people’s helping tendencies – ask them to help.
• Make the topic salient - seem important• Ensure that respondents see the value of participating.
• Point out personal connection to the topic
• Tailor, personalize communications
• Make the questionnaire interesting-short and easy to complete AND easy to return
How to increase response rate • Provide incentives
• Show positive regard; Say thank you
• Indicate that opportunities to respond are limited
• Over sample
• Use a combination of survey modes – telephone plus mail
• Make (multiple) follow-up contacts – by mail, email, telephone, in person…
If response rate is low…
• Use language that is suggestive rather than decisive.
For example: “The data suggests” vs. “The data prove”; “It appears” vs. “It shows”
• Don’t generalize findings to the entire group.
• Clearly describe who responded, i.e., who the data represents.
Secondary Data
When we can learn from what others have already measured.
The neighborhood is a place where people choose to live
Indicator: Crime is reduced
What secondary sources can help me measure this?
Critique each data source
• Can you get it? (at what cost?)
• What’s the geographic boundary?
• How recent is it?
• Is the source reliable?
• Will it be consistent over time to show trends?
• What analysis will be performed?
OBSERVATION -– what can we learn from watching
What types of indicators can you OBSERVE?
Behaviors – home repair, maintenance, recycling participation, park usage, neighborhood pride, litter/trash
Physical changes in neighborhoods can be documented and trends assessed
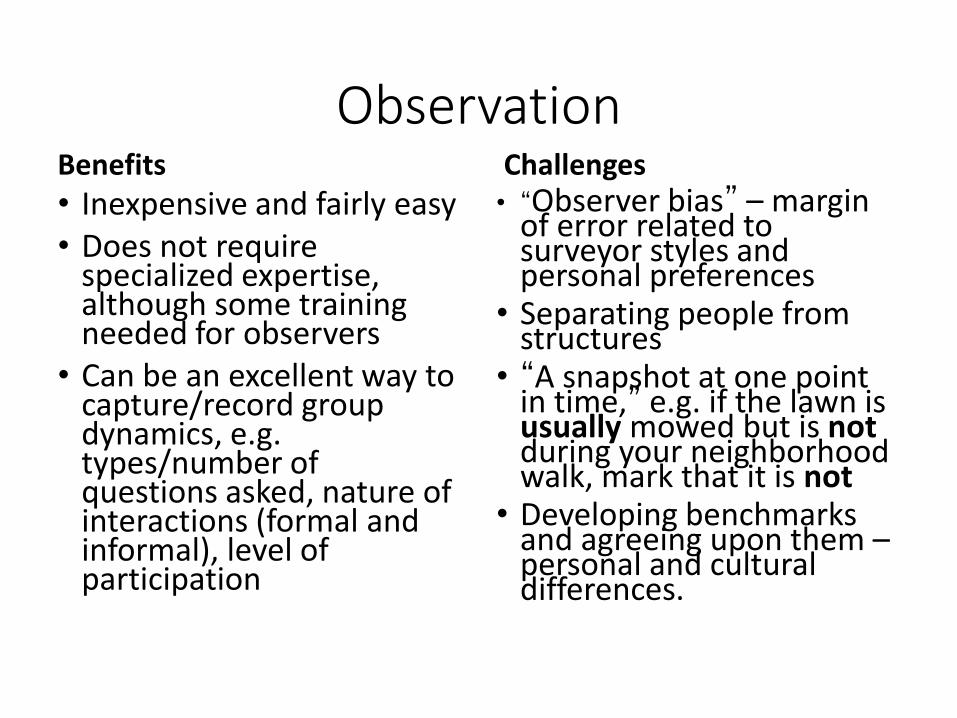
ObservationBenefits• Inexpensive and fairly easy• Does not require
specialized expertise, although some training needed for observers
• Can be an excellent way to capture/record group dynamics, e.g. types/number of questions asked, nature of interactions (formal and informal), level of participation
Challenges• “Observer bias” – margin
of error related to surveyor styles and personal preferences
• Separating people from structures
• “A snapshot at one point in time,” e.g. if the lawn is usually mowed but is notduring your neighborhood walk, mark that it is not
• Developing benchmarks and agreeing upon them –personal and cultural differences.
GETTING READY TO OBSERVE – PART 1
•Determine your focus. Why are we doing this?For example, tracking observations over time can demonstrate that neighborhood properties are showing improvement as a result of our efforts.
•Keep the survey instrument short and targeted to your focus
•Develop clear definitions and detailed standards
•Compared to what? e.g. comparison group, agreed upon design standards or rules, improvement over time based on initial survey
GETTING READY TO OBSERVE – PART 2•Train observers/surveyors – maximize consistency by communicating definitions and standards, practice with slides or in another neighborhood, compare results
•Consider the safety of both surveyors and residents.Identify observers/surveyors, e.g. special hat or t-shirt. Market when these volunteers will be in neighborhood and why.
GETTING READY TO OBSERVE – PART 3
•Build in overlap with multiple surveyors
•Determine frequency – how fast will change come?
More Observation Tips•Use technology – digital cameras, phone or smart phone cameras
•Try not to be judgmental or make values-based discussions
•Consider observation conditions:• The trash cans are curbside. Is it trash day? How close is it to trash day?
• No one is in the park. Is the weather conducive for outdoor play? What time of day is it, e.g. kids are in school?

Focus Groups and Interviews – what can we learn by
listening to conversations
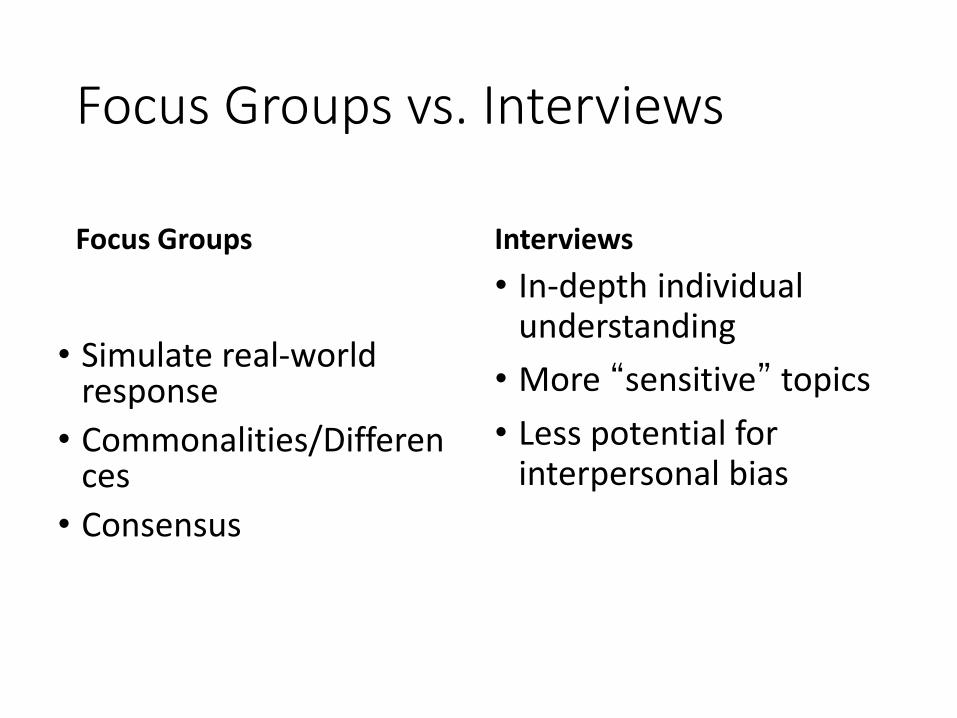
Focus Groups vs. Interviews
Focus Groups
• Simulate real-world response
• Commonalities/Differences
• Consensus
Interviews
• In-depth individual understanding
• More “sensitive” topics
• Less potential for interpersonal bias
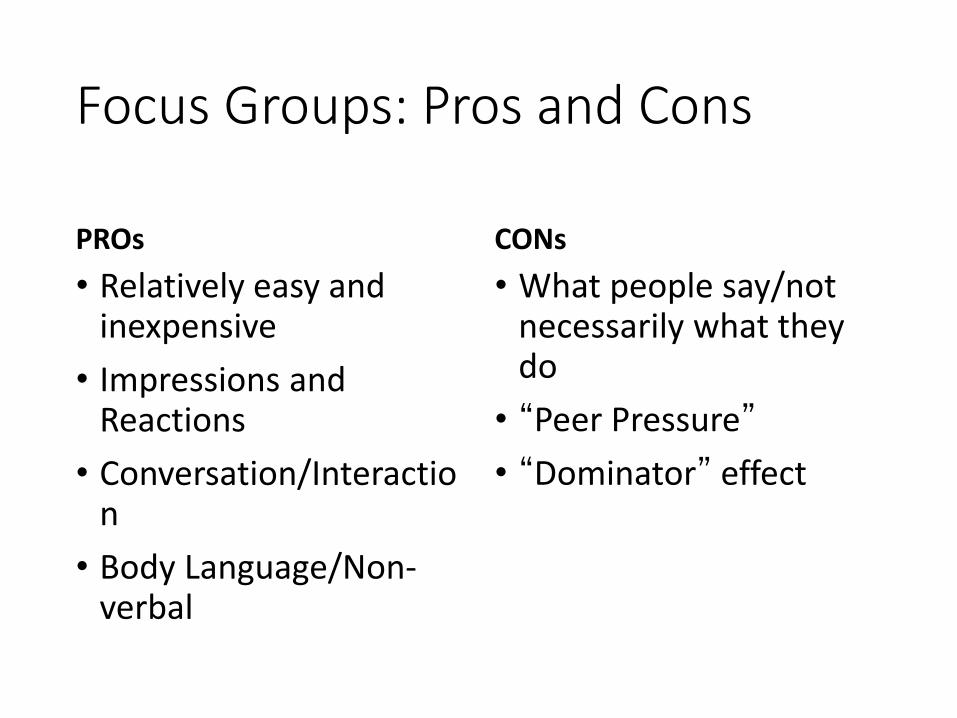
Focus Groups: Pros and Cons
PROs
• Relatively easy and inexpensive
• Impressions and Reactions
• Conversation/Interaction
• Body Language/Non-verbal
CONs
• What people say/not necessarily what they do
• “Peer Pressure”
• “Dominator” effect
Wording of Questions for Focus Groups and Interviews• Open-ended
• Neutral
• One at a time
• Worded carefully
• Be careful with “why” questions
Focus Groups: Before
• Define Purpose
• Establish Timeline
• Identify Participants
• Generate the Questions
• Develop Script
• Select Facilitator
• Choose Location
Focus Groups: During• Set tone
• Introductions
• Follow script; but allow for spontaneity
• Everyone speaks
• Full answers
• Monitor time
• Keep discussion on track
• No one or one topic should monopolize
Focus Groups: After
• Summarize each meeting
• Analyze the summaries
• Write the report
Types of Interviews
• Informal, conversational
• General interview guide approach
• Standardized, open-ended
• Closed, fixed-response
Interviews: Setting the stage and conducting• Setting with little
distractions
• Purpose clear
• Confidentiality
• Explain format
• Time commitment
• Any questions
• Ensure rapport is there
• Encourage responses
• Careful with note-taking
• Transition between topics
• Stay the course
• Thank participant
• Explain next steps
Planning your evaluation
• Plan. At the beginning.
• With participants.
• With community.
• With other stakeholders.
• With timeline, starting now.
• Including reflection and adjustment.
• Within resources.
Not everything that can be measured is important
and not everything important
can be measured.
- Albert Einstein