Embed Size (px)
Citation preview
D
II
o
o
D
0
o
o
o
Q
Do
D
o
u
u
u
I MINERAL RE O C S Pl NCH
ASSESSMfNT REPORT
TABLE OF CONTENTS
IQqq8SUMMARY
CONCLUSIONS ii
INTRODUCTION 1
PROPERTY AND OWNERSHIP 2
LOCATION AND ACCESS 2
PHYSIOGRAPHY 3
GEOLOGY 3
GEOPHYSICAL SURVEY 4
Instrumentation and Theory 4
a Magnetic Survey 4
b VLF EM Survey 4
c Induced Polarization Survey 5
Field Procedure and Reduction of Observations 8
a Magnetics 8
b VLF EM 9
c Induced Polarization 9
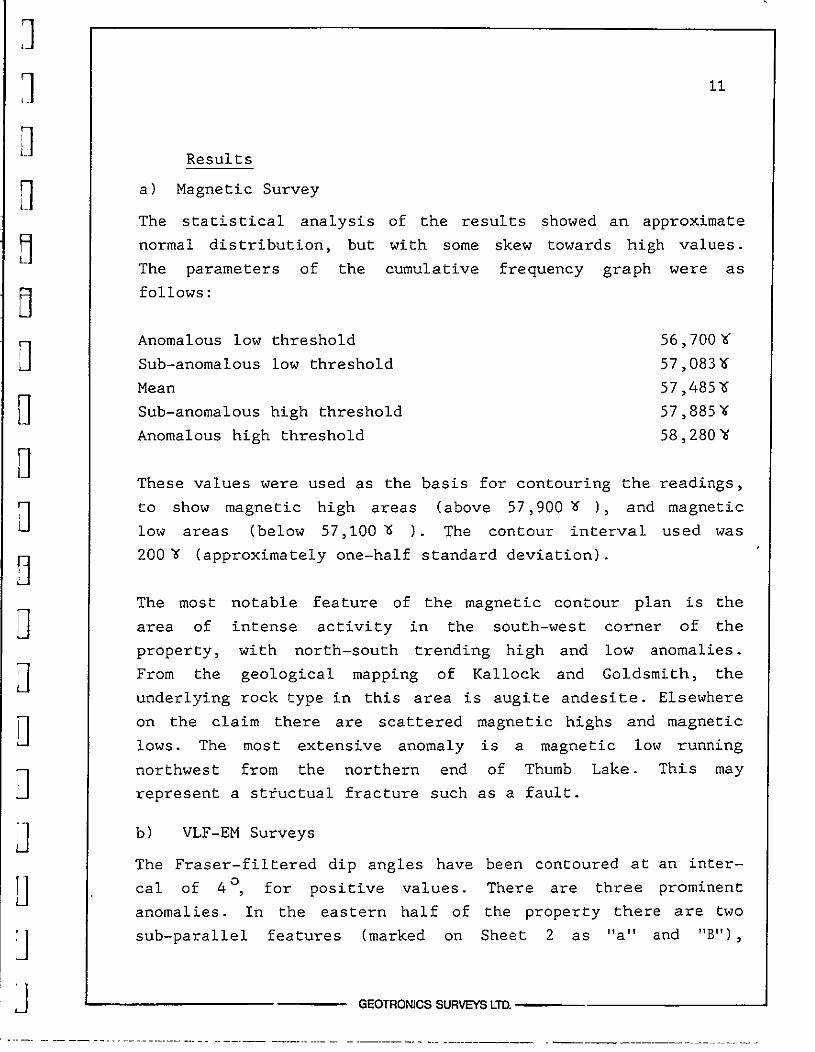
Resul ts 11
a Magnetic Survey 11
b VLF EM Survey 11
c Induced Polarization Survey 12
GEOCHEMICAL SURVEY 13
Survey Procedure 13
Laboratory Testing Procedure 13
Treatment of Data 13
Results 14
Copper14
Lead 14
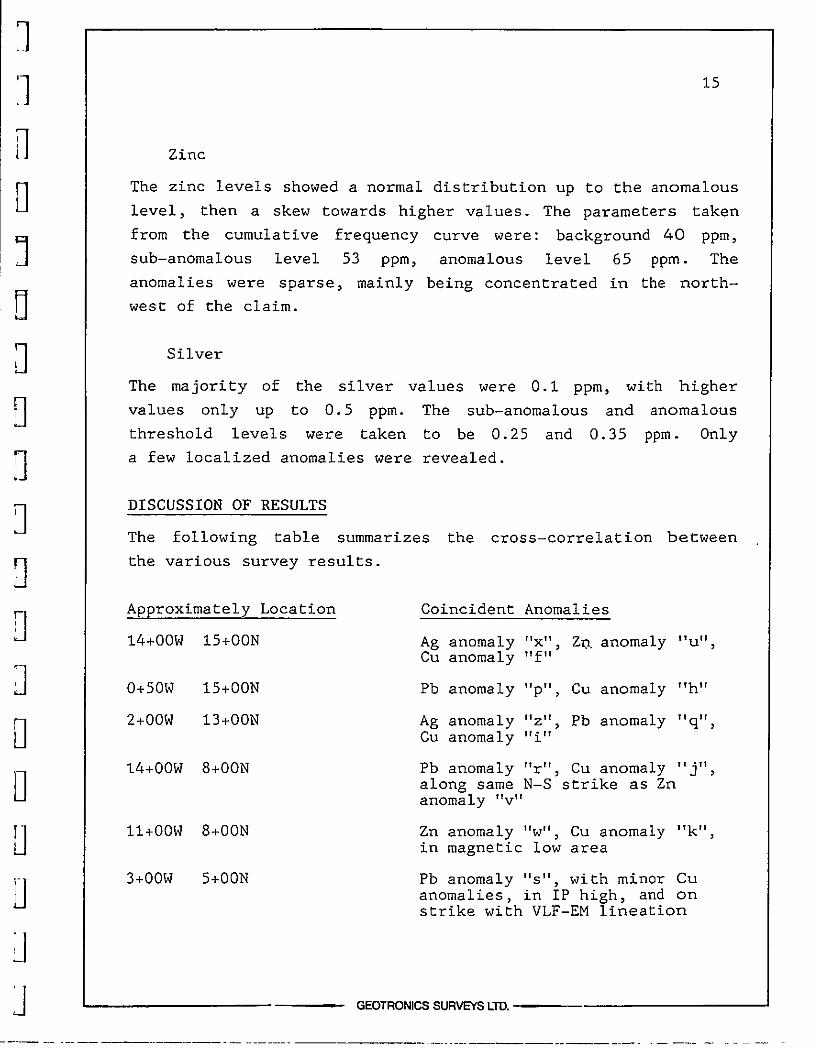
Zinc 15
Silver 15
DISCUSSION OF RESULTS 15
SELECTED BIBLIOGRAPHY 17
GEOPHYSICIST S CERTIFICATE 18
AFFIDAVIT OF EXPENSES 19
GEOTRONICS SURVEYS LID
1
l
D
D
D
0I
o
oJ
o
D
0I
1lu
D
o
oI jl
u
I
LIST OF ILLUSTRATIONS I
MAPS At back of report
Location Map 1 8 600 000
Claim Map 1 50 000
FIGURE
1
2
MAPS In Pockets SHEET
Magnetic SurveyData and Contours 1 2 500 1
VLF EM SurveyFraser Filtered
Dip angle 1 2 500 2
Induced Polarization SurveyChargeability for N 2 1 2 500 3
Induced Polarization SurveyApparent ResistivityData and Contours 1 2 500 4
Induced Polarization SurveyResistivityI P Pseudosections 1 2 500 5
1 2 500 6
1 2 500 7
1 2 500 8
1 2 500 9
1 2 500 10
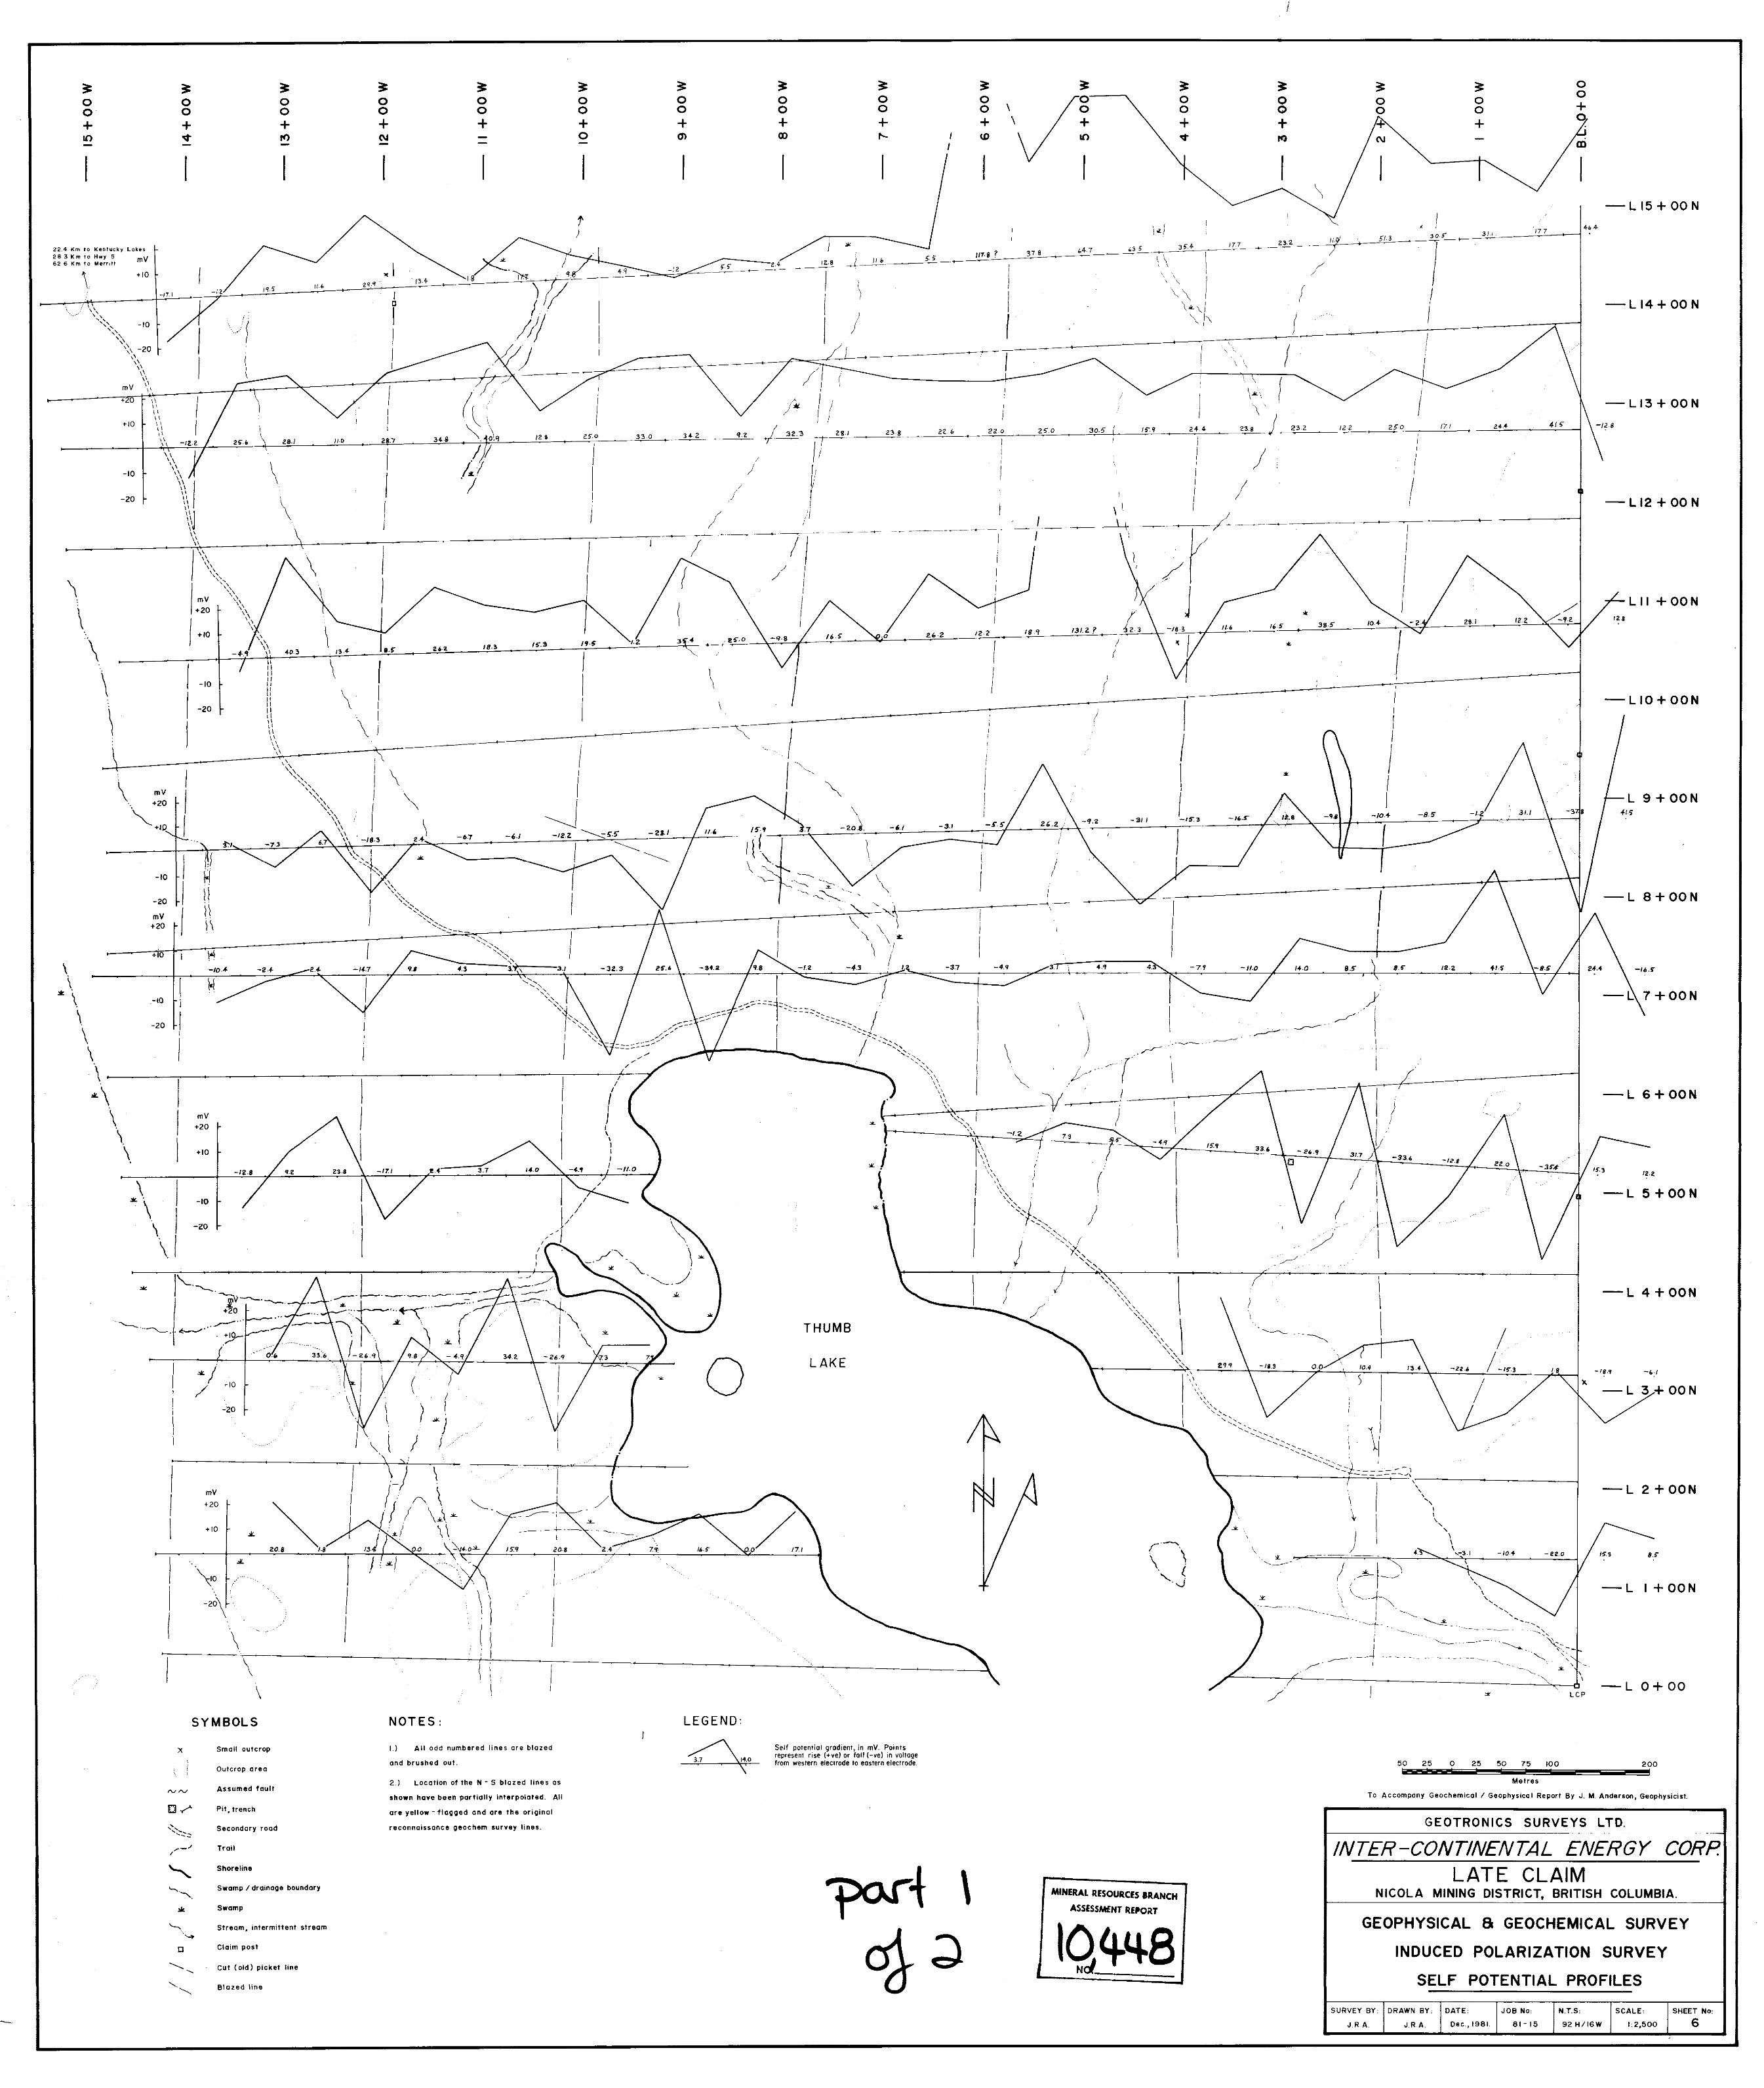
Induced Polarization SurveySelf Potential Profiles
Soil GeochemistryCopper Values
Soil GeochemistryLead Values
Soil GeochemistryZinc Values
Soil GeochemistrySilver Values
GEOTRONICS SURVEYS LTD
J
J
o
o
o
J
o
DIL
o
g
J
D
D
Uo
U
J
J
i
SUMMARY
During the summer of 1981 extensive geophysical and geochemical
programs were carried out on the Late Claim near Merritt
British Columbia An east west grid of 16 lines was established
on the property and magnetic and VLF EM readings taken these
were subsequently plotted and contoured An induced polarization
survey was carried out along every second line and plans pre
pared showing chargeability resistivity and self potential
Soil samples were collected at 25 m intervals along all the
survey lines and tested for copper lead zinc and silver
CONCLUSIONS
Lack of outcrop is a hindexance to both the use of geology
and geochemistry as prospecting tools on this property The
soil geochemistry anomalies revealed are consequently small
with the possible exception of copper and scattered The
magnetic survey revealed one area of steep field gradients
typical of underlying volcanic rocks with magnetite content
It is conceivable that the magnetic highs represent more
mineralized regions and the lows may be caused by alteration
however it is not justifiable to recommend drilling targets
on the magnetic data alone unless there are some coincident
GEOTRONICS SURVEYS LTD
J
l
J
J
D
Dl
J
D
Q
J
D
J
J
ii
anomalies from other surveys Similarly the VLF EM anomalies
although showing up some strong structural trends did not
correspond to other features
In their report Kallock and Goldsmith state No further
exploration of the property is recommended unless strongly
anomalous zones are detected with recent geochemical and geo
physical surveys It is considered that strong anomalies
have not been revealed however if further exploration is
to be carried out it is recommended that drilling be used
to investigate the IP anomaly on line S OON anomaly d
Trenching could be useful in revealing the cause of the VLF
EM anomalies Further geophysics on the claim should not be
employed unless positive results are obtained from the drilling
of the IP feature
GEOTRONICS SURVEYS LID
w

J
J
J
o
B
o
o
fJo
Dnu
D
U
o
J
ud
GEOPHYSICAL GEOCHEMICAL REPORT
ON
MAGNETIC VLF EM INDUCED POLARIZATION
AND SOIL GEOCHEMISTRY SURVEYS
OVER THE
LATE MINERAL CLAIM
MERRITT AREA
NICOLA MINING DIVISION
BRITISH COLUMBIA
INTRODUCTION
This report discusses the theory instrumentation field pro
cedure and results of magnetic VLF EM induced polarizationIP and soil geochemistry surveys carried out over the Late
Claim near Merritt British Columbia The field work was com
pleted in various phases within the period May 12th to October
20th 1981
Outcropping Triassic volcanics on the claim contain patches of
disseminated chalcopyrite and chalcocite the aim of the geo
chemical and geophysical work was to detect surface and depth
expressions respecti vely of any significant base metal
mineralization on the property The use of geophysics and
geochemistry was recommended by Kelly 1980 in his geological
report on the property
A survey grid of 16 east west lines at a nominal spacing of
GEOTRONICS SURVEYS LTD
J
1
J
o
nD
Jo
o
D
o
D
o
D
Df1
J
2
100 m was laid out over the property Magnetic and VLF EM
readings and soil samples were then taken at 25 m intervals
along these lines The IP survey was carried out on every
second line using a pole dipole array and taking readingsat up to five levels
The magnetic and VLF EM results have been presented as
plans the IP results are presented as four drawings
ability for n 2 apparent resistivity for n 2
sections and a plan of the self potential gradientsoil samples were analyzed for copper lead zinc and
and the values plotted and contoured
contour
charge
pseudothe 851
silver
PROPERTY AND OWNERSHIP
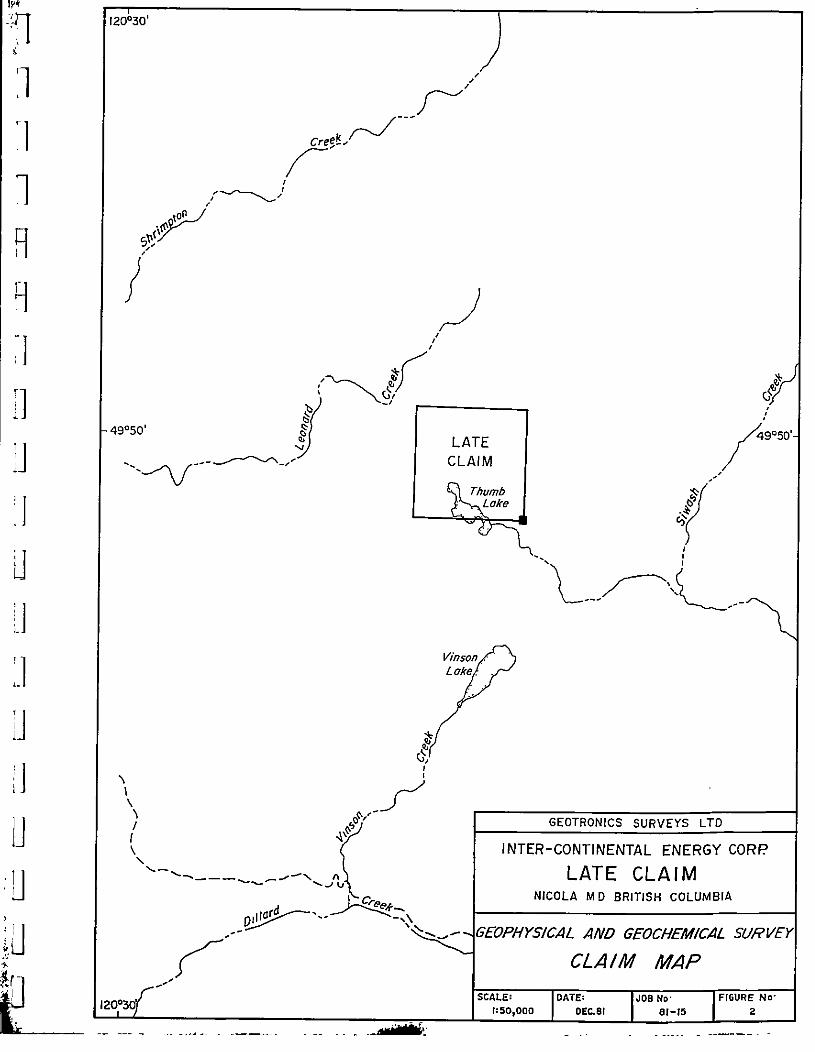
The Late Claim comprises 9 units as shown in Figure 2 and
described below
CLAIM NAME RECORD NO EXPIRY DATE
May 23 1982
NO OF UNITS
Late 9 623 5
The property is wholly owned by Inter Continental Energy Corp
oration of Vancouver British Columbia
LOCATION AND ACCESS
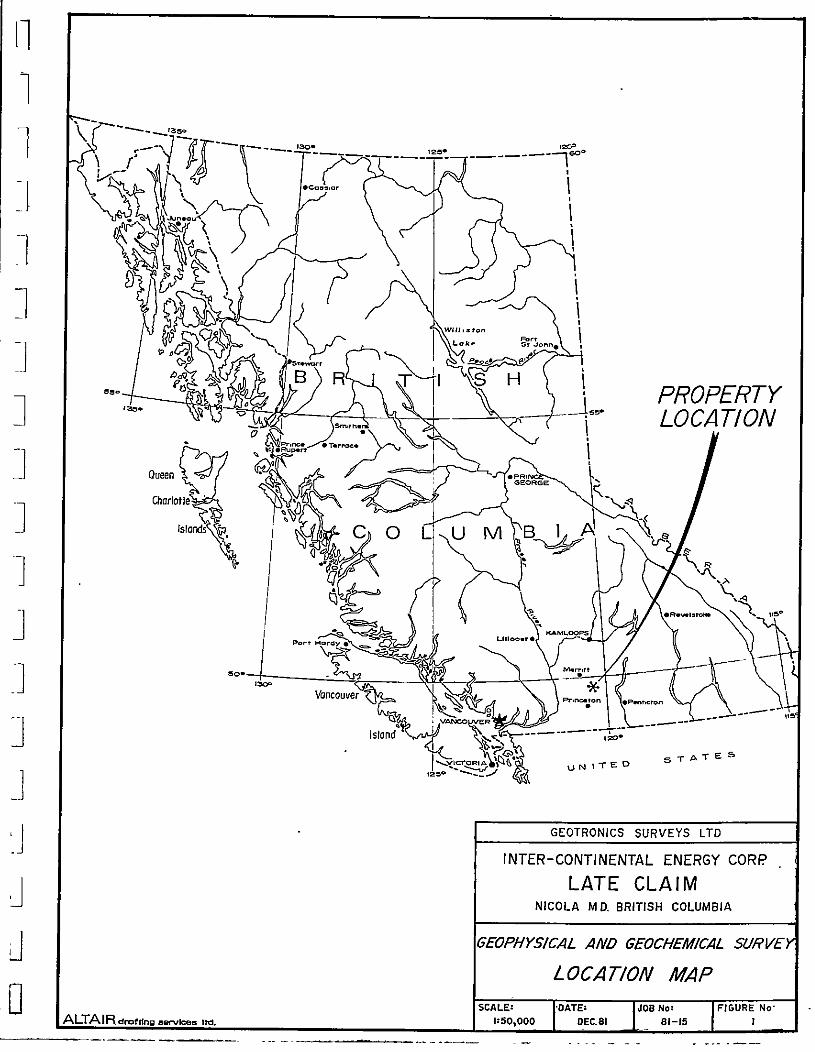
The property is located 41 km southeast of Merritt B C at
geographical coordinates 490 49 N 1200 26 W Access is
gained by turning off the Merritt Princeton road Highway 5
4 1 2 km south of Aspen Grove gravel and dirt roads then
lead through Kentucky Lakes 28 km to the claim A dirt track
runs diagonally across the property
GEOTRONICS SURVEYS LTD
J
1
rJ
o
B
oD
o
D
o
L
D
D
J
o
D
J
J
3
PHYSIOGRAPHY
The claim lies on the Thompson Plateau just to the east of
the Cascade Mountains part of the Coast Mountains of the
Canadian Cordillera Total elevation on the property which
is mostly covered by coniferous forest is about 150 m from
1 350 to 1 500 m a s l Thumb Lake which lies partly vlithin
the claim is at an elevation of approximately 1 357 m
GEOLOGY
Although the property is mostly covered by glacial depositsor the waters of Thumb Lake the underlying rock type is
believed to be Upper Triassic volcanic flows and breccias
of the Nicola Group This rock unit in some areas is host
to economic ore deposits copper in particular usually in
association with granodiorite intrusives
vicinity of
Late Claim
In his summary of previous exploration in the
the claims Kelly 1980 hypothesized that the
lay on the eastern limb of a major north trendingand that Thumb Lake marked a WNW trending shear
may have served as a conduit for mineralizing
emanating from granodiorite intrusions to the east
gave rise to metallogenic zoning away from Thumb
copper deposition near the lake then silver to
east and zinc to the northwest
synclinezone which
solutions
This then
Lake with
the north
Kallock and Goldsmith 1981 found neither contradictory nor
confirmatory evidence for these theories They mapped andesite
and andesite breccia to the north and east of Thumb Lake
and augite andesite to the southwest Several dykes were noted
ranging in composition from daci tic to diori tic One north
east trending shear zone vIas observed near the prospect pit
GEOTRONICS SURVEYS LID
J
J
1u
U
EJ
D
o
D
D
o
D
o
D
of
L
J
J
U
4
and calcite venation implied mainly north south planes of
weakness
GEOPHYSICAL SURVEY
Instrumentation and Theory
al Magnetic Survey
The magnetic survey was carried out with a model MP 2 proton
precession magnetometer manufactured by Scintrex Limited
of Concord Ontario This instrument reads out directly in
gammas to an accuracy of 1 gamma over a range of 20 000
100 0006 The operating temperature range is 350 to 500
C and its gradient tolerance is up to 5 000j per meter
Only two commonly occurring minerals are strongly magnetic
magnetite and pyrrhotite magnetic surveys are therefore used
to detect the presence of these minerals in varying concen
trations Magnetics is also useful as a reconnaissance tool
for mapping geologic lithology and structure since different
rock types have different background amounts of magnetiteand or pyrrhotite
bl VLF EM Survey
The Sabre Instruments Ltd model
transmittingfield
27 VLF EM receiver was
station to take readingstuned
of the
to the Seattle
dip angle of the
In all electromagnetic prospecting a transmitter producesan alternating magnetic field primary by passing a strong
alternating current usually through a coil of wire If a con
ductive mass such as a sulphide body is within this magneticfield a secondary alternating electric current is induced
GEOTRONICS SURVEYS LTD
J
J
o
o
J
D
o
D
o
o
0
o
o
J
J
5
within it which in turn induces
that distorts the primary field
is measured by the VLF EM receiver
a secondary magnetic field
It is this distortion that
Most EM instruments employ frequencies ranging from a few
hundred to a few thousand Hertz The VLF EM method uses a
frequency range from 16 to 24 KHz and is therefore more sen
sitive to bodies of lower conductivity VLF E l anomalies are
therefore often caused by one or more of the following electro
lyte filled fault or shear zones clay beds porous horizons
carbonaceous sediments e g graphitic relatively low con
ductivity sulphide bodies and lithological contacts The precise
cause of an anomaly is consequently difficult to determine
and VLF EM surveys preferable should not be interpreted without
a good geological knowledge of the property and or the assist
ance of other geopnysical and geochemical surveys
A survey line crossing a buried conductor will record dip
angle values that are negative upward dipping before the
conductor and positive after it as the magnetic component
of the field is deflected up over the body The inflection
point zero crossing on the profile should lie directly over
the causative body
c Induced Polarization Survey
The induced polarization transmitter was a Phoenix Instruments
model IPT 1 powered by a MG 2 60 Briggs Stratton generatorThe transmitter current varied from 0 75 to 2 2A The receiver
was a Huntec Mark IV operating in
is state of the art equipmentfunctions programmeable through the
the time domain mode This
with software controlled
front panel
GEOTRONICS SURVEYS LID
J
J
U
o
D
D
D01
01L
o
o
J
oD
o
o
J
J
6
Following current switch off a delay time of 300
introduced before the voltage decay curve was sampled65 ms wide windows The instrument readout was the
ability
ms was
by ten
charge
The theory of the induced polarization effect is as follows
When a voltage is applied to the ground electric current
flows mainly in the electrolyte filled capillaries in the
rock If the capillaries also contain certain mineral particlesthat transport current by electrons most sulphides some
oxides and graphi te then the ionic charges build up at the
particle electrolyte interface positive ones where the current
enters the particle and negative ones where it leaves This
accumulation of charge creates a voltage that tends to oppose
the current flow across the interface When the current is
switched off the created voltage slowly decreases as the
accumulated ions diffuse back into the electrolyte This type
of induced polarization phenomenon is known as electrode polarization
A similar effect occurs if clay particles are pr sent in the
conducting medium Charged clay particles attract oppositely
charged ions from the surrounding electrolyte when the current
stops the ions slowly diffuse back to their equilibruim state
This process is known as membrane polar ization and gives rise
to induced polarization effects even in the absense of metallic
type conductors
Most IP surveys
the time domain
are carried out by takingor the frequency domain
inmeasurements
GEOTRONICS SURVEYS LID
J
l
J
D
D
D
o
7
CURRENT
TIME
r ITransmitted Waveform
VOLTAGE
VOLTAGE DECAY
TIME
Recorded Voltage
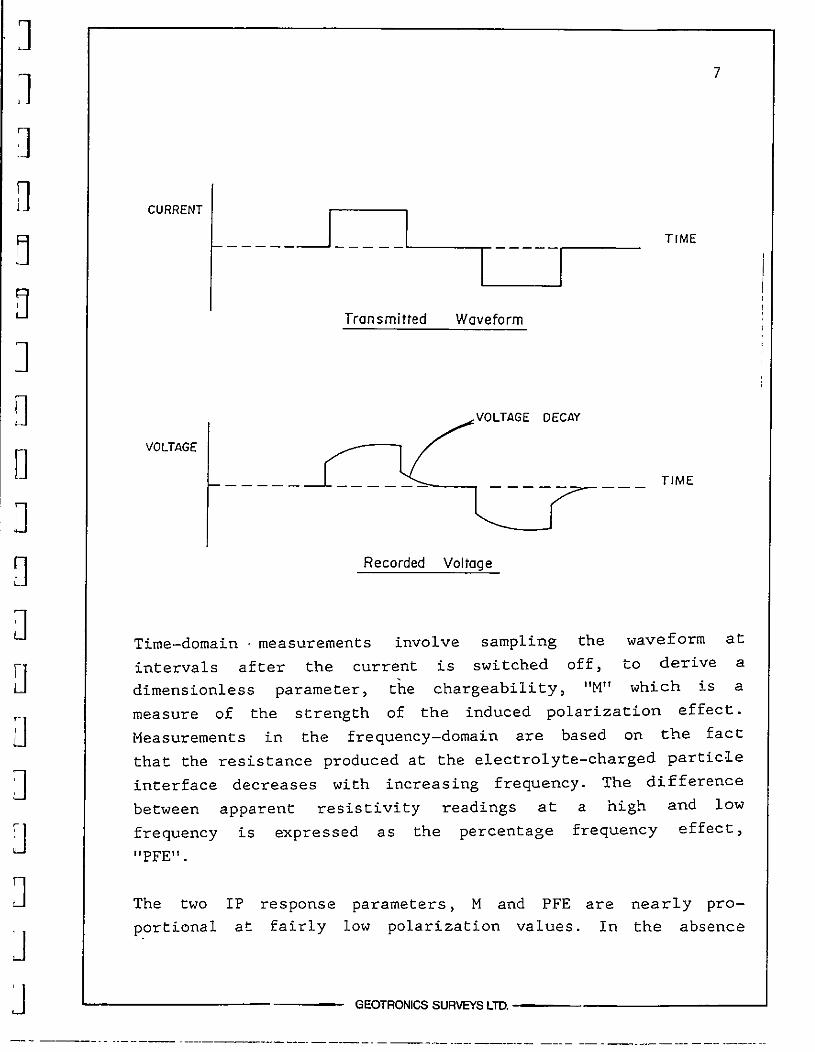
DTime domain measurements involve sampling the waveform at
intervals after the current is switched off to derive a
dimensionless parameter the chargeabili ty M which is a
measure of the strength of the induced polarization effect
Measurements in the frequency domain are based on the fact
that the resistance produced at the electrolyte charged particleinterface decreases with increasing frequency The difference
between apparent resistivity readings at a high and low
frequency is expressed as the percentage frequency effect
PFE
D
U
J
J
J
J
The two
portional
IP
at
response
fairlyparameters M and PFE are
low polarization values In
nearly pro
the absence
GEOTRONICS SURVEYS LID
1
l
1
8
D
of large membrane
may indicate the
ization
polarization
presence of
effects high M or PFE values
disseminated sulphide mineral
n
In the process of carrying out an IP survey two other sets
of readings are taken these are resistivity and self potentialliSP The resistivity is a measure of how well the groundconducts electricity and depends mainly on saturation and
the ionic and clay particle content of the pore waters
o
DThe self potential effect is believed to be caused by the
vertical gradient in Eh oxidation potential usually presentin the ground Any strong conductor e g metallic sulphidesor graphite especially if it intersects the water table
will provide a medium for electron transfer from deeper layersto the surface The current circuit is completed by ionic
conduction through pore water surrounding the conductor The
surface manifestation of this phenomenon is a negative potentialabove the conductor this is generally of the order 100 700
mV although higher values have been reported The overall
ground potential pattern may be complicated by the topographiceffect increasing negative values going up hill the effect
of telluric currents and contact voltages between pots and
ground in different moisture conditions Nevertheless the
D
D
Q
J
D
U
D
presence of sizeable groundof massive deposits of such
chalcopyrite chalcocite
pyrolusite and psilomelane
potentialsmaterials as
is a oodo
indicator
pyrite pyrrhotiteanthracitecovellite graphite
Field Procedure and Reduction of Observations
0Ia Magnetics
Readings of the earth s total field were taken at 25 m intervals
fIL
U GEOTRONICS SURVEYS LID
J
1
n
o
D
o
D
o
D
D
D
D
D
D
J
J
9
along the 16 east west lines 100 m apart The diurnal variation
was monitored in the field by the closed loop method to enable
the variation to be removed from the raw data prior to plotting
A statistical analysis of the magnetic readings was carried
out by grouping the readings into 100 intervals then plottinga cumulative frequency graph The resulting distribution
was used to choose the threshold values for defining magnetichigh and magnetic low areas on the contour plan
b VLF EM
Dip angle readings were taken at 25 m intervals along the
survey lines
To permit easy contouring a numerical filter the Fraser
filter was then applied to the resul ts This is a 4 pointdifference operator that reduces the inherent high frequencynoise in the data and phase shifts the readings such that
a zero crossing becomes a peak i e a high positive value
Anomaly flanks become negative values when filtered and
these are therefore ignored when contouring
c Induced Polarization
The pole dipole electrical configuration was used for the
work In this array one of the current electrodes is deployeda long distance from the other three electrodes so that it
has a negligible effect on the voltage recorded at the potentialelectrodes For this survey the fixed current electrode was
located at the western end of each line
The two potential electrodes were kept 50 m apart and readings
taken at 50 m intervals along every second survey line with
GEOTRONICS SURVEYS LID
0 p
1
1
1
J
J
o
J
L1
D
J
DD
J
J
J
J
10
the mobile current electrode 100 m from the potential dipole
i e n 2 When anomalous values were recorded usuallyM 3 further readings were taken at different levels
for n values of 1 3 4 and sometimes 5
Stainless
potentialsulphate
pots
were used for current electrodes The
compri sed metall ic copper in copper
in non polarizing unglazed porcelain
steel stakes
electrodes
solution
The chargeability values are read directly from the instrument
and no data processing is therefore required prior to plotting
The resistivity values are derived from current and voltage
readings taken in the field These values are combined wi th
the geometrical factor appropriate for the pole dipole array
to co pute the apparent resistivities The self potential
readings are obtained directly from the instrument The positiveterminal was connected to the eastern potential pot so a
positive reading represents an increase in potential from
west to east
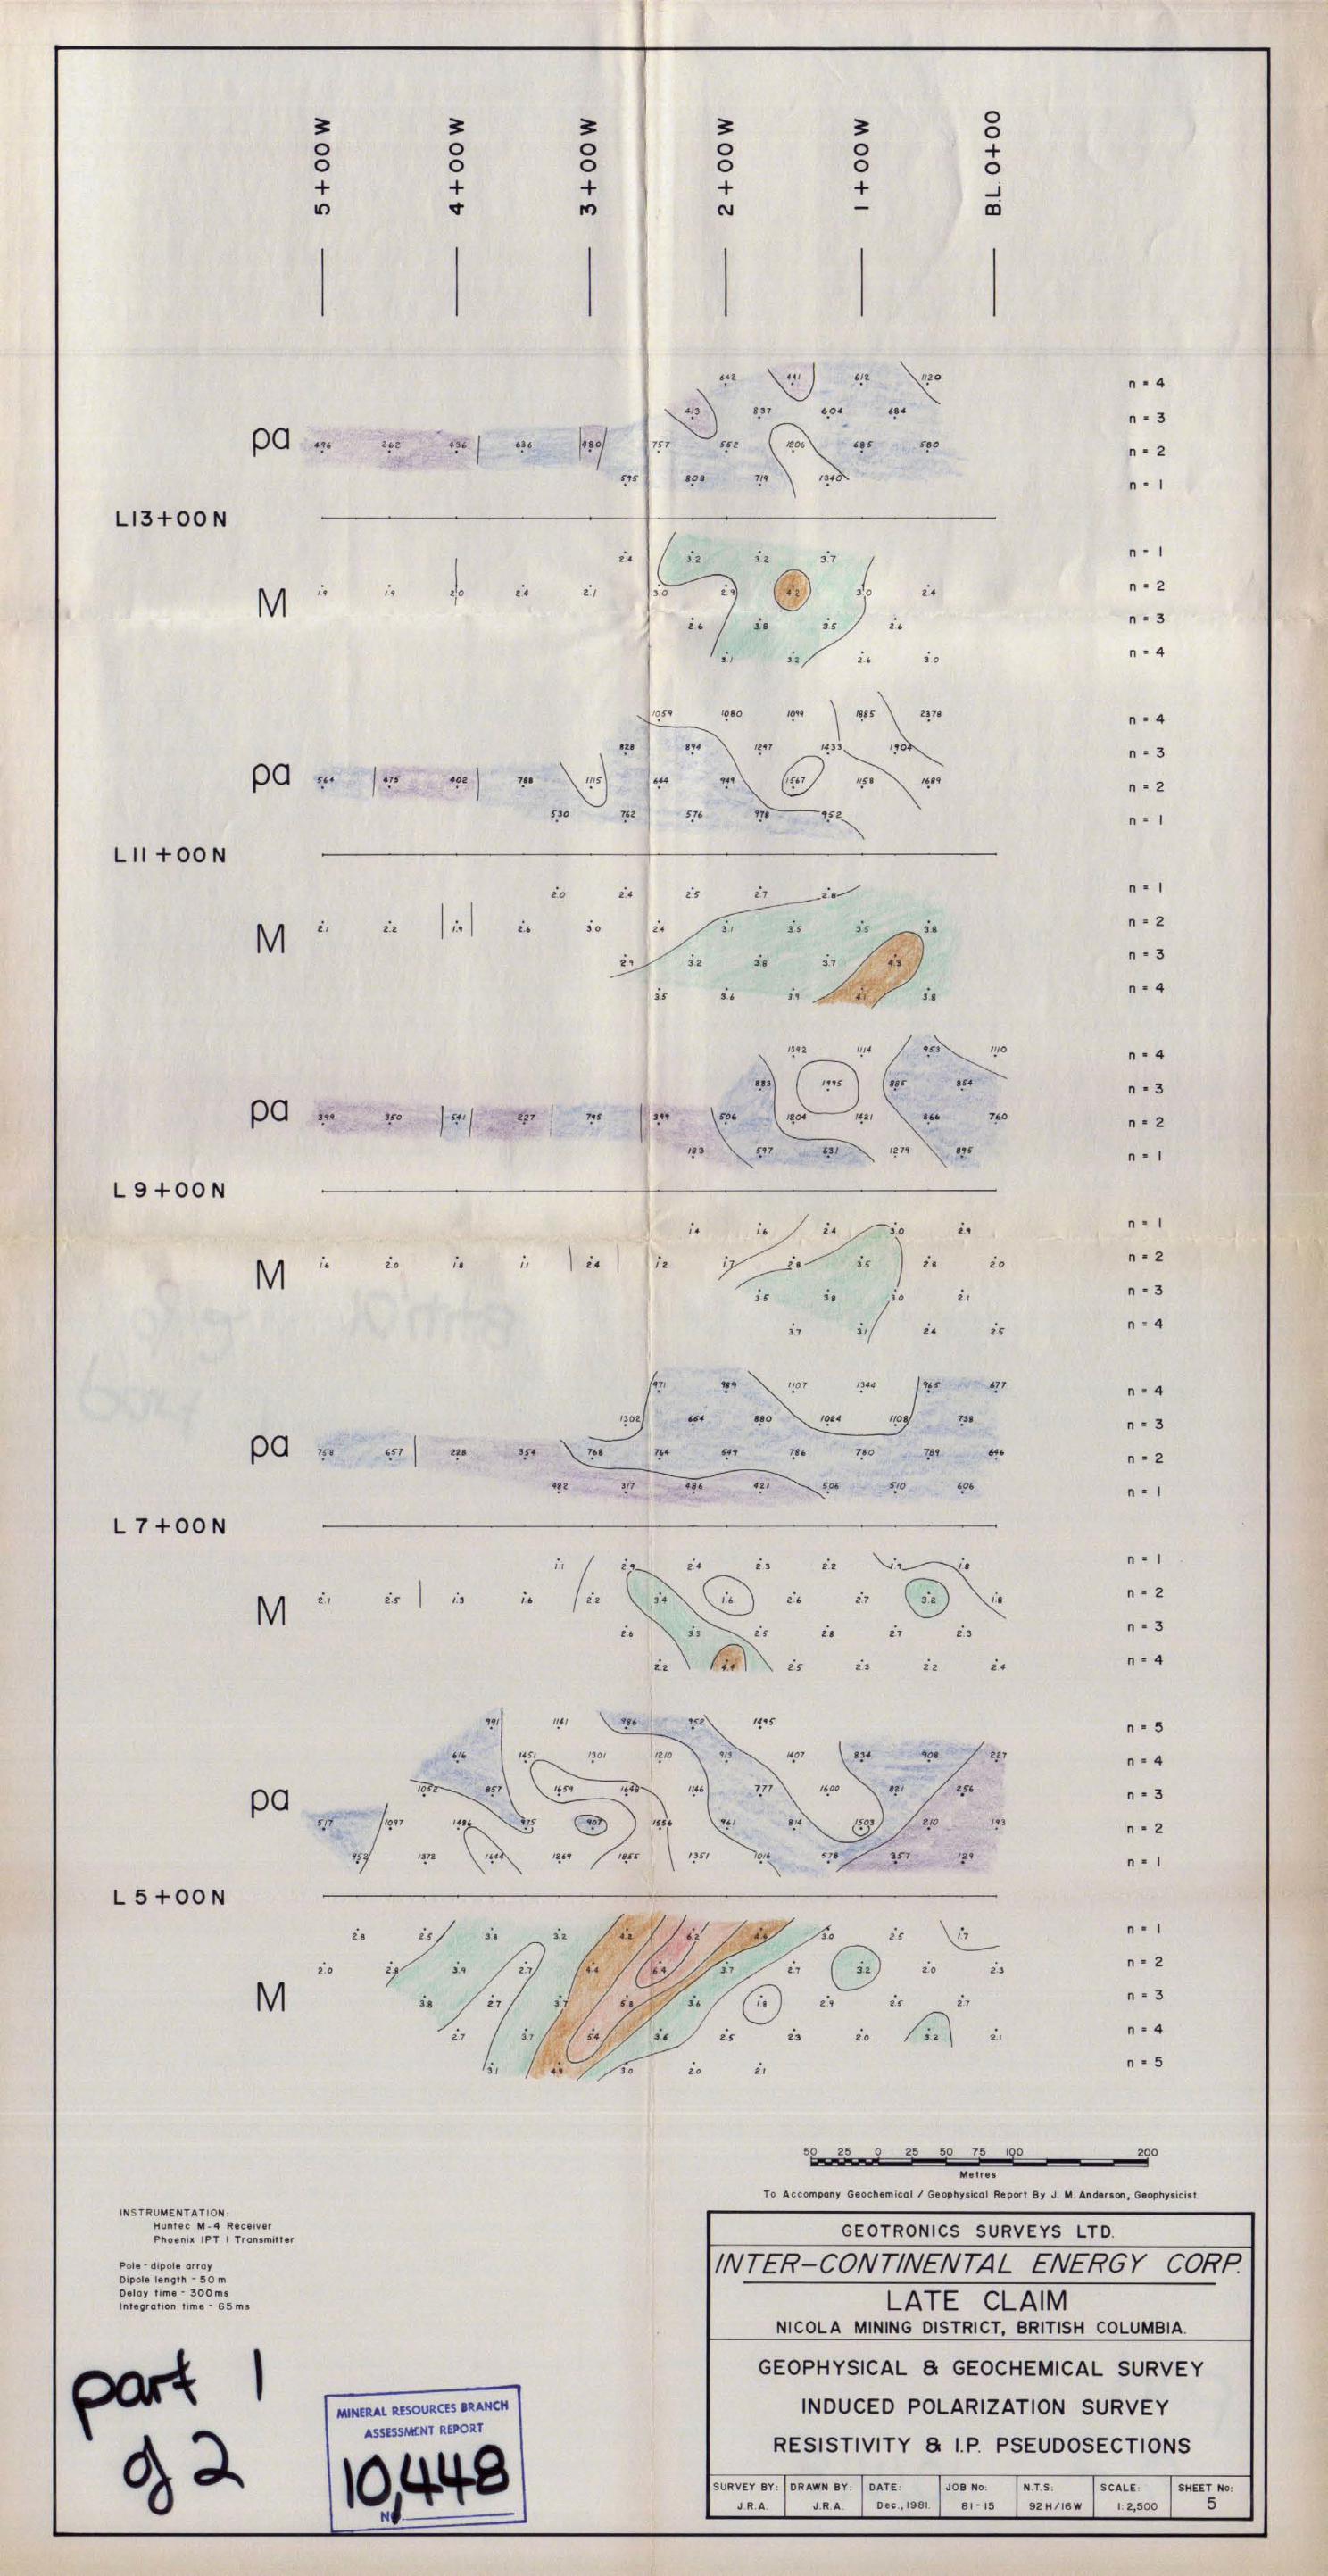
The geophysical data has been presented in two forms The
chargeability and resistivity results for n 2 are shown
in plan form on Sheets 3 and 4 with the values being plotted
half way between the mobile current electrode and the nearer
potential pot The self potential gradient is plotted at the
mid point of the two potential electrodes Sheet 6 An alter
native presentation of multi level IP and resistivity results
is the pseudo section where the figures are plotted at the
intersection of lines drawn from a horizontal datum at 450
from the current electrode and the nearer potential electrode
The IP values are plotted belol the line and the resistivity
values as a mirror image above the line Sheet 5
GEOTRONICS SURVEYS LID
J
J
D
o
B
o
o
o
u
o
J
D
D
J
U
J
J
11
Results
a Magnetic Survey
The statistical analysisnormal distribution but
The parameters of the
follows
of the results showed an approximatewith some skew towards high values
cumulative frequency graph were as
Anomalous low threshold
Sub anomalous low threshold
Mean
Sub anomalous high threshold
Anomalous high threshold
56 700 6
57 0836
57 4856
57 885
58 280 ll
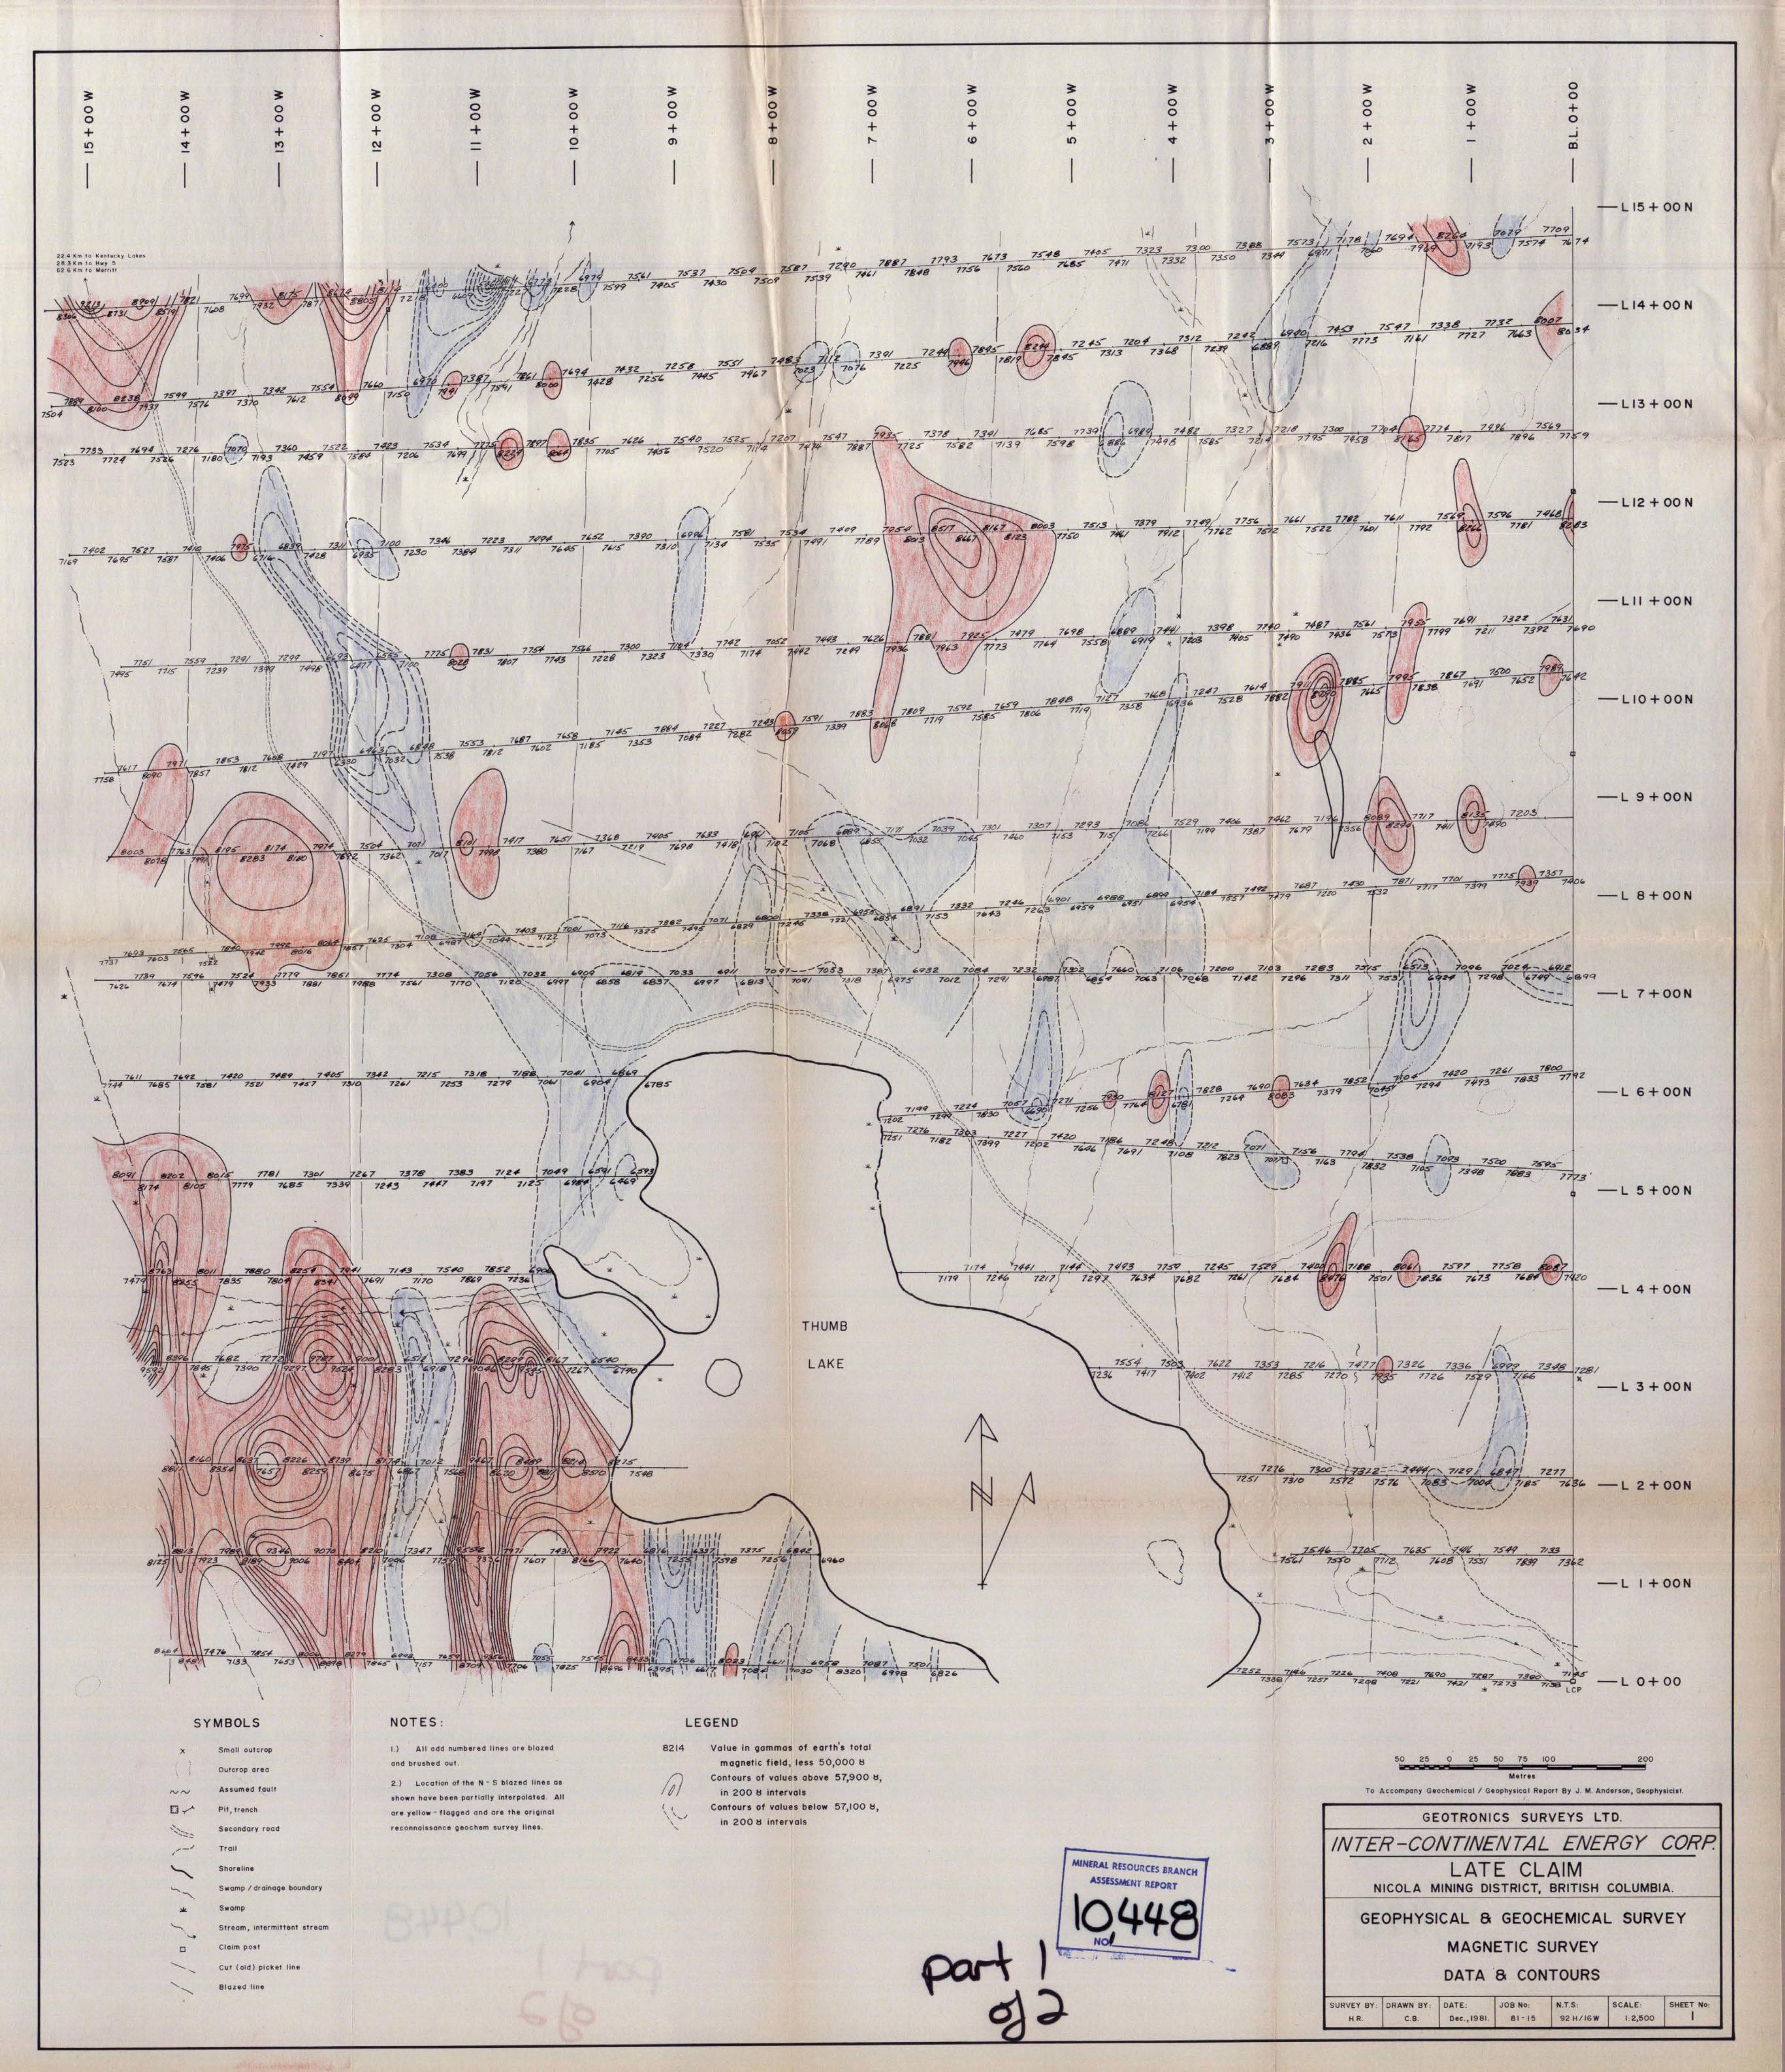
These values were used as the basis for contouring the readingsto show magnetic high areas above 57 900 6 and magneticlow areas below 57 1006 The contour interval used was
200 approximately one half standard deviation
The most notable feature of the magnetic contour plan is the
area of intense activity in the south west corner of the
property with north south trending high and low anomalies
From the geological mapping of Kallock and Goldsmith the
underlying rock type in this area is augite andesite Elsewhere
on the claim there are scattered magnetic highs and magneticlows The most extensive anomaly is a magnetic low runningnorthwest from the northern end of Thumb Lake This may
represent a structual fracture such as a fault
b VLF EM Surveys
The Fraser filtered dip angles have
cal of 40 for positive values
anomalies In the eastern half of
sub parallel features marked on
been contoured at an inter
There are three prominentthe property there are two
Sheet 2 as a and B
GEOTRONICS SURVEYS LTD
J
l
J
1
o
o
o
o
1
o
J
LJ
D
U
D
J
J
J
12
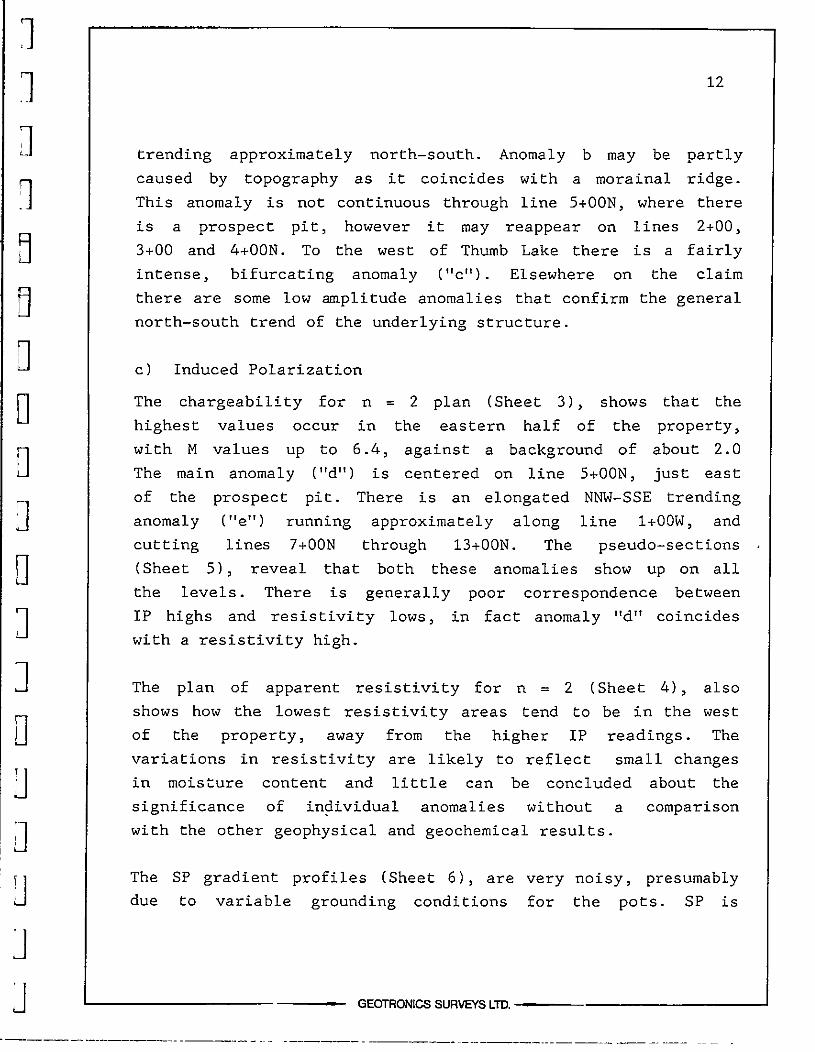
trending approximately north south Anomaly b may be partlycaused by topography as it coincides wi th a morainal ridgeThis anomaly is not continuous through line S OON where there
is a prospect pit however it may reappear on lines 2 00
3 00 and 4 00N To the west of Thumb Lake there is a fairlyintense bifurcating anomaly C Elsewhere on the claim
there are some low amplitude anomalies that confirm the generalnorth south trend of the underlying structure
c Induced Polarization
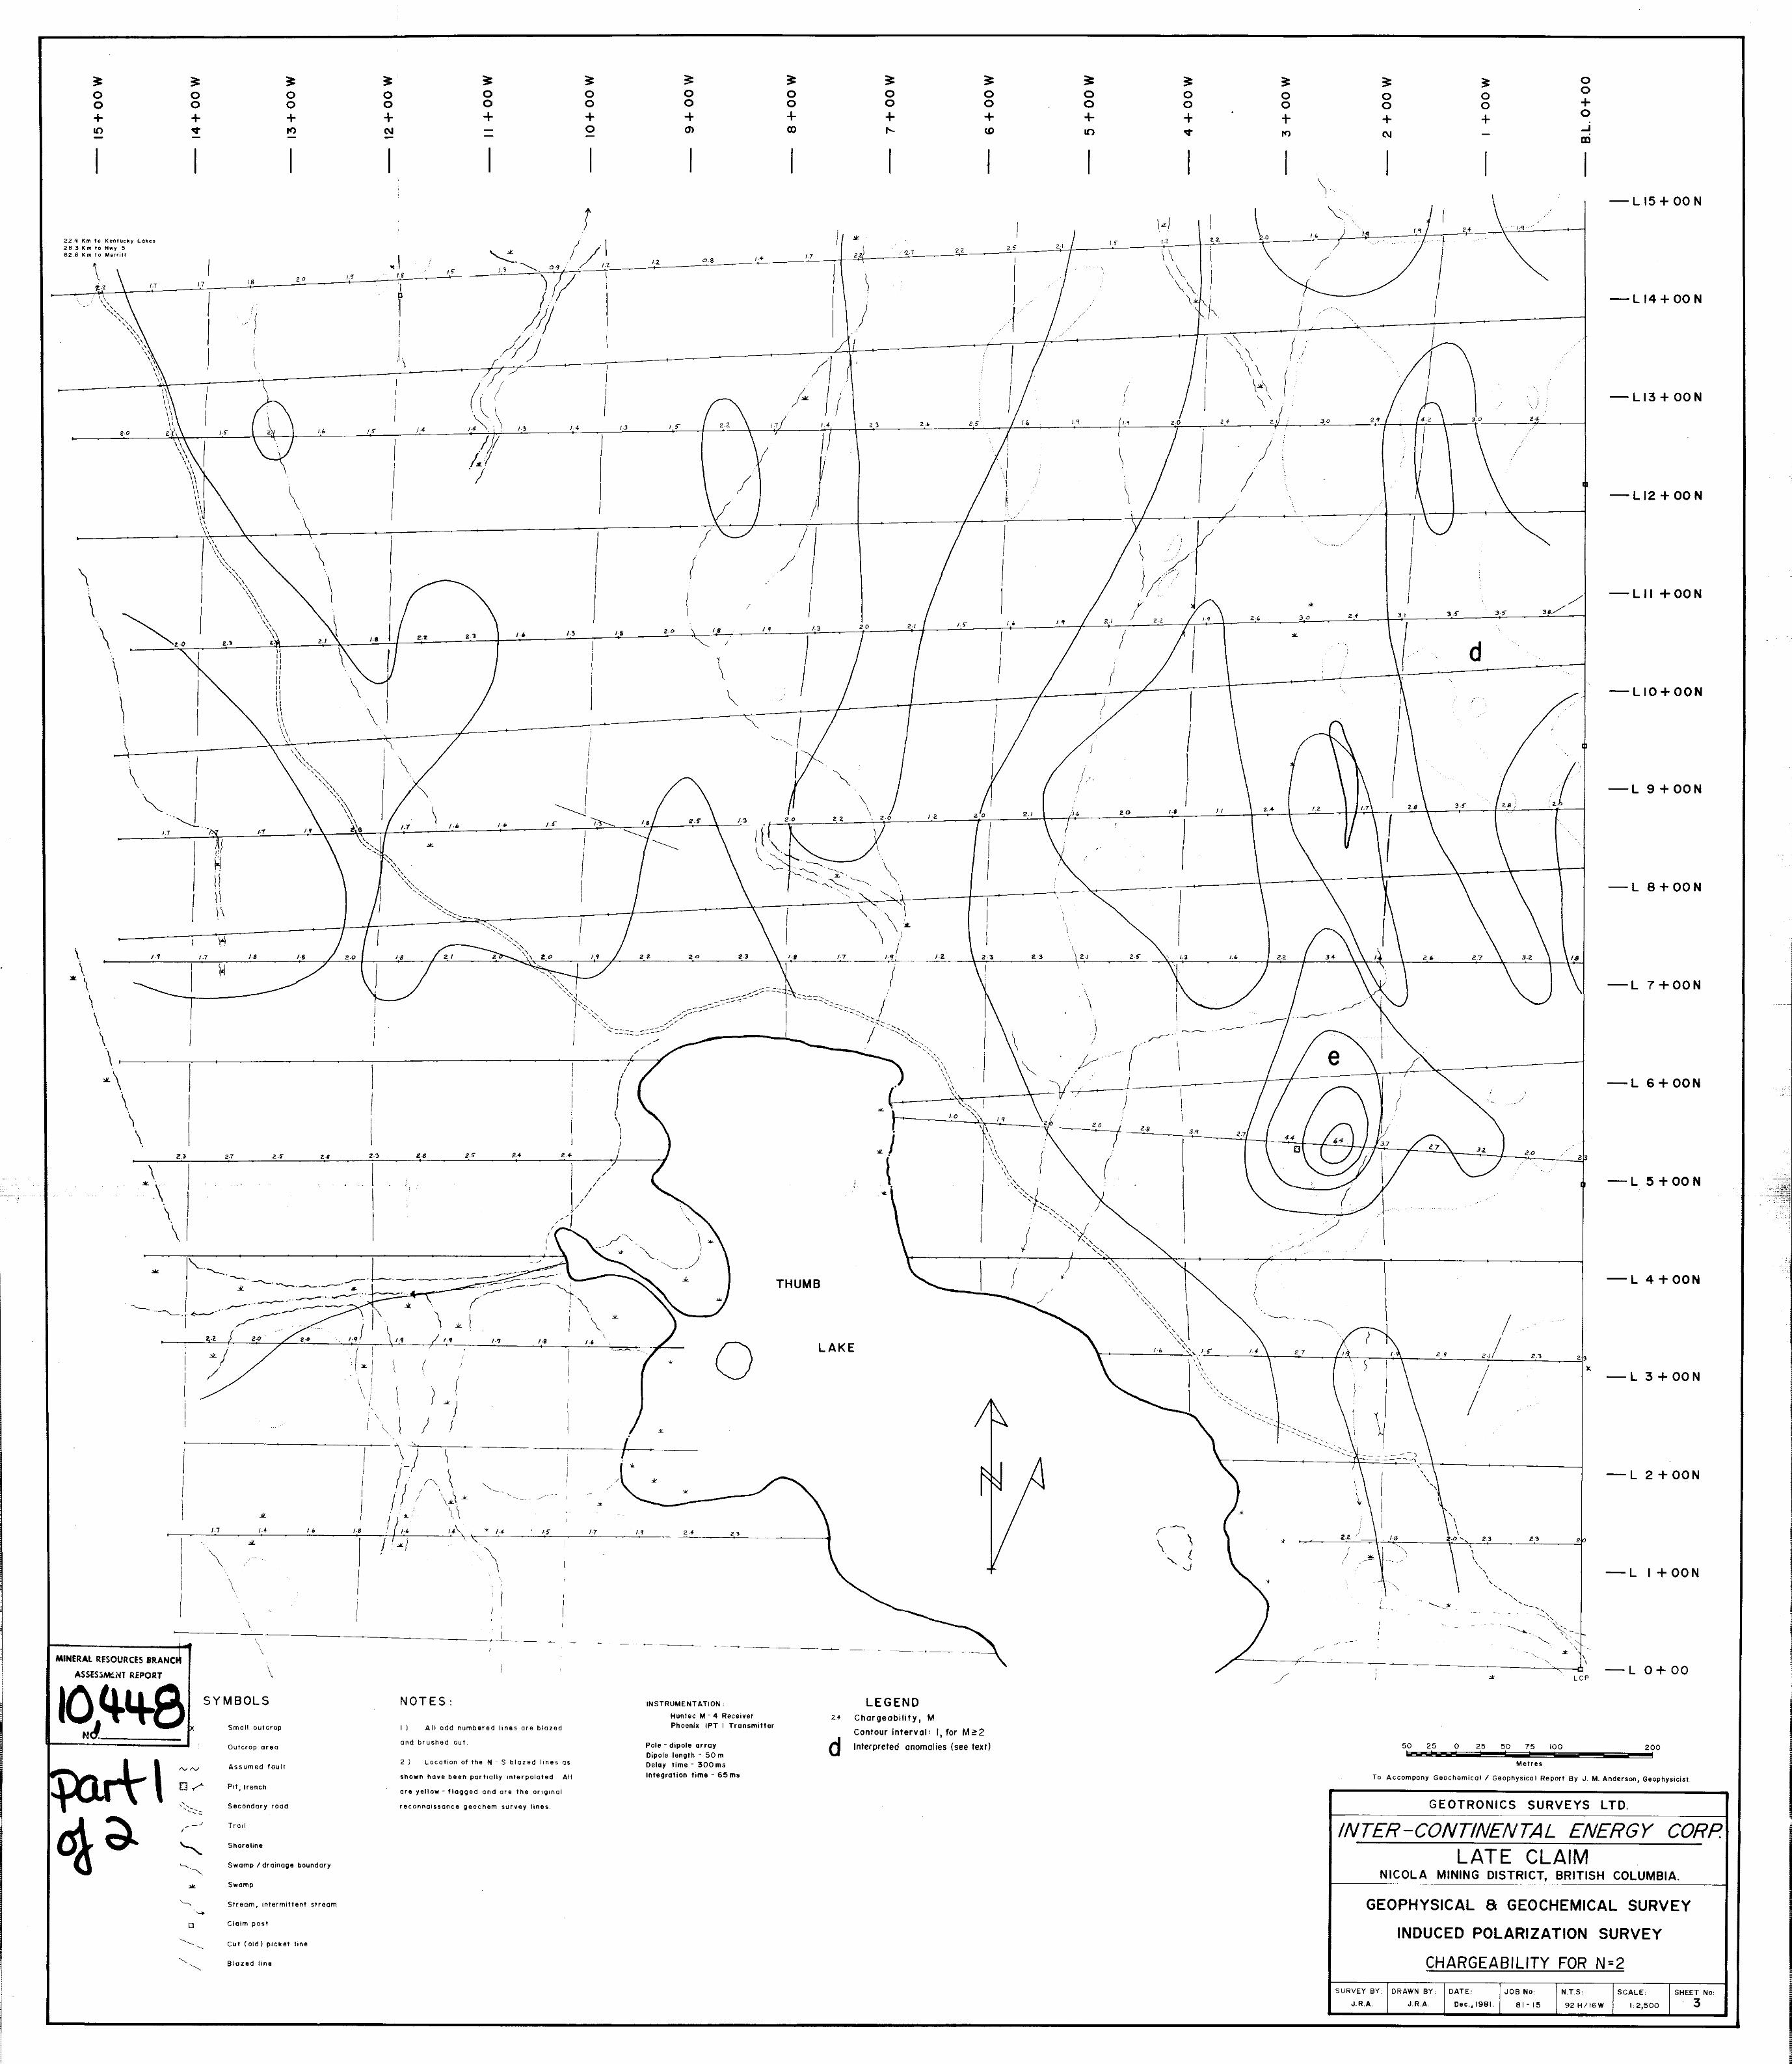
The chargeability for n 2 plan Sheet 3 shows that the
highest values occur in the eastern half of the propertywith M values up to 6 4 against a background of about 2 0
The main anomaly d is centered on line S OON just east
of the prospect pit There is an elongated NNW SSE trendinganomaly e running approximately along line 1 00W and
cutting lines 7 00N through 13 00N The pseudo sections
Sheet 5 reveal that both these anomalies show up on all
the levels There is generally poor correspondence between
IP highs and resistivity lows in fact anomaly d coincides
with a resistivity high
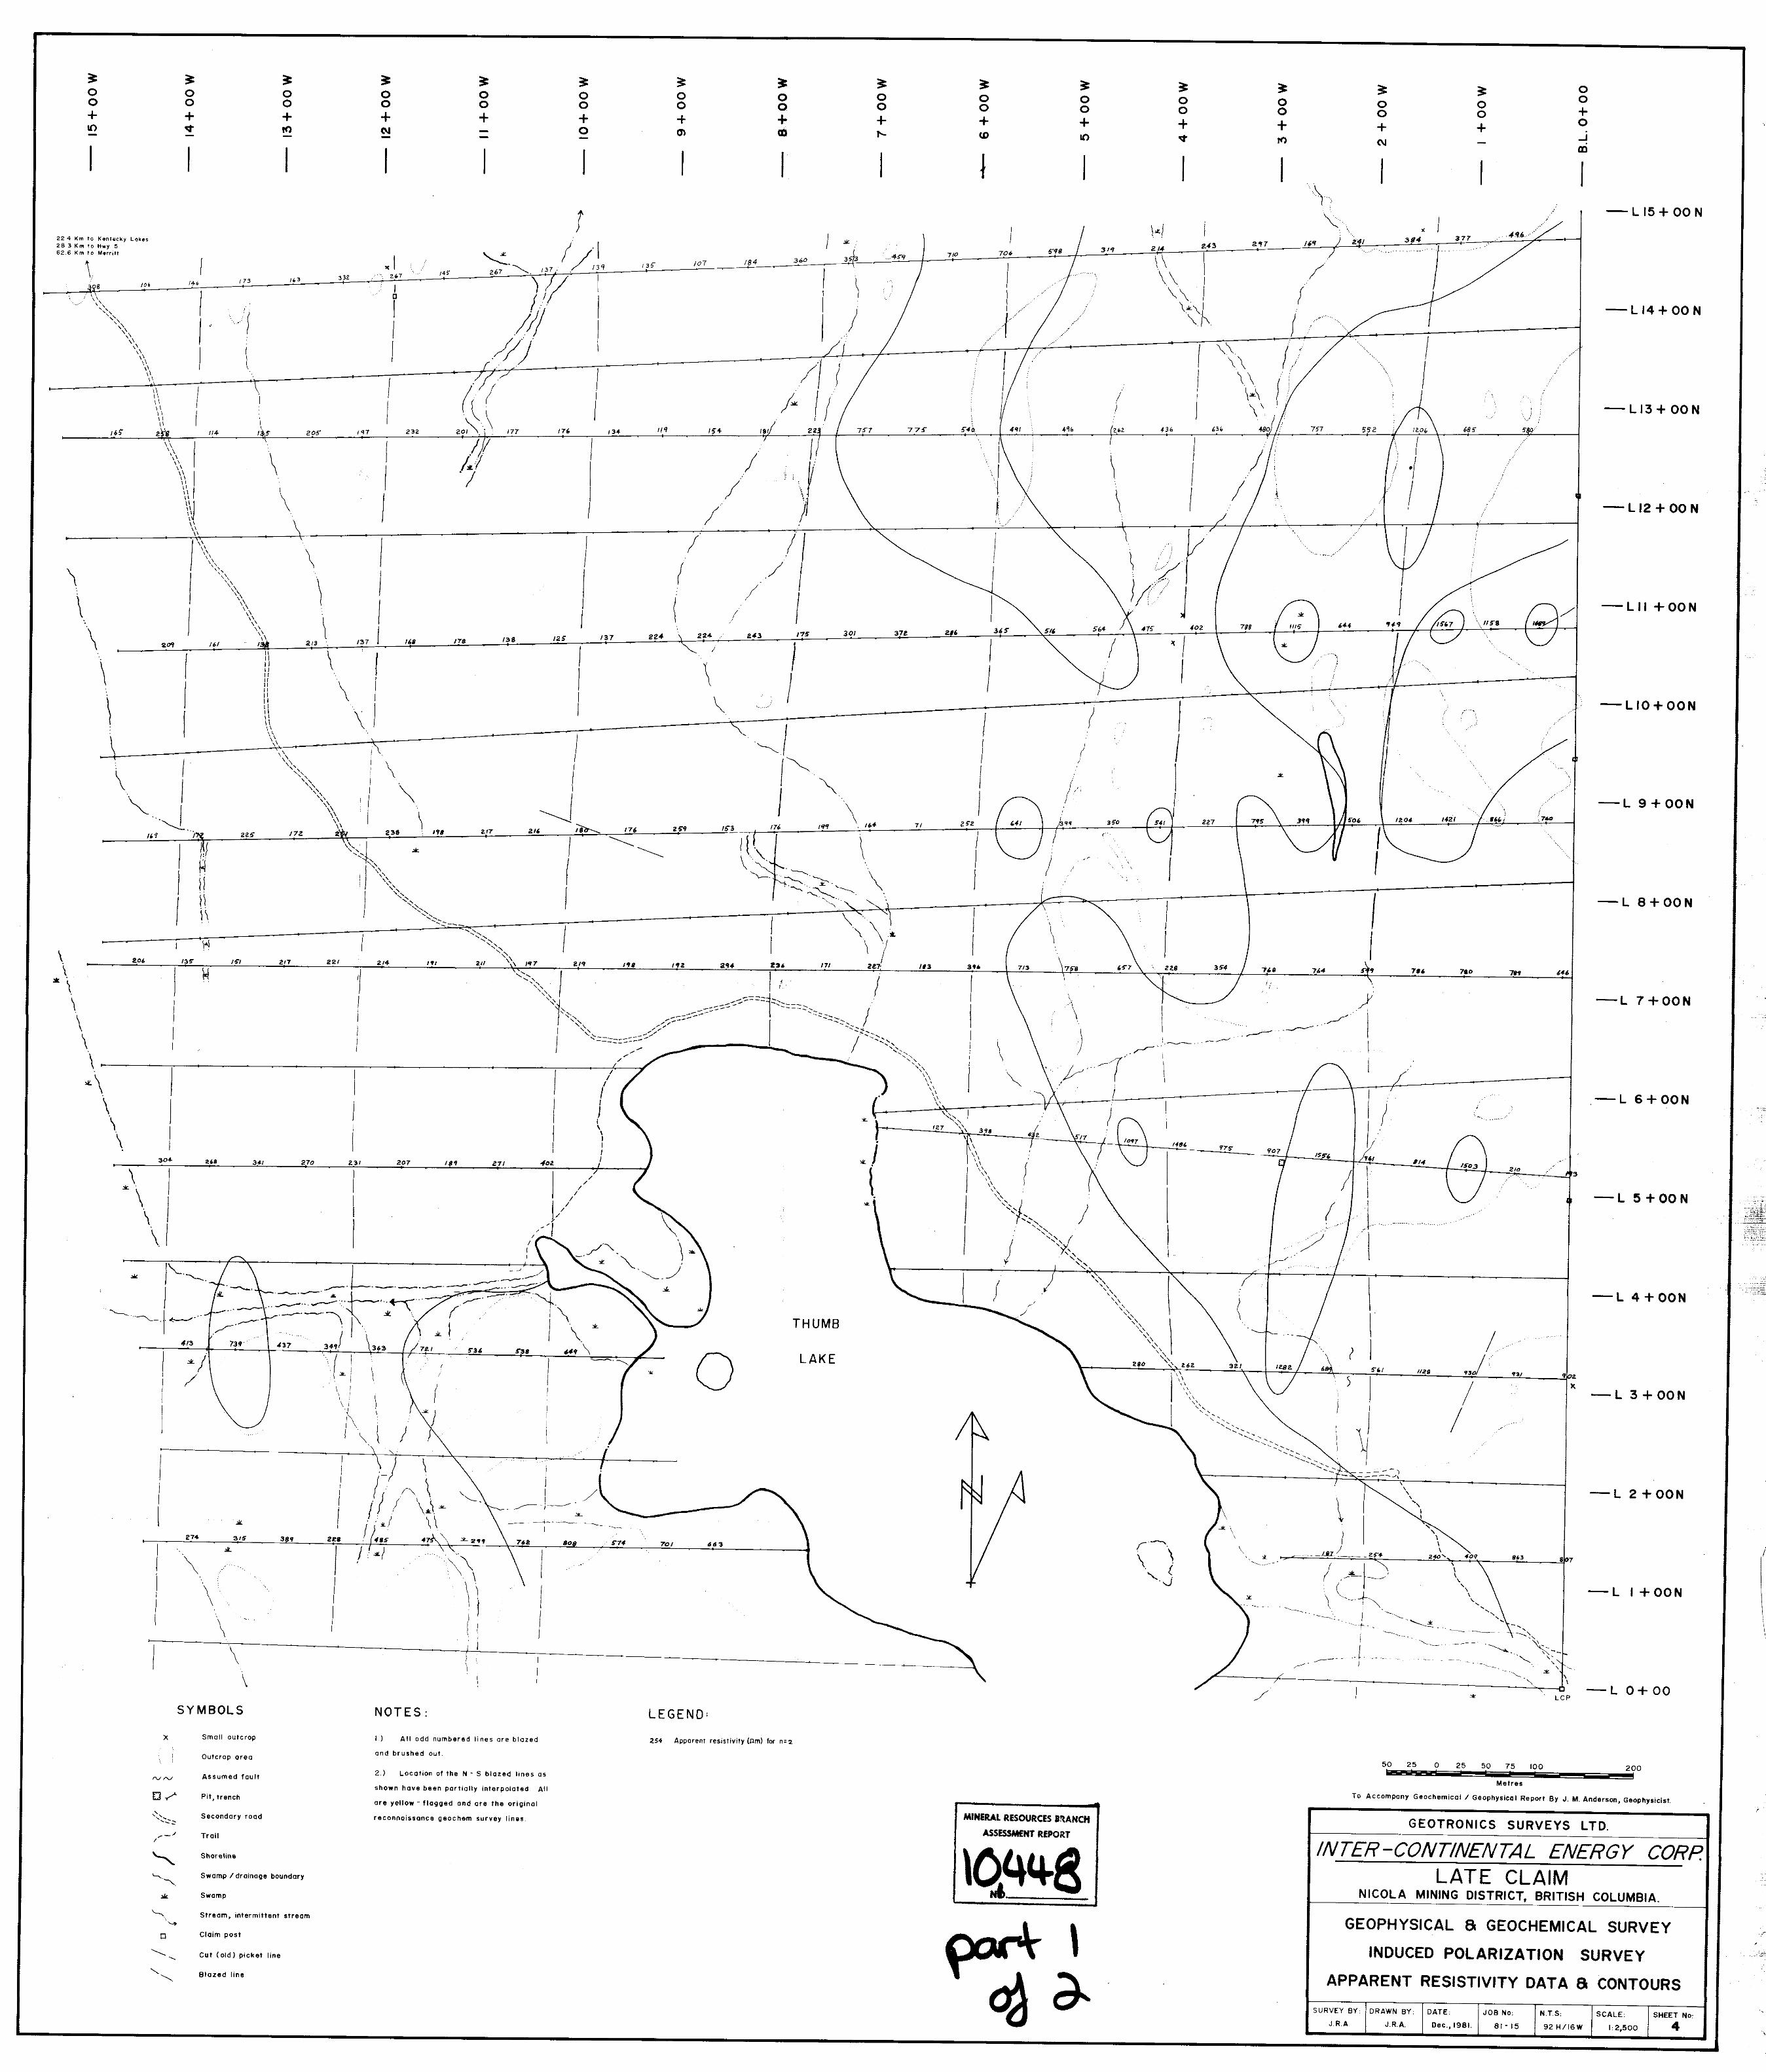
The plan of apparent resistivity for n 2 Sheet 4 also
shows how the lowest resistivity areas tend to be in the west
of the property away from the higher IP readings The
variations in resistivity are likely to reflect small changesin moisture content and little can be concluded about the
significance of individual anomalies without a comparisonwith the other geophysical and geochemical results
The
due
SP gradient profiles Sheet 6 are
to variable grounding conditions
very noisy presumablyfor the pots SP is
GEOTRONICS SURVEYS LTD
J
n
o
D
D
o
D
o
D
D
o
o
UJ
13
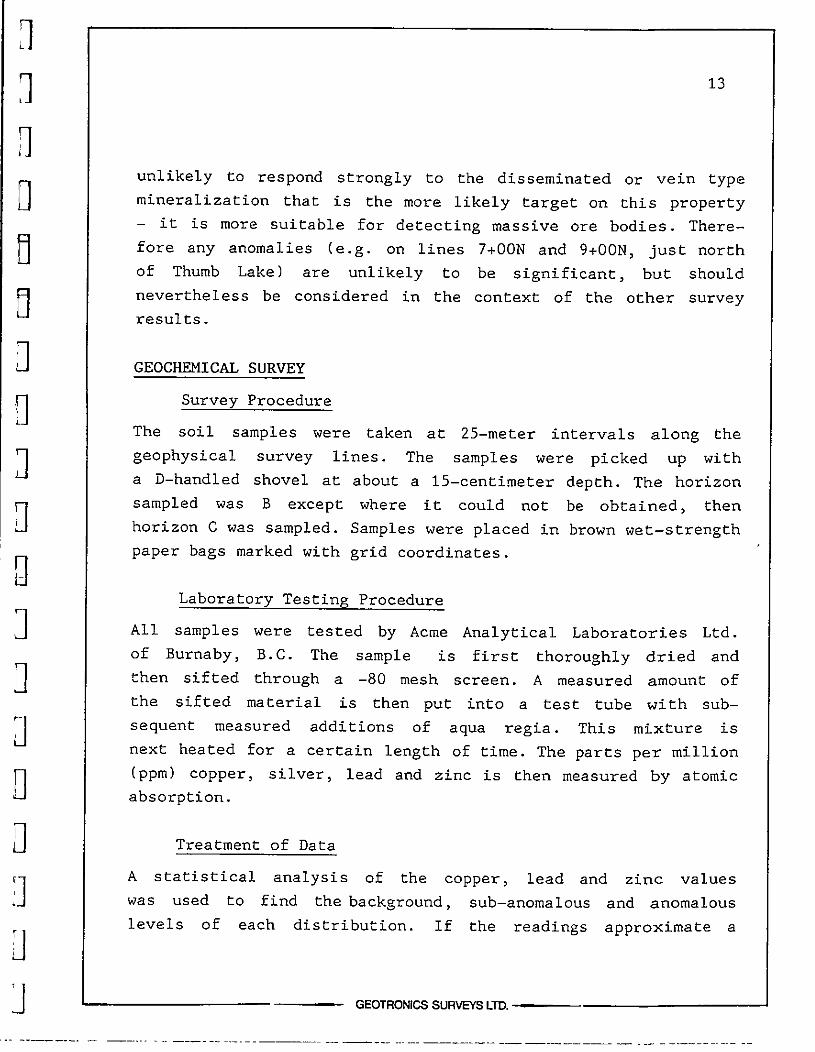
unlikely to respond strongly to the disseminated or vein typemineralization that is the more likely target on this property
it is more suitable for detecting massive ore bodies There
fore any anomalies e g on lines 7 00N and 9 00N just north
of Thumb Lake are unlikely to be significant but should
nevertheless be considered in the context of the other survey
results
GEOCHEMICAL SURVEY
Survey Procedure
The soil samples were taken at 2S meter intervals along the
geophysical survey lines The samples were picked up with
a D handled shovel at about a 1S centimeter depth The horizon
sampled was B except where it could not be obtained then
horizon C was sampled Samples were placed in brown wet strengthpaper bags marked with grid coordinates
Laboratory Testing Procedure
All samples were tested by Acme Analytical Laboratories Ltd
of Burnaby B C The sample is first thoroughly dried and
then sifted through a 80 mesh screen A measured amount of
the sifted material is then put into a test tube with sub
sequent measured additions of aqua regia This mixture is
next heated for a certain length of time The parts per million
ppm copper silver lead and zinc is then measured by atomic
absorption
Treatment of Data
A statistical analysis of the copper lead and zinc values
was used to find the background sub anomalous and anomalous
levels of each distribution If the readings approximate a
GEOTRONICS SURVEYS LTD
n
J
o
n
E1
oJ
n
D
J
DI
J
J1
U
o
u
u
u
u
14
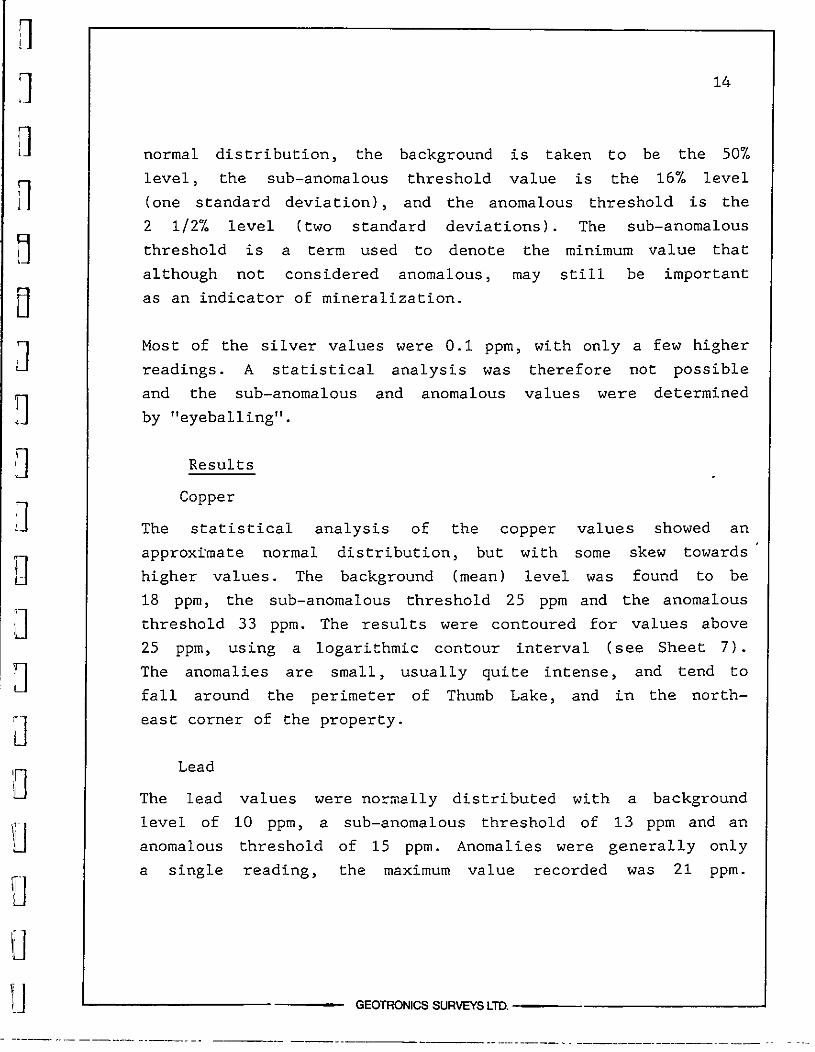
normal distribution the background is taken to be the 507
level the sub anomalous threshold value is the 16 level
one standard deviation and the anomalous threshold is the
2 1 2 level two standard deviations The sub anomalous
threshold is a term used to denote the minimum value that
although not considered anomalous may still be importantas an indicator of mineralization
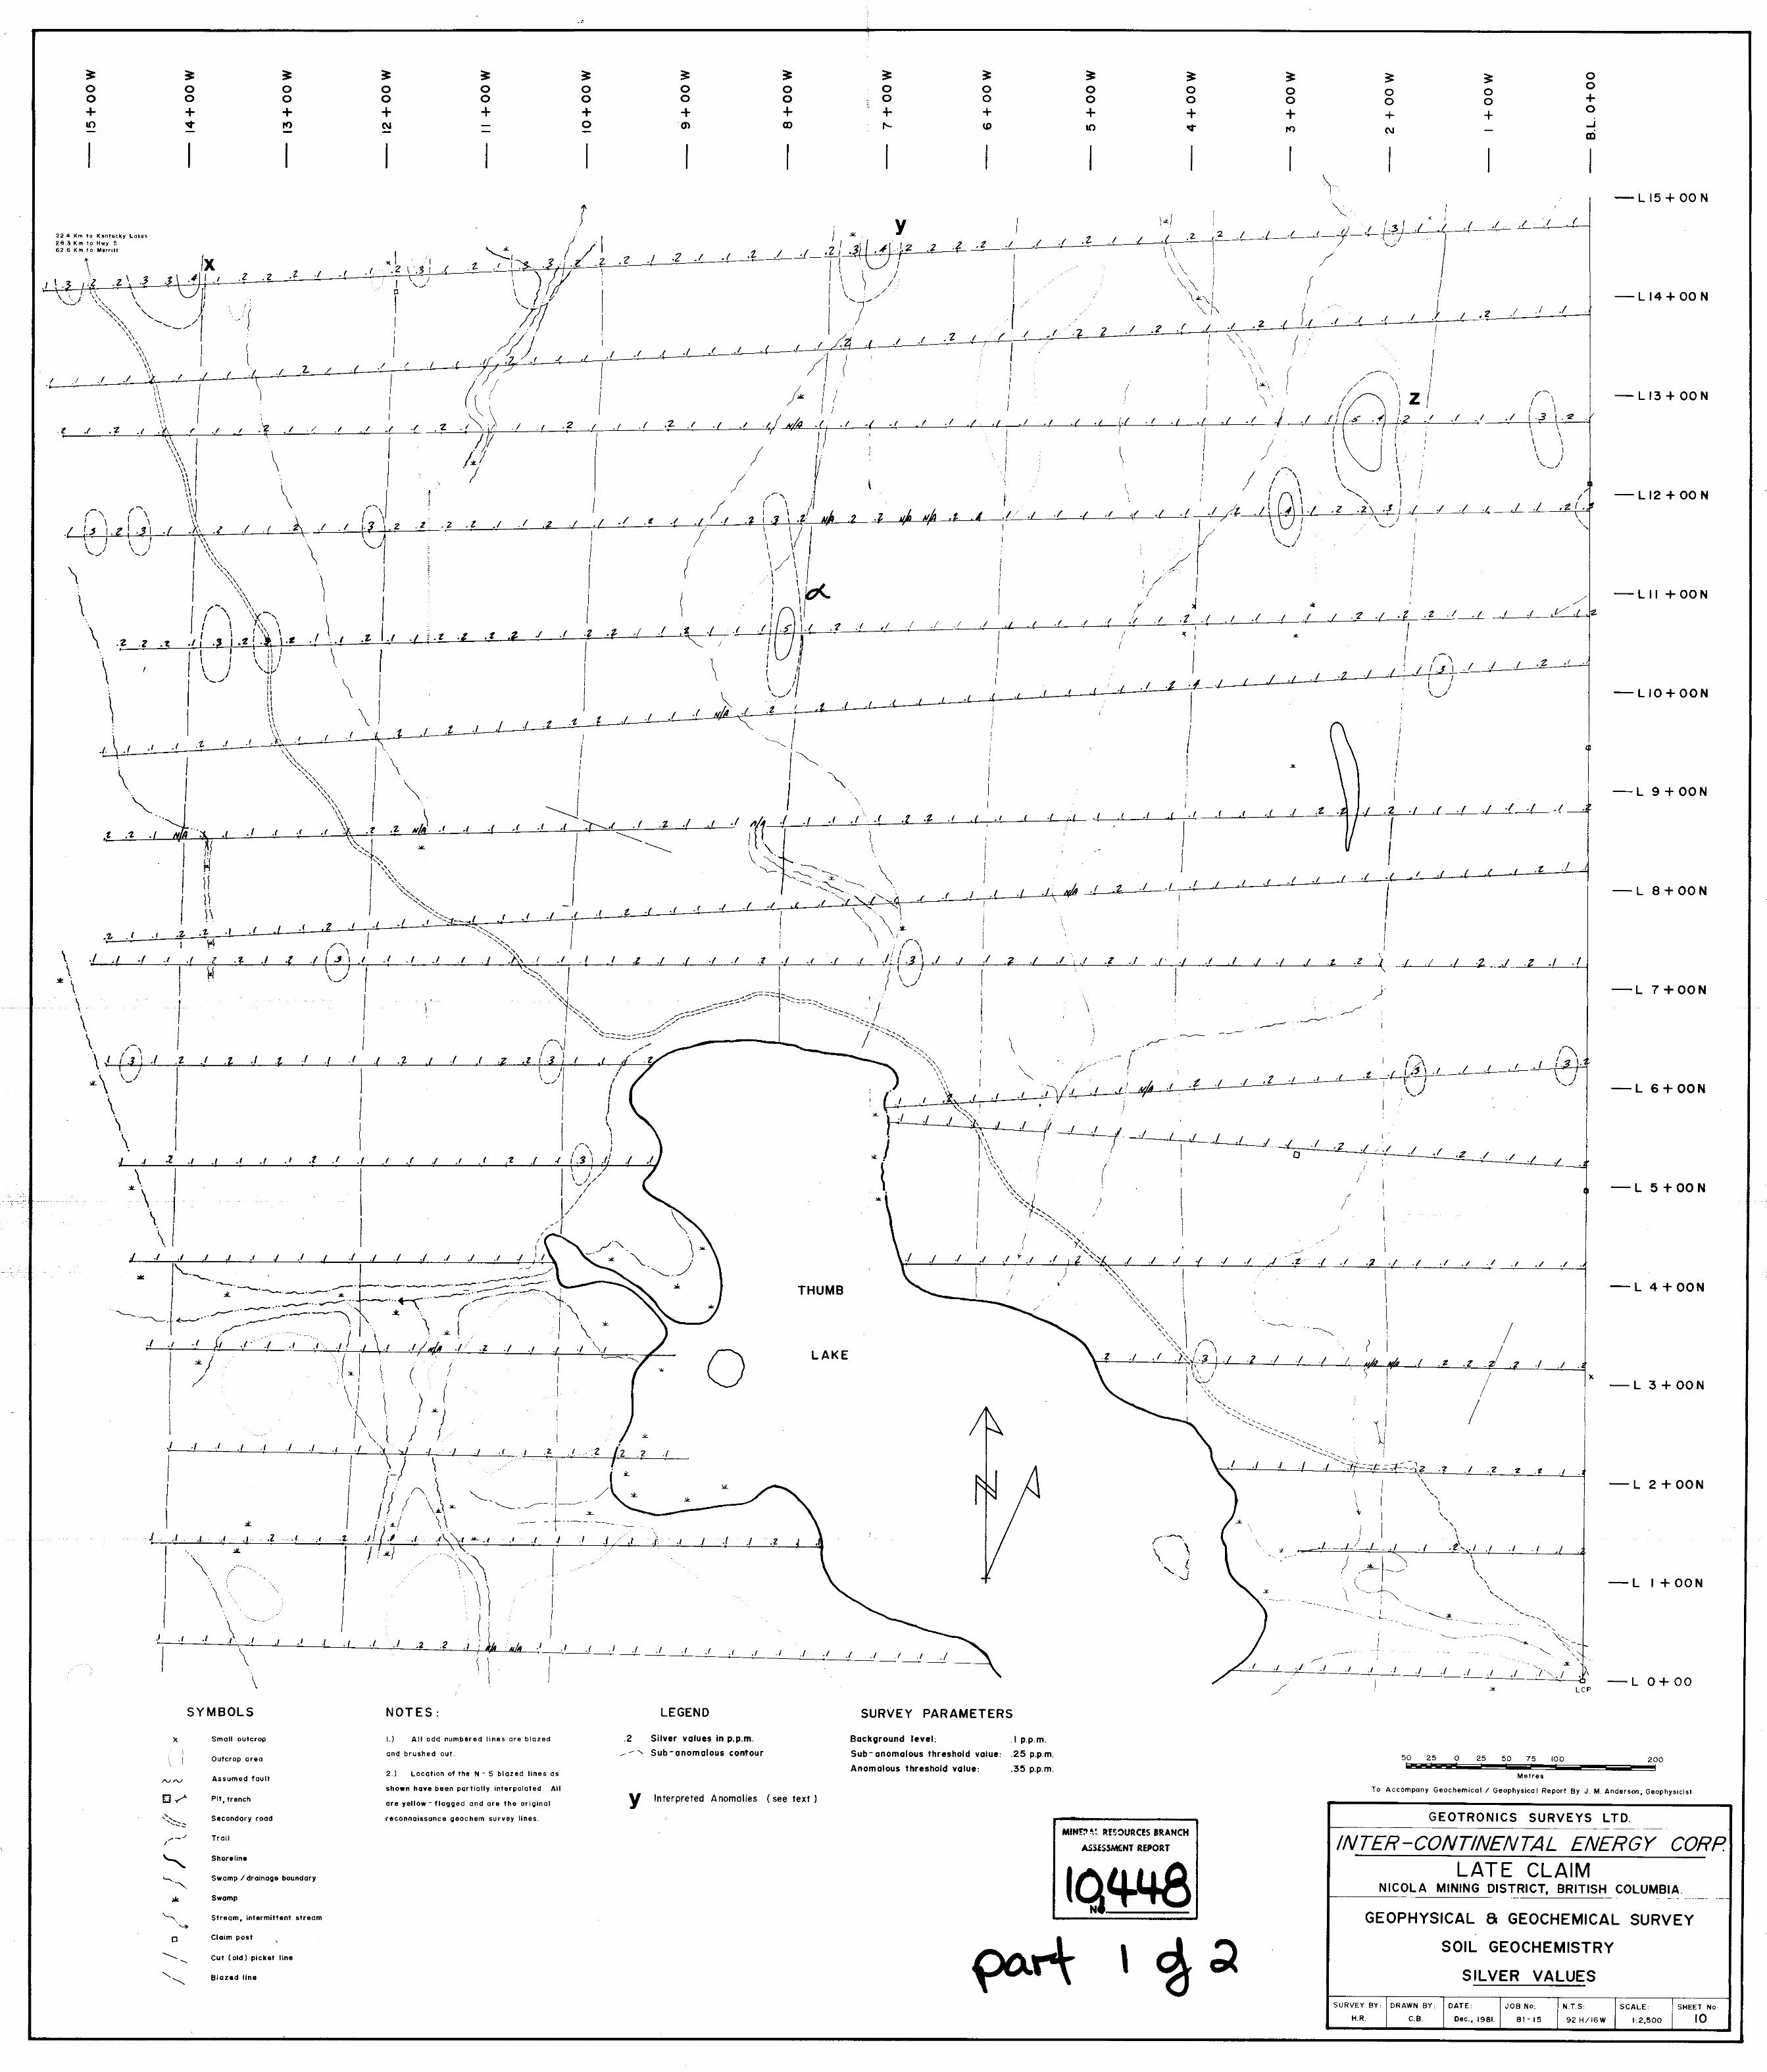
Most of the silver values were 0 1 ppm with only a few higherreadings A statistical analysis was therefore not possibleand the sub anomalous and anomalous values were determined
by eyeballing
Results
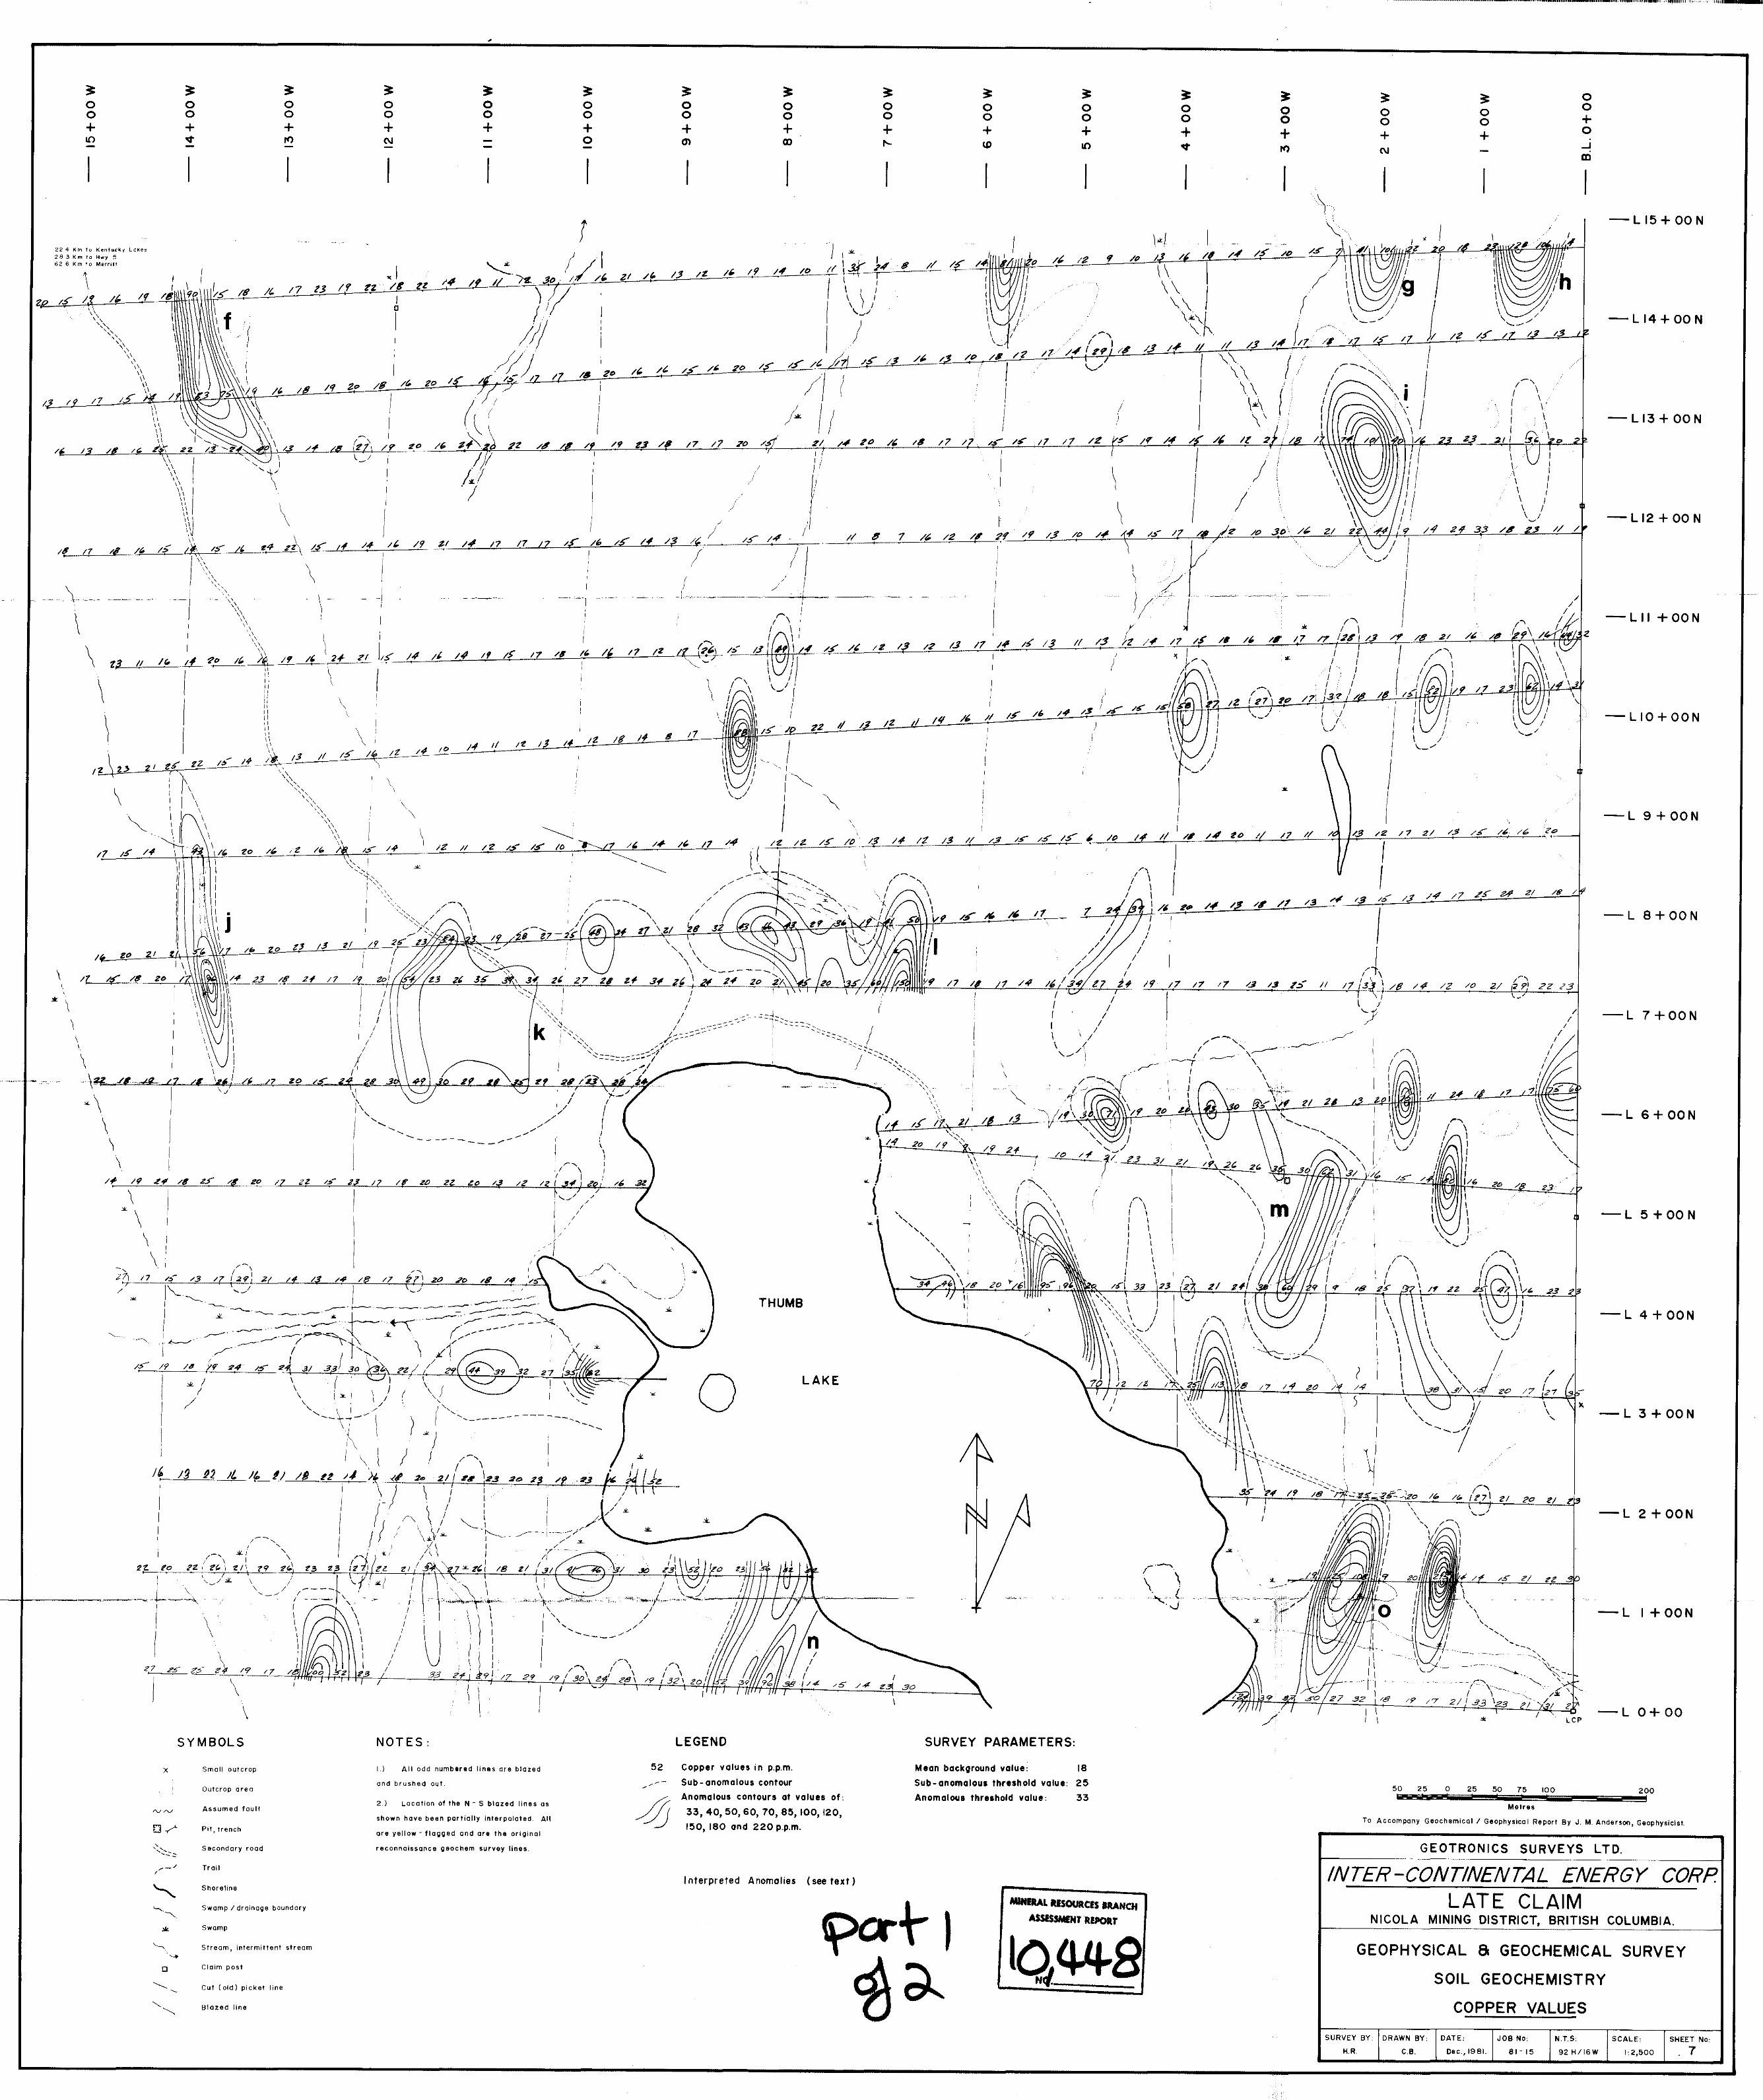
Copper
The statistical analysis of the copper values showed an
approximate normal distribution but with some skew towards
higher values The background mean level was found to be
18 ppm the sub anomalous threshold 25 ppm and the anomalous
threshold 33 ppm The results were contoured for values above
25 ppm using a logarithmic contour interval see Sheet 7
anomalies are small usually quite intense and tend to
around the perimeter of Thumb Lake and in the north
east corner of the property
The
fall
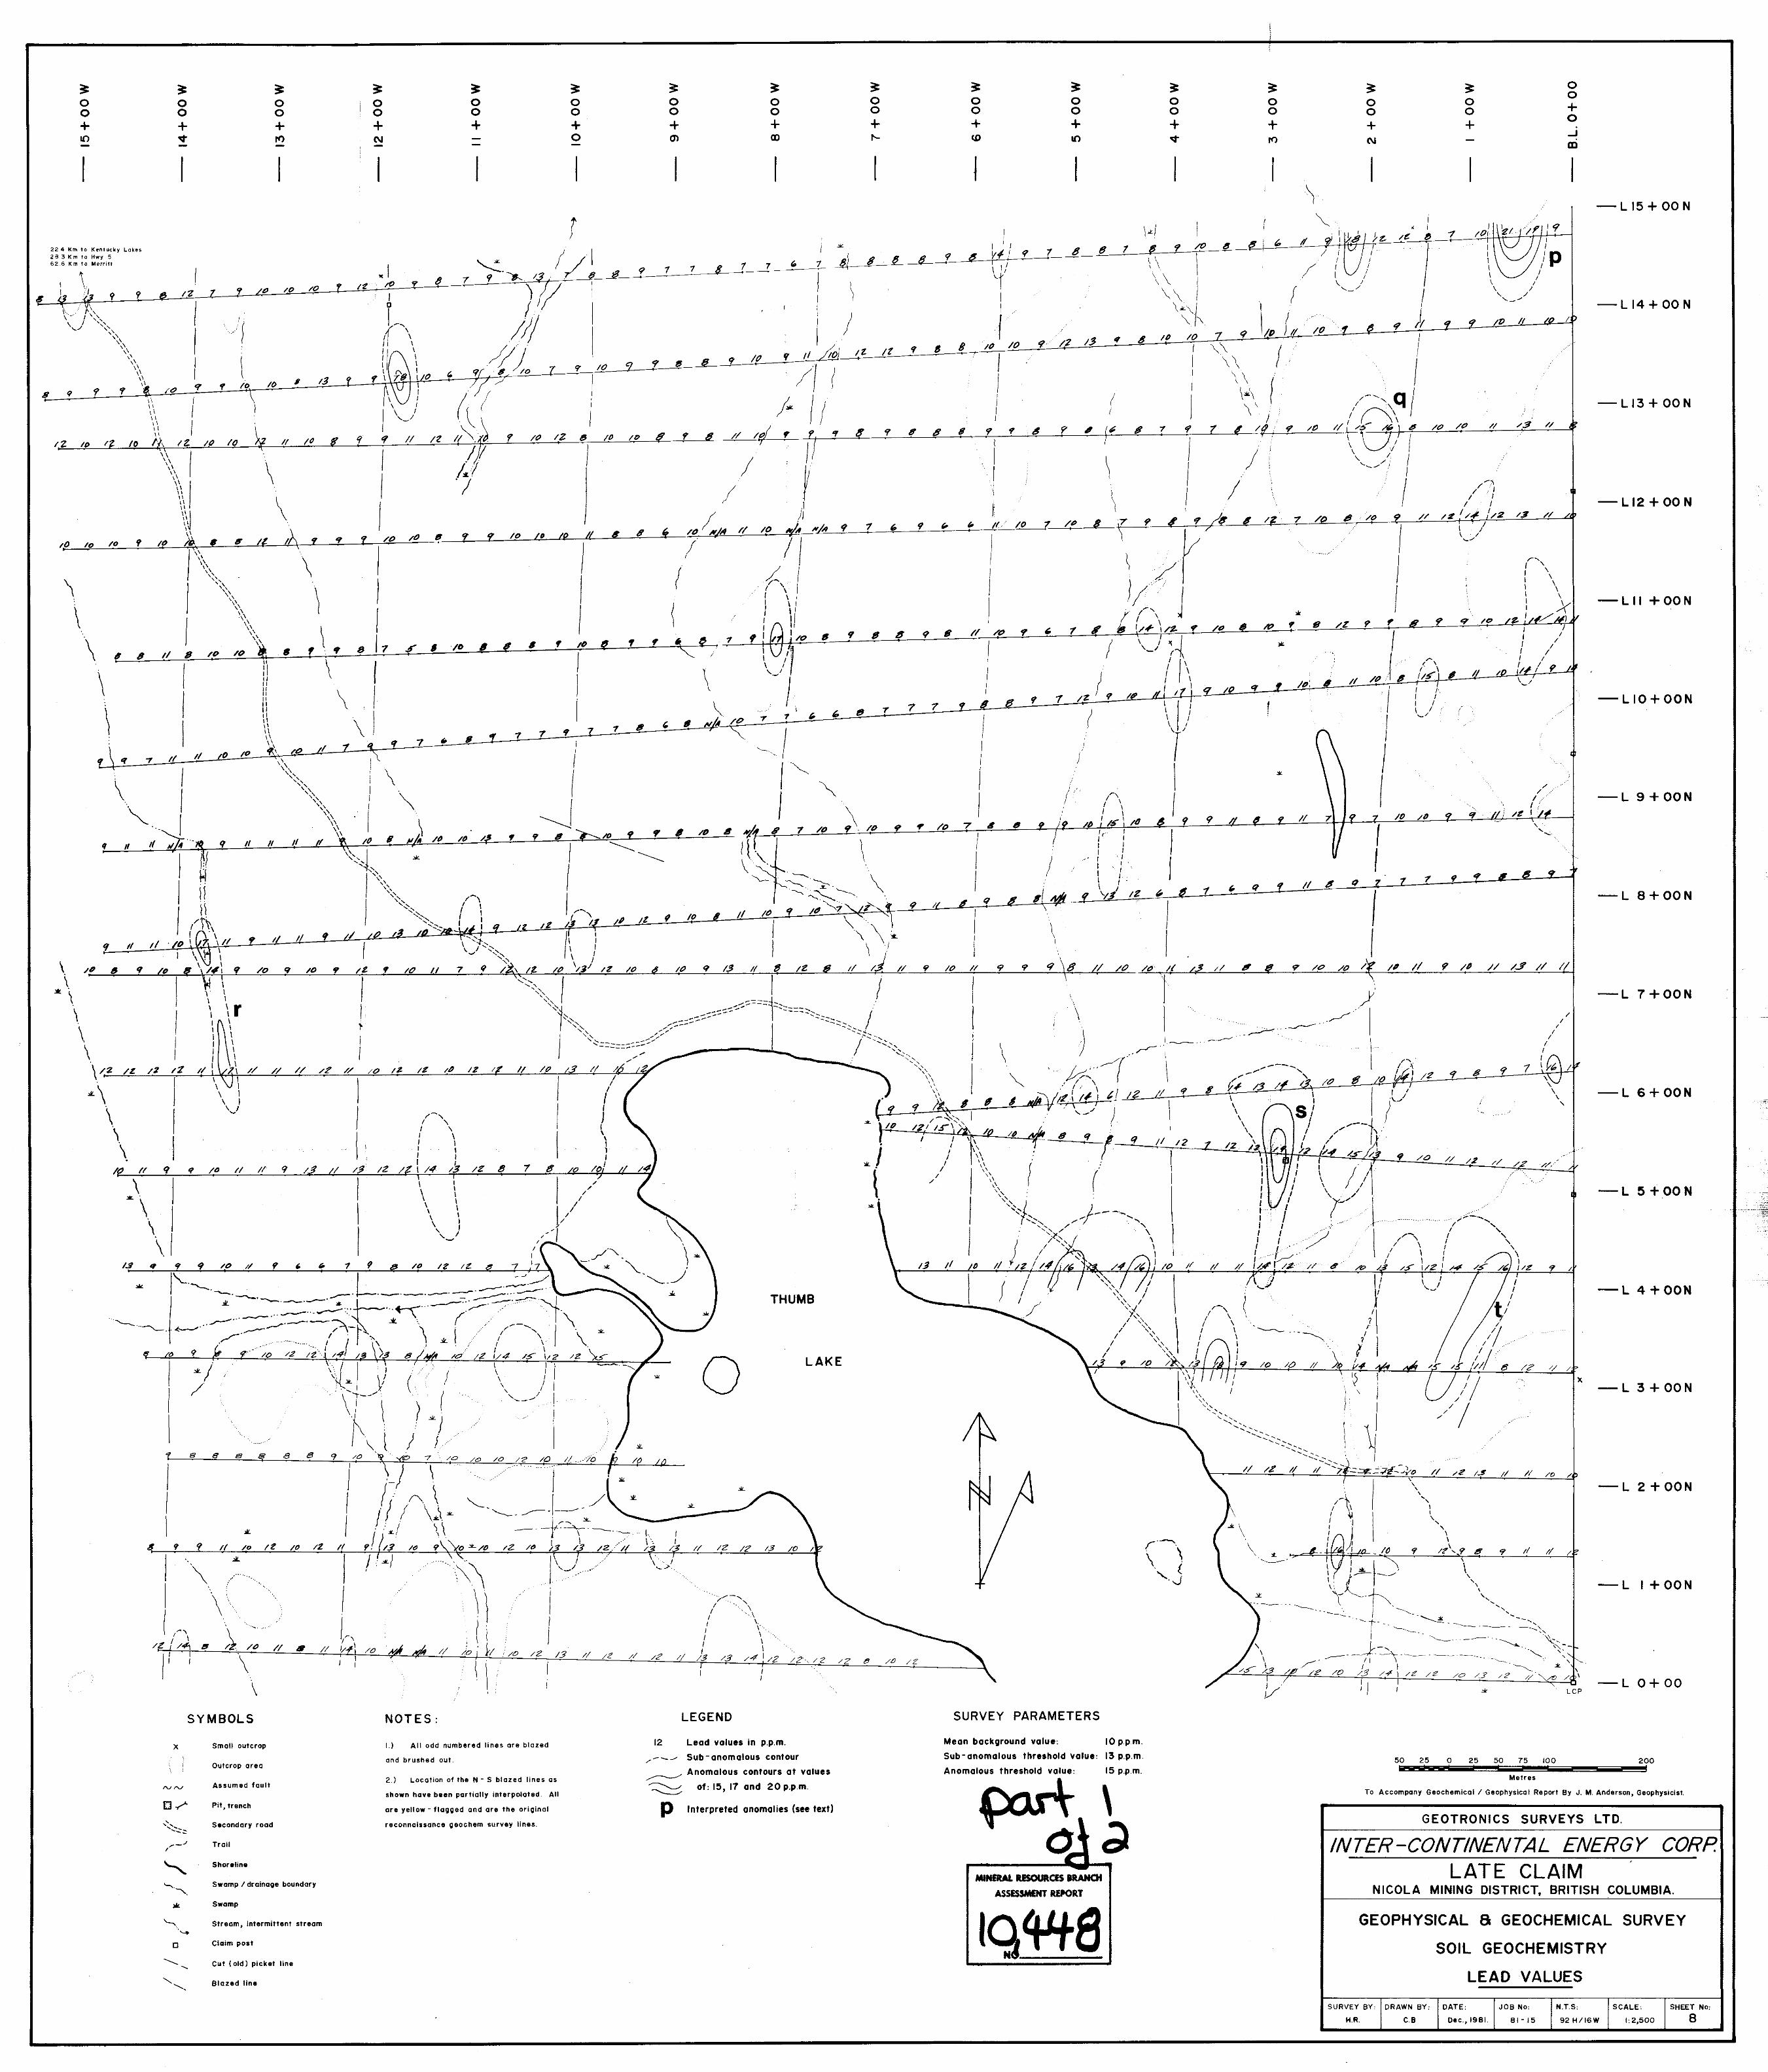
Lead
The lead
level of
values were normally distributed with a background10 ppm a sub anomalous threshold of 13 ppm and an
threshold of 15 ppm Anomalies were generally only
reading the maximum value recorded was 21 ppm
anomalous
a single
GEOTRONICS SURVEYS LTD
J
l
D
D
D
o
D
D
J
D
o
D
D
o11U
D
JJ
15
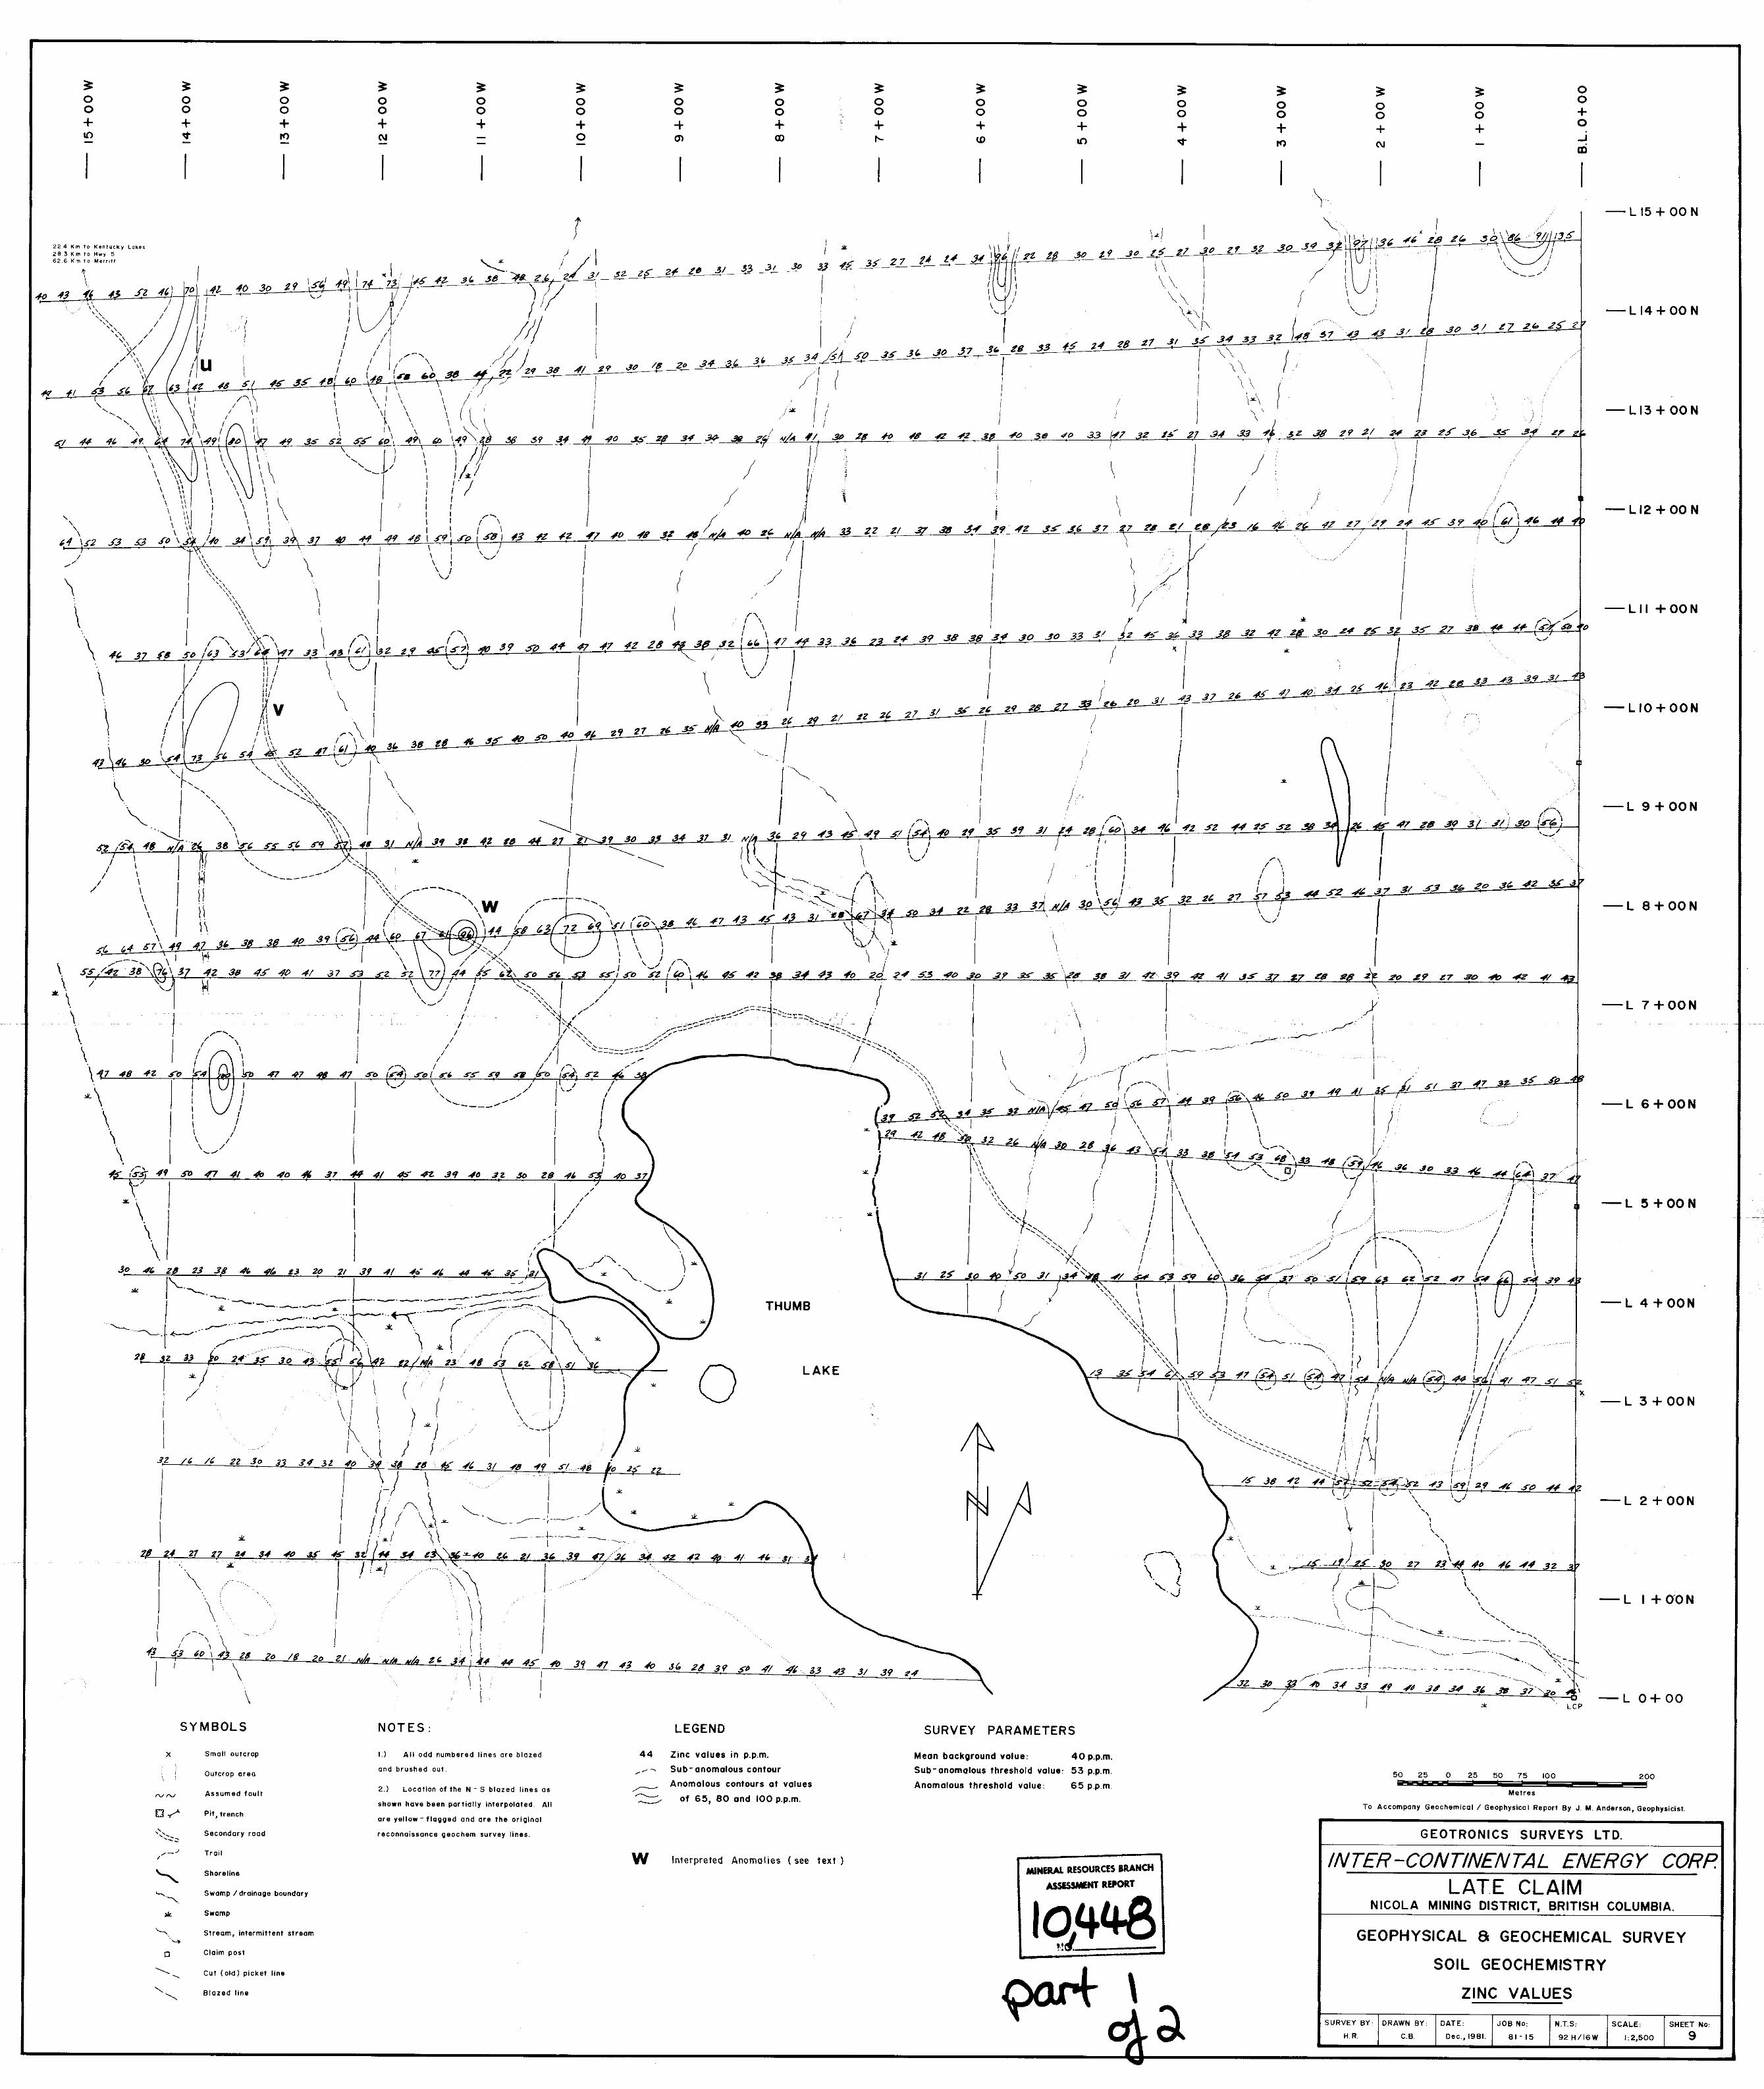
Zinc
The zinc levels showed a normal distribution up to the anomalous
level then a skew towards higher values The parameters taken
from the cumulative frequency curve were background 40 ppm
sub anomalous level 53 ppm anomalous level 65 ppm The
anomalies were sparse mainly being concentrated in the north
west of the claim
Silver
The majority of the silver values were 0 1 ppm with highervalues only up to 0 5 ppm The sub anomalous and anomalous
threshold levels were taken to be 0 25 and 0 35 ppm Onlya few localized anomalies were revealed
DISCUSSION OF RESULTS
The following table summarizes the cross correlation between
the various survey results
Approximately Location Coincident Anomalies
14 0011 15 00N Ag anomaly x ZI anomaly u
Cu anomaly f
0 5001 15 00N Pb anomaly p Cu anomaly h
2 0001 13 00N Ag anomaly z Pb anomaly qCu anomaly i
14 00W 8 00N Pb anomaly r Cu anomaly jalong same N S strike as Zn
anomaly v
11 00W 8 00N Zn anomaly w Cu anomaly k
in magnetic low area
3 00W 5 00N Pb anomaly s with minor eu
anomalies in IP high and on
strike with VLF EM lineation
GEOTRONICS SURVEYS LTD
J
1 16
o
o
D
D
o
It will be seen that the cross correlation between geophysicsand geochemistry is not strong There are only a few small
copper anomalies in the magnetically active area to the west
of Thumb Lake the VLF EM lineations do not seem to correspondwith geochemical trends and the IP highs do not contain any
particularly strong geochemical anomalies The geochemicalanomalies are generally weak and scattered with no strongcorrelation between themselves
Respectfully submittedGEOTRONICS SURVEYS LTD
D
D
J
D
oJ
December 18 1981
u
J
J GEOTRONICS SURVEYS LID
J
117
o
on
o
J
D
o
SELECTED BIBLIOGRAPHY
Kallock P and Goldsmith L B
of the Late 1 Mineral
Services 1981
GeologicalClaim Arctex
Investigation
Engineering
Kelly S F Report to the Inter Continental Energy Corpof Vancouver B C Concerning the Late Claim Groupat Thumb Lake near Merritt Nicola Mining Division
B C Consultants Report 1980
o Preto V A Geology of the Nicola Group Between Merritt and
Princeton B C Ministry of Energy Mines and Petro
leum Resources Bulletin 69 1979J
J
D
Rice H M A Geology of the Princeton Map Area B C Canada
Dept of Mines and Resources Memoir 243 Map 888A
1947
D
J
Jl
uJ GEOTRONICS SURVEYS LTD
Jl
18
n GEOPHYSICIST S CERTIFICATE
nI J M ANDERSON of the City of Vancouver in the
Province of British Columbia do hereby certify
J That I am a Consulting Geophysicist of Geotronics
Surveys Ltd with offices at 403 750 West Pender Street
Vancouver British ColumbiaJ
1
D
J
I further certify
1 That I am a graduate of the University of Tasmania1971 and hold a B Sc degree in Geophysics
That I have been practising my profession for the
past ten years
This report is compiled from data obtained fromVLF EM magnetic induced polarization and soil
geochemistry surveys carried out under tl1e directionof David G Mark Geophysicist and the field supervision of J Ashenhurst H Richardson and P Arbezfrom May 12th to October 20th 1981
2
3
l
J
U
J
J
J
J
J
4 I have no direct or indirect interest in the Late
Claim nor in Inter Continental Energy Corporationnor do I expect to receive any interest as a resultof writing this report
December 18 1981
M Anderson
eophysicist
GEOTRONICS SURVEYS LID
l
nnLJ
JJ
oJ
o
o
J
Jo
D
o
u
19
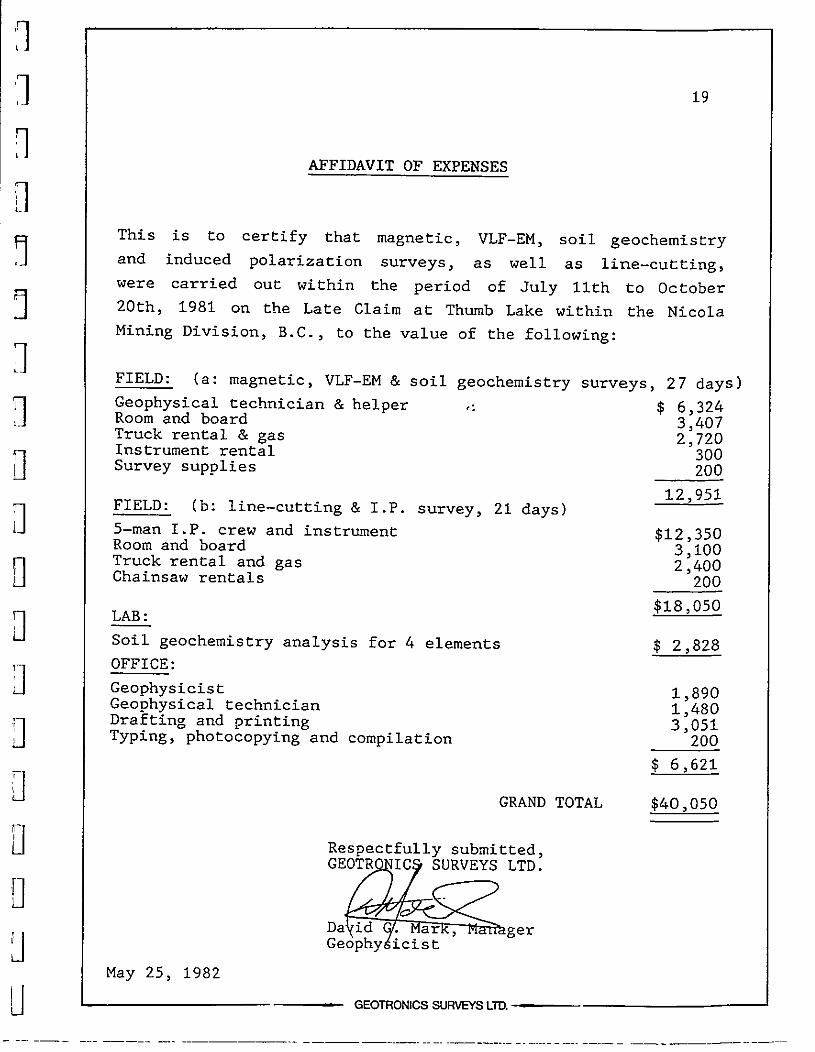
AFFIDAVIT OF EXPENSES
This
and
is to certify that magnetic VLF EM soil geochemistryinduced polarization surveys as well as line cuttingcarried out within the period of July 11th to October
1981 on the Late Claim at Thumb Lake within the Nicola
Division B C to the value of the following
were
20th
Mining
FIELD a magnetic VLF EM soil
Geophysical technician helperRoom and boardTruck rental gasInstrument rental
Survey supplies
geochemistry surveys 27 days6 3243 4072 720
300200
12 951
FIELD b line cutting I P survey 21 days5 man I P crew and instrument
Room and boardTruck rental and gasChainsaw rentals
12 3503 1002 400
200
18 050LAB
Soil geochemistry analysis for 4 elements
OFFICE
GeophysicistGeophysical technician
Drafting and printingTyping photocopying and compilation
2 828
1 8901 4803 051
200
6 621
GRAND TOTAL 40 050
Respectfully submittedGEOTR IC SURVEYS LTD
Da id
Geophyger
May 25 1982
GEOTRONICS SURVEYS LTD
Il
l
l
l
I1
J
JJ
J
JJ
J
J
o
PROPERTYLOCATION
Queen
0
UN IT E 0S o TE5
GEOTRONICS SURVEYS LTO
INTER CONTINENTAL ENERGY CORP
LATE CLAIMNICOLA M 0 8RITISH COLUM81A
GEOPHYSICAL AND GEOCHEMICAL SURVE
LOCATION MAP
ALTAIRdnotflng SQlVlces ltd
SCALE DATE1 50 000 DEc al
JOB No
8115
FIGURE No
r
IP
n
1
n
R
H
I
I1
U
I
u
U
J
J
i J
U
UI
U
120030
jcree
j
Jt
fS
49050 Jrv
I
I
on
S
fuII
Fo
rJv
Jeeekdv
12003
LATE
CLAIM
iG
9050
ffI
L L
GEOTRONICS SURVEYS LTO
INTER CONTINENTAL ENERGY CORP
LATE CLAIMNICOLA M 0 BRITISH COLUMBIA
GEOPHYSICAL AND GEOCHEMICAL SURVEY
CLA M MAP
SCALE DATE
1 50 000 DEe Sf
JOB No
8 5
FIGURE No
2
liIL1I
2t o 22 I 2 I 1 I 29l I
LlL
I
oo
LO
224 Km fo Kentucky Lakes
283KmtoHwy5626 Km fo Merritt
If15 If
I
I
I
II
IIIII
I 17 I
If If7
t1 II
I 2
17 15 I
I 20
16
11 19
7 17r
r nl n III n nmn IlII1Ln rl IEl iI IHRllllllllldlll I i iillliiilll
oo
It
oo
oo
CI
oo
oo
o
oo
en
oo
CD
oo
oo
Ul
oo
LO
oo
It
oo
oo
CI
oo
oo
o
J
CD
18 17 3 IfI
Ic
III
I
I
J1
n D
1If
IJI1 7 1 III
1
1
hI
I I
If I
L 14 00 N
L 15 00 N
1
If c 5 I
j r
I I21 2 I
1
II 8
IIII
I
5 2
L II OON
f5
rf lJI
I
t
II
1
J
PIe
IIIIIII
1II
1 1 2
III
I
e I 0
II
d I II
II
JIII L 12 00 N
It 121
If II
II
I
19 lof 10I12IJf21ZZ z 4
I
f
I 117 1
f
I 12I I
I 1 2 II
II 13
A
I 17
I 20 IfI C2t
II
I 19 2 6
II
I
I
9
I
I
I
If 20 I
I
J11j
III
IIIIIIII
I
1
II
jIII
IS I s If
1 I 1
I
II
I 1 o
III
L 13 00 N
IfIII
III
I
8 23 1
It of I2I 17 76 1 1 r
II
17Z3 f 17 20I2 IfI
I
I
IIi
i16 I r I
zo 6
f2
14 2 333De
y JJz
f
21f I 170If 137 1 12
e4 rz If 101 01 17 17 17 4t 19 ZI4I
Ii
II
21 LsI I
Ii
S
II
I
L 10 OON
II
I
I
It
II
II
I
t
17 7 1 81 3
I JI II II I
1 I
1 37 loi
I 1I j
I
1
iIt
fI t 2i
It 12It 1
1 IJ II1 I
III
I11I 2I 12
1217I 8loPIt IfI 17I
t7
17t
2 127I
I
3 II
IjI
1 2
I21 I
16151 I 12 I q t II
I
I
I
II
6 11 II 15
I
I
I
I I
1722
8I812II
III
17
ltII Ilf III
I
If Z IO
1 e5 zZ Ij
I I
1I
I I
0It to
1IIII
I
J
I
4 21
II
III
III
III
I3
L 9 00 NIi
4
I
I 10 7 t I
6 6 Ze1 0 7 21lf eO6 5 If f lfI t 1 II 354 12 s ItII
I
I
I1 II
2S 7 is zl 8
1
U zf 3 2 oN 20 21I I II
I
II
k0
I
I
f7
1I
J
I
III
I
IIII
I
16 712 II 2
I
II
I
I
7 21 I
I I I1I 1
I
I I
I 13 tp 11 17
III
II
1I
f
of1 17 t5 M13I I
L 8 00 N2
I
d
iI
II
17 3
I
j
L 7 OON
1
211121
f o o
NI 3zt 159 Zf0
r
21 2 91 2i 3ED 17 1
I2t 27 717 r
I
717 S 3 II 8 12I
I1I
II
iI
1I
I
I
II
II
II
II
71 I
I
I
I
42
2
2 IIr
I
IJ
2t JJ J5 If 2 2
I2 I
30 31 tf
lI 1
II
1II 1I
I f21 311 9 I T B
I
I
IIj
I2 1
r
1
V1f Jb
0 f 1 3
ZQ t7
kI
II
V
IJ11 21 If
1 11 If 21
I
1
I
II
II I
L 6 00 NII
L J
t
f
20
i 31 21
II
I ILf 8 if
r
I
I II o
I
II i
1IIIII I
II
I I II
51 23
ISZof 2
II
2
LCP
23
Ii
I
I
I
L 5 00 N
9 9
II
II
2s 1
II
1II
r
I
I1 II
25
I I
II
20 7
3
I12720
If 22 23 2
I
j
THUMBL 4 00N
I1
I
II
IzSIJ B 7
I
27
IL 3 00 N
4
5oLAKE 11 eo
YI71
11 8
II
g J o I It 11 7 ii 1 oI
I
II
III
I1 5 e rz 9
21 l
L 2 OON
I231 r
CJ
JOII
L
I
l1 l i
1
II
o ltI
I
1
I
IIIII
1I
1
201 I231 30
L I 00 N
27 2 II
Z Z8 9 132
S 269 130I
r
r1
21 I 33 Izo
5 1
9 7
L 0 00
SYMBOLS NOTES LEGEND SURVEY PARAMETERS
x Small outcrop I All odd numbered lines are blazed
and brushed out
52 Mean batkground value 18
Sub anomalous threshold value 25
Anomalous threshold value 33200
I
Copper values in pp m
Sub anomalous tontour
Anomalous tontours at values of
33 40 50 60 70 85 100 120
150 180 and 220 p p m
50 25 o 25Outcrop area 50 75 100
UOJ Assumed foult2 Location of the N S blazed lines as
shown have been partially interpolated All
are yellow flagged and are the original
reconnaissance geachern survey lines
Metres
To Accompany Geochemical Geophysical Report By J M AndersonJ Geophysicist0 Pit trench
Secondary rood GEOTRONICS SURVEYS LTD
INTER CONTINENTAL ENERGY CORP
LATE CLAIMNICOLA MINING DISTRICT BRITISH COLUMBIA
GEOPHYSICAL a GEOCHEMICAL SURVEY
SOIL GEOCHEMISTRY
COPPER VALUES
Trail
I nterpreted Anomalies see textShoreline
MINIItAL RlsouaCIS BRANCHASSISSMfNTRIIIORT
oIt
Swamp drainage boundary
rJlQtI48
Swamp
Stream intermittent stream
o Claim post
Cut old picket line
Blazed line
SURVEY 8Y DRAWN BY DATE JOB No
H R C B Dec 1981 81 15
N T S SCALE SHEET No
92 H 16W 1 2 500 7
I
JI
ImV
20
oo
10
224 Km to Kentucky Lokes
283KmfoHwy5 mV626 Km to MerTltt
10
10
20
I
mV
20
0
II
II
IIIIIIIII
10
20
mV
20
ID
10
20
mV
20
I
oo
V
oo
IC
oo
N
oo
en
oo
J
oo
10
oo
I
oo
D
oo
V
oo
rQ
oo
o
oo
oo
L 15 00 N
I
I
I
J I 1774h4
30 5 3 13
II
91
I378 47
Z3 Z17735 3 4
I1
111 8b
2 4 1Z 8
II
I
2
18 rn q
1
1j
I
II
I
LI4 00N
III
E3 1
IIIIri
ji
I
o
IVIj
II
I
Ie5 o
IIij
L 13 00 N
30 5 244 122 2 0 72Z 22 0 25 028 1 Z3
II
1 L12 00 N
qZ3423 02834 828 7Z8 1 nD
III
I
I
25
II
II
I
1
I
II
II
III
II
I1
II
I
l 33
L11 00 N
IS
III
3 215 3So 10 4 28 1 122 12
I 10
I 10
II
I
I 25 0
IIS3
2 8 340 3 13 4
III
II
10 85
LIO OON20 I
I1
III
J12 2 5S 21 1
I
I
IIS 3 2 67 6
I
It
II
io
L 9 00 NI15 3
JJ
3 8 41S
20i 6 31 2 23
I
I
III
II I
L S OONI
Ill
I
Iz4 3 3 32 3
1 0
10 4
I mV
20
I
IX
II
20
lI j V
20
j
10
20
II
III
I
rvOJ
0
J
2 44 44 3 37I 8 S 12 2 41 S853 65
l
1I
I
II
rF
L 5 00 N
II
III
II
JI
II
I1 10
J
L 6 00NyLf
10
1 2
fj I
fY
9 33
f14 02 412 8 Z3 8 J2 2
10 I
11I
I
I
f L 4 OON
L I OON
THUMB
1S 3 iff 4 f
h
0 33 6 34 2
oLAKE
Z22 83 10 4
10
20
t
A
I
oI Jr
I iIt
I
L 0 00
5
1
I
3 1 8 S
mV
20
r
toJ
L 2 00 N
20 8 8 0 71
0L
7f159 20 8IO f 2Z o
lL
O
20 II 1
IiII I
1r
LCP
SYMBOLS NOTES LEGEND
x Small outcrop I All odd numbered lines are blazed
and brushed out4 0
200
Self potential gradient in mY Pointsrepresent rise ve or foil ve in voltagefrom western electrode to eastern electrode 50 25 0 25 50 75 100
Outcrop area
Assumed fault2 Location of the N S blazed lines as
shown have been partially interpolated All
are yellow flogged and are the original
Metres
To Accompany Geochemical Geophysica I Report By J M Anderson Geophysicist
Pit trench
Secondary road reconnaissance geochem survey lines GEOTRONICS SURVEYS LTD
Trait INTER CONTINENTAL ENERGY CORP
LATE CLAIMNICOLA MINING DISTRICT BRITISH COLUMBIA
Shoreline
MINERAL RESOURCES 8RANCHASSESSMfNT REltOKT
Swamp drainage boundary
Swamp
GEOPHYSICAL a GEOCHEMICAL SURVEY
INDUCED POLARIZATION SURVEY
SELF POTENTIAL PROFILES
Stream intermittent stream
g 8Blazed line
o Claim post
Cut old picket line
SURVEY 8Y DRAWN 8Y DATE JOB No
81 15
N T S
92 H 16W
SCALE
1 2 500
SHEET No
6J RA Dec 1981J R A
If fZ
III
II
ft f 10
III
1
JI
II
0 ID II
1
IQ IQ
oo
I
224 Km to Kentucky Lakes
283 Km to Hwy 5
626 Km to Merritt
f tflII
III
II
9
8 q r f 10
fZ fO f 10
IIIIIIII
I
N
fO ffO 0
fl
q fl7
q
III
If I4
III
If
q fl
1
lI
2 Z Z 2
IC
q 10
A
II
If 9
i II
113 if
II
tI
4
II
rv
0
I
oo
V
oo
rt
oo
N
oo
oo
en
oo
CD
oo
r
oo
I
oo
V
oo
ID
oo
o
fZ l
r
7f rI
9 8 0
It11
IVI lj
I
1II f
vII
VI
f 10
II
i
B e 1 f 0
Ij
L B e7
7 7
r 0 0 r
0
1 1 7
JB ff
0
fl
It It f 6 B 2 13 if
r tJ if Itl f II 10
rfr I
I
7 fO
II
I
I0
IIII 8
I I
f
1
37 fO ft
I
9 7B8 f
III
Iff 61 0 fz1 If
II 11
III
8 17
I
II
III
10 1 IP 8 7 I
J Jr8 1 I
I Ir1
11
f I
10 j
fI I II
III I1 II I
I 10
I II II I
j
10 A IIIi9 II1R A 9
I11
II1
I
8
I11 7 7
II
JIf
iI
110 IIIII10f 0
I17
I
IIf
I1I
I
II 1069 l111II7
III
II
I II
0 1
V IIj
f II 1
I If I
f 0 19 0 0 1I
1 I
JI
i
I1 Ii 1 7 7 J t II 2 1 1 1 10
I
I Il 9 II II 1
II
I
1I
ITI I i
I 0 3 of z z 0 3 2I
0
I LCP
6 l 8 II
I
1 It 2 ft 7 7
L
II 2 lII I
I llL I
0 12 IZ 4 CT 12 1 4 tz t
i
1 j
1j1 l J
re e 8 8 9
1C o 2 r
I II I i
llL
I 9 II 0 IZ t 2 II pI 3 It 0 ilt
llL
I I if
I
f
I
II
IIII
I
IIII
I
f 10
1
IZ
III
fJI
rif17TtJ7
II
II
II
9
76II7
III
f 7 I
II f iI
B fJlI 11
rIII
5 111I
Ir I
IIII
f y Z
10 6 t1D 7
II
II
II
0 I
I
ItI If 1 0
IIII IffI II IIq
J1i
l
i Aft
II II If I
2
6 q
IZ1 IZ 9 10
q0 9f1
I1
1q 7 It10 q 10 0 I
II
II
rI
II
7
JIII
II
I
II 1I II I1 4 3
I
I I
II
III
I
JIIII
Ih
V tj I8 q q II 2
iP I 1 i II 1
II
II
JI
I1
01
IZ2 II 0 z
II
3
II
fIQ
I IIII
If
1
v Jf7 tett 1 1 9 2 r
fI
11I
9 I I II0
jTHUMB
oLAKE
1
r
OJ
IIJ
1
1 2 2 f3 0 I
1 0 t
I I1
IIII
III I
III
1I
11 13 3 of 1 2
II
r
I1 V 10
I
1A1l 12 I0 I 12 2 z 2 2 t t 2
SYMBOLS LEGEND SURVEY PARAMETERSNOTES
x Small outcrop I All odd numbered lines Ofe blazed 12 Lead values in p p m
Sub anomalous contour
Anomalous contours at values
of 15 17 and 20 pp m
P Interpreted anomalies see text
Mean background value
Sub anomalous threshold value
Anomalous threshold value
10ppm13 pp m
15 pp mOutcrop area
and brushed out
Assumed fault2 Location of the N S blazed lines os
shown have been partially interpolated All
are yellow flagged and ore the original
Shoreline
Pit trench
Secondary road reconnaissance Qeochem survey lines
Trail
Swamp drainage boundaryMlNEIW RISOURa5 IRANCH
ASSESSMENT REJIORTI Swamp
IqfttBStream intermittent stream
o Claim post
Cut old picket line
Blazed line
I1
III
II
IIJ 0
I JfII
7 If IJ
fq 7
II
oo
rt
oo
N
t11 z
0
II
I
I1
III
9
fI
liP II 10
f7 6 9 0
B
P 8 tJ It pIt
9 II 7
q I II
1 0v 0
s
rI
I
I I
r1f
IS
I
1I I
tI
Jl
IIt
0
y 3I
I
2 IZ
II
I
III
I 1
II
1I rI 6
7 9
I
SfIII
2
i
L
oo
oo
o
J
m
L 15 00 N
I
IIiII
1 t
I0
I
I
197tt I
I
PI
I
I
L 14 00 N
L13 00 N
0 0 3
II
I I
z1 112
I
L12 OON3 1
1 III
III
I I
LII OON
q D
LIO OON
L 9 00 N
9
L a OON
II iP J 1
L 7 00N
12 B 9 1
L 6 00N
0 1 2 1 2
L 5 00 N
9
L 4 OON
15 2
l
L 3 00 N
r
L 2 OON
9
L I OON
L 0 00
50 25 0 25 50 75 100 200
To Accompany Geochemical I Geophysical Report 8y J M Anderson Geophysicist
Metres
GEOTRONICS SURVEYS LTD
INTER CONTINENTAL ENERGY CORP
LATE CLAIMNICOLA MINING DISTRICT BRITISH COLUMBIA
GEOPHYSICAL a GEOCHEMICAL SURVEY
SOIL GEOCHEMISTRY
LEAD VALUES
SURVEY BY DRAWN BY DATE JOB No
H R C B Oec 19BI BI 15
N T S SCALE SHEET No
92 H 16W 1 2 500 a
oo
10
oo
v
oo
rt
oo
N
oo
oo
o
oo
en
oo
CD
oo
I
oo
D
oo
10
oo
v
oo
rt
oo
N
oo
oo
o
J
m
l
zf 31
I
v 313 27
III
I15 31A ftJ 5 1
III I
I f2f vM
110 z n
l
i1 r I
Jf1 2t 2
1I I
i II 1
II
J
15 21 So
II
I
L 15 00 N
J
l5
I7 7
I I1 I
1I 11
I I
II I
5 5 Its 0I ID
11
r019 1s si 55 0 4 J
1 11 v
IiiI
i I rI I I
3 37 4tJ H 49 8 I 59 0 I 5iJ I
II 1 I
II
I
II I
33 43 2 2
II
r I1
J
I
11
11 11 4Z I
1
t 5 f1 IZ 3 8
IZ 3I 52 ef
1I
III I9 18 I Ip9 J If
7
II
I9 11 o J5 Zf
ijj
3 IZ z 7 0
j
240 9 2 2 30 3o ls c
n 2 o e 32 6
II
I27
III
34 33
I
f
32 f 6 7
fsa 1 3Z J
11II
II
L 14 00 N
224 Km to Kentuck Lakes
283 Km to Hwy 5
626 Km to MerrItt
fo J tl 110 30
JO 37 3 26
II
II
I
1 5 24 28 21 11 3f50 I 7 2 15
ZD 31 3
1 If
LI3 00N
21 S J8 5f
S9
II
II
11
II
II
2 21 2 23 25 16
II
IZ 27 Z f 5
III
Jz 2 2 3aL1I 25
L41 ft 5
II
ff
2 57 g 5Y 20 3 42
II
z34 34 5Ii
40 33 7I
94
II
1
51 J
1
I
r
1571
z 2
I152
f
I
4tJI III h
1 1
L12 00 N
I
I
i
f3 17
II IIIIIII
IIl
f vIIIIIII II
J I
I51 52
AtIJ
f
3J 2Z 42 Js 7 21 e e6
3 53
I
17 42 28 Jz
rIIII 17
I III
E 7 2ft 2 31 11 ge 30 0 33 1 Iz 535 27 JB orYb 0
L11 OONJI
4 17 8
11
11
I IIifJf 7
13 3 g9 3
l
3 38 t8 Oftzf 21 2615
2Z 2 r23 fr6 2 31 43 37 2
2 27 51 Z9 LIO OON
3 5 59
51 1I I
I1 1
II
II35 1 31
I
I
II
i IIII
It
7 48 Iz oro
okII
n 51 8 v 36 FI I1
I1
ic 4 57 II
I
56 z J8 J
104Z 38
9 3 2 9 3 1
II
II
II
rII
J II I
r4 inI I
J II
II I
I I
I
37 53
If
I
I
I
3t
1
41 s5 I ora 5
11
11II
1
1
I1
50 4 s5 s9
u p ui I
I II II I
I II I
II
30 5
I2
II
2 25 Z 8 II r6 50 31 P go r
L 9 00 N
45 of0 I
II
SSI 50
3Z 21
r
I
II I57 53
I
II
1
f I
ijI
33 3 v
II
L S OON
36 3 h 39 42 4 J5 8 III Z 20 f Z7 all
II
L 7 OON
1
47 17
51 7 47 SZ 3 SO
L 6 00N
Sr 49 50 47 4 40 40 17 41
II
4Z 3 10 3 Z 0 Z6
4 SI
t3
H I l 37r lI II II
I1IIII
1 I
I I
1 I1 I
1
47 Jr4 r
IIII
1
II
I 1
II
4 sd 47 5I
1
1
I III
I II I
I II I
r
IS9 lz St
1
L 5 OON
10 Jc 24 39 5P 41 4 33 41 3 39 24
L4 00NTHUMB
oLAKE
54j x
L 3 00 N
9 6 8
r1
f J a
flj
1I
z 2 39 7
III
H 5 Jf 47 41
I
II
27 21 4
L 2 00Nlie
d2L 10
ft fI
1t
41 3 33 f J J jB 7
4 3241 r
0
IJ
51I I
a Z
1t
I
L I 00 N
Jb
x LCPL 0 00
SYMBOLS NOTES LEGEND SURVEY PARAMETERS
x Small outcrop I All odd numbered lines are blazed
and brushed out
44 Zinc values in p p m
Sub anomalous contour
Anomolous contours at values
of 65 80 and 100 pp m
Mean background value
Sub anomalous threshold value
Anomalous threshold value
40 pp m
53 pp m
65 pp m
w e 0 e w WO 200Outcrop area
rvA Assumed fault2 Location of the N S blazed lines as
shown have been partially interpolated All
are yellow flogged and are the original
reconnaissance geochem survey lines
Metres
To Accompany Geochemical Geophysica I Report By J M Anderson Geophysicist0 Pit J trench
CUI old pickel line
GEOTRONICS SURVEYS LTO
INTER CONTINENTAL ENERGY CORP
LATE CLAIMNICOLA MINING DISTRICT BRITISH COLUMBIA
GEOPHYSICAL a GEOCHEMICAL SURVEY
SOIL GEOCHEMISTRY
ZINC VALUES
Secondary road
ITrail
w Interpreted Anomalies see text
MINERAL RESOURCES lRANCH
MSWMEHT REPORTShoreline
It
Swamp drainage boundary
Ig448Swamp
Stream intermittent stream
D Claim post
Blazed line
a SURVEY 8Y ORAWN 8Y OATE JOB No
H R C B Oec 19BI B 1 15
N T S SCALE SHEET No
92 H 16W 1 2 500 9
Z j J jllrv
I1
III
I
11 1
II
oo
10
22 4 Km to Kentucky Lakes
28 3 Km to Hwy 5
62 6 Km fa Merritt
III
IIIIIIIII
1 II
III
IJI
I
I
X
II
Z Z t
I f
t t
to 1
J
I J
I
II
Z
i jI1
I
III
1
III
I
JI
x
rvrv
0
1
D
I I2 j I
JI
o
III
I
IIJ
II
oo
V
oo
N
oo
If
2 z J2 f r
i
zr
J 1
tr I I Z
1
I1 1
II
1
I
f I
1
I1 1
I XY I
J 1 2 I e I
II1 i l l
I IIj 1
I II
III
II
IIIII
l I r f
IIIII
f f
f
f
II
iI
IIr
oo
oo
CD
oo
oo
o
J
m
3oo
I
3oo
en
oo
Ul
oo
10
oo
o
oo
V
3oo
If
oo
N
y 1 x I
j I 2 j
L 15 00 N
jf I r I r
Z 2
II
I
I
I
It IIj2 j1 2
III
I
2 I
f
IrI
II
I
2 J ft
Z I
L 14 00 NI
IJ 2
I
2 r 2 2
I IIr I
I
1 z JI
r 2 I
II II I
I
II I
II
2 2 1 JI
I I fI I
III
IjII I 1
1
ILI
IL 13 00 N
z
IVI
2L12 00N
I
I f I j
1I
I1 3 1 2
II
I I IZ I I2 I II I
II
I
B I IIIj
I
II
II
i rI
r f II 11 2 I II j I I
If f
1 I
I r 2
IIII I
IJI I Vi I I I J 1
f f f
If
It I I
II II I 1 L A
f f I 1 1 1 J J
III
I Ir
If J J I f t I t
11 r I
10II c I
r
I I 0f 1I
I I
1 I 0
II I I
f 1 I
JI I J I
tli1 J
I I 0
I 0I
1 IY
1 I
i xJ J I 1 I 2
fI
II J 1
2 t I II 2 IZ
IJ
1 f
III
Ii
y
LII OON
I1
III
I
II I
i 1
V z2 I
If
rI
I
fIIII
IJI
1
LIO OON
2
I
t I
2 11 f
L 9 00 NIf
JI
IIff f
f
III
J
II1
i1I v
f Ic
2
I
1
z
0z
cl
1 f r 2
f 1 rl
1 LJ
I 5 ij r
ok
It f f f I 1
Z 1 1
I II J Ii t I
l 1 1 1 11 1
711 1
If 1
I 1 I
I L n
I I
I 1 1 I I I I f l f f tL
1 1
II
II
I I J I fJ
IIIi
I
ff I l
t t ff
II
f t I ff
1
L
1 1 It
SYMBOLS
Small outcrop
Outcrop oree
Assumed fault
PitI trench
J J IfII II fz L 8 00 N
f I
II
L 7 OON
I I JI 2 I II I
I r
2r
L 6 00 N
I I Iy
tZI
I I
2tJf I
jI
f
I
J JZ
I 2
II Io
I z
I
I
fI
L 5 00 N
I 1
I
II
J I I II
iI I 1I
jl
II
I
II
t cl t 12 7 I
I
II
2 f f
i
L 4 00NTHUMB
2 J 2 IoI
I
I
LAKEI z
x
L 3 00 N
1
IZ Z e
L 2 OONI
I1 J L I
1 r
J
f ZJ
I
1i
LCP
I fL I OON
II
22 f I I I f I I
II1
L 0 00
NOTES LEGEND SURVEY PARAMETERS
I All odd numbered lines are blazed 2 Silver values in p p m
Sub anomalous contour50 75 100
Background level
Sub anomalous threshold value
Anomalous threshold value
I p p m
25 pp m
35 pp m
and brushed out 50 25 o 25 200
2 Location of the N S blazed lines as
shown have been partially interpolated All
Metres
To Accompany Geochemical Geophysical Report By J M Anderson Geophysicist
Y Interpreted Anomalies see text
Secondary road
are yellow flagged and are the original
reconnaissance geochem survey lines GEOTRONICS SURVEYS LTO
Trail
Shoreline
Swamp drainage boundary
Swamp
Stream intermittent stream
Claim post
CUI old pickel line
Blazed line
M N RESOURCES BRANCH
ASSESSMENT REPORT INTER CONTINENTAL ENERGY CORP
LATE CLAIMNICOLA MINING DISTRICT BRITISH COLUMBIAlq
GEOPHYSICAL 8 GEOCHEMICAL SURVEY
SOIL GEOCHEMISTRY
SILVER VALUES
SURVEY 8Y DRAWN 8Y DATE J08 No
H R C B Dec 19BI 81 15
N T S SCALE SHEET No
92 H 16W 2 500 10
711
3oo
to
7fl96
717
3oo
V
x
rvrv
0
J
I
k
o
SYMBOLS
Small outcrop
Outcrop area
Assumed fault
Pit trench
Secondary road
Trail
Shoreline
3oo
rt
Swamp
Swamp drainage boundary
Stream intermittent stream
Claim post
Blazed line
Cut old picket line
I
i
I
I
3oo
N
oo
7 13
NOTES
I All odd numbered lines ore blazed
and brushed out
2 Location of the N 5 blazed lines as
shown have been partially interpolated All
are yellow flooged and are the original
reconnaissance geochem survey lines
3oo
o
3oo
J
8214
II
3Ioo
CO
LEGEND
Value in gammas of earth s total
magnetic field less 50 000 t
Contours of values above 57900 tl
in 200 t intervals
Contours of values below 57 100 tl
in 200 tl intervals
3oo
t
3oo
lJ
3oo
to
3oo
V
f
MINERAL RESOURCES BRANCH
94l I
ctJ
II
01
oo
rhI
r
I
tiiI
3oo
N
oo
o
J
CD
3oo
AJ7 r Ibo7
73 86 oS
i
74pL 7S9
789 77
1110
l5
71 8t7711 3
J 7ZtJSN Vl 90
7775tii1 13577 l 70
L 15 00 N
LI4 00N
L 13 00 N
9
L 12 00 N
LII OON
LIO OON
L 9 00 N
L 8 00 N
i3L
7 75
778 Ji7 8 7 20
7S 71
rM 73 Z
50t
25I
o 25 50 75 100
5 00 N
L 4 OON
7zBl
L 3 00 N
L I 00 N
200
Metres
To Accompany Geochemical I Geophysical Report By J U And GJ
M arson eophyslCISt
GEOTRONICS SURVEYS LTD
INTER CONTINENTAL ENERGY CORP
LATE CLAIMNICOLA MINING DISTRICT BRITISH COLUMBIA
GEOPHYSICAL a GEOCHEMICAL SURVEY
MAGNETIC SURVEY
DATA a CONTOURS
SURVEY BY DRAWN BY DATE JOB No
H R C 8 00c I9BI B 1 15
N T S SCALE
92 H 16W 1 2 500
SHEET No
I
I
i
II
Ii
1
1
jJ
i
IiLI
1

oo
10
oo
v
oo
rt
oo
N
oo
oo
o
oo
m
oo
X
oo
f
oo
D
oo
10
oo
v
oo
rt
oo
N
oo
oo
o
J
m
tLI5 00N
THUMB
II
I 1 J 1
I
ll r
p Zd Z3 13 6
I h II
1I
Ji I X f8 1 7 8 3 17
i J IJ I I
1
1
J3 If I Iii s 6
t Z d I I u 6 7
1 111 J
1I
1r ll
r II 1
J Ii
i Z7 8 1r 3
I
8I 3 I II 7
lI
I
S I a ii I II
I
I
I 1r I i1 1
7 J b3a 3
itj if26 Y
T I
0 z
i ur I b I J 7i
I I V
10 4 7 I 6 I z 0 2 o 8 9 5 7 0 z3
rI
II
rI
IJ L I x 2
II 19 7 4f 5 0
leI 171
11
11
vI
i Ji C z 0 e X I
ill 03 41 3 6 e z
I f YI l jI r I l I i I I
f 1 II dI
x 1I 1
1 i I
71 V 2 5 3 2 Z Z 7 3 7 9 9 1 k
c
I
I IIlV I i
B 7 flu 0 6 l Z7 d 5 1 3 2 1
I A 1I Ij
I I I
ll1 I Il I8 I z t z
I
I
III I
j lI
J I1 j IiZ I
fI J
tI
v
II
IIf
L I6 6 6
II II
B IZ z
I x I7 o 8 jhi 5 9 2 It 9 I
0
1
lJ7 z3 Z 7 IS
iI 8 I I V1 B I I I I
I
W r 1 Ji I 1i I 1 0 2 3 2 4
3 3 1 I IS II S IZ
I I1
I z S0
IS0
7t IJ I 1 I 11 jj 3 8 7J S 7 7 Z j 7 5 8
0 q 1 lii 9 9 1 z 9 0 0 z ifl 1 of 0I
II r 11 II I
I I
j II I VII II
I 11
I I
I I I I I1
I I I I II I I I I I I
I I 1 I I11 I I 1 I I
I
1 II I
B 10 1 1 7e 1 S 2 3 7 b 3 eo
f 7 3 e 0 4 Ie I 0 J3 0l I
J I
I
j I
J 1 fI
I 1
I I II
I I I
J 1
1 II I
j1
I 1 11 II
I j I 0 7 If t
7t 7 r b II I I 1 i1 zr or
IiJ II I II II I I I
Ii I 1I I
1 1 I i 311
2 eo i2
3 5 2 I Z 1 9 8
i I I
Ii I 93
I I II I
2v i I I I I I I
3
vCJ
Ii I
I I I1 II I
II I I I
I I Y1 I I
II I
I I
I I I I I
I I
J
I I
I 0I
6 8 z z 0 Ii i 7 0 C7
3
l rz i
Irh 7
fi
II W I j 2I 1 I I
I 1 I
r I II
II I
18
I 8
I 8 0 g I 5 g 7 Z 7I J
z jA A I 0 I Z III 7 6 7
U L 1
I I 4
I I I1 11
I
1
j3 5 tJ z y j 2 Z Z 3 z ojL I h Ii S 3 0
I fl I I I 1 1I I
1c
4I
I I 1i 0
Ii Ir
1 IIlS 01 3j J3 1 b 3 z 7 3 Z 9 II
I II
7I
I V I t 1 8
I GI
lII I II
IJ
t 3 7 7 I Z Ii 7 8 i L 1 ii
jZz
1 111
0 Z 01 j ij
V r LIc tJ
I P I I X 17 q b9 I A1 Z 8 z I
I f j Ylj 0I
C 1I I
I
I1 I
I I 1 I1
j I I
l I J lL
IZ 0 S 4 t7 1 Zlzo 0 1 3 1 z 9 0 4
r f iI
II
1
I i
q
Jl iLll T1
I I9 q f4 0 1 2 s Sl 8 P iI 7J B Z 6 7
I
ji J J
I 1
Vt J
I V I tI I
I I2I 2 4 q q 7 3 0
Iz i1
II
I0 I
1
1I
I
I
IL I gl 3 3 4 1
I @L 0 r
1 5
I
12 7
I I1
I
s Z I z 3 E
fI
I s 6 IS
L 14 00 N
224 Km to Kentucky Lakes
28 3 Km to Hwy 5626 Km to Merritt
I2 0
II
t1m
II
L 13 00 N
z
I I1
I
L12 00 N
10
L II 00 N
i
LIO OON
L 9 00 N
L 8 00 N
t
L 7 OON
L 6 00N
L 5 OON
7
4
J L4 00N
oLAKE
xL 3 00 N
III
I
I II
9 t7 B ii 4
I
I
4
L 2 00NII
13
I 1
0
9 II 0
I
fII
1I
I
1o 8
I
I 5 3 dr
I I I
J I II I
7I II I
II1I
612 7
ill I
oJ L I 00 N
9 3 6 2 8 t0 h
I j5 s z 2 2
L 0 00lCP
SYMBOLS NOTES LEGEND
x Small outcrop 1 All odd numbered lines are blazed 9 Dip angle in degrees of VLF EM field
2 Negative dip angleContour interval 40 for positive values
50 25 0 25 50 75 100 200IOutcrop area
and brushed out
Assumed fault2 Location of the N 5 blazed lines as
MINERAL R SOURCES BRANCH
ASSU NT REPORTMetres
To Accompany Geochemical Geophysical Report By J M Anderson Geophysicist
0 Pit trench
shown have been partially interpolated All
are yellow flagged and ore the originalTransmitter station
Seattle Washington 18 6 kHz
Receiver
Sabre Electronics VLF EM receiver lQqtt GEOTRONICS SURVEYS LTDSecondary road reconnaissance geochem survey lines
k
Swamp drainage boundary b Interpreted anomalies see text VLF TRANSMITTER
SEATTLE
INTER CONTINENTAL ENERGY CORP
LATE CLAIMNICOLA MINING DISTRICT BRITISH COLUMBIA
Trail
Shoreline
Swamp
arGEOPHYSICAL a GEOCHEMICAL SURVEY
VLF EM SURVEY
IStream intermittent stream
D Claim post
Cut old picket line
Blazed lineFRASER FILTERED DIP ANGLE
SURVEY 8Y DRAWN BY DATE
RA C B Dec 1981
JOB No
81 5
N T S
92 H 16W
SCALE
1 2 500
SHEET No
2
oo
10
224 Km fa Kentucky Lakes28 3 K m to Hwy 5
626 Km to Merritt
1 2
I
2 0
oo
V
7
I
III
II
zYI
I
JI
Izo
II
17
II
III
Z 3
oo
rt
17
I
III
II
J
oo
N
Ig
Io
I1II
1
II
II
IJ 14
oo
oo
o
II
II
I
IIII
18
18 20 15
II
I
z t
J
J
09 2
J
IJ
I 3
V11
14
2 3 I j 13
I
II
III
J
1 LI L i
ld
lW
i
III
III
I
MINERAL RESOURCES BRANe
ASSESSIKNT REPORT
IqJQ48rvrv
0
r
I
j
II
I
z 22
IIIIII1
I
III
II
1 7
IIIt
II
II
u
IIl
7 8
i
Z7 2 2 f
a a
I II
IL
7 u J 8
IL
SYMBOLS
Small outcrop
Outcrop area
Assumed fault
Pit1trench
Secondary rood
Trail
Shoreline
Swamp I drainoo boundary
Swamp
Stream intermittent stream
o Claim post
Cut old pIcket line
Blazed line
II
II
II
III
I
c
2 Zl
9 1 9
I
II
II
J1 J
fJ
J
NOTES
2 Z 2 4
I11r
9 1 8
4 I
and brushed out
I All odd numbered lines are blazed
2 Location of the N 5 blazed JInes as
shown hove been partially interpolated All
ore yellow flolilQed and ore the original
reconnaissance geochem survey lines
17
3oo
0
2 08 I
t3 J
Il 11
cc
I
t
2 0 8
2
2 2 20
o
II
2
19
3
1
23
0 1lJ
f1 I
ff
oo
ex
oo
I
oo
to
7 2 1 7 2
J
f III
2 26 2
1
20 23
22
II
II
II
2
I
2
i
17
1 I
9 2
THUMB
n
INSTRUMENT ATION
Huntec M 4 Receiver
Phoenix IPT I Transmitter
Pole dipole array
Dipole length 50 m
Delay time 300 rns
In egration time 65 ms
LAKE
LEGEND2 Chargeability M
Cant our interval I for M 2
d Interpreted anomalies see text
oo
10
oo
V
1
2 122
II
II
II
I
II
IIj
I q I z
III
J
IIIII
J2
2I
U
III
II
20 1 8
23 22 I
I
rI
j
veo
I28
39 e7
jj
I b I
I
I
r
v
oo
rt
oo
N
oo
2I
If
ZI 30 2 2
I
3830 24 31 3
d
2 4
I
II
f
3 a l28
22 2 27
2 02
3
l
e27 e 23
22 2 0 2 3
I
21 8 Z3
Ie
j LCP
50 25 0 25 50 75 100
Metres
oo
o
J
al
L 15 00 N
L 14 00 N
L 13 00 N
L12 00 N
L II 00 N
LIO OON
L 9 00 N
L S OON
L 7 OON
ulL 6 00 N
L 5 00 N
L 4 00N
L 3 00 N
L 2 OON
L I 00 N
L 0 00
200
To Accompany Geochemical Geophysical Report By J M Anderson Geophysicist
GEOTRONICS SURVEYS LTD
INTER CONTINENTAL ENERGY CORP
LATE CLAIMNICOLA MINING DISTRICT BRITISH COLUMBIA
GEOPHYSICAL a GEOCHEMICAL SURVEY
INDUCED POLARIZATION SURVEY
CHARGEABILlTY FOR N 2
SURVEY 8Y DRAWN 8Y DATE J08 No
J R A J R A 00c 1981 81 15
I
N TS SCALE SHEET No
92 H 16W 1 2 500 3
oo
10
oo
v
224 Km to Kentucky Lakes
28 3 K m f 0 Hy 5
62 6 Km to Merritt
8 106
I
III
II
146
I
I
I
IIIIIIIIIIIIII
I II
I
161i 2 S
I
I
1
III
II
JIIIII
I
201
I
II
I ilrI l
Il
206 13
IIII
I
III
II
I
II1IIIIIIIIIIIIIIIIIIIIIIII
I
I
I
2
jII
I
I
17S
Il
I
161
225
0
1
cl
a
73q
27 3 5
SYMBOLS
x
VroJ
0
I
Small outcrop
Outcrop area
Assumed fault
PitJtrench
Secondary rood
Trail
Shoreline
oo
10
I
3
I
341
lL
217
7Z
437
3 q
205
21
270
Swamp drainaoe boundary
Swamp
o Claim post
Stream intermittent stream
Cut old I picket line
B ozed line
oo
J
HZ7
Io
III
I1IIiIII
137 I
II
07 232
16B
238
221 l 1
II
231 207
I
2
A
ok
iLlI
4
1
IIi
NOTES
JI
1373Q
267
jI I
J I
I20 77
IVI lj
oo
J4S
178
78
IIII
jI
IJ
III
I r23
I I
1o
1 0
II
II
oo
o
76
138 12
27 2
211 14 7Iql
In
47 12
271 402
II
30
IX
II
IJI
4 3
lI i
I I
I
I
17
II
I
I1
i
I
II
II
and brushed out
I All odd numbered lines are blazed
2J Location of the N S btazed hnes as
shown have been partially interpolated All
ore yellOW flogged and ere the original
reconnaissance geochem surl8y lines
oo
n
135 107
II
II
q 15434
I
I
137 2t4 22
I
176 2n
2lot 1tZ198
II
I
I
II
II
oJ
o
BOB 574 701
LEGEND
oo
a
oo
x
184 300 3 3 4sq
J
jI
757 77
f
J
If1II
I1M 71
243 175 301 372
103 176 qq
It
294 171
1
227 IU
L
I
THUMB
LAKE
3
254 Apparent resistivity nm for n 2
tA
Ij
II
I
2 D Z62
I
I
I
oo
U
oo
10
710 7065 B
j3 1 2 I
iI
III
li4A 436HI HZ
4752 6
1I
IiI
II
II
3
II
I
1 JII
3 5 Sb4
I
II
2 23 0
I
7 8
y TI
I
If7
f3
II
I
1 III
f1
4
fJ
jf
J
MINERAL RESOURCES 81tANCH
ASSESSMENT REPORT
Q448
oo
V
II
jIII
I
II
I
148
I fI
i
I
oo
rt
2 7 6q z41
f
jr
f6 7i7
J
402 788 H
227
7 714
r
pIfi5
L
ILn
oo
J
oo
oo
o
J
III
L 15 00 N
LI4 00N
L13 OON
L12 00 N
L11 OON
LIO OON
L 9 00 N
L S OON
L 7 OON
L 6 00N
3
L 5 OON
L4 00N
q 2
IIL 3 00 N
L 2 00N
L I OON
L 0 00LCP
200I
Metres
To Accompany Geochemical Geophysical Report By J M Anderson Geophysicist
GEOTRONICS SURVEYS LTD
INTER CONTINENTAL ENERGY CORP
LATE CLAIMNICOLA MINING DISTRICT BRITISH COLUMBIA
314 377
1
5 2 685
GEOPHYSICAL a GEOCHEMICAL SURVEY
INDUCED POLARIZATION SURVEY
APPARENT RESISTIVITY DATA a CONTOURS
Iq q
l58
SURVEY BY DRAWN BY DATE JOB No N TS SCALE SHEET No
J R A J R A Dec 19BI 81 15 92H I6W 2 500 4
1J
SOb 1204
S q 7 146780 71q
ZIO84
I
II
I
I
I J 35 128
8 3 a 7
I
x
I
i
1I
50 25 0 25 50 75 100
L13 00N
L II 00 N
L 9 00 N
L 7 00 N
L 5 00 N
po
M
po
M
po
M
po
M
po
M
INSTRUMENT A TIONHuntec M 4 Receiver
Phoenix IPT I Transmitter
Pole dipole array
Dipole length 50 m
Delay time 300 ms
lnteorotion time 65 ms
oo
It
lH
I
I
21 l l
H 3 0
1 6 z o
7 HI
Z Z
if07
iZ8
2 0
7 7 sz
I
oo
V
oo
rt l
I
s I 14 i636
n
1I
24
Z4 2
1059
402
28
j7
530 72
e o 24
I z 0
2
Ri
I 411 132f 7 7
18 e
II
ll121
1
I
Z28 30
I7 8 I 76
02 37
j
3 H
I
I Z 2
6
ihz 2
HI 14
1ISOj
1 210
I1 4
1556
t
t
I 1301
C3
5
2i1f
3
3 8
IU
MINERAL RESOURCES BRANCH
ASSESSMENT REPORT
Q1t4S
808
8 4
576
Z
oo
N
oo
o
CO
oo
42 j n 412
B 37 604 8n 3
68 80n 2
n
3 Zn
3 7
2n 2
3 8 en 3
0n 4
80n 4
1 8i
l52
0 Z378
n 3
n 2
78n
e 7 2n
3n 2
n 3
3 3n 4
IH2 Jff4
G04 1 21
5
84n 3
n 4
8 i
o6
I sH n
486
2
2
114
13
760n 2
i
28 3
I
631
I iV
3
3 7
3
i
30
n2
2 8 2 0n 2
21n 3
e4 2n 4
n 3
344 5 677n 4
IO 3i
5 78 64n 2
786 780
421 510n
06 606
2 3
27 0 8n 2
2 2 18n
Z
28n 3
2 7 2 3
2n 4
e 3 22
t n 5
3
n 2
227n 4
n 3
13
016 5 78n
lS7
30 2n
G 2 0 2 3n 2
n 32 2 5 2 7
20 21n 4
n 5
50 25 011 01
25 50 75 100 200I
Metres
To Accompany Geochemical Geophysical Report By J M Anderson Geophysicist
GEOTRONICS SURVEYS LTD
INTER CONTINENTAL ENERGY CORP
LATE CLAIMNICOLA MINING DISTRICT BRITISH COLUMBIA
GEOPHYSICAL a GEOCHEMICAL
INDUCED POLARIZATION
SURVEY
RESISTIVITY
SURVEY
PSEUDOSECTIONSa IP
SURVEY 8Y DRAWN BY DATE JOB No
81 15
N T S
92H 16W
SCALE SHEET No
5J R A Dec 1981J R A I 2 500