Embed Size (px)
Citation preview

*28SBY2101*
*28SBY2101*
10940
TIME1 hour 30 minutes.
INSTRUCTIONS TO CANDIDATESWrite your Centre Number and Candidate Number in the spaces provided at the top of this page.You must answer the questions in the spaces provided. Do not write outside the boxed area on each page or on blank pages. Complete in black ink only. Do not write with a gel pen.Answer all eight questions.
INFORMATION FOR CANDIDATESThe total mark for this paper is 75.Section A carries 60 marks. Section B carries 15 marks.Figures in brackets printed down the right-hand side of pages indicate the marks awarded to each question or part question.You are reminded of the need for good English and clear presentation in your answers.Use accurate scientific terminology in all answers.You should spend approximately 20 minutes on Section B.You are expected to answer Section B in continuous prose.Quality of written communication will be assessed in Section B.
ADVANCED SUBSIDIARY (AS)General Certificate of Education
2017
BiologyAssessment Unit AS 2assessing
Organisms and Biodiversity
[SBY21]TUESDAY 6 JUNE, AFTERNOON
Centre Number
Candidate Number
*SBY21*
*SBY21*
New
Specification

*28SBY2102*
*28SBY2102*
10940
Section A
1 (a) Using the key below, identify the five kingdoms of living organisms labelled A–E.
DNA is usually linear
noyes
noyes
noyes
noyes
Most members are unicellular
Cells may have several nuclei
Feeding is always heterotrophic
A
ED
C
B
A _________________________
B _________________________
C _________________________
D _________________________
E _________________________ [5]

*28SBY2103*
*28SBY2103*
10940[Turn over
(b) The largest taxonomic rank shown in the classification system in (a) is kingdom.
In another classification system, two or more kingdoms may form part of a larger taxonomic rank.
Identify this larger taxonomic rank, by completing the list below.
Species
Genus
Family
Order
Class
Phylum
Kingdom
______________________________ [1]

*28SBY2104*
*28SBY2104*
10940
2 (a) Describe how a wave of excitation, which originates in the sinoatrial node (SAN) of the heart, eventually results in ventricular systole.
_________________________________________________________________
_________________________________________________________________
_________________________________________________________________
_________________________________________________________________
_________________________________________________________________
_________________________________________________________________
_________________________________________________________________
_________________________________________________________________
_________________________________________________________________
_________________________________________________________________
_________________________________________________________________
______________________________________________________________ [4]

*28SBY2105*
*28SBY2105*
10940[Turn over
(b) Sick Sinus Syndrome (SSS) is a condition where the SAN malfunctions.The ECGs below are from a healthy individual and an individual with SSS.
ECG from a healthy
person
© Science Source / Science Photo Library
ECG from an individualwith SSS
© Science Source / Science Photo Library
Symptoms of this condition include tiredness and fainting. Using the information in the ECGs, suggest a reason for these symptoms.
_________________________________________________________________
_________________________________________________________________
______________________________________________________________ [1]

*28SBY2106*
*28SBY2106*
10940
3 Many farmers apply chemicals to their fields to kill weeds. An investigation was carried out into the effect of one of these chemicals on biodiversity. The results are summarised in the graph below. (Simpson’s index is a measure of biodiversity.)
Simpson’sindex
Increasing concentration ofchemical applied
0
1
© CCEA

*28SBY2107*
*28SBY2107*
10940[Turn over
(a) Describe and explain the relationship shown in the graph.
Description
_______________________________________________________________
_______________________________________________________________
_______________________________________________________________
Explanation
_______________________________________________________________
_______________________________________________________________
_______________________________________________________________
_______________________________________________________________
_______________________________________________________________
_______________________________________________________________
_____________________________________________________________ [4]
(b) Government regulations are in place to ensure that farmers manage theirhedgerows in a way that promotes biodiversity. One such regulation states thathedgerows should only be cut at certain times of the year.
Suggest when farmers should cut hedgerows and explain how this wouldpromote biodiversity.
_________________________________________________________________
_________________________________________________________________
_________________________________________________________________
_________________________________________________________________
______________________________________________________________ [2]

*28SBY2108*
*28SBY2108*
10940
4 (a) Breathing in mammals depends on changes in pressure within the thoracic (chest) cavity.
Explain the mechanism of inspiration in mammals.
_______________________________________________________________
_______________________________________________________________
_______________________________________________________________
_______________________________________________________________
_______________________________________________________________
_______________________________________________________________
_______________________________________________________________
_______________________________________________________________
_____________________________________________________________ [3]

*28SBY2109*
*28SBY2109*
10940[Turn over
BLANK PAGE
DO NOT WRITE ON THIS PAGE
(Questions continue overleaf)

*28SBY2110*
*28SBY2110*
10940
(b) The volume of air in the lungs of an individual over a one-minute period is shownin the graph below.
5
4
3
2
1
0
Vol
ume
of a
ir in
lung
s/dm
3
0 15 30 45 60
Time/s
X
Y
(i) Name the process taking place at X.
______________________________ [1]
(ii) Describe two ways in which the breathing changes after 30 seconds (theperiod labelled Y).
1. _________________________________________________________
___________________________________________________________
2. _________________________________________________________
_________________________________________________________ [2]
© CCEA

*28SBY2111*
*28SBY2111*
10940[Turn over
(iii) Suggest an explanation for one of these differences.
_______________________________________________________________
_______________________________________________________________
_______________________________________________________________
_______________________________________________________________
_______________________________________________________________
_____________________________________________________________ [2]

*28SBY2112*
*28SBY2112*
10940
(c) The breathing rates of five people were monitored over a five-week period, asshown in the table below.
IndividualAverage breathing rate/breaths minute–1
Week 1 Week 2 Week 3 Week 4 Week 5
A 14 13 15 12 13
B 11 14 12 13 12
C 19 19 20 21 22
D 13 10 14 12 12
E 12 11 13 12 11
(i) Which individual’s average breathing rate showed the largest range duringthe five-week period?
______________________________ [1]
© CCEA

*28SBY2113*
*28SBY2113*
10940[Turn over
Individual C suffers from emphysema.
(ii) Using the information provided, describe fully and explain the data shownfor C.
_______________________________________________________________
_______________________________________________________________
_______________________________________________________________
_______________________________________________________________
_______________________________________________________________
_______________________________________________________________
_______________________________________________________________
_______________________________________________________________
_______________________________________________________________
_______________________________________________________________
_______________________________________________________________
_____________________________________________________________ [4]

*28SBY2114*
*28SBY2114*
10940
5 A leaf on a photosynthesising plant was supplied with radioactive carbon dioxide (14CO2). The numbers on the diagram below show relative levels of radioactivity inthe plant after a period of time.
1.5
2.5
0.5
5.5
10.0
7.0
tight seal
plastic bag
14CO2 added
(a) (i) Name the tissue in the stem where most radioactivity would be detected.
______________________________ [1]
(ii) Name the organic substance which contains most of the radioactivity inthe stem.
______________________________ [1]
© CCEA
*28SBY2115*
*28SBY2115*
10940[Turn over
(b) Describe and explain the distribution of radioactivity in the plant.
_________________________________________________________________
_________________________________________________________________
_________________________________________________________________
_________________________________________________________________
_________________________________________________________________
_________________________________________________________________
_________________________________________________________________
_________________________________________________________________
_________________________________________________________________
_________________________________________________________________
_________________________________________________________________
______________________________________________________________ [4]

*28SBY2116*
*28SBY2116*
10940
6 It was suspected that a pollution incident involving slurry had occurred in a local river.
Oxygen content of the water in the river was measured, both upstream and downstream from the suspected slurry leak. Samples were taken at seven points along the river and the results are shown in the graph below.
0 20 40 60 80 100 120
8
6
4
2
0
Oxy
gen
cont
ent o
f riv
er/a
rbitr
ary
units
Distance/m
(a) (i) Draw an arrow on the x-axis to indicate the point at which slurry is mostlikely to have entered the river. [1]
© CCEA

*28SBY2117*
*28SBY2117*
10940[Turn over
(ii) Describe and explain the effect of the slurry leak on the oxygen content ofthe river.
_______________________________________________________________
_______________________________________________________________
_______________________________________________________________
_______________________________________________________________
_______________________________________________________________
_______________________________________________________________
_______________________________________________________________
_______________________________________________________________
_______________________________________________________________
_______________________________________________________________
_____________________________________________________________ [4]
(b) (i) Calculate the percentage change in the oxygen content of the river between40 and 120 metres.
(Show your working.)
______________________________ % [2]
*28SBY2118*
*28SBY2118*
10940
(ii) Suggest a reason for this change.
_______________________________________________________________
_______________________________________________________________
_____________________________________________________________ [1]
(iii) Suggest how the investigation could be improved in order to determine moreprecisely the site of the slurry leak.
_______________________________________________________________
_______________________________________________________________
_____________________________________________________________ [1]

*28SBY2119*
*28SBY2119*
10940[Turn over
(c) Waterways can also be polluted by fertiliser run-off.The effects of fertiliser run-off and pollution by slurry are different in some ways.Suggest and explain two of these differences.
_________________________________________________________________
_________________________________________________________________
_________________________________________________________________
_________________________________________________________________
_________________________________________________________________
_________________________________________________________________
_________________________________________________________________
_________________________________________________________________
_________________________________________________________________
_________________________________________________________________
_________________________________________________________________
_________________________________________________________________
_________________________________________________________________
______________________________________________________________ [4]
*28SBY2120*
*28SBY2120*
10940
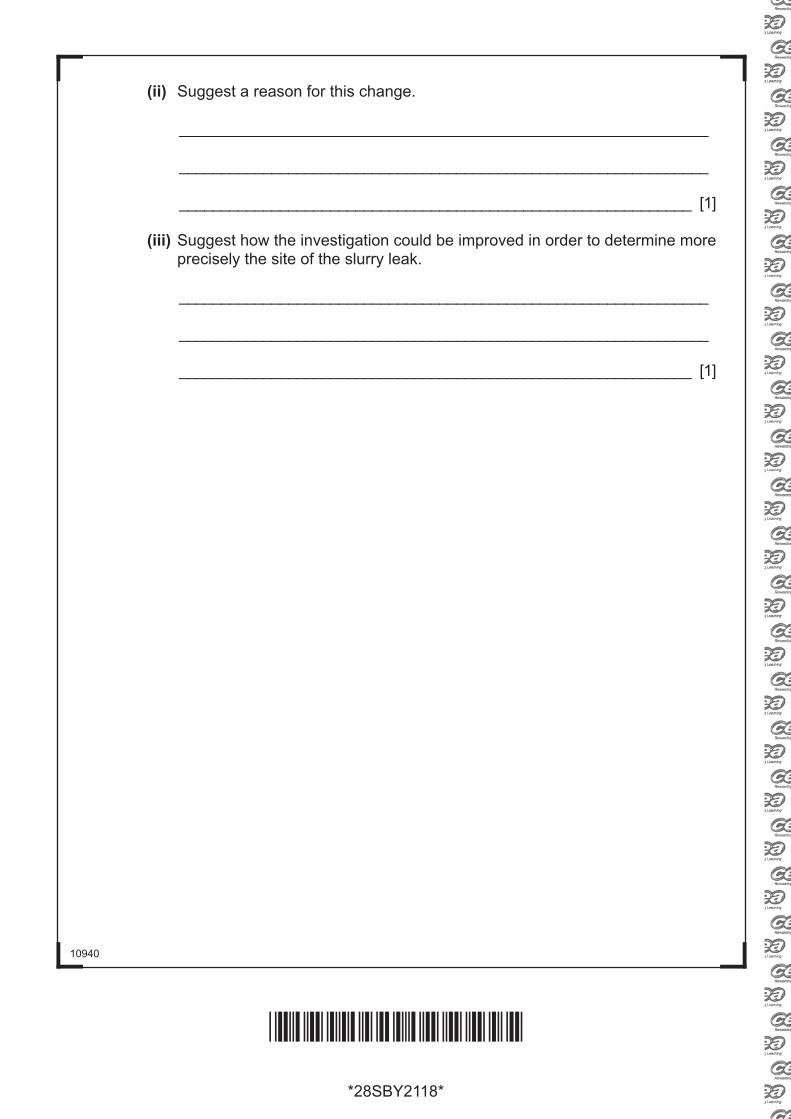
7 (a) Plasma is the liquid part of the blood and transports carbon dioxide, urea, products of digestion, heat, prothrombin, fibrinogen and clotting factors.
(i) Exchange between the blood and the body cells takes place via capillaries,which have very thin walls. Suggest one other way in which the capillarysystem is adapted for exchange.
_______________________________________________________________
_______________________________________________________________
_____________________________________________________________ [1]
The diagram below shows the major blood vessels which carry blood to and from the liver.
LiverHepatic
vein
Hepatic
artery
Hepaticportal vein
(ii) Suggest and explain one difference between the plasma in the hepatic veinand the plasma in the hepatic artery.
_______________________________________________________________
_______________________________________________________________
_______________________________________________________________
_______________________________________________________________
_____________________________________________________________ [2]
*28SBY2121*
*28SBY2121*
10940[Turn over
(b) (i) People suffering from the condition haemophilia are not able to produce Factor VIII. Explain fully why the meshwork which traps blood cells to form a clot cannot be produced in haemophilia sufferers.
_______________________________________________________________
_______________________________________________________________
_______________________________________________________________
_______________________________________________________________
_______________________________________________________________
_____________________________________________________________ [2]
(ii) As haemophilia sufferers cannot form this meshwork, suggest why they should seek urgent medical attention if they cut themselves.
_______________________________________________________________
_______________________________________________________________
_____________________________________________________________ [1]
*28SBY2122*
*28SBY2122*
10940
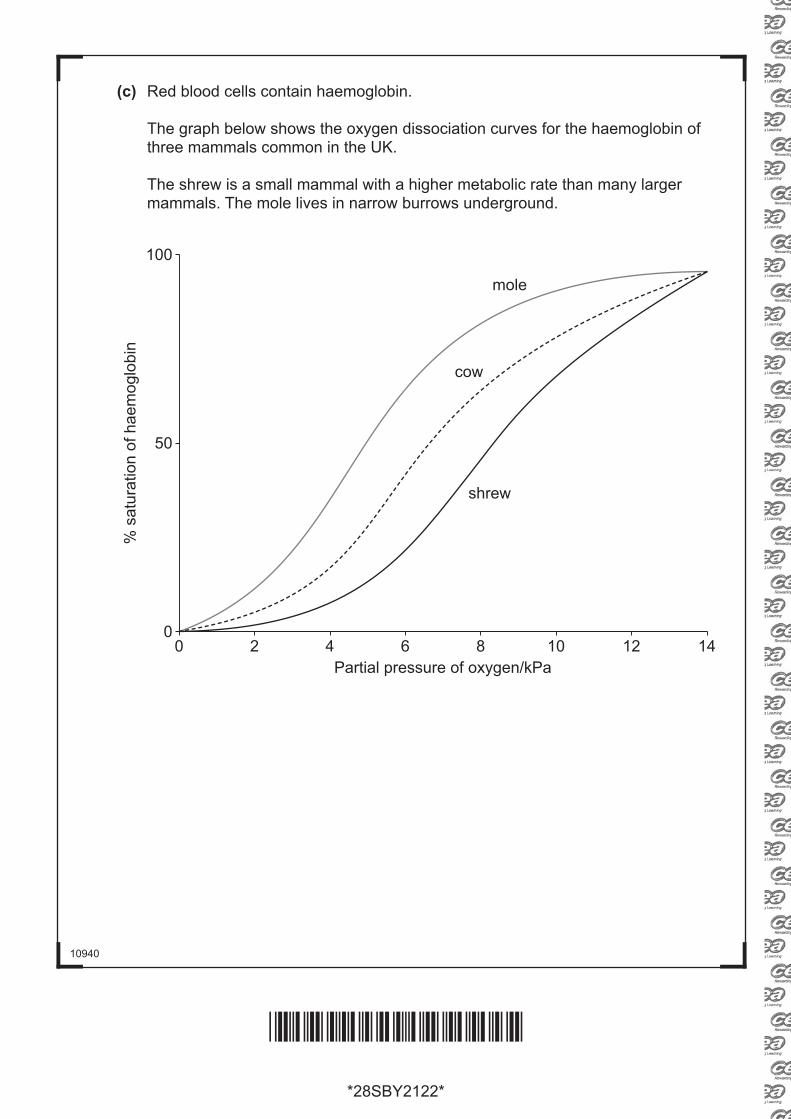
(c) Red blood cells contain haemoglobin.
The graph below shows the oxygen dissociation curves for the haemoglobin of three mammals common in the UK.
The shrew is a small mammal with a higher metabolic rate than many larger mammals. The mole lives in narrow burrows underground.
mole
cow
shrew
100
50
020 4 6 8 10 12 14
Partial pressure of oxygen/kPa
% s
atur
atio
n of
hae
mog
lobi
n

*28SBY2123*
*28SBY2123*
10940[Turn over
(i) Suggest why the oxygen dissociation curve for the mole haemoglobin is to the left of those for the cow and the shrew.
_______________________________________________________________
_______________________________________________________________
_______________________________________________________________
_______________________________________________________________
_______________________________________________________________
_____________________________________________________________ [2]
(ii) Explain the difference between the oxygen dissociation curves for shrew and cow haemoglobin.
_______________________________________________________________
_______________________________________________________________
_______________________________________________________________
_______________________________________________________________
_______________________________________________________________
_______________________________________________________________
_______________________________________________________________
_______________________________________________________________
_____________________________________________________________ [3]

*28SBY2124*
*28SBY2124*
10940
Section B
Quality of written communication will be assessed in this section.
8 Marram grass (Ammophila arenaria) is a xerophytic species found in the sand dunes at Murlough Nature Reserve in Northern Ireland. A. arenaria is most abundant in the dunes closest to the shore, where the soil has very poor water retention.
The European white waterlily (Nymphae alba) is a hydrophytic plant which can be found in ponds throughout the Mourne Mountains.
(a) Using the information above, explain two leaf adaptations expected to be found in A. arenaria and one leaf adaptation expected to be found in N. alba. [6]
(b) Describe and explain how environmental factors affect the rate of transpiration in a mesophytic (typical) plant. [9]
___________________________
(a) Using the information above, explain two leaf adaptations expected to be found in A. arenaria and one leaf adaptation expected to be found in N. alba.
_______________________________________________________________
_______________________________________________________________
_______________________________________________________________
_______________________________________________________________
_______________________________________________________________
_______________________________________________________________
_______________________________________________________________
_______________________________________________________________
_______________________________________________________________
_______________________________________________________________
_______________________________________________________________
_______________________________________________________________

*28SBY2125*
*28SBY2125*
10940[Turn over
_______________________________________________________________
_______________________________________________________________
_______________________________________________________________
_______________________________________________________________
_______________________________________________________________
_______________________________________________________________
_______________________________________________________________
_______________________________________________________________
_______________________________________________________________
_______________________________________________________________
_______________________________________________________________
_______________________________________________________________
_______________________________________________________________
_______________________________________________________________
_______________________________________________________________
_______________________________________________________________
_______________________________________________________________
_______________________________________________________________
_______________________________________________________________
_______________________________________________________________
_______________________________________________________________
_______________________________________________________________

*28SBY2126*
*28SBY2126*
10940
(b) Describe and explain how environmental factors affect the rate of transpiration in a mesophytic (typical) plant.
_______________________________________________________________
_______________________________________________________________
_______________________________________________________________
_______________________________________________________________
_______________________________________________________________
_______________________________________________________________
_______________________________________________________________
_______________________________________________________________
_______________________________________________________________
_______________________________________________________________
_______________________________________________________________
_______________________________________________________________
_______________________________________________________________
_______________________________________________________________
_______________________________________________________________
_______________________________________________________________
_______________________________________________________________
_______________________________________________________________
_______________________________________________________________
_______________________________________________________________
_______________________________________________________________

*28SBY2127*
*28SBY2127*
10940
_______________________________________________________________
_______________________________________________________________
_______________________________________________________________
_______________________________________________________________
_______________________________________________________________
_______________________________________________________________
_______________________________________________________________
_______________________________________________________________
_______________________________________________________________
_______________________________________________________________
_______________________________________________________________
_______________________________________________________________
_______________________________________________________________
_______________________________________________________________
_______________________________________________________________
_______________________________________________________________
_______________________________________________________________
_______________________________________________________________
_______________________________________________________________
_______________________________________________________________
_______________________________________________________________
_______________________________________________________________

*28SBY2128*
*28SBY2128*
Permission to reproduce all copyright material has been applied for.In some cases, efforts to contact copyright holders may have been unsuccessful and CCEAwill be happy to rectify any omissions of acknowledgement in future if notified.
Examiner Number
For Examiner’suse only
QuestionNumber Marks
1 2 3 4 5 6 7 8
TotalMarks
DO NOT WRITE ON THIS PAGE
10940/3
THIS IS THE END OF THE QUESTION PAPER