Embed Size (px)
Citation preview
Page 1 of 51
Assessment Practices Within a Multi-Tiered System of
Supports
Tessie Rose Bailey National Center on Intensive
Intervention, NCII, American Institutes for Research
Amy Colpo CEEDAR Center & NCII
American Institutes for Research
Abby Foley CEEDAR Center & NCII
American Institutes for Research
December 2020 CEEDAR Document No. IC-18
Page 2 of 51
Disclaimer: This content was produced under U.S. Department of Education, Office of Special Education Programs, Award No. H325A170003 and H326Q160001. David Guardino serves as the project officer for the CEEDAR Center and Celia Rosenquist serves as the project officer for NCII. The views expressed herein do not necessarily represent the positions or polices of the U.S. Department of Education. No official endorsement by the U.S. Department of Education of any product, commodity, service, or enterprise mentioned in this website is intended or should be inferred.
Recommended Citation:
Bailey, T. R., Colpo, A. & Foley, A. (2020). Assessment Practices Within a Multi-Tiered System of Supports (Document No. IC-18). Retrieved from University of Florida, Collaboration for Effective Educator, Development, Accountability, and Reform Center website: http://ceedar.education.ufl.edu/tools/innovation-configurations/
Note: There are no copyright restrictions on this document; however, please use the proper citation above.
Page 3 of 51
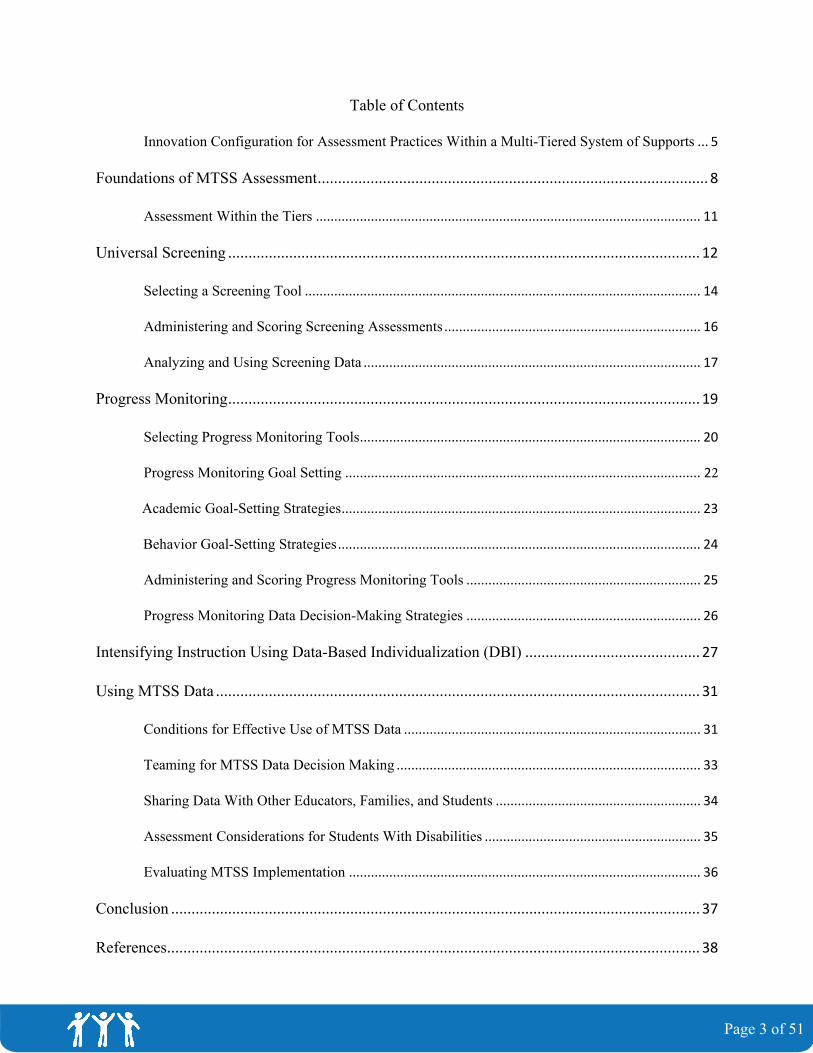
Table of Contents
Innovation Configuration for Assessment Practices Within a Multi-Tiered System of Supports ... 5
Foundations of MTSS Assessment ................................................................................................ 8
Assessment Within the Tiers ......................................................................................................... 11
Universal Screening .................................................................................................................... 12
Selecting a Screening Tool ............................................................................................................ 14
Administering and Scoring Screening Assessments ...................................................................... 16
Analyzing and Using Screening Data ............................................................................................ 17
Progress Monitoring .................................................................................................................... 19
Selecting Progress Monitoring Tools ............................................................................................. 20
Progress Monitoring Goal Setting ................................................................................................. 22
Academic Goal-Setting Strategies .................................................................................................. 23
Behavior Goal-Setting Strategies ................................................................................................... 24
Administering and Scoring Progress Monitoring Tools ................................................................ 25
Progress Monitoring Data Decision-Making Strategies ................................................................ 26
Intensifying Instruction Using Data-Based Individualization (DBI) ........................................... 27
Using MTSS Data ....................................................................................................................... 31
Conditions for Effective Use of MTSS Data ................................................................................. 31
Teaming for MTSS Data Decision Making ................................................................................... 33
Sharing Data With Other Educators, Families, and Students ........................................................ 34
Assessment Considerations for Students With Disabilities ........................................................... 35
Evaluating MTSS Implementation ................................................................................................ 36
Conclusion .................................................................................................................................. 37
References ................................................................................................................................... 38
Page 4 of 51
Appendix ........................................................................................................................................ 46
Innovation Configuration for Appendix: Assessment Practices Within a Multi-Tiered System of
Supports (September 2020) ......................................................................................................................... 46
Page 5 of 51
Innovation Configuration for Assessment Practices Within a Multi-Tiered System of Supports
This innovation configuration (IC) features a matrix that may help guide teacher preparation faculty and professional development providers in the development of the appropriate use of assessment within a multi-tiered system of supports (MTSS) framework. This matrix appears in the appendix of this document.
An IC is a tool that identifies and describes the major components of a practice or innovation. With the implementation of any innovation comes a continuum of configurations of implementation from non-use to the ideal. ICs are organized around two dimensions: essential components and degree of implementation (Hall & Hord, 1987; Roy & Hord, 2004). Essential components of the IC—along with descriptors and examples to guide application of the criteria to course work, standards, and classroom practices—are listed in the rows of the far left column of the matrix. Several levels of implementation are defined in the top row of the matrix. For example, no mention of the essential component is the lowest level of implementation and would receive a score of zero. Increasing levels of implementation receive progressively higher scores.
ICs have been used in the development and implementation of educational innovations for at least 30 years (Hall & Hord, 2001; Hall, Loucks, Rutherford, & Newton, 1975; Hord, Rutherford, Huling-Austin, & Hall, 1987; Roy & Hord, 2004). Experts studying educational change in a national research center originally developed these tools, which are used for professional development (PD) in the Concerns-Based Adoption Model (CBAM). The tools have also been used for program evaluation (Hall & Hord, 2001; Roy & Hord, 2004).
Use of this tool to evaluate course syllabi can help teacher preparation leaders ensure that they emphasize proactive, preventative approaches instead of exclusive reliance on behavior reduction strategies. The IC included in Appendix A of this paper is designed for teacher preparation programs, although it can be modified as an observation tool for PD purposes.
This IC was developed by the National Center on Intensive Intervention (NCII) and the Collaboration for Effective Educator, Development, Accountability, and Reform (CEEDAR) Center. ICs are extensions of the seven ICs originally created by the National Comprehensive Center for Teacher Quality (NCCTQ). NCCTQ professionals wrote the above description.
Page 6 of 51
The Individuals with Disabilities Education Act (IDEA, 2018) and the Every Student
Succeeds Act (ESSA, 2015) place an emphasis on the use of a multi-tiered system of supports
(MTSS) to increase all learners’ access to effective academic and behavioral instruction. Within
MTSS, student-level data are used to match instruction to student needs and for frequent
progress monitoring so that struggling students are identified early and provided services
promptly. To accomplish this task, educators need to use academic and nonacademic student
assessment data to both inform and improve instruction. A recent study identified 23 studies
meeting rigorous standards of evidence that found teachers’ use of formative assessment has
been shown to have a significant and positive effect on student learning in mathematics, reading,
and writing (Klute, Apthorp, Harlacher, & Reale, 2017). However, research also suggests that
teachers often struggle with analyzing and interpreting assessment data, and their likelihood of
using data in decision making is affected by how confident they feel about their knowledge and
skills in data analysis and data interpretation (U.S. Department of Education, 2008; 2016).
Likewise, studies suggest that teachers’ fundamental assessment and measurement knowledge is
insufficient (Supovitz, 2012). Yet, reports continue to indicate that teacher preparation programs
generally do not include data literacy knowledge and skills (data analysis or data-driven
decision-making processes) within their coursework or field experiences (Choppin, 2002;
Mandinach & Gummer, 2013).
In 2014, the Data Quality Campaign (DQC; see https://dataqualitycampaign.org/) defined
data literacy and recommended that states include data literacy skills in their teacher preparation
policies. Since then, research has emerged, including suggestions about how preparation
programs can integrate data literacy knowledge and skills within their coursework and field
experiences, citing the key role that teacher educators play in developing the data literacy skills
Page 7 of 51
of teachers (Madinach & Gummer, 2016; Salmacia, 2017). Nonetheless, change within
preparation programs has been slow (Bocala & Boudett, 2015; Mandinach, Friedman, &
Gummer, 2015). Ensuring that teachers are comfortable with and proficient in utilizing different
types of data to make instructional decisions takes time, extending beyond preservice into
inservice, and includes multiple practice-based opportunities to hone the skills and confidence
needed to support instruction and learning (Data Quality Campaign, 2014; Mandinach &
Gummer, 2013). This degree of data literacy cannot be replaced with technological
advancements of data systems and tools but is, rather, essential to teachers’ expertise and ability
to operate effectively within a schoolwide data culture (Mandinach & Gummer, 2016). Teacher
educators and programs have an important responsibility to equip preservice teachers with the
knowledge and skills to administer, score, and interpret a variety of assessments to support data-
based educational decision making.
This innovation configuration (IC) can serve as a foundation for strengthening existing
preparation programs so that educators exit with the ability to use various forms of assessment to
make data-based educational and instructional decisions within an MTSS. The expectation is that
these skills can be further honed and supported through inservice as practicing teachers As such,
this IC examines the following:
• Foundations of MTSS Assessment
• Universal Screening
• Progress Monitoring
• Intensifying Instruction Using Data-Based Individualization (DBI)
• Using MTSS Data
Page 8 of 51
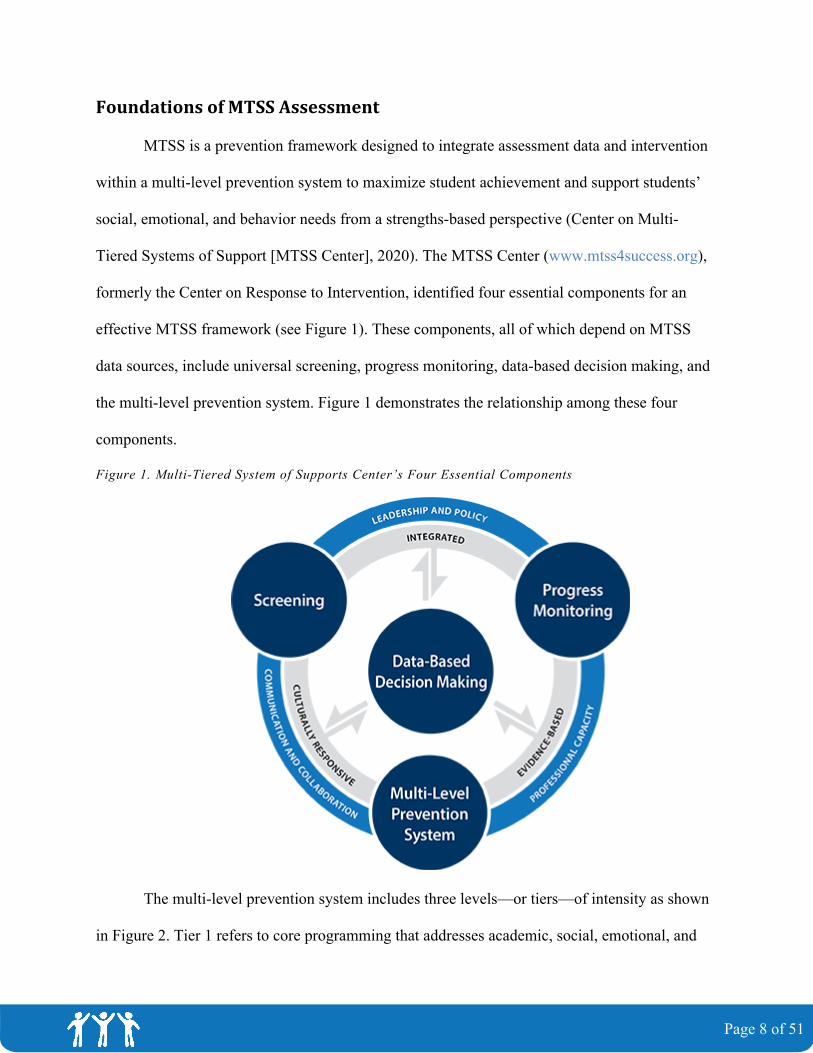
Foundations of MTSS Assessment
MTSS is a prevention framework designed to integrate assessment data and intervention
within a multi-level prevention system to maximize student achievement and support students’
social, emotional, and behavior needs from a strengths-based perspective (Center on Multi-
Tiered Systems of Support [MTSS Center], 2020). The MTSS Center (www.mtss4success.org),
formerly the Center on Response to Intervention, identified four essential components for an
effective MTSS framework (see Figure 1). These components, all of which depend on MTSS
data sources, include universal screening, progress monitoring, data-based decision making, and
the multi-level prevention system. Figure 1 demonstrates the relationship among these four
components.
Figure 1. Multi-Tiered System of Supports Center’s Four Essential Components
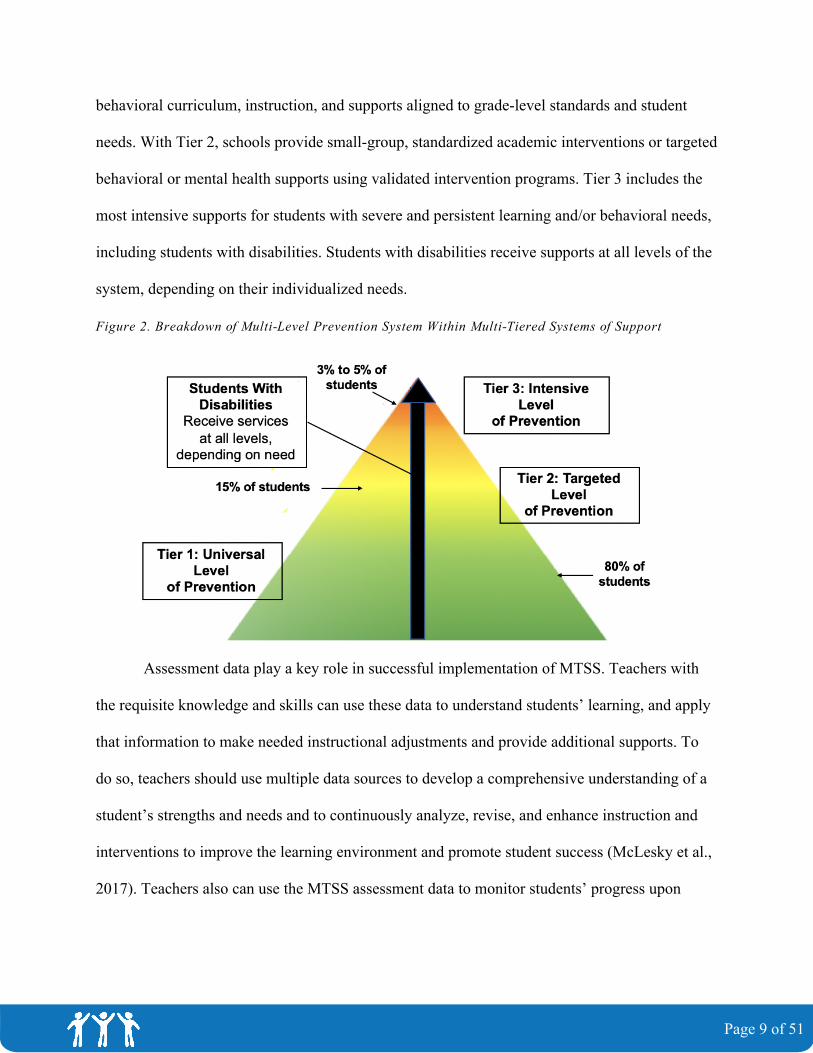
The multi-level prevention system includes three levels—or tiers—of intensity as shown
in Figure 2. Tier 1 refers to core programming that addresses academic, social, emotional, and
Page 9 of 51
behavioral curriculum, instruction, and supports aligned to grade-level standards and student
needs. With Tier 2, schools provide small-group, standardized academic interventions or targeted
behavioral or mental health supports using validated intervention programs. Tier 3 includes the
most intensive supports for students with severe and persistent learning and/or behavioral needs,
including students with disabilities. Students with disabilities receive supports at all levels of the
system, depending on their individualized needs.
Figure 2. Breakdown of Multi-Level Prevention System Within Multi-Tiered Systems of Support
Assessment data play a key role in successful implementation of MTSS. Teachers with
the requisite knowledge and skills can use these data to understand students’ learning, and apply
that information to make needed instructional adjustments and provide additional supports. To
do so, teachers should use multiple data sources to develop a comprehensive understanding of a
student’s strengths and needs and to continuously analyze, revise, and enhance instruction and
interventions to improve the learning environment and promote student success (McLesky et al.,
2017). Teachers also can use the MTSS assessment data to monitor students’ progress upon
Page 10 of 51
receiving supports, evaluate the evidence of interventions and supports, and assess core
programming effectiveness.
Effective educators depend on summative, formative, and diagnostic data to implement
the essential components of MTSS. Summative assessments are a type of outcome measure that
provide data at the end of student learning and are generally based on end-of-year or unit
outcomes outlined in state standards and benchmarks. Common examples are state- or district-
wide assessments. Teachers use summative assessment data to judge the effectiveness of their
teaching and make adjustments to improve the learning of future students (Ainsworth &Viegut,
2006). Statewide summative assessments are often used to determine if students have met state
standards and, in some cases, to make high-stakes decisions about grade promotion or graduation
(Burke, 2010). They also may be used to inform decisions regarding student programming and
the overall effectiveness of MTSS.
While summative assessments serve as an indicator of learning, formative assessments
give insight into whether or not the progress is occuring (Burke, 2010; Klute et al., 2017). They
provide data about student learning during instruction and help teachers determine if instruction
is effective and/or when to adjust instruction. They also support evaluation of instruction for
individual or groups of students. Formative assessments used within an MTSS may include both
informal and formal measures. Many teachers are familiar with informal measures of learning
that provide immediate feedback about student learning, such as observations of behavior,
checklists, or writing samples. Effective teachers use informal formative assessment to monitor
the progress of their students during instruction so that they can reteach or adjust their instruction
as needed. Formal formative assessments in MTSS include universal screening and progress
monitoring validated measures. These assessments, which will be discussed in greater detail in
Page 11 of 51
later sections, differ from informal assessments because they require valid and reliable tools
delivered in a standardized way.
Diagnostic assessments differ from formative assessments in that they help educators
identify strengths and weaknesses and determine how to adjust instruction and provide data
about students’ current knowledge and skills. They also can help identify the appropriate
intervention platforms and to inform adaptations that would benefit an individual or group of
students (Harlacher, Nelson, Walker, & Sandford, 2010).They can be informal, which are easy-
to-use tools that can be administered with little training, or standardized, which must be
delivered in a standard way by trained staff. Standardized diagnostic tools, which require more
time to administer and interpret, may be required for students who continually demonstrate a
lack of response or who require special education. Because diagnostic data provide detailed
information about individual student learning, assessments are typically administered only to
some, not all, students (Torgesen & Wagner, 1998). For examples of formal diagnostic tools
used within an MTSS, visit the National Center on Intensive Intervention’s (NCII’s) table of
diagnostic tools (NCII, n.d.a).
Assessment Within the Tiers
Different types of assessments are used at different levels within the multi-level
prevention system. At Tier 1, educators use a balance of different assessments to make student-,
class-, school-, and district-level decisions. Universal screening assessments should be validated,
standardized, and administered to all students at least two times (e.g., beginning and middle)
during the school year (Gersten et al., 2009. Screening data, which may be considered a type of
formal formative assessment, help educators identify students who may need additional
assessment and instruction, and they can help assess the impact of core programming for all
Page 12 of 51
students. Summative data, like state assessments and end-of-unit tests, assist teachers in program
decisions and evaluation of student performance. Informal progress and other classroom data
support teachers in making daily instructional decisions, such as differentiating instruction for
struggling students, reteaching or preteaching, and pacing and feedback.
Despite the delivery of high-quality core programming, some students will need
supplemental supports. As the intensity and frequency of these supplemental instructional or
intervention supports increase, so do the intensity of assessments. Although screening data
support identification of students who may need Tier 2 and Tier 3 supports, additional data are
needed to inform instructional decisions for students who require intervention. Christ and
Silberglitt (2007) found that six to nine data points were necessary for making decisions about
students’ response to supports at Tiers 2 and 3. As result, formal progress monitoring data
represent a key data source for decision making at these levels of intensity. Diagnostic data also
are important for ensuring that interventions are matched to student needs and supporting the
hypothesis development necessary for intensifying interventions. Given the intensity of
assessment data collection and use, Tier 2 and 3 assessments are generally limited to those
students receiving supplemental and intensive interventions
Universal Screening
The purpose of universal screening is to evaluate the efficacy of core programming; to
identify students who may be at risk for poor learning or social, emotional, and behavioral
outcomes (i.e., not meeting end-of-year benchmarks or schoolwide expectations); and to identify
students who need more intensive services provided through Tier 2 or 3 intervention. Effective
implementation of universal screening requires that educators possess the knowledge and skills
of screening’s three critical features (Center on RTI, 2014):
Page 13 of 51
1. Validated screening procedures
2. Risk verification
3. Valid and reliable screening tools
Validated screening procedures ensure that all students are screened with fidelity more
than once a year (Center on RTI, 2014). Gersten and colleagues (2008; 2009) noted that
universal screening should occur for all elementary students at least twice a year, generally the
beginning and middle of the school year. However, it is common for schools to conduct
screening assessments three times a year (i.e., fall, winter, and spring). The spring screening
assessment data are generally used for program evaluation, program planning, and continuous
improvement rather than identifying individual risk status. In secondary settings, many schools
use early warning systems to identify students at risk for not meeting desired educational
outcomes, such as school completion, academic success, and college and career readiness
(American Institutes for Research, 2019; U.S. Department of Education, 2016). An early
warning system uses research-based indicators, such as attendance or course grades, to identify
students at risk. Regardless of the procedures used, screening should include the use of cut scores
or benchmarks to support risk identification. Over the last decade, many published tools or early
warning systems have established national norms, indicators, or growth rates to support
educators in making screening decisions.
Risk verification is a critical feature of a validated screening process. The NCII screening
tools charts (NCII, 2019) make clear that existing screening tools are not 100% accurate. As a
result, schools risk over- and under-identifying students in need of additional intervention and
assessment, which can be costly. The MTSS Center recommends that at least two data sources
are used to confirm students’ risk status through triangulation of data (Center on RTI, 2014).
Page 14 of 51
These data may include measures of classroom performance, performance on state assessments,
diagnostic data, or short-term progress monitoring data.
NCII defines screening as a process that uses “tools with convincing evidence of
classification accuracy, reliability, and validity to identify students who may require intensive
intervention efforts to meet their academic needs” (2020, p. 2). Educators should be able to
articulate the existing evidence for their screening tools (Center on RTI, 2014) and understand
that screening tools vary by domain and age span. At the elementary grades, educators select
screening tools that cover critical math instructional objectives (Gersten et al., 2009) and
indicators of poor literacy outcomes (Gersten et al., 2008). At the secondary level, early warning
systems use several validated indicators—course performance, attendance, and
behavior/suspension data—to identify students at risk (Allensworth & Easton, 2005; 2007).
When selecting appropriate screening tools, educators must consider their needs, context, and
desired outcomes. Existing resources, including the Selecting an MTSS Data System and NCII
Screening Tools Charts, are useful tools for building educators’ capacity to select appropriate
tools for MTSS screening.
Selecting a Screening Tool
To select and effectively use screening data, educators need knowledge and skills to
analyze the technical adequacy and usability of potential screening tools. At a minimum,
screening tools must be valid and reliable, strongly correlate with relevant outcomes, and
accurately predict risk status, also known as classification accuracy (NCII, 2019). Classification
accuracy is important because it provides essential information about how well the screening tool
accurately classifies students as at risk or not at risk. The classification accuracy is impacted by
the tool’s sensitivity, or the probability of correctly identifying a student at risk, and specificity,
Page 15 of 51
or the probability of correctly identifying a student not at risk. Increasing educators’
understanding of the technical standards necessary for screening tools can help them not only
select valid and reliable tools for screening but effectively use these data for instructional and
program decision making. NCII publishes information about the technical rigor of published
tools and, in collaboration with the National Center on Improving Literacy (NCIL), shares
resources to help build educators’ understanding of these and additional technical standards
necessary for screening tools (see Box 1).
Box 1. Educator Tools for Understanding and Evaluating the Technical Adequacy of Screening Tools NCII’s Series: Understanding Screening: What Do the Technical Standards Mean? 1. Classification Accuracy—Extent to which the tool accurately groups student into at risk and
not at risk2. Validity—Extent to which the screening tool measures what it is supposed to measure3. Reliability—Extent to which the tool results in consistent information4. Statistical Bias—Extent to which the screening assessment is biased against different groups
of students5. Sample Representativeness—Extent to which a group closely matches the characteristics of
its population as a whole
NCII’s Screening Tools Charts 1. Academic Screening Tools Chart2. Behavior Screening Tools Chart
When selecting screening tools, educators also must consider the usability of the tool,
particularly the administration format, administration and scoring time, and scoring format.
Usability can impact students’ time away from instruction or intervention as well as increase the
burden on the teacher or administrator. Educators also should select tools that have established
benchmarks, or cut scores, as well as recommended decision rules for interpreting the screening
data (NCII, 2019). Decision rules may include how students are identified as at risk or not at risk,
rules for risk verification, or rules for administration to specific groups of students. Although
Page 16 of 51
each tool will likely have its own decision rules, educators must be able to understand and apply
the rules associated with the selected tool.
Understanding the appropriateness and location of screening cut scores or benchmarks
also is an essential skill for educators. A cut score is a score on a screening measure that divides
students who are considered potentially at risk from those who are not at risk (Gandhi, 2019).
Screening cut scores help teams make decisions about who will receive additional intervention
and assessment as well as assess the efficacy of core programming. When assessing Tier 1
effectiveness, teams look for evidence that at least 80% of students are at or above the
established cut score. Cut scores, and information about how they were established, are generally
found in the technical manuals associated with the tool. This information also can be found for
reviewed tools on the NCII screening tools charts (NCII, 2019).
How the cut score is set may impact how many and which students are identified as at
risk. Thus, it is important to use realistic cut scores that will help distinguish between students
who are struggling in academics and/or behavior as opposed to those students who are making
adequate progress.
Administering and Scoring Screening Assessments
For effective implementation of MTSS, educators must possess the knowledge and skills
for administering and scoring screening tools. Screening instruments are generally divided into
two administration formats: individual or group administration. Administration and scoring times
vary by the tool and can range from 1 minute to 30 minutes. Computer-adapted screening tools,
which are typically administered in group settings, often take longer to administer because there
are more items. Individual measures, such as curriculum-based measurement (CBM; Deno,
1985) or the Student Risk Screening Scale (SSRS; Drummond, 1994), can take as little as 1–2
Page 17 of 51
minutes to administer and score per student. CBM tools are commonly used to screen literacy but
also be used to screen mathematics, spelling, and writing (Hosp, Hosp, & Howell, 2007).
Behavior screeners, which often depend on teacher ratings, can screen for internalizing and
externalizing behaviors (see Lane et al., 2015; Lane et al., 2016). Educators must understand that
the administration procedures of a tool are dependent on its purpose, content area, and format.
The usefulness of screening data depends on the accuracy of the data. Educators must
have fidelity to each component of the screening process. Taylor (2009) found that some
educators struggle with consistently and accurately administering, scoring, and entering data.
Errors in scoring administration are the most common and can result from giving incorrect
instructions, providing inappropriate assistance, altering assessment protocols (e.g., increasing
assessment time), or making changes due to the environment. Scoring errors, can result when an
individual incorrectly scores a student’s response or uses inconsistent scoring procedures. Data
entry errors, although less common, can result while entering and transferring data. Over the last
two decades, advances in technology have led to the availability of automatic scoring, which can
reduce both scoring and data entry errors. Despite the increased technological capability, all
educators should understand how to manually score academic and behavior tools, where
appropriate. Understanding how tools are scored can help teams interpret and use individual or
group screening data for decision making. Errors can also be reduced by providing ongoing
training and practice opportunities coupled with coaching (NCII, n.d.b.). Adhering to
administration and scoring requirements also can improve the quality of the screening data.
Analyzing and Using Screening Data
Many screening tools are available as part of a comprehensive data system and allow
users to access summary reports of school, grade, class, and individual screening data (Center on
Page 18 of 51
RTI, 2014). Because each MTSS data system may summarize and report data differently,
educators need to possess the knowledge and skills of how these data may be reported and how
different reports may be used to support decision making. As mentioned previously, educators
should be able to first articulate the evidence for their selected tool and then ensure the data are
accurate.
Screening data can support decision making at all levels of an education system, from the
district level to the student level. Prior to analysis, educators should clarify how the data will be
used and why they will be used in that way. District teams may use screening data to problem-
solve and make decisions about districtwide program improvement and curriculum, innovation
and sustainability, allocation of resources, and equitable services and supports across schools.
School teams may use screening data to identify school- and grade-level trends, monitor the
effectiveness of schoolwide curriculum and supports, determine areas of need, and provide
guidance on how to set measurable schoolwide goals. Using data to improve district- and school-
level supports can improve the infrastructure and supports necessary for educators to provide
high-quality instruction. Teachers may use classwide screening data to support decisions
regarding instructional grouping, placement in the next grade level, effectiveness of core
programming, and identification of students in need of additional supports at Tiers 1, 2, and 3
(Kovaleski & Pedersen, 2008). Prior to using screening data for identifying individual students
for supplemental supports at Tiers 2 and 3, educators should use screening data to evaluate
whether core instruction at Tier 1 is effective for most students and develop a plan for
improvement (Metcalf, n.d.).
Decisions about screening risk status should be operationalized with clear, established
decision rules prior to administration of the tool. Written decision rules or decision trees can
Page 19 of 51
facilitate the analysis and use of screening data. For example, VanDerHeyden (n.d.) suggested
that when large numbers of students are identified as at risk during screening, educators should
examine the adequacy of their core instruction at the school, grade, or class level. Once a plan is
in place to improve core programming, teams can move to identifying students in need of group
or individualized interventions through validated risk verification procedures, including progress
monitoring.
Progress Monitoring Progress monitoring is an essential feature of MTSS assessment that has been shown to
positively impact student performance in academics and behavior (see Bruhn, McDaniel, Rila, &
Estrapala, 2018; Gersten et al., 2008; Gersten et al., 2009). Progress monitoring data can be used
to (1) confirm risk status and identify students who need additional intervention or assessment,
(2) estimate rates of improvement, and (3) compare the efficacy of different forms of instruction
(Stahl & McKenna, 2012). Progress monitoring data help teachers determine if and when
instructional changes are needed. However, they are generally not sufficient on their own for
determining the nature of the changes needed. Progress monitoring should not be confused with
informal monitoring progress essential for daily instruction. Effective teachers use informal,
often unstandardized, assessment approaches to make immediate, real-time instruction changes.
This differs significantly from progress monitoring within MTSS. Progress monitoring is
administered to only a few students, generally no more than 20% of the student population, using
standardized, valid, and reliable tools. Progress monitoring requires repeated assessment over
time (e.g., weekly for six to nine data points) that are graphed and compared with a goal set
using validated strategies. Validated progress monitoring data can be used as part of entitlement
decisions (e.g., eligibility for special education services) and to determine the effectiveness of an
Page 20 of 51
intervention or instructional program. Effective implementation of progress monitoring requires
identification of an appropriate valid, reliable assessment tool and implementation of
standardized procedures for collecting data (Center on RTI, 2014).
Standardized procedures should include:
• Frequency of data collection and analysis
• Procedures for monitoring fidelity
• Procedures for setting goals
In most cases, progress monitoring assessments should be administered at least monthly
for students identified for Tier 2 academic interventions and supports, and at least weekly for
students identified for intensive intervention at Tier 3. Depending on the target behavior,
progress monitoring for nonacademic skills and behaviors may be more frequent (daily, hourly).
Like screening, there should be procedures in place to ensure the accuracy of progress
monitoring implementation. This includes confirming that the appropriate students are tested (as
opposed to testing everyone), applying decision-making rules consistently to determine changes
in intervention, and ensuring that scores are accurate by monitoring trends over time.
Selecting Progress Monitoring Tools
To select and effectively use progress monitoring data, educators need knowledge and
skills to analyze the technical adequacy and usability of potential progress monitoring tools. At a
minimum, progress monitoring tools must (1) have a sufficient number of alternate forms, (2)
specify minimum acceptable growth, (3) provide benchmarks, and (4) possess validity and
reliability for the performance score (NCII, 2019). Increasing educators’ understanding of the
technical standards necessary for progress monitoring tools can help them not only select valid
Page 21 of 51
and reliable tools for progress monitoring but effectively use these data for individual
instructional and program decision making.
Progress monitoring assessments should be short and frequent skill-based assessments
that offer a snapshot of student learning related to the instructional objective across both
academics and behavior. Like screening, progress monitoring tools vary by grade span and
domain. Academic progress monitoring tools measure student academic growth over a set period
of time, and behavior progress monitoring tools measure behavioral progress. When selecting
progress monitoring tools to be used with students who are at risk, teachers need to understand
that there are two common types of measures: single-skill mastery measures and general
outcome measures (GOMs). These measures serve different purposes for teachers—single-skill
mastery measures are measures of short-term or single skills, while GOMs are measures of
student performance toward an end-of-year goal. The key difference between single-skill
measures and GOMs is the comparability of data longitudinally, or the ability to look at data
across time. With GOMs, educators can compare a student’s score in May with their score in
September or compare the student with their peers or a national benchmark. This cannot be done
with single-skill measures because each subskill is tracked separately. GOMs also allow teachers
to determine if students are retaining taught skills and generalizing to skills that have not yet
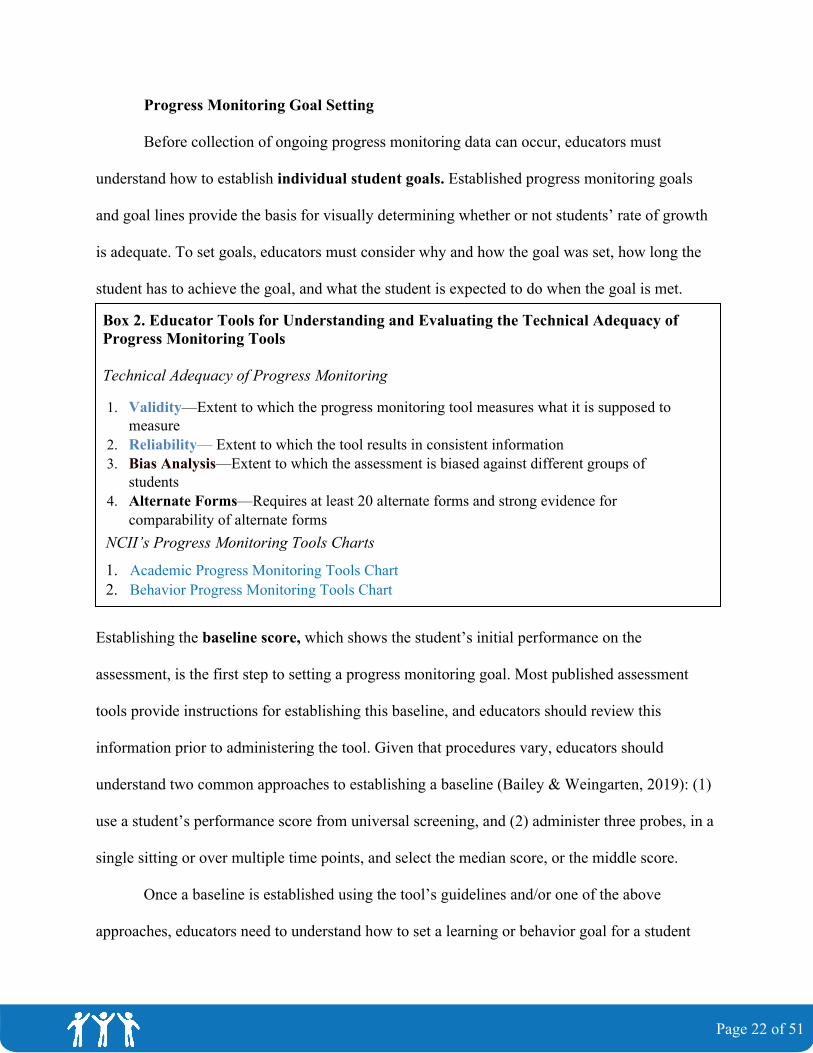
been taught. Box 2 includes resources to support educators in selecting academic and behavioral
progress monitoring tools.
Page 22 of 51
Progress Monitoring Goal Setting
Before collection of ongoing progress monitoring data can occur, educators must
understand how to establish individual student goals. Established progress monitoring goals
and goal lines provide the basis for visually determining whether or not students’ rate of growth
is adequate. To set goals, educators must consider why and how the goal was set, how long the
student has to achieve the goal, and what the student is expected to do when the goal is met.
Establishing the baseline score, which shows the student’s initial performance on the
assessment, is the first step to setting a progress monitoring goal. Most published assessment
tools provide instructions for establishing this baseline, and educators should review this
information prior to administering the tool. Given that procedures vary, educators should
understand two common approaches to establishing a baseline (Bailey & Weingarten, 2019): (1)
use a student’s performance score from universal screening, and (2) administer three probes, in a
single sitting or over multiple time points, and select the median score, or the middle score.
Once a baseline is established using the tool’s guidelines and/or one of the above
approaches, educators need to understand how to set a learning or behavior goal for a student
Box 2. Educator Tools for Understanding and Evaluating the Technical Adequacy of Progress Monitoring Tools
Technical Adequacy of Progress Monitoring
1. Validity—Extent to which the progress monitoring tool measures what it is supposed to measure
2. Reliability— Extent to which the tool results in consistent information3. Bias Analysis—Extent to which the assessment is biased against different groups of
students4. Alternate Forms—Requires at least 20 alternate forms and strong evidence for
comparability of alternate formsNCII’s Progress Monitoring Tools Charts
1. Academic Progress Monitoring Tools Chart2. Behavior Progress Monitoring Tools Chart
Page 23 of 51
prior to beginning an intervention. Educators should understand the differences between setting
academic and behavior goals.
Academic Goal-Setting Strategies
For students who will be receiving Tier 2 academic supports, research suggests first
considering the use of end- or middle-of-year benchmarks to set student performance goals
(Shapiro, 2008). This goal-setting approach is considered the most simplistic option and is
appropriate for most students receiving Tier 2 services. To set a student’s goal, an educator must
identify the grade-level benchmark score for the middle or end of the year, relative to a student’s
grade level or performance level. Educators should plan to use benchmarks as goal levels when
the student is monitored at their enrolled grade level.
Academic goals may also be set using different methods than the benchmark goal-setting
strategy previously described. Educators must know how to set goals based on rate of
improvement (ROI) and/or the intra-individual framework, also referred to as the student’s rate
of improvement (SROI). ROIs often are normed (either nationally or locally), which helps
educators compare an individual student’s performance with a sample of students. These norms
are often identified by the assessment developer as what would constitute appropriate growth.
ROIs, in that sense, will vary based on what is being assessed. The standard formula for setting a
goal using norms for weekly ROI is Goal = ROI × # Weeks + Baseline Score (Bailey &
Weingarten, 2019).
A third goal-setting option uses an intra-individual framework that measures the student’s
previous ROI. Instead of using national benchmarks or norms, this approach uses the student’s
previous growth rate to calculate an ambitious individualized goal (Bailey & Weingarten, 2019).
The NCII provides resources for establishing academic and behavior goals.
Behavior Goal-Setting Strategies
Goal-setting standards are often different for behavioral domains because there are no
grade-level behavioral benchmarks/standards or preidentified rates of improvement as there are
in academics. Thus, teams may need to identify and prioritize the target behavior(s) that will be
monitored and facilitate consensus across all school team members about what the behavior of an
individual student looks and sounds like. Consensus is necessary because behaviors can vary
from setting to setting (e.g., school to home, class to class), present differently from child to
child, and be viewed differently from one educator to another. Therefore, operationally defining
behavior (i.e., specific, measurable, and observable) helps reduce potential subjectivity.
Operational definitions can be derived from classroom observations: teacher, parent, and/or
student interviews; anecdotal reports; frequency counts; or point sheets (Marx & Miller, 2020).
After a behavior is clearly and operationally defined, a progress monitoring tool should
be piloted to determine its utility and sensitivity at measuring the behavior. Once the tool is
determined accurate at measuring the behavior, baseline data should be collected. Horner and
colleagues (2005) suggested three to five data points when setting a baseline using behavioral
data.
At this stage, school teams should identify an appropriate goal will vary based on the
target behavior being monitored and current levels of performance (i.e., baseline). In addition,
educators must define responsiveness up front to support with evaluation. This definition will
likely include a specified percentage of time or frequency during which we expect the student to
perform. For example, if we operationally defined the behavior we are monitoring as
demonstrating academically engaged behaviors and established that a student’s baseline rate is
40% of a class period, we should set a goal for academic engagement at a rate commensurate to
Page 24 of 51
peers in the class (likely at or around 80%). Goals should reflect behavior that is more similar to
peers, not “perfect” behavior. As with academic progress monitoring, educators also should
determine regular intervals when data will be reviewed to ensure the provision of supports and
services (Miller, Riley-Tillman, Chafouleas, & Schardt, 2016).
Similar to academic progress monitoring data, teachers should be able to graph and
analyze progress monitoring data for behavior. Educators should be able to determine students’
responsiveness by analyzing baseline to intervention data using an examination of level, trend,
and variability.
Administering and Scoring Progress Monitoring Tools
For MTSS, possessing the knowledge and skills for administering and scoring progress
monitoring tools is essential. Academic and behavior tools are generally divided into three
administration formats: individual, group, or computer administered. Administration and scoring
times vary by tool and can range from 1 minute to 30 minutes (NCII, 2019). Computer-adapted
progress monitoring tools, which are typically administered in group settings, often take longer
to administer because there are more items. Individual measures, CBMs (Deno, 1985) or Direct
Behavior Rating (DBR; Christ, Riley-Tillman, Chafouleas, & Boice, 2010) can take a little as 1–
2 minutes to administer and score per student. Although measures of oral reading fluency are
common, teachers also can collect progress monitoring data in mathematics, spelling, and
writing using CBMs (Hosp, Hosp, & Howell, 2007).
The purpose of behavioral progress monitoring is similar to that of academic progress
monitoring—to determine student responsiveness to instruction/intervention. Teachers need to
understand that with behavior progress monitoring, it is critical to (1) relate the assessment to
Page 25 of 51
the function (i.e., purpose) of a student’s behavior, (2) select evidence-based interventions that
align with the functions of behavior, (3) link assessment and intervention through ongoing
progress monitoring, and (4) analyze data to determine the effectiveness of intervention and
student responsiveness. Because behavior can occur throughout the school day and across
settings, the frequency of behavioral progress monitoring may need to be higher than for
academics, with progress monitoring occurring daily and/or hourly depending on the frequency,
duration, latency, and/or intensity of the behavior being monitored.
Progress Monitoring Data Decision-Making Strategies
Progress monitoring data should be collected and graphed frequently to reflect student
performance and allow instructional decisions and adaptations to be made sooner (Bangert-
Drowns, Kulik, & Kulik, 1991). Educators must consider school resources and feasibility when
establishing their progress monitoring schedules. It is recommended that teachers collect six to
nine data points before making decisions about instructional progress and potential changes that
need to be made to instructional methods (Christ & Silberglitt, 2007). How frequently teachers
review progress monitoring data and make instructional decisions will depend on the frequency
of data collection. For example, teachers may review behavior data that are collected daily every
other week, while they may review academic data collected weekly every other month.
Teachers should possess the skills and knowledge to use validated approaches to
analyzing progress monitoring data. Access to graphed progress monitoring data, whether paper
and pencil or electronic, is essential for making decisions using common validated decision-
making rules. The Four-Point Method offers teachers an easy method for analyzing whether
students are making progress toward their goal (IRIS Center, 2020). For the most accurate
Page 26 of 51
estimate of progress, teachers need as least six data points that are graphed against the goal line,
or the line between the baseline and goal. The decision rules for the Four-Point Method are
straightforward. If the last four data points are on or above the goal line, the teacher should
continue the current program. If the last four data points are below the goal line, the student is
identified as not on track to meet their goal and the teacher should engage in the problem-solving
process to adapt or modify the intervention. For a more sensitive approach to analysis, teachers
may use trend line analysis (NCII, 2012). A trend line, which requires at least eight data points to
calculate, is a line on a graph that represents a line of best fit through a student’s data points.
Many published data systems calculate the trend line, although teachers can draw it by hand. The
trend line is compared against the goal line to help inform responsiveness to intervention.
When teachers frequently analyze progress monitoring data for students receiving an
intervention, they can determine whether students are making adequate progress to achieve their
goal. If a student progresses well within a Tier 2 intervention over the course of 8–15 weeks,
they may no longer require Tier 2 intervention (Stecker, Fuchs, & Fuchs, 2008). However, it is
important that progress is still monitored at Tier I to make sure they can benefit adequately from
the core program, without supplemental supports. If a student does not respond as desired to the
Tier 2 intervention that is delivered with fidelity, an additional round of Tier 2 instruction may
be needed, or a team may determine that more intensive, individualized intervention at Tier 3 is
warranted (Stecker et al., 2008).
Intensifying Instruction Using Data-Based Individualization (DBI)
Research suggests that evidence-based interventions or validated programs are not
universally effective and that about 5–10% of students will need more intensive intervention to
succeed within an MTSS (Fuchs et al., 2008; NCII, 2013). Intensive interventions differ from
Page 27 of 51
standardized protocol interventions common at Tier 2 in that they are driven by data and are
characterized by increased intensity (NCII, 2020). In other words, their development and
implementation are highly dependent on teachers’ effective use of MTSS data, especially
progress monitoring and diagnostic data.
To effectively implement intensive intervention through DBI, teachers need (1) training
to effectively use data to design and intensify instruction, (2) multiple practice opportunities with
feedback, and (3) coaching and support to apply data use skills. Intensive intervention is
considered the most difficult component of MTSS to implement, especially when schools lack
necessary Tier 1 and Tier 2 infrastructure and assessment practices (Ruffini, Miskell, Lindsay,
McInerney, & Waite, 2016). DBI is one method to support educators in designing and
implementing effective Tier 3 systems (Marx & Goodman, 2019). DBI is a validated process for
individualizing and intensifying interventions for students with severe and persistent learning
and behavioral needs (NCII, 2013).
The process requires the integration of validated interventions and assessments across the
five steps (Peterson, Danielson, & Fuchs, 2019). NCII uses the graphic in Figure 3 to illustrate
the progression of DBI, including the connections across assessment and instruction. The DBI
process begins with a validated intervention program that is delivered in small groups or
individually with fidelity. As part of effective delivery of the intervention, teachers will use
informal, frequent measures of progress, such as observations, oral responses, or quick checks, to
monitor the students’ immediate response to the instruction. To monitor the students’ overall
response to the intervention, the teacher will use formal progress monitoring. Progress
monitoring for intensive intervention is outlined in Step 2 of the DBI process as seen in Figure 3.
Page 28 of 51
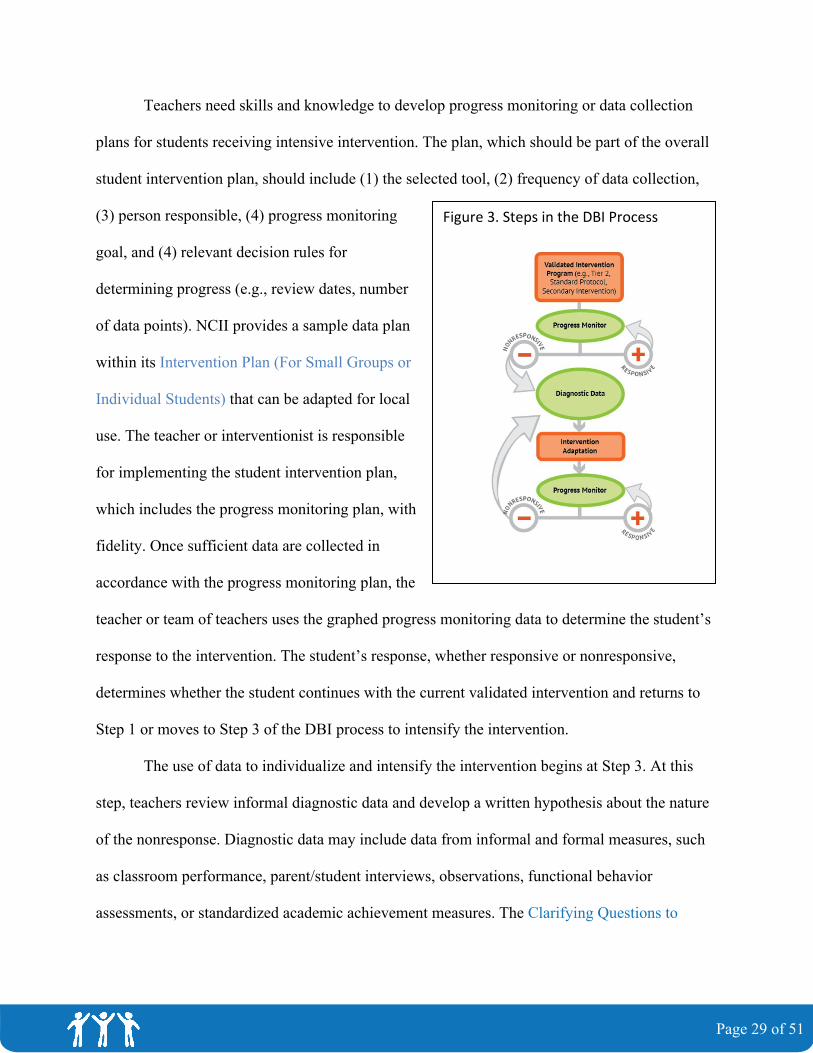
Teachers need skills and knowledge to develop progress monitoring or data collection
plans for students receiving intensive intervention. The plan, which should be part of the overall
student intervention plan, should include (1) the selected tool, (2) frequency of data collection,
(3) person responsible, (4) progress monitoring
goal, and (4) relevant decision rules for
determining progress (e.g., review dates, number
of data points). NCII provides a sample data plan
within its Intervention Plan (For Small Groups or
Individual Students) that can be adapted for local
use. The teacher or interventionist is responsible
for implementing the student intervention plan,
which includes the progress monitoring plan, with
fidelity. Once sufficient data are collected in
accordance with the progress monitoring plan, the
teacher or team of teachers uses the graphed progress monitoring data to determine the student’s
response to the intervention. The student’s response, whether responsive or nonresponsive,
determines whether the student continues with the current validated intervention and returns to
Step 1 or moves to Step 3 of the DBI process to intensify the intervention.
The use of data to individualize and intensify the intervention begins at Step 3. At this
step, teachers review informal diagnostic data and develop a written hypothesis about the nature
of the nonresponse. Diagnostic data may include data from informal and formal measures, such
as classroom performance, parent/student interviews, observations, functional behavior
assessments, or standardized academic achievement measures. The Clarifying Questions to
Figure 3. Steps in the DBI Process
Page 29 of 51
Create a Hypothesis to Guide Intervention Changes: Question Bank from NCII can assist teams
in developing a hypothesis about why an individual or group of students may not be responding
to an intervention.. The tool encourages teams to consider whether the intervention design,
implementation fidelity, or learner needs are contributing to the lack of response.
At Step 4, the resulting hypothesis drives the team’s decisions about how to intensify the
supports and intervention to better meet the student’s individual needs. When the intervention is
adapted to meet unique needs, the team also must review the continued appropriateness of the
progress monitoring plan. In some cases, the team may consider whether a new or additional
progress monitoring tool is necessary to determine the student’s response to the intervention
adaptation(s) or whether they need to increase the frequency of data collection and analysis.
At Step 5, the team implements the current or revised progress monitoring plan and
reviews the graphed data according to the plan. Collecting more frequent data may seem
burdensome or counterproductive to delivering instruction, but for students with the most severe
and persistent academic and/or behavioral needs, data allow educators to adjust instruction in a
productive and timely manner. For academic domains, weekly formal progress monitoring is
recommended for this reason (Fuchs & Fuchs, 2006). Teams will use similar teaming and data
analysis approaches used following Step 2 to determine the student’s response to the adapted
intervention. In most cases, students with severe and persistent learning needs, including students
with disabilities, will require several rounds of adaptation before progress is sufficient.
In summary, DBI is an ongoing, iterative process that should be reserved for the students
with the most severe and persistent academic and/or behavioral needs. Educators who are
supporting students with intensive needs through DBI must have the knowledge and skills to
adequately assess and meet their needs accordingly.
Page 30 of 51
Using MTSS Data
Conditions for Effective Use of MTSS Data
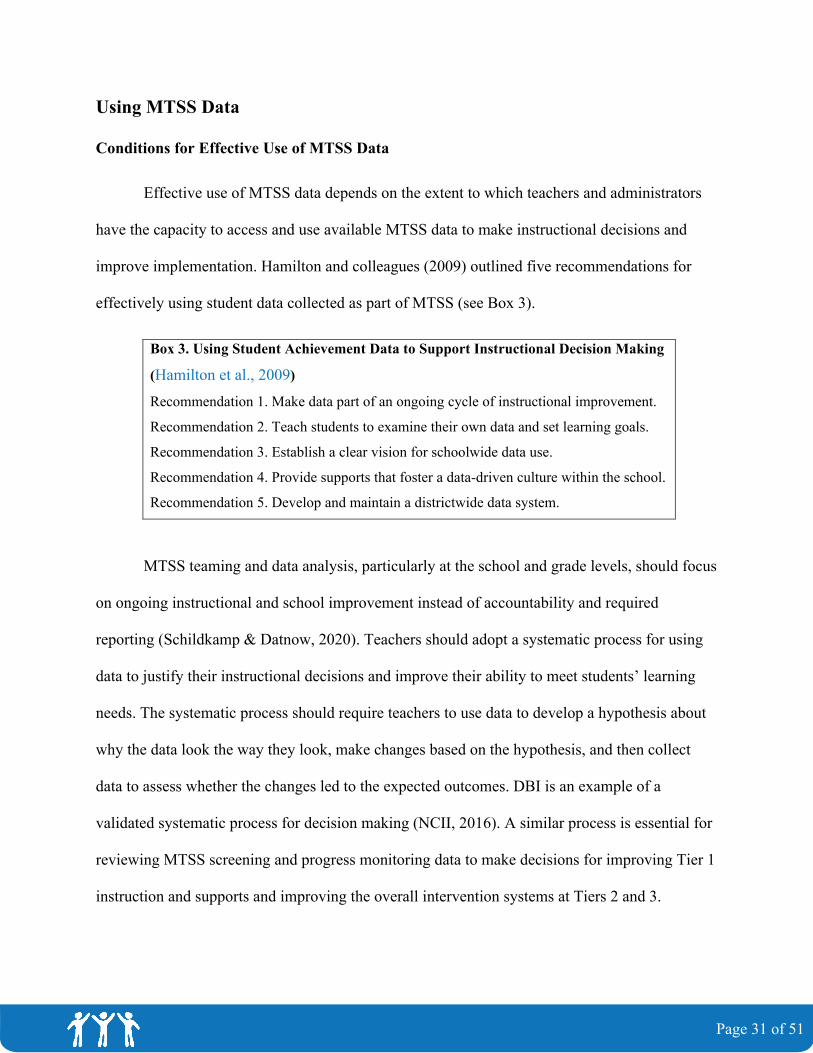
Effective use of MTSS data depends on the extent to which teachers and administrators
have the capacity to access and use available MTSS data to make instructional decisions and
improve implementation. Hamilton and colleagues (2009) outlined five recommendations for
effectively using student data collected as part of MTSS (see Box 3).
Box 3. Using Student Achievement Data to Support Instructional Decision Making
(Hamilton et al., 2009)
Recommendation 1. Make data part of an ongoing cycle of instructional improvement.
Recommendation 2. Teach students to examine their own data and set learning goals.
Recommendation 3. Establish a clear vision for schoolwide data use.
Recommendation 4. Provide supports that foster a data-driven culture within the school.
Recommendation 5. Develop and maintain a districtwide data system.
MTSS teaming and data analysis, particularly at the school and grade levels, should focus
on ongoing instructional and school improvement instead of accountability and required
reporting (Schildkamp & Datnow, 2020). Teachers should adopt a systematic process for using
data to justify their instructional decisions and improve their ability to meet students’ learning
needs. The systematic process should require teachers to use data to develop a hypothesis about
why the data look the way they look, make changes based on the hypothesis, and then collect
data to assess whether the changes led to the expected outcomes. DBI is an example of a
validated systematic process for decision making (NCII, 2016). A similar process is essential for
reviewing MTSS screening and progress monitoring data to make decisions for improving Tier 1
instruction and supports and improving the overall intervention systems at Tiers 2 and 3.
Page 31 of 51
Phillips, Hamlett, Fuchs, and Fuchs (1993) found that interventions that included ongoing
progress monitoring paired with opportunities for students to analyze their own graphed data and
receive explicit teacher feedback contributed to statistically significant higher gains in math
achievement. As a result, teachers need skills to support students in examining their own data
using processes similar to those used by teachers. Hamilton and colleagues (2009) suggested that
this approach can motivate both elementary and secondary students by “mapping out
accomplishments that are attainable, revealing actual achievement gains and providing students
with a sense of control over their own outcomes” (p. 19). In other words, MTSS data can provide
direct benefits to students as well.
Having a clear vision for how data will be used at the school, grade, class, and student
levels also is essential for effective MTSS data use. This vision is part of a school’s data-driven
culture that is generally facilitated by the school leadership, such as the principal (Moody &
Dede, 2008; Ordóñez-Feliciano, 2017). To benefit from a school’s data culture, teachers must
possess not only the skills necessary to analyze the data but also to effectively collaborate with
other teachers to problem-solve and plan for improvement (Gentry, 2012). Gentry found that this
collaboration was particularly critical for developing teachers’ practices, such as data practices,
aimed at improving outcomes for students with disabilities. Educators should be prepared to
work collaboratively to establish a plan for achieving this vision and create grade-level data
teams responsible for analyzing group-level data (Vanlommel, Vanhoof, & Van Petegem, 2016).
Educators also must understand how to utilize the supports that promote a data-driven
culture within an MTSS in a school. Although supports will vary based on the context, teachers
may have access to coaches, professional learning communities, support networks, and ongoing
professional development to support use of data for making instructional changes (Anderegg,
Page 32 of 51
2007; Ordóñez-Feliciano, 2017). If these supports are not available, teachers may need to work
with their MTSS leadership teams to identify ways for making these available as well as locate
available resources and supports outside of the school or district.
Finally, effective implementation of an MTSS depends on an accessible district- or
school-wide data system (Wayman, Cho, & Johnston, 2007; Hamilton et al., 2009; Center on
RTI, 2014). When teachers have access to a data system, they are more likely to share data with
families, monitor students’ progress, and plan and refine instruction (U.S. Department of
Education, 2007). Although there are many different types of MTSS data systems, from
published to district created, there are critical features across all data systems that facilitate
effective collection and use of MTSS data. At a minimum, MTSS data systems should (1) allow
educators to access individual student-level data (including screening and progress monitoring
data) and document instructional decisions; (2) enter data in a timely manner; (3) represent data
graphically; and (4) set/evaluate school, grade, and individual goals (Center on RTI, 2014).
Educators also must understand how to access the right data within the system to address their
questions.
Teaming for MTSS Data Decision Making
Teaming is essential for the effective use of MTSS data to improve educator practice,
tiered systems, and students’ outcomes (Marx & Goodman, 2019). The conditions for effective
data use, such as a data-driven culture and access to data supports, help increase the success and
impact of teaming (Hamilton et al., 2009). Although the number and titles of MTSS teams will
vary by local context, MTSS teams should (1) represent all key stakeholders impacted by the
decisions made by the team, (2) include structures and clear processes to guide decision making,
and (3) establish times for regular meetings (Center on RTI, 2014). Knowing that there are
Page 33 of 51
Page 34 of 51
various types of teams within an MTSS, educators should understand how to facilitate and
participate in efficient and effective MTSS data-driven team meetings. Based on lessons learned
from local implementers, NCII developed a set of teaming tools and resources to support
implementation of data meetings for analysis of small group or individual student data. Running
efficient and effective data meetings requires that data are summarized prior to the meeting, there
is a meeting agenda and facilitator, participants adhere to meeting norms and structures, and the
team uses systematic processes for making decisions and using data. To learn more, access
NCII’s Tools to Support Intensive Intervention Data Meetings.
Sharing Data With Other Educators, Families, and Students
All educators must possess the knowledge and skills necessary to effectively share MTSS
data with other educators as well as families and students. The Education Trust (2004) found that
sharing student and school data can support family engagement necessary for school
improvement. The Harvard Family Research Project (2013) identified several strategies for
effectively sharing data with staff, parents, and students. Sharing data is more than just printing
reports and disseminating them to the intended audience. It requires that data are presented in
ways that are meaningful, accessible, and useful to the recipient. Specifically, educators also
need to ensure that the data are presented a way that is responsive to families’ cultural and
linguistic backgrounds and unique needs. Despite our best efforts to develop accessible MTSS
data reports, teachers may need to provide an orientation or training to help recipients access and
understand what the MTSS report is telling them. Sharing sensitive data, such as data indicating
that the student is not responding as expected, can be particularly challenging for teachers. In
these cases, teachers need the knowledge and skills to attend to privacy considerations, avoid
non-parent-friendly jargon, and focus on growth and next steps.
Page 35 of 51
Assessment Considerations for Students With Disabilities
In an effective MTSS framework, students with disabilities should have access to
academic and behavior supports across the tiers, depending on their needs (Bailey, Chan, &
Lembke, 2019). Because students with disabilities are supported across tiers—and are
increasingly spending more of their time in general education settings—both general and special
education teachers should know how to collect, analyze, and interpret various forms of student
assessment data within an MTSS, and use these data to adjust their instruction and supports.
Many students in need of the most intensive intervention using DBI are students with
disabilities. For these students, DBI provides a systematic, data-based process for (1) designing
specialized instruction and individualized education programs (IEPs) based on student need, and
(2) evaluating student progress toward individualized goals. Because students with disabilities
should have access to tiered supports, there also should be adequate data from across tiers to help
inform special education eligibility decisions and IEP development (i.e., universal screening,
progress monitoring, diagnostic assessment, summative assessment). In addition to any
mandatory assessments required by federal, state, and/or local regulations (e.g.,
psychoeducational assessments, standardized achievement tests, social-developmental histories,
speech and language assessments), the assessments described throughout this IC provide data for
IEP teams to use when identifying:
• Present levels of academic achievement and functional performance (PLAAFPs),
• Which content areas require specially designed instruction versus which require
only accommodations,
• The frequency of specially designed instruction,
Page 36 of 51
• The focus of IEP goals (GOMs or single skill), and
• Appropriate ways to measure progress toward IEP goals (i.e., progress
monitoring).
When administering MTSS assessments to students with disabilities, educators also must
know how to use accommodations appropriately. Accommodations are adaptations or changes to
educational environments and practices that are implemented during testing and designed to help
students with disabilities demonstrate their learning. They do not change what students learn but
rather how they access learning. It is important to check with the technical manual for the
selected MTSS assessments being used to determine which accommodations are allowed.
Evaluating MTSS Implementation
MTSS implementation and student assessment data play a key role in evaluating the
efficiency and efficacy of MTSS (Reedy & Lacireno-Paquet, 2015). Educators should be
familiar with available tools to support class-, grade-, and school-level MTSS evaluation. The
MTSS Center (Center on RTI, 2014) provides educators a freely available rubric to self-evaluate
the extent to which they are implementing each of the four essential components—universal
screening, progress monitoring, a multi-level prevention system, and data-based decision making
—with fidelity. The tool also allows teams to self-evaluate the extent to which critical
infrastructure, such as teaming and communication strategies, are in place. Other commonly used
tools include the Reading Tiered Fidelity Inventory (R-TFI; St. Martin, Nantais, Harms, & Huth,
2015) and Self-Assessment of MTSS Implementation: Version 2.0 (SAM; Problem Solving &
Response to Intervention Project, 2015).
Regardless of the tool used to evaluate MTSS implementation, educators will need to use
implementation data (i.e., fidelity data) in conjunction with impact data, which can include
results from statewide summative assessments or screening data, to evaluate how well an MTSS
is being implemented. Evaluating the efficacy of MTSS implementation helps teams to refine
and improve overall MTSS assessment processes and procedures. The results can support teams
in making decisions about resource allocation, staff allocation, ongoing professional learning,
tool selection, and target areas for improvement.
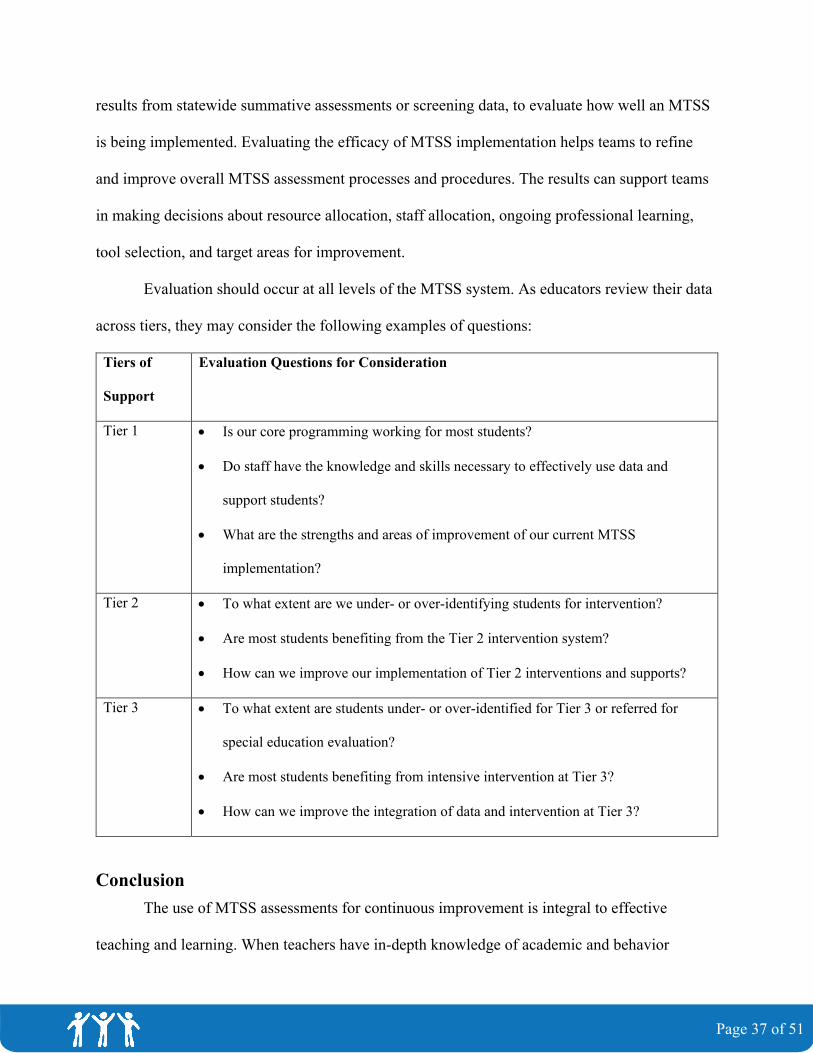
Evaluation should occur at all levels of the MTSS system. As educators review their data
across tiers, they may consider the following examples of questions:
Tiers of
Support
Evaluation Questions for Consideration
Tier 1 • Is our core programming working for most students?
• Do staff have the knowledge and skills necessary to effectively use data and
support students?
• What are the strengths and areas of improvement of our current MTSS
implementation?
Tier 2 • To what extent are we under- or over-identifying students for intervention?
• Are most students benefiting from the Tier 2 intervention system?
• How can we improve our implementation of Tier 2 interventions and supports?
Tier 3 • To what extent are students under- or over-identified for Tier 3 or referred for
special education evaluation?
• Are most students benefiting from intensive intervention at Tier 3?
• How can we improve the integration of data and intervention at Tier 3?
Conclusion The use of MTSS assessments for continuous improvement is integral to effective
teaching and learning. When teachers have in-depth knowledge of academic and behavior
Page 37 of 51
assessments and can effectively use data to make informed instructional decisions, they are more
likely to truly understand and address their students’ needs. Teachers need to understand the
various types of assessments and how each one is used to measure student needs and inform
instruction at various levels within the MTSS framework. When administered consistently, and
with fidelity, assessments hold all teachers and students accountable for demonstrating
measurable progress toward learning goals and objectives. To effectively apply these assessment
practices, all teachers, including those in both general and special education, must be prepared
with the skills and knowledge needed to administer, understand, and interpret assessments that
are relevant and meaningful in academic and/or functional areas. Teachers need high-quality
preservice preparation that incorporates ample opportunities to practice with school-age students,
accompanied by specific feedback from preparation program supervisors. Practicing educators
also need ongoing support to adapt to new assessment tools and technologies. We have a
collective responsibility in education to ensure that all students succeed toward college and
career readiness; knowing how to appropriately collect, analyze, and use assessment data can
help us achieve this goal.
References
Ainsworth, L., & Viegut, D. (2006). Common formative assessments: How to connect standards-based instruction assessment. Thousand Oaks, CA: Corwin Press.
Allensworth, E. M., & Easton, J. Q. (2005). The on-track indicator as a predictor of high school graduation. Chicago, IL: Consortium on Chicago School Research. Retrieved from https://consortium.uchicago.edu/publications/track-indicator-predictor-high-school-graduation
Page 38 of 51
Allensworth, E. M., & Easton, J. Q. (2007). What matters for staying on-track and graduating in Chicago public high schools: A close look at course grades, failures, and attendance in the freshman year. Chicago, IL: Consortium on Chicago School Research. Retrieved
from https://consortium.uchicago.edu/publications/what-matters-staying-track-and-graduating-chicago-public-schools
American Institutes for Research. (2019, February 15). Early warning systems in education. Retrieved from https://www.air.org/resource/early-warning-systems-education
Anderegg, C. C. (2007). Classrooms and schools analyzing student data: A study of educational practice (Doctoral dissertation, Pepperdine University). Dissertation Abstracts International, 68(02A), 184–538.
Bailey, T. R., Chan, G., & Lembke, E. S. (2019). Aligning intensive intervention and special education with multi-tiered systems of support. In R. Zumeta Edmonds, A. G. Gandhi, and L. Danielson (Eds.), Essentials of intensive intervention (pp. 136–156). New York, NY: Guilford Press.
Bailey, T. R., & Weingarten, Z. (2019). Strategies for setting high-quality academic individualized education program goals. Washington, DC: U.S. Department of Education, Office of Special Education Programs, National Center on Intensive Intervention.
Bangert-Drowns, R. L., Kulik, J. A., & Kulik, C. (1991). Effects of frequent classroom testing. Journal of Educational Research, 85(2), 89–99.
Bocala, C., & Boudett, K. P. (2015). Teaching educators habits of mind for using data wisely. Teachers College Record, 117(4), 1–20.
Bruhn, A. L., McDaniel, S. C., Rila, A., & Estrapala, S. (2018). A step-by-step guide to tier 2 behavioral progress monitoring. Beyond Behavior, 27(1), 15–27.
Burke, K. (2010). Balanced assessment: From formative to summative. Bloomington, IN: Solution Tree Press.
Center on Multi-Tiered System of Supports. (2020). Welcome to the MTSS Center. Retrieved from https://mtss4success.org/
Center on Response to Intervention. (2014). RTI fidelity of implementation rubric. Retrieved from https://mtss4success.org/sites/default/files/2020-07/RTI_Fidelity_Rubric.pdf
Choppin, J. (2002, April 2). Data use in practice: Examples from the school level. Paper
presented at the American Educational Research Association Annual Conference, New Orleans, LA. Retrieved from http://archive.wceruw.org/mps/AERA2002/data_use_in_practice.htm
Christ, T. J., Riley-Tillman, T. C., Chafouleas, S. M., & Boice, C. H. (2010). Direct Behavior Rating (DBR): Generalizability and dependability across raters and observations. Educational and Psychological Measurement, 70(5), 825–843.
Page 39 of 51
Christ, T. J., & Silberglitt, B. (2007). Estimates of the standard error of measurement for curriculum-based measures of oral reading fluency. School Psychology Review, 36(1), 130–146.
Data Quality Campaign. (2014, February). Teacher data literacy: It’s about time. Retrieved from https://dataqualitycampaign.org/wp-content/uploads/2016/03/DQC-Data-Literacy-Brief.pdf
Deno, S. L. (1985). Curriculum-based measurement: The emerging alternative. Exceptional Children, 52(3), 219–232.
Drummond, T. (1994). The Student Risk Screening Scale (SRSS). Grants Pass, OR: Josephine County Mental Health Program.
Every Student Succeeds Act (ESSA), 20 U.S.C. § 6301 (2015)
Fuchs, D., & Fuchs, L. S. (2006). Introduction to response to intervention: What, why, and how valid is it? Reading Research Quarterly, 41(1), 93–99.
Fuchs, L. S., Fuchs, D., Powell, S. R., Seethaler, P. M., Cirino, P. T., & Fletcher, J. M. (2008). Intensive intervention for students with mathematics disabilities: Seven principles of effective practice. Learning Disability Quarterly, 31(2), 79–92.
Gandhi, A. G. (2019). How will I know before it’s too late? Screening in early grades. Washington, DC: Center on Multi-Tiered Systems of Support.
Gentry, R. (2012). Collaboration skills pre-service teachers acquire in a responsive preparation program. Journal of Instructional Pedagogies, 8, 88–95.
Gersten, R., Beckmann, S., Clarke, B., Foegen, A., Marsh, L., Star, J. R., & Witzel, B. (2009). Assisting students struggling with mathematics: Response to Intervention (RtI) for elementary and middle schools (NCEE 2009-4060). Washington, DC: U.S. Department of Education, Institute of Education Sciences, National Center for Education Evaluation and Regional Assistance. Retrieved from https://ies.ed.gov/ncee/wwc/Docs/PracticeGuide/rti_math_pg_042109.pdf
Gersten, R., Compton, D., Connor, C. M., Dimino, J., Santoro, L., Linan-Thompson, S., & Tilly, W. D. (2008). Assisting students struggling with reading: Response to Intervention and multi-tier intervention for reading in the primary grades. A practice guide (NCEE 2009-4045). Washington, DC: U.S. Department of Education, Institute of Education Sciences, National Center for Education Evaluation and Regional Assistance. Retrieved from https://ies.ed.gov/ncee/wwc/Docs/PracticeGuide/rti_reading_pg_021809.pdf
Hall, G. E., & Hord, S. M. (1987). Change in schools: Facilitating the process. Albany, NY: State University of New York Press.
Page 40 of 51
Hall, G. E., & Hord, S. M. (2001). Implementing change: Patterns, principles, and potholes. Boston, MA: Allyn & Bacon.
Hall, G. E., Loucks, S. F., Rutherford, W. L., & Newton, B. W. (1975). Levels of use of the innovation: A framework for analyzing innovation adoption. Journal of Teacher Education, 26, 52-56. doi:10.1177/002248717502600114
Hamilton, L., Halverson, R., Jackson, S., Mandinach, E., Supovitz, J., & Wayman, J. (2009). Using student achievement data to support instructional decision making (NCEE 2009-4067). Washington, DC: U.S. Department of Education, Institute of Education Sciences, National Center for Education Evaluation and Regional Assistance. Retrieved from https://ies.ed.gov/ncee/wwc/Docs/PracticeGuide/dddm_pg_092909.pdf
Harlacher, J. E., Nelson Walker, N. J., & Sanford, A. K. (2010). The “I” in RTI: Research-based factors for intensifying instruction. Teaching Exceptional Children, 42(6), 30–38.
Harvard Family Research Project. (2013). Tips for administrators, teachers, and families: How to share data effectively. Retrieved from https://archive.globalfrp.org/var/hfrp/storage/fckeditor/File/7-DataSharingTipSheets-HarvardFamilyResearchProject.pdf
Horner, R. H., Carr, E. G., Halle, J., McGee, G., Odom, S., & Wolery, M. (2005). The use of single-subject research to identify evidence-based practice in special education. Exceptional Children, 71(2), 165–179.
Hosp, M., Hosp, J., & Howell, K. (2007). The ABCs of CBM: A practical guide to curriculum-based measurement. New York, NY: Guilford Press.
Individuals with Disabilities Education Act (IDEA), 20 U.S.C. § 1400 (2018)
IRIS Center. (2020). How can school personnel use data to make instructional decisions? Analyzing progress monitoring data. Nashville, TN: Vanderbilt University. Retrieved from https://iris.peabody.vanderbilt.edu/module/dbi2/cresource/q2/p04/
Klute, M., Apthorp, H., Harlacher, J., & Reale, M. (2017). Formative assessment and elementary school student academic achievement: A review of the evidence (REL 2017–259). Washington, DC: U.S. Department of Education, Institute of Education Sciences, National Center for Education Evaluation and Regional Assistance, Regional Educational Laboratory Central. Retrieved from https://ies.ed.gov/ncee/edlabs/regions/central/pdf/REL_2017259.pdf
Kovaleski, J. F., & Pedersen, J. (2008). Best practices in data analysis teaming. In A. Thomas & J. Grimes (Eds.), Best practices in school psychology V (pp. 115–130). Bethesda, MD:National Association of School Psychologists.
Lane, L. K., Oakes, W. P., Cantwell, E. D., Schatschneider, C., Menzies, H., Crittenden, M., & Messenger, M. (2016). Student Risk Screening Scale for internalizing and externalizing
Page 41 of 51
behaviors: Preliminary cut scores to support data-informed decision making in middle and high schools. Behavioral Disorders, 42(1), 271–284. https://doi.org/10.17988/bd-16-115.1
Lane, K. L., Oakes, W. P., Swogger, E. D., Schatschneider, C., Menzies, H., M., & Sanchez, J. (2015). Student risk screening scale for internalizing and externalizing behaviors: Preliminary cut scores to support data-informed decision making. Behavioral Disorders, 40(3), 159–170. https://doi.org/10.17988/0198-7429-40.3.159
Mandinach, E., Friedman, J., M., & Gummer, E. (2015). How can schools of education help to build educators' capacity to use data? A systemic view of the issue. Teachers College Record, 117(4), 1–50.
Mandinach, E., & Gummer, E. S. (2013). A systemic view of implementing data literacy in educator preparation. Educational Researcher, 42(1), 30–37. https://doi.org/10.3102/0013189X12459803
Mandinach, E., & Gummer, E. S. (2016). Every teacher should succeed with data literacy. Phi Delta Kappan, 97(8), 43–46. https://doi.org/10.1177/0031721716647018
Marx, T. A., & Goodman, S. (2019). Teaming structures to support intensive intervention using data-based individualization. In R. Zumeta Edmonds, A. G. Gandhi, & L. Danielson (Eds.), Essentials of intensive intervention (pp. 114–135). New York, NY: Guilford Press.
Marx, T. A., & Miller, F. G. (2020). Strategies for setting data-driven behavioral individualized education program goals. Washington, DC: U.S. Department of Education, Office of Special Education Programs, National Center on Intensive Intervention.
McLeskey, J., Barringer, M-D., Billingsley, B., Brownell, M., Jackson, D., Kennedy, M., … & Ziegler, D. (2017, January). High-leverage practices in special education. Arlington, VA: Council for Exceptional Children & CEEDAR Center.
Metcalf, T. (n.d.). What’s your plan? Accurate decision making within a multi-tier system of supports: Critical areas in Tier 1. Retrieved from http://www.rtinetwork.org/essential/tieredinstruction/tier1/accurate-decision-making-within-a-multi-tier-system-of-supports-critical-areas-in-tier-1#:~:text=Tier%201%20Critical%20MTSS%20Decisions,resources%20available%20to%20the%20building
Miller, F. G., Riley-Tillman, C., Chafouleas, S. M., & Schardt, A. A. (2016). Direct Behavior Rating instrumentation: Evaluating the impact of scale formats. Assessment for Effective Intervention, 42(2), 119–126.
Moody, L., & Dede, C. (2008). Models of data-based decision-making: A case study of the Milwaukee Public Schools. In E. B. Mandinach & M. Honey (Eds.), Data-driven school
Page 42 of 51
improvement: Linking data and learning (pp. 233–254). New York, NY: Teachers College Press.
National Center on Intensive Intervention. (2012). Using academic progress monitoring for individualized instructional planning (DBI Professional Learning Series Module 2). Washington, DC: U.S. Department of Education, Office of Special Education. Retrieved from https://intensiveintervention.org/resource/using-academic-progress-monitoring-individualized-instructional-planning-dbi-training
National Center on Intensive Intervention. (2013). Data-based individualization: A framework for intensive intervention. Washington, DC: U.S. Department of Education, Office of Special Education. Retrieved from https://intensiveintervention.org/resource/data-based-individualization-framework-intensive-intervention
National Center on Intensive Intervention. (2016). Introduction to data-based individualization. Washington, DC: Author. Retrieved from https://intensiveintervention.org/sites/default/files/DBI_One-Pager_508.pdf
National Center on Intensive Intervention. (2019, July). Academic screening tools chart. Retrieved from https://charts.intensiveintervention.org/ascreening
National Center on Intensive Intervention. (2020). 2020 call for submissions of academic screening tools. Retrieved from https://intensiveintervention.org/sites/default/files/NCII_AcadScreen_CallForSubmissions_2020-06-30.pdf
National Center on Intensive Intervention. (n.d.a.). Example diagnostic tools. Retrieved from https://intensiveintervention.org/intensive-intervention/diagnostic-data/example-diagnostic-tools
National Center on Intensive Intervention. (n.d.b.). Ensuring fidelity of assessment and data entry procedures. Retrieved from https://intensiveintervention.org/sites/default/files/DataFidelity_Final508.pdf.
Ordóñez-Feliciano, P. (2017, October). How to create a data-driven school culture. Communicator, 41(2). Retrieved from https://www.naesp.org/communicator-october-2017/how-create-data-driven-school-culture
Peterson, A., Danielson, L., & Fuchs, D. (2019). Introduction to intensive intervention: A step-by-step guide to data-based individualization. In R. Zumeta Edmonds, A. G. Gandhi, & L. Danielson (Eds.), Essentials of intensive intervention (pp. 9–28). New York, NY:Guilford Press.
Page 43 of 51
Phillips, N. B., Hamlett, C. L., Fuchs, L. S., & Fuchs, D. (1993). Combining classwide curriculum-based measurement and peer tutoring to help general educators provide adaptive education. Learning Disabilities Research & Practice, 8, 148–156.
Problem Solving & Response to Intervention Project. (2015). Self-Assessment of MTSS Implementation (SAM): Version 2. Tampa, FL: Florida Department of Education and University of South Florida.
Reedy, K., & Lacireno-Paquet, N. (2015). Evaluation brief: Implementation and outcomes of Kansas multi-tier system of supports: 2011–2014. San Francisco, CA: WestEd.
Ruffini, S. J., Miskell, R., Lindsay, J., McInerney, M., & Waite, W. (2016). Measuring the implementation fidelity of the Response to Intervention framework in Milwaukee Public Schools (REL 2017–193). Washington, DC: U.S. Department of Education, Institute of Education Sciences, National Center for Education Evaluation and Regional Assistance, Regional Educational Laboratory Midwest. Retrieved from https://files.eric.ed.gov/fulltext/ED570888.pdf
Roy, P., & Hord, S. M. (2004). Innovation configurations chart a measured course toward change. Journal of Staff Development, 25(2), 54–58.
St. Martin, K., Nantais, M., Harms, A., & Huth, E. (2015). Reading Tiered Fidelity Inventory: Elementary-Level Edition. Lansing, MI: Michigan Department of Education, Michigan’s Integrated Behavior and Learning Support Initiative.
Salmacia, K. A. (2017). Developing outcome-driven, data-literate teachers. ProQuest AAI10599195. Retrieved from https://repository.upenn.edu/dissertations/AAI10599195
Schildkamp, K., & Datnow, A. (2020): When data teams struggle: Learning from less successful data use efforts. Leadership and Policy in Schools. Retrieved from https://www.tandfonline.com/doi/full/10.1080/15700763.2020.1734630
Shapiro, E. S. (2008). Best practices in setting progress monitoring goals for academic skill improvement. In A. Thomas & J. Grimes (Eds.), Best practices in school psychology V. (Vol. 2, pp. 141–157). Bethesda, MD: National Association of School Psychologists.
Stahl, K. A. D., & McKenna, M. C. (2012). Reading assessment in an RTI framework. New York, NY: Guilford Press.
Stecker, P. M., Fuchs, D., & Fuchs, L. S. (2008). Progress monitoring as essential practice within response to intervention. Rural Special Education Quarterly, 27(4), 10–17.
Supovitz, J. (2012). Getting at student understanding—The key to teachers' use of test data. Teachers College Record, 114(11), 1–29.
Taylor, R. L. (2009). Assessment of exceptional students: Educational and psychological procedures (8th ed.) Upper Saddle River, NJ: Pearson Education.
Page 44 of 51
The Education Trust. (2004). Making data work: A parent and community guide. Washington, DC: Author.
Torgesen, J. K., & Wagner, R. K. (1998). Alternative diagnostic approaches for specific developmental reading disabilities. Learning Disabilities Research & Practice, 13(4), 220–232.
U.S. Department of Education. (2016, September). Issue brief: Early warning systems. Washington, DC: Office of Planning, Evaluation and Policy Development, Policy and Program Studies Service. Retrieved from https://www2.ed.gov/rschstat/eval/high-school/early-warning-systems-brief.pdf
U.S. Department of Education. (2008). Teachers’ use of student data management systems to improve instruction, Washington, DC: Office of Planning, Evaluation and Policy Development, Policy and Program Studies Service.
VanDerHeyden, A. (n.d.). Examples of effective RtI use and decision making: Part 1—Overview. New York, NY: RTI Action Network, National Center for Learning Disabilities. Retrieved from http://www.rtinetwork.org/essential/assessment/data-based/examples-of-effective-rti-use-and-decision-making-part-1-overview
Vanlommel, K., Vanhoof, J., & Van Petegem, P. (2016). Data use by teachers: The impact of motivation, decision-making style, supportive relationships, and reflective capacity. Educational Studies, 42(1), 36–53. doi:10.1080/03055698.2016.1148582
Wayman, J. C., Cho, V., & Johnston, M. T. (2007). The data-informed district: A district-wide evaluation of data use in the Natrona County School District. Austin, TX: The University of Texas. Retrieved from https://csaa.wested.org/resource/the-data-informed-district-a-district-wide-evaluation-of-data-use-in-the-natrona-county-school-district/
Page 45 of 51
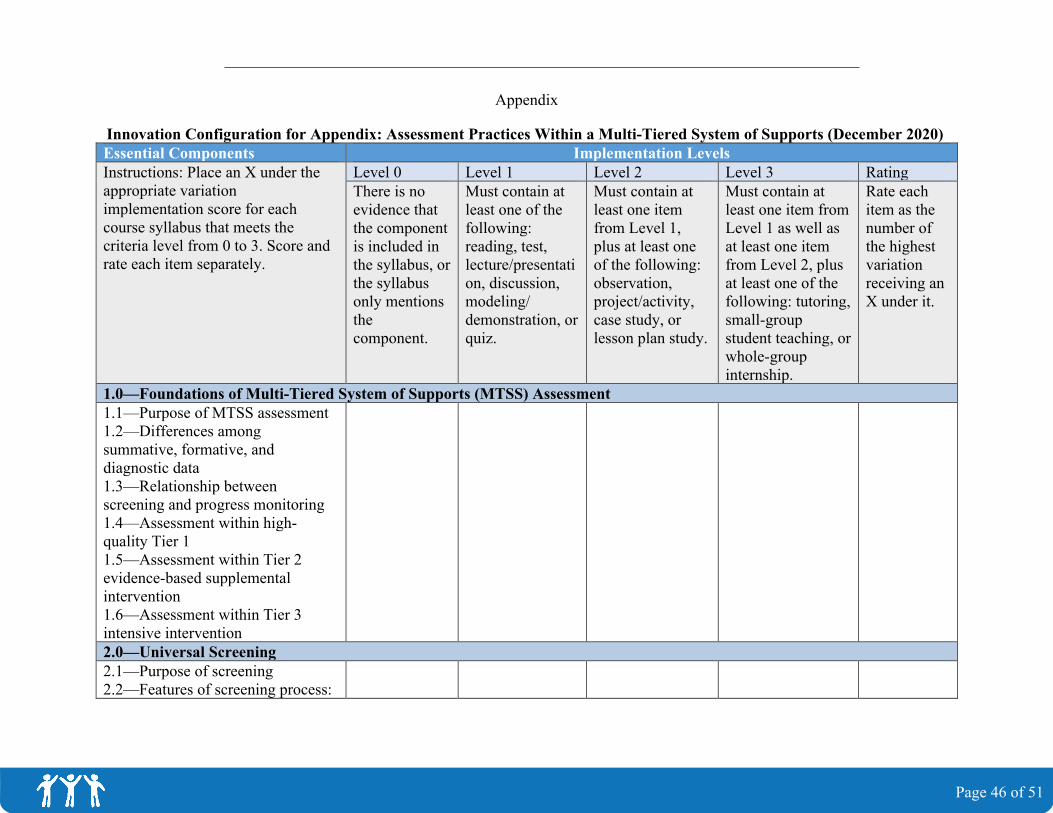
Page 46 of 51
Appendix
Innovation Configuration for Appendix: Assessment Practices Within a Multi-Tiered System of Supports (December 2020) Essential Components Implementation Levels Instructions: Place an X under the appropriate variation implementation score for each course syllabus that meets the criteria level from 0 to 3. Score and rate each item separately.
Level 0 There is no evidence that the component is included in the syllabus, or the syllabus only mentions the component.
Level 1 Must contain at least one of the following: reading, test, lecture/presentation, discussion, modeling/ demonstration, or quiz.
Level 2 Must contain at least one item from Level 1, plus at least one of the following: observation, project/activity, case study, or lesson plan study.
Level 3 Must contain at least one item from Level 1 as well as at least one item from Level 2, plus at least one of the following: tutoring, small-group student teaching, or whole-group internship.
Rating Rate each item as the number of the highest variation receiving an X under it.
1.0—Foundations of Multi-Tiered System of Supports (MTSS) Assessment 1.1—Purpose of MTSS assessment 1.2—Differences among summative, formative, and diagnostic data 1.3—Relationship between screening and progress monitoring 1.4—Assessment within high-quality Tier 1 1.5—Assessment within Tier 2 evidence-based supplemental intervention 1.6—Assessment within Tier 3 intensive intervention 2.0—Universal Screening 2.1—Purpose of screening 2.2—Features of screening process:
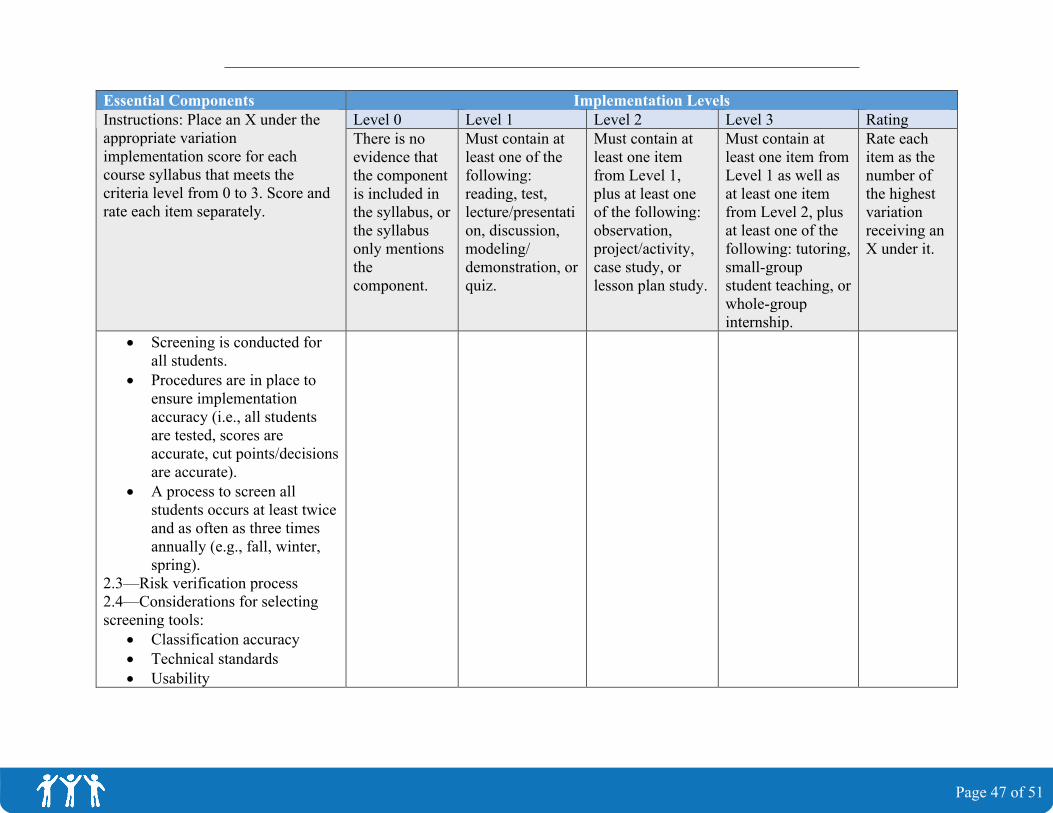
Page 47 of 51
Essential Components Implementation Levels Instructions: Place an X under the appropriate variation implementation score for each course syllabus that meets the criteria level from 0 to 3. Score and rate each item separately.
Level 0 There is no evidence that the component is included in the syllabus, or the syllabus only mentions the component.
Level 1 Must contain at least one of the following: reading, test, lecture/presentation, discussion, modeling/ demonstration, or quiz.
Level 2 Must contain at least one item from Level 1, plus at least one of the following: observation, project/activity, case study, or lesson plan study.
Level 3 Must contain at least one item from Level 1 as well as at least one item from Level 2, plus at least one of the following: tutoring, small-group student teaching, or whole-group internship.
Rating Rate each item as the number of the highest variation receiving an X under it.
• Screening is conducted forall students.
• Procedures are in place toensure implementationaccuracy (i.e., all studentsare tested, scores areaccurate, cut points/decisionsare accurate).
• A process to screen allstudents occurs at least twiceand as often as three timesannually (e.g., fall, winter,spring).
2.3—Risk verification process 2.4—Considerations for selecting screening tools:
• Classification accuracy• Technical standards• Usability
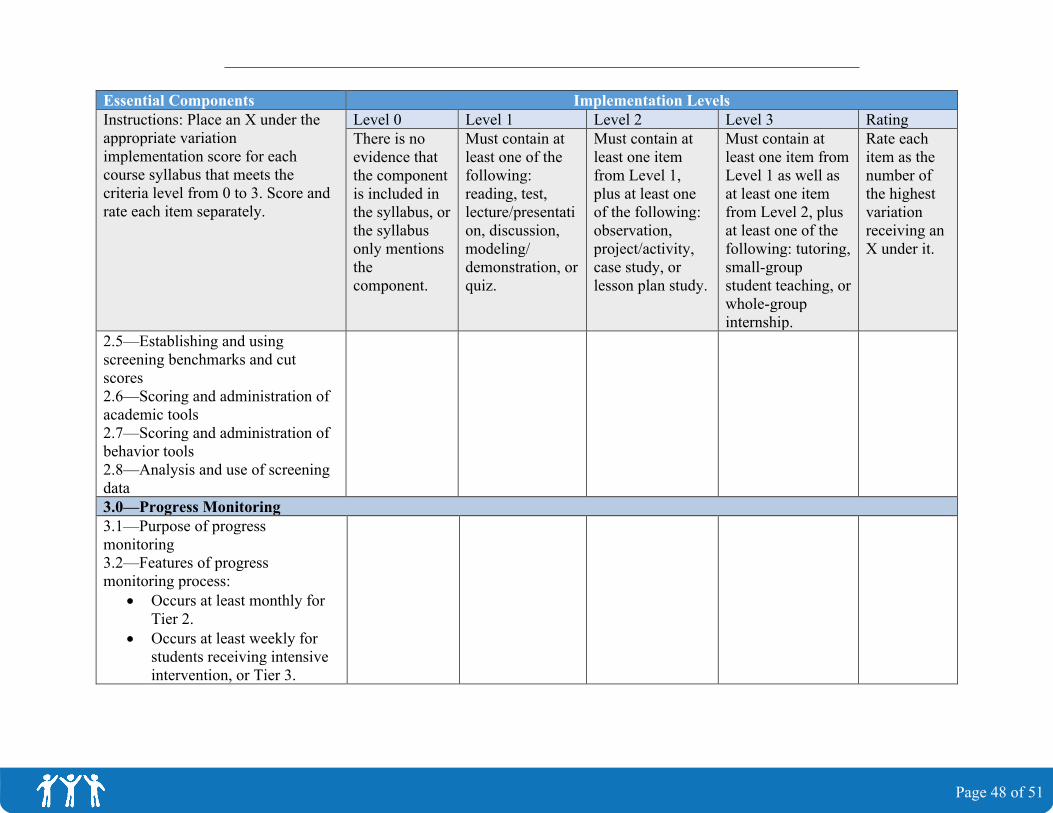
Page 48 of 51
Essential Components Implementation Levels Instructions: Place an X under the appropriate variation implementation score for each course syllabus that meets the criteria level from 0 to 3. Score and rate each item separately.
Level 0 There is no evidence that the component is included in the syllabus, or the syllabus only mentions the component.
Level 1 Must contain at least one of the following: reading, test, lecture/presentation, discussion, modeling/ demonstration, or quiz.
Level 2 Must contain at least one item from Level 1, plus at least one of the following: observation, project/activity, case study, or lesson plan study.
Level 3 Must contain at least one item from Level 1 as well as at least one item from Level 2, plus at least one of the following: tutoring, small-group student teaching, or whole-group internship.
Rating Rate each item as the number of the highest variation receiving an X under it.
2.5—Establishing and using screening benchmarks and cut scores 2.6—Scoring and administration of academic tools 2.7—Scoring and administration of behavior tools 2.8—Analysis and use of screening data 3.0—Progress Monitoring 3.1—Purpose of progress monitoring 3.2—Features of progress monitoring process:
• Occurs at least monthly for Tier 2.
• Occurs at least weekly for students receiving intensive intervention, or Tier 3.
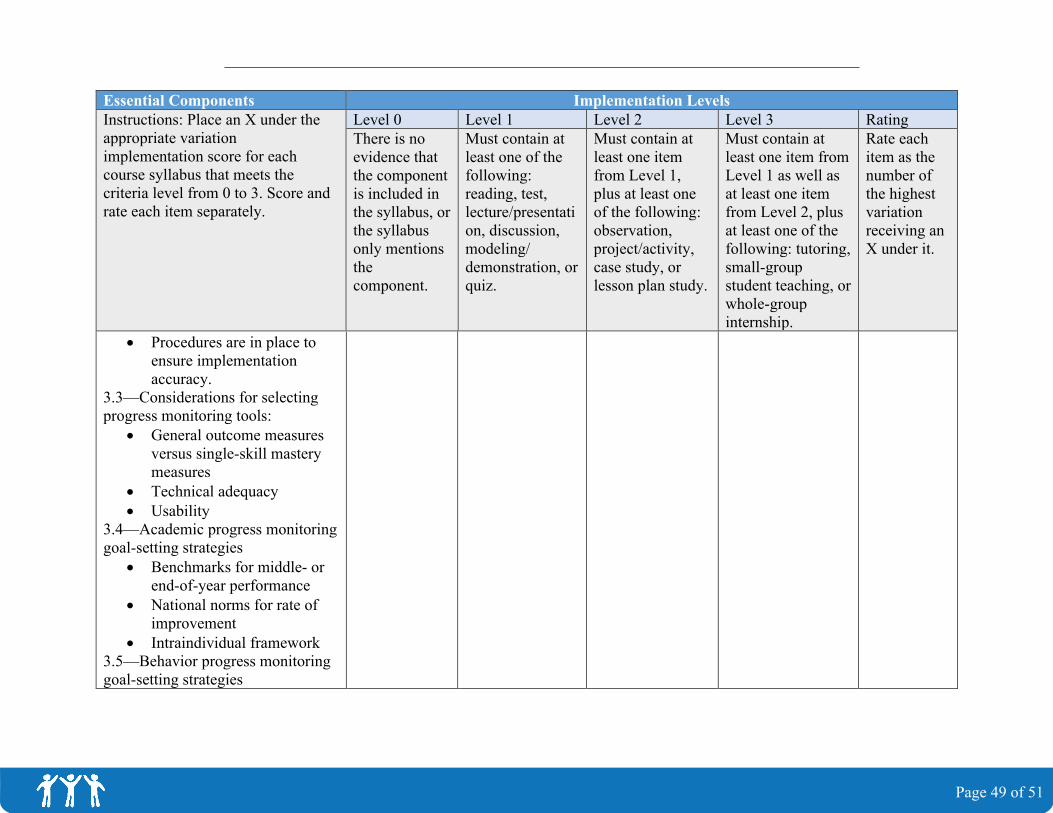
Essential Components Implementation Levels Instructions: Place an X under the appropriate variation implementation score for each course syllabus that meets the criteria level from 0 to 3. Score and rate each item separately.
Level 0 Level 1 Level 2 Level 3 Rating There is no evidence that the component is included in the syllabus, or the syllabus only mentions the component.
Must contain at least one of the following: reading, test, lecture/presentation, discussion, modeling/ demonstration, or quiz.
Must contain at least one item from Level 1, plus at least one of the following: observation, project/activity, case study, or lesson plan study.
Must contain at least one item from Level 1 as well as at least one item from Level 2, plus at least one of the following: tutoring, small-group student teaching, or whole-group internship.
Rate each item as the number of the highest variation receiving an X under it.
• Procedures are in place toensure implementationaccuracy.
3.3—Considerations for selecting progress monitoring tools:
• General outcome measuresversus single-skill masterymeasures
• Technical adequacy• Usability
3.4—Academic progress monitoring goal-setting strategies
• Benchmarks for middle- orend-of-year performance
• National norms for rate ofimprovement
• Intraindividual framework3.5—Behavior progress monitoring goal-setting strategies
Page 49 of 51
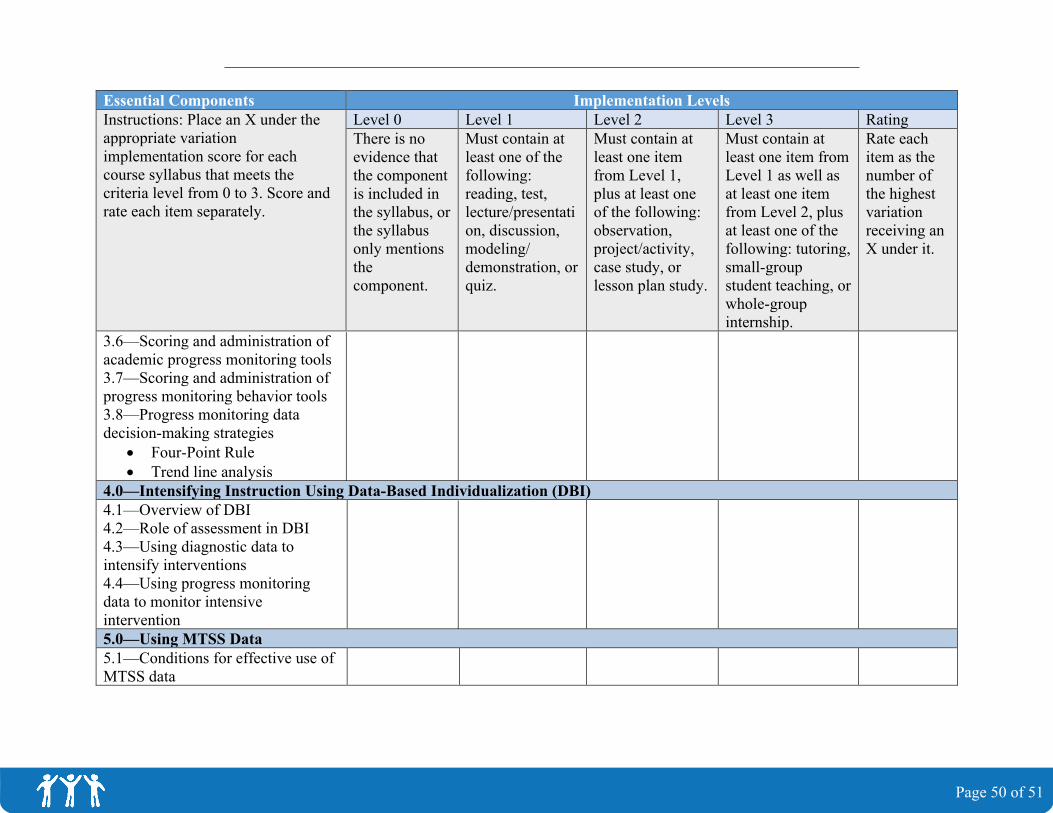
Page 50 of 51
Essential Components Implementation Levels Instructions: Place an X under the appropriate variation implementation score for each course syllabus that meets the criteria level from 0 to 3. Score and rate each item separately.
Level 0 Level 1 Level 2 Level 3 Rating There is no evidence that the component is included in the syllabus, or the syllabus only mentions the component.
Must contain at least one of the following: reading, test, lecture/presentation, discussion, modeling/ demonstration, or quiz.
Must contain at least one item from Level 1, plus at least one of the following: observation, project/activity, case study, or lesson plan study.
Must contain at least one item from Level 1 as well as at least one item from Level 2, plus at least one of the following: tutoring, small-group student teaching, or whole-group internship.
Rate each item as the number of the highest variation receiving an X under it.
3.6—Scoring and administration of academic progress monitoring tools 3.7—Scoring and administration of progress monitoring behavior tools 3.8—Progress monitoring data decision-making strategies
• Four-Point Rule• Trend line analysis
4.0—Intensifying Instruction Using Data-Based Individualization (DBI) 4.1—Overview of DBI 4.2—Role of assessment in DBI 4.3—Using diagnostic data to intensify interventions 4.4—Using progress monitoring data to monitor intensive intervention 5.0—Using MTSS Data 5.1—Conditions for effective use of MTSS data
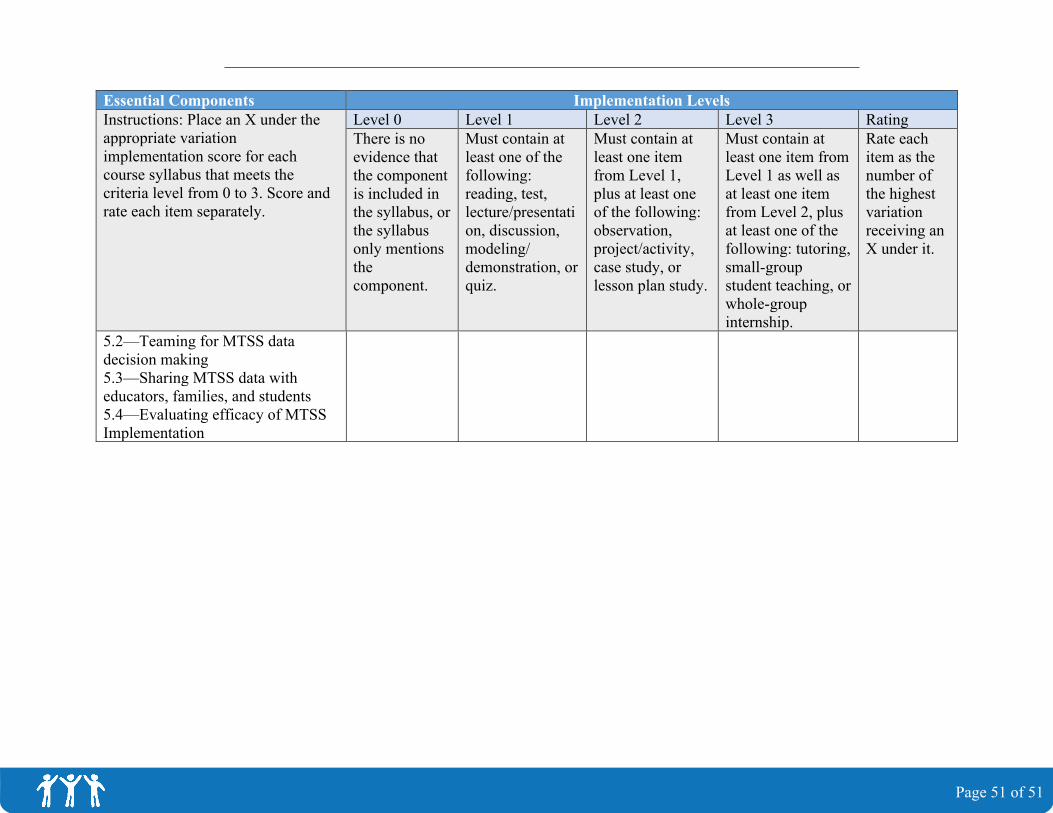
Page 51 of 51
Essential Components Implementation Levels Instructions: Place an X under the appropriate variation implementation score for each course syllabus that meets the criteria level from 0 to 3. Score and rate each item separately.
Level 0 Level 1 Level 2 Level 3 Rating There is no evidence that the component is included in the syllabus, or the syllabus only mentions the component.
Must contain at least one of the following: reading, test, lecture/presentation, discussion, modeling/ demonstration, or quiz.
Must contain at least one item from Level 1, plus at least one of the following: observation, project/activity, case study, or lesson plan study.
Must contain at least one item from Level 1 as well as at least one item from Level 2, plus at least one of the following: tutoring, small-group student teaching, or whole-group internship.
Rate each item as the number of the highest variation receiving an X under it.
5.2—Teaming for MTSS data decision making 5.3—Sharing MTSS data with educators, families, and students 5.4—Evaluating efficacy of MTSS Implementation