Embed Size (px)
Citation preview
Assessment of wind energy for Nevada using towers and
mesoscale modelingDarko Koracin, Richard L. Reinhardt, Marshall B.
Liddle, Travis McCord, Domagoj Podnar, and Timothy B. Minor
Desert Research Institute,2215 Raggio Parkway, Reno, NV 89512

Background (I)
Nevada imports virtually all energyNevada legislature mandates utilities (Nevada Power and Sierra Pacific companies) to produce 15% of energy by 2015 from renewable sourcesNevada is 21st state by the wind energy potentialWind resource in Nevada is highly variable in time and space
Background (II)
Nevada’s Congressional Delegation initiated assessment of Nevada’s renewable energies.Desert Research Institute of the Nevada System of Higher Education was funded through the Department of Energy –National Renewable Laboratory to estimate wind power density in Nevada using meteorological tower measurements and computer modeling.Sierra Pacific Resources – industry partner.

Reference – existing Wind Resource Map (TrueWind/DOE NREL)

DRI Wind Energy Projects – DOE/NREL Funding(1) Nevada Wind Assessment
Mesoscale modeling – annual cycle (2001/2002) with 9 and 3 km resolution over Nevada.
Analysis of 80 Remote Automated
Weather Stations
Period: Sep 2001 – Aug 2002

DRI Wind Energy Projects – DOE/NREL Funding(2) Nevada Wind Assessment (II)
(b) Mesoscale modeling – annual cycle (2001/2002) with 2 km resolution over Nevada.- improving wind power density maps
(a) Four 50m wind towers installed in
western Nevada near Tonopah
(c) UNLV – Microscale modeling
(D. Pepper)
Period: Aug 2003 – July 2004

Topographical map of the area around the four 50 m towers near Tonopah, Nevada.
Wind speed measurements are at five levels (10, 20, 30, 40, and 50m)
Meteorological towers
Use: Direct wind speed measurements at hub and blade heights;
model evaluation

DRI Wind Energy Projects – DOE/NREL Funding(3) Tall wind tower deployment
(b) Mesoscale modeling – b1) Turbulence measurements and modeling; b2) Downscaling of wind forecasts from 30 km to several hundred meters resolution.
(a) A 80m communication tower equipped
with standard and sonic anemometers at
three levels near Tonopah.

DRI Wind Energy Projects – DOE/NREL Funding
(4a) Wind towers in southern NevadaProposal approved, but funding is not available yet.One 120 m wind tower (Searchlight)Four 50m towers (Bullfrog Mountain, AmargosaValley, Indian Springs, and Goodsprings)Mesoscale modeling – Model evaluation: winds, turbulence, downscaling
DRI Wind Energy Projects – DOE/NREL Funding
(4b) Adaptive-grid OMEGA modelingProposal approved, but funding is not available yet.DRI, UNLV, and Meso Inc.High-resolution modeling with variable resolution; highest resolution in the areas of interest.

Comparison: SODAR vs. tower data at 50 m tower - Tonopah

Comparison between MM5-simulated and RAWS-measured wind speed for the Brawley Peaks station.
Model evaluation – surface stations

Histograms of wind speed (left) and wind direction (right) at the Brawley Peaks station for the annual period (1 August 2003 – 31 July 2004).
RAWS
MM5
RAWS
MM5
Model evaluation – surface stations
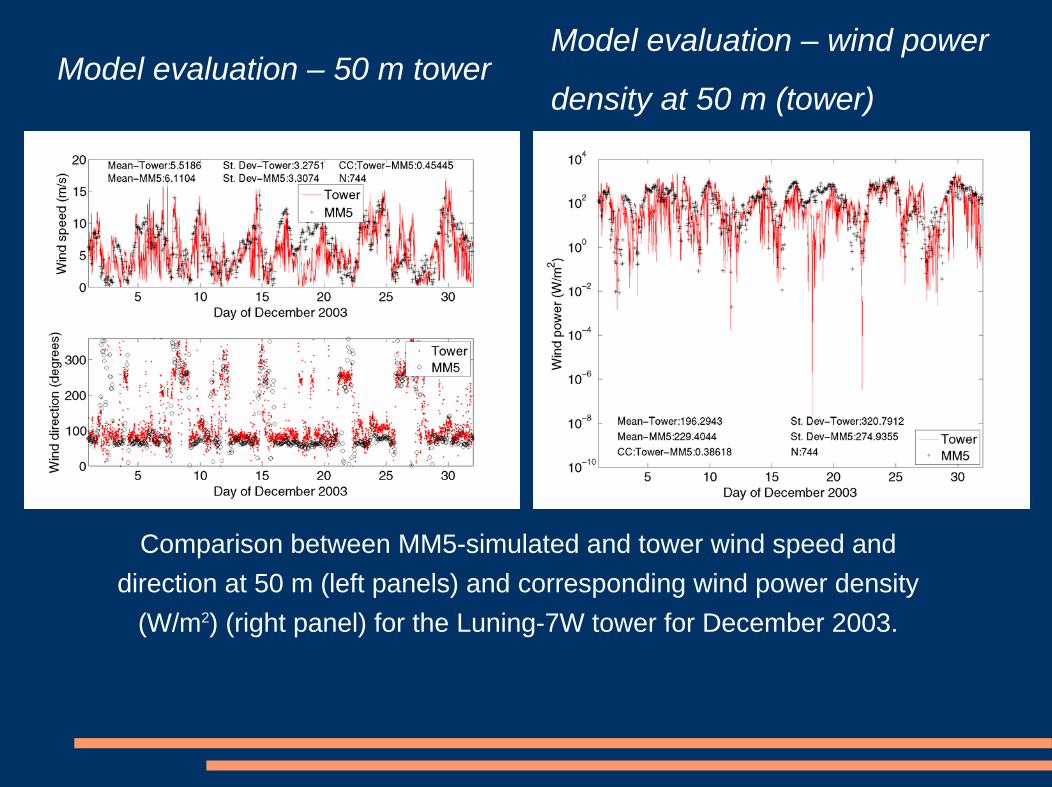
Comparison between MM5-simulated and tower wind speed and direction at 50 m (left panels) and corresponding wind power density
(W/m2) (right panel) for the Luning-7W tower for December 2003.
Model evaluation – 50 m towerModel evaluation – wind power
density at 50 m (tower)
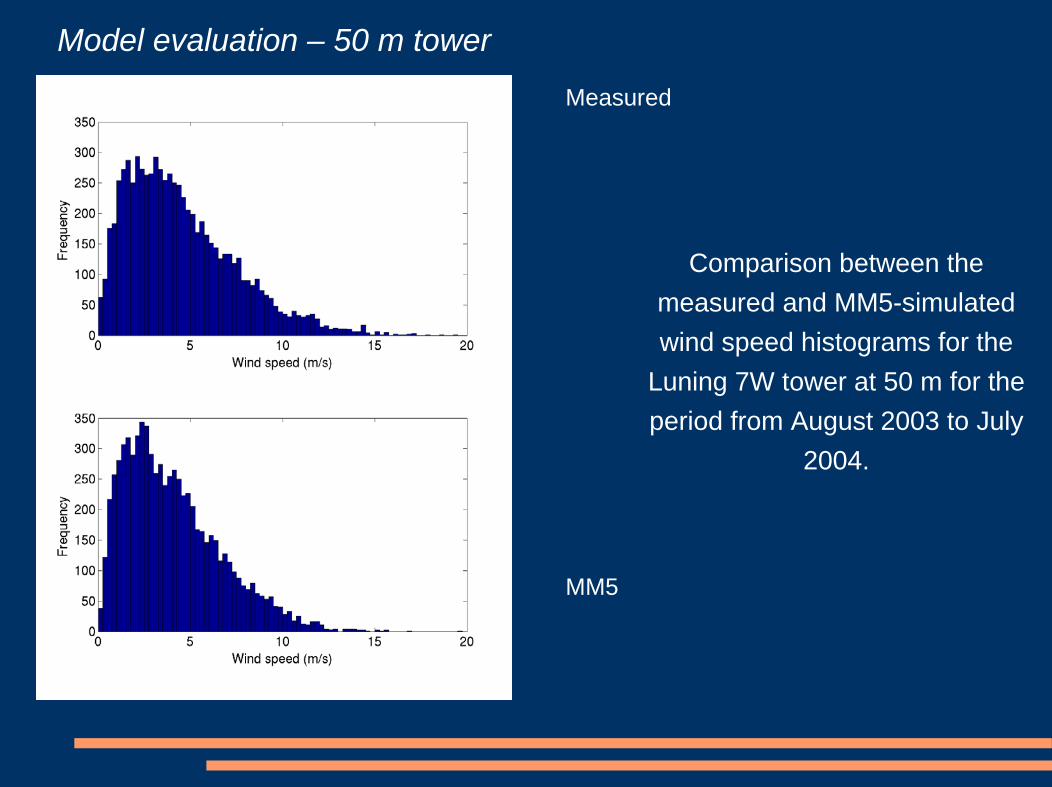
Comparison between the measured and MM5-simulated wind speed histograms for the
Luning 7W tower at 50 m for the period from August 2003 to July
2004.
Measured
MM5
Model evaluation – 50 m tower

Three-way comparison of the wind power density
at the four tower locations computed from the tower data, atmospheric model results for the period from August 2003 to July 2004,
and the TrueWind estimates.

Percentage differences of the wind power density from MM5 (green) and TrueWind (brown)
versus the towers with (left-hand side) and without (right-hand side) the Tonopah tower
location.

MM5 - Wind Power Density (W/m2) – Annual mesoscalesimulations
10m
90m
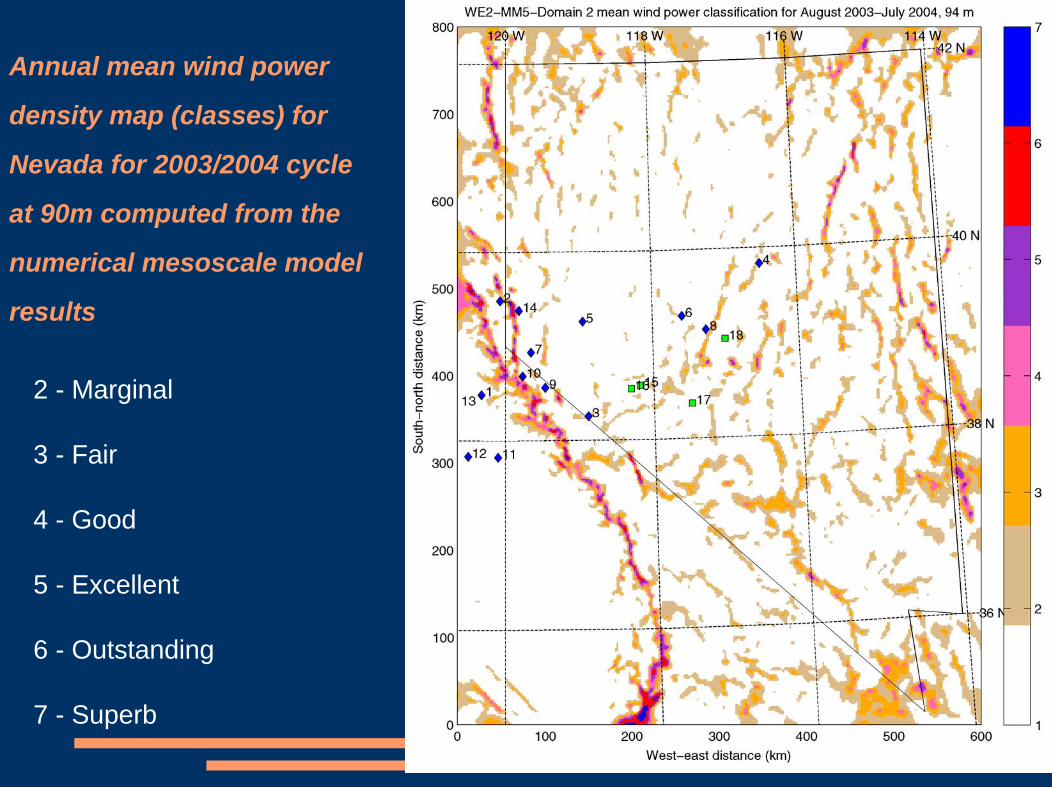
Annual mean wind power
density map (classes) for
Nevada for 2003/2004 cycle
at 90m computed from the
numerical mesoscale model
results
2 - Marginal
3 - Fair
4 - Good
5 - Excellent
6 - Outstanding
7 - Superb

Animation – wind power density class for every day in April 2004 at 4am and 4pm local time
Reference – existing Wind Resource Map
Current and planned modeling – wind variability, winds aloft, short-term andlong-term forecasting
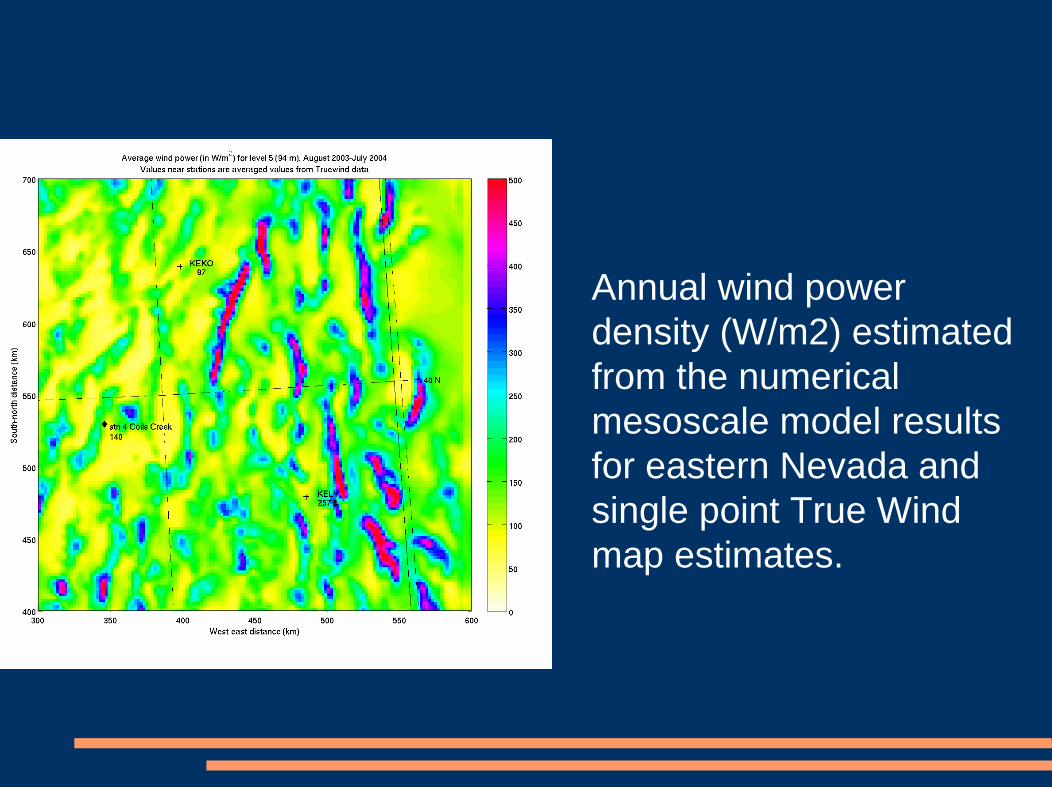
Annual wind power density (W/m2) estimated from the numerical mesoscale model results for eastern Nevada and single point True Wind map estimates.

Wind power density (W/m2) over Nevada at 50 m as estimated from the MM5 simulations from 1 September 2001 through 31 August 2002 (WE1_01_02) (left panel) and from 1 August 2003 through 31 July 2004 (WE2_03_04) (right panel).

Differences in the wind power density (W/m2) between the annual cycle of MM5 simulations for 2001/2002 (left panel) and 2003/2004 (right panel)
with the TrueWind results over Nevada at 50 m.

CONCLUSIONSThe MM5 results compared well with the tower dataThe model results for both annual cycles show similar resultsGreatest wind power density simulated over the Sierra Nevadas and
mountainous regionsCentral Nevada characterized by lower wind power densityTrueWind generally shows higher values for wind power density than MM5
TrueWind is lower than MM5 over the mountains
The results of this study suggest that the synthesis of the data from the network of tower observations and high-resolution mesoscale modeling is a crucial tool for assessing the wind power density in Nevada and more generally other topographically developed areas. Future efforts should also be directed at obtaining data from additional tower networks and at higher elevations as well as evaluating models to predict winds and turbulence at blade heights for mid-size and large wind turbines.
• The wind doesn't blow all the time. How much can it really contribute to a utility's generating capacity?
• How much energy can wind realistically supply to the U.S.?
• What is needed for wind to reach its full potential in the U.S.?
• How much energy can wind supply worldwide?• I've heard that Denmark is pulling back on wind
development. Does that mean wind is a failure?• What is the "energy payback time" for a wind
turbine? • What are your primary references?
Questions?