Embed Size (px)
Citation preview

Northeast Fisheries Science Center Reference Document 94-10
Assessment of the Georges Bank Cod Stock
for 1993
by
Ralph K. Mayo Loretta O'Brien
Fredric M. Serchuk
NOAA/National Marine Fisheries Service Northeast Fisheries Science Center
Conservation and Utilization Division Woods Hole, MA 02543-1097
May 1994
The Northeast Fisheries Science Center Reference Documents are a series of informal reports produced by the Center for timely transmission of results obtained through work at the various NEFSC labs. The documents are reviewed internally before publication. but are not considered formal literature. The National Marine Fisheries Service does not endorse any proprietary material, process, or product mentioned in these reports. To obtain additional copies of this report, contact Information Services Unit, Northeast Fisheries Science Center, Woods Hole, MA 02543 (508-548-5123, ext. 260).
The correct citation for the document is: Mayo, Ralph K" Loretta O'Brien, and Fredric M. Serchuk. 1994. Assessment of the Georges Bank Cod Stock for 1993. NOAA/NMFS/NEFSC: Woods Hole, MA. NEFSC [Northeast Fisheries Science Center] Ref Doc. 94-10.

Page iii
TABLE OF CONTENTS
Abstract .................................................................................................................................. 1
Introduction ............................................................................................................................ 1
The Fishery ............................................................................................................................. 2 Commercial Landings ........................................................................................................ 2 Recreational Catches ......................................................................................................... 3 Sampling Intensity ............................................................................................................. 5 Catch at Age ...................................................................................................................... 6 Mean Weights at Age ........................................................................................................ 11
Stock Abundance and Biomass Indices ................................................................................. 11 Commercial Catch Rates .................................................................................................. 11 Research Vessel Survey Indices ....................................................................................... 15
Mortality ............................................................................................................................... 19 Total Mortality Estimates ................................................................................................. 19 Natural Mortality ............................................................................................................. 21
Estimation of Fishing Mortality Rates and Stock Size ............................................................ 21 Virtual Population Analysis Calibration ........................................................................... 21 Precision of F and SSB ..................................................................................................... 26 Retrospective Analyses .................................................................................................... 29
Yield and Spawning Stock Biomass Per Recruit ..................................................................... 29
Projections For 1994 and 1995 .............................................................................................. 31 Recruitroent ..................................................................................................................... 31 Catch and Stock Size Projections ..................................................................................... 31
Conclusions .......................................................................................................................... 34
Acknowledgments ................................................................................................................. 34
Literature Cited ..................................................................................................................... 34
Appendix 1 ............................................................................................................................ 37
Appendix 2 ............................................................................................................................ 71

Page 1
ABSTRACT
The status of the Georges Bank cod (Gadus nwrhua) stock is reviewed and estimates of 1992 fishing mortality and 1993 stock size and spawning stock biomass are presented. Forecasts of 1994 landings and resulting 1995 spawning stock biomass at various levels of 1994 fishing mortality are also given. The 1993 assessment was based on several diverse sources of information including: U.S. and Canadian landings at age estimates, U.S. spring and autumn and Canadian spring research vessel survey data, and standardized U.S. commercial fishing effort data.
Total landings of Georges Bank cod declined in 1992 to 28,600 metric tons (mt) from a recent high of 42,500 mt in 1990. Landings projected through the end of 1993 are expected to decline further to approximately 23.000 mt, a decrease of about 50% since 1990 and the lowest annual total since the mid-1970s. United States landings have exhibited a proportional decrease similar to the overall trend. Despite sharp recent declines in landings, biological sampling has remained relatively intense.
Commercial landings per unit of standardized effort declined steadily between 1982 and 1987, appeared to stabilize at the low 1987 level through 1991, but declined sharply in 1992. Fisheryindependent spring and autumn bottom trawl surveys conducted by the Northeast Fisheries Science Center (NEFSC) have also documented a steady decline in total stock biomass since the early 1970s; the largest decreases have occurred since 1980. The 1993 indices suggest that the Georges Bank cod stock is either at or only slightly above a record-low biomass level. Recent recruitment indices of age 1 and 2 cod from the NEFSC autumn surveys have been among the lowest observed. Since 1980, only the 1983, 1985, 1987, and 1990 year classes were average or above.
Spawning stock biomass has declined from more than 90,000 mt during the early 1980s to record low levels of 48,000 mt in 1992 and 40,000 mt in 1993. At the present level of exploitation, the spawning stock is expected to decline further. Fishing mortality doubled between 1979 and 1985, declined brtefly durtng the mid-1980s, but increased again in 1988 and reached a record-high level in 1991, resulting in an exploitation rate of about 50%. Fishing mortality declined by about 10% between 1991 and 1992. At the present level of exploitation, landings from this stock are expected to decline to less than 19,000 mt in 1994 and spawning stock biomass is projected to decline to about 35,000 mt in 1995.
INTRODUCTION
Atlantic cod (Gadus nwrhua) in the Georges Bank area have been commercially exploited since the 17th century. Reliable landings statistics are available since 1893. Historically, the Georges Bank fishery (NAFO Division 5Z and Subarea 6) can be separated into five periods (Serchuk and Wigley 1992) (Figure 1); (1) 1893-1914, when high landings (> 40,000 mt) in 1895 and 1906-07 were followed by about 10 years of sharply reduced landings; (2) 1915-1940, when annual landings fluctuated between 20,000 and 30,000 mt, and when cod was generally taken as a bycatch in the Georges Bank haddock fishery; (3) 1940-1960, when landings declined, reaching a record low of 8,100 mt in 1953, and declines reflected a reduction in fishing activity during World War II and redirection of remaining fleet effort toward the more abundant haddock resource; (4) 1960-1976, when Canadian and distant-water fleet fisheries for Georges Bank cod developed and large increases in fishing effort for cod resulted in a fivefold increase in annual landings between 1960 and 1966 (from 11,000 to 53,000 mt), but landings sharply de-
clined afterward reaching only 20,000 tons in 1976; (5) 1977 onward, afiertheimplementation of extended fisheries jurisdiction by both the United States and Canada. Total landings of Georges Bank cod doubled between 1977 and 1982 (from 27,000 to 57,000 mt) declined to 26,000 mt in 1986, but increased to 42,500 mt in 1990 (Table 1). Commercial landings declined in 1992 to 28,600 mt and are expected to be only about 23,200 mt in 1993. Since October 1984, when the International Court of Justice delimited a maritime boundary between the United States and Canada in the Gulf of Maine/Georges Bank region, fishing activity by each country has been restricted to its own waters on Georges Bank.
This report presents an updated and revised analytical assessment of the Georges Bank cod stock (NAFO Division 5Z and Statistical Area 6) for the period 1978-1992 based on analysis of commercial landings and effort data and research vessel survey data through 1993. Previ-0us analytical assessments of this stock were conducted by the United States in 1986 (Serchuk

Page 2
70,------------------------------------------,70
-.E 60 Cl '(jj
3: 50 Q)
.:::
....I -U) 40 c (:? 030 .... Qi :E _ 20 o U)
o o 10 o
PERIOD 1 PERIOD 2 PERIOD 3 PERIOD 4 PERIOD 5
60
50
40
30
20
10
o ~ 0 1890 1900 1910 1920 1930 1940 1950 1960 1970 1980 1990 2000
YEAR
Figure 1. Total commercial landings of Georges Bank cod (Divisions 5Z and 6), 1893-1993.
1990; NEFC 1990), in 1991 (Serchuk etal. 1991; NEFSC 1992), and in 1992 (Serchuk et al. 1993; NEFSC 1993). Analytical assessments of the component of the Georges Bank cod stock in Canadian waters (Unit Areas 5Zj and 5Zm) have been conducted by the Canadian Atlantic Fisheries Scientific Advisory Committee (CAFSAC) in 1990 (Hunt 1990), 1991 (Huntetal. 1991), 1992 (Hunt and Buzeta 1992), and 1993 (Hunt and Buzeta 1993).
THE FISHERY
COMMERCIAL LANDINGS
Total commercial landings in 1992 were 28.600 mt, 24% lower than in 1991 (Table I). The United States and Canada, sale participants in the fishery since 1978, accounted for 59% and
41%, respectively, of the 1992 total. The 1992 U.S. landings (16,855 mt) were 30% less than in 1991, and the lowest U.S. total since 1976. Canadian 1992 landings totaled 11,700 mt. 13% lower than in 1991.
As in the past, otter trawl landings accounted for most (61 %) of the 1992 landings. The otter trawl fishery accounted for 76% of the 1992 U.S. landings (Table 2) and 48% of the Canadian landings (Hunt and Buzeta 1993). During 1978-1992. 85% of the U.S. landings and 61 % of the Canadian landings were attributable to otter trawl gear. United States cod landings from Georges Bank have been dominated by 'market' cod, which histOrically has accounted for between 40 and 60% of the total landings by weight [fable 3). During the mid-1960s, 'large' cod predominated, but the percentage has remained between 20 and 30% of the total since the early 1980s. The percentage of 'scrod' cod has increased from 10 to 20% during the 1960s and

Page 3
Table I. Commercial landings (metric tons, live) of Atlantic cod from Georges Bank and South (Division 52 and Subarea 6), 1960 - 1993
Year
USA Canada USSR
1960 10834 19 1961 14453 223 55 1962 15637 2404 5302 1963 14139 7832 5217 1964 12325 7108 5428 1965 11410 10598 14415 1966 11990 15601 16830 1967 13157 8232 511 1968 15279 9127 1459 1969 16782 5997 646 1970 14899 2583 364 1971 16178 2979 1270 1972 13406 2545 1878 1973 16202 3220 2977 1974 18377 1374 476 1975 16017 1847 2403 1976 14906 2328 933 1977 21138 6173 54 1978 26579 8778 1979 32645 5978 1980 40053 8063 1981 33849 8499 1982 39333 17824 1983 36756 12130 1984 32915 5763 1985 26828 10443 1986 17490 8411 1987 19035 11845 1988 26310 12932 1989 25097 8001 1990 28193 14310 1991 24175 13455 1992* 16855 11712 1993** 14200 9000
'Provisional "Predicted
1970s, to 20 to 30% durtng the 1980s, or about the same as that for 'large' cod.
RECREATIONAL CATCHES
An evaluation of the national saltwater angling surveys and the Maline Recreational Fishery Statistics Surveys (MRFSS) and a descrtption of histortc trends in recreational cod catches are provided bySerchuketal. (1993). Between 1981 and 1985, annual recreational cod landings exhibited little vartability; apart from 1984, annual
Country
Spain Poland Other Total
10853 14731
143 23486 1 27189
18 48 238 25165 59 1851 38333
8375 269 69 53134 14730 122 36752 14622 2611 38 43136 13597 798 119 37939 6874 784 148 25652 7460 256 36 28179 6704 271 255 25059 5980 430 114 28923 6370 566 168 27331 4044 481 216 25008 1633 90 36 19926
2 27367 35357 38623 48116 42348 57157 48886 38678 37271 25901 30880 39242 33098 42503 37630 28567 23200
catches varted between 8,000 amd 9,000 mt, and averaged 8,500 mt per year. Recreational cod catches declined in 1986 and 1987 to less than 4,000 mt. increased to more than 6,000 mt in 1988 and 1989, but declined to 5,000mtin 1990, 3,700mtin 1991, and were only 1,350mtin 1992 (Table 4).
Recreational catches have not been included in any of the assessment analyses since a number of problems still remain in estimating the quantity and Size/age composition of the recreational catch, by stock (Recreational Fishertes Statistics Working Group 1992). Among these are: (1) lack of recreational catch estimates in

Table 2. Distribution of U.S. commercial landings (metric tons, live) of Atlantic cod from Georges Bank (Area 5Ze), by gear type, 1965 - 1992. The percentage "tl ~
of total U.S. commercial landings of Atlantic cod from Georges Bank, by gear type, is also presented for each year. Data only reflect Georges Bank 10 ro
cod landings that could be identified by gear type. .. Landings (Metric Tons, Live) Percentage of Annual Landings
Year Otter Sink Line Handline Other Total Otter Sink Line Handline Other Total Trawl Gill Net Trawl Gear Trawl Gill Net Trawl Gear
1965 10251 0 582 505 9 11347 90.3 5.1 4.5 0.1 100.0 1966 10206 0 787 757 19 11769 86.7 6.7 6.4 0.2 100.0 1967 10915 0 894 704 9 12522 87.2 7.1 5.6 0.1 100.0 1968 12084 0 936 524 <1 13544 89.2 6.9 3.9 100.0 1969 13194 0 1371 387 <1 14952 88.2 9.2 2.6 100.0 1970 11270 0 1676 404 <1 13350 84.4 12.6 3.0 100.0 1971 12436 0 2334 230 2 15002 82.9 15.6 1.5 100.0 1972 10179 0 2071 217 10 12477 81.6 16.6 1.7 0.1 100.0 1973 12431 3 2185 206 21 14846 83.7 14.7 1.4 0.2 100.0 1974 14078 3 2548 11 9 16649 84.6 15.3 0.1 100.0 1975 12069 0 2435 84 4 14592 82.7 16.7 0.6 100.0 1976 12257 4 1519 153 5 13938 88.0 10.9 1.1 100.0 1977 18529 30 912 83 22 19576 94.7 0.2 4.7 0.4 0.1 100.0 1978 20862 81 1569 1180 59 23751 87.8 0.3 6.6 5.0 0.3 100.0 1979 26562 620 2707 860 159 30908 85.9 2.0 8.8 2.8 0.5 100.0 1980 32479 4491 1102 0 273 38345 84.7 11.7 2.9 0.7 100.0 1981 27694 3515 120 584 197 32110 86.2 10.9 0.4 1.8 0.6 100.0 1982 33371 2935 385 624 210 37525 88.9 7.8 1.0 1.7 0.6 100.0 1983 30981 1812 831 441 81 34146 90.7 5.3 2.4 1.3 0.3 100.0 1984 26161 2573 366 753 197 30050 87.1 8.6 1.2 2.5 0.6 100.0 1985 21444 2482 436 284 163 24809 86.4 10.0 1.8 1.1 0.7 100.0 1986 13576 1679 692 305 95 16347 83.0 10.3 4.2 1.9 0.6 100.0 1987 13711 1522 1636 222 71 17162 79.9 8.9 9.5 1.3 0.4 100.0 1988 20296 1864 1950 232 116 24458 83.0 7.6 8.0 0.9 0.5 100.0 1989 17946 3150 1583 119 91 22889 78.4 13.8 6.9 0.5 0.4 100.0 1990 21707' 2316 1252 395 133 25803 84.1 9.0 4.9 1.5 0.5 100.0 1991 178922 2171 1919 286 180 22448 79.7 9.7 8.5 1.3 0.8 100.0 1992 11696' 1747 1709 186 114 15452 75.7 11.3 11.1 1.2 0.7 100.0
I Includes 849 tons taken by pair trawl (Note: 1990 was the flrst year that pair trawl landings exceeded a few tons) 2 Includes 1068 tons taken by pair trawl 3 Includes 1149 tons taken by pair trawl

Table 3. Percentage (by weight) of U.S. commercial Atlantic cod landings from Georges Bank and South (NAFO Division 52 and Statistical Area 6), by market category, 1964 - 1992
Year Georges Bank and South
Large Market Scrod Total tal
1964 45 47 8 100 1965 56 40 3 100 1966 53 37 10 100 1967 41 42 16 100 1968 34 46 19 100 1969 27 57 16 100 1970 30 62 8 100 1971 40 51 9 100 1972 37 53 10 100 1973 24 40 36 100 1974 24 59 17 100 1975 28 62 10 100 1976 34 48 18 100 1977 26 39 34 100 1978 29 60 11 100 1979 37 55 8 100 1980 41 47 12 100 1981 36 49 12 100 1982 31 47 22 100 1983 25 53 21 100 1984 31 56 12 100 1985 27 46 25 100 1986 30 47 21 100 1987 25 37 36 100 1988 27 47 24 100 1989 23 52 22 100 1990 32 44 22 100 1991 31 48 19 100 1992 26 41 30 100
fa] Includes landings of 'mixed' cod
January and February when some party boats in Massachusetts, Rhode Island, and New York land cod; (2) inability to properly categorize catches oflong-range trips (e.g., to Georges Bank) that are being made in increasing numbers by party boats, from Maine to New York; (3) catch estimates for the Georges Bank stock are imprecise [Le., relatively large CVs], and (4) length frequency sampling intensity, particularly for the Georges Bank stock, is low and is probably insufficient to accurately characterize the size composition of the catch. Moreover, length frequency sampling is opporiunistic and thus samples are not distributed in proportion to the catch, by time, fishing mode, or state of landing.
Page 5
Table 4. Estimated number (thousands) and weight (metric tons, live) of Atlantic cod caught by marine recreational fishermen, in 1960, 1965, 1970, 1974, and 1979 - 1992'
Year All Regions Georges Bank Stock
No, Wt, No, Wt, of Cod of Cod of Cod of Cod (1000) (mt) (1000) (mt)
1960 4791 14016 Not Estimated 1965 5032 13565 Not Estimated 1970 3844 16292 Not Estimated 1974 2901 12368 Not Estimated 1979 3091 4026 393 580 1980 2440 7331 186 471 1981 4845 9712 1605 4677 1982 3250 8244 1453 5296 1983 3747 7542 1693 4920 1984 2562 5080 832 2406 1985 3674 7664 1998 4635 1986 1548 3510 331 1092 1987 2063 3779 467 1168 1988 2966 7327 1494 4284 1989 2463 6119 538 1875 1990 2635 5144 690 1696 1991 1854 3727 444 1255 1992 720 954 209 507
I From 1979-1992 Marine Recreational Fishery Statistics Survey expanded catch estimates
SAMPLING INTENSITY
A summary of U.S. and Canadian length frequency and age sampling of Georges Bank cod landlngs during 1978-1992 is presented in Table 5. United States length frequency sampling averaged one sample per 314 mtlanded over the 15-year period but, since 1982, has improved to one sample per 276 mt landed. Sampling intensity in 1992 (l sample per 219 mt) was greater than in preceding years (1990: 1 sample per 340 mt; 1991: 1 sample per 275 mt). Virtually all of the U.S. samples have been taken from otter trawl landings, but sampling is proportionally stratified by market category (scrod, market, and large). Canadian sampling intensity has historically been much lower than that in the U.S. fishery. Prior to 1985, Canadian sampling coverage averaged about one sample per 1000 mt landed (Hunt and Buzeta 1992). Sampling intensity has markedly improved since 1985 and has averaged one sample per 290 mt landed during the 1986-1992 period. Sampling intensity in

Page 6
Table 5. United States and Canadian sampling of commercial Atlantic cod landings from the Georges Banir and South cod stock (NAFO Division 5Z and Statistical Area 6), 1978 - 1992
United States Canada
Length Samples Age Samples Length Samples Age Samples
Year No. # Fish No. # Fish No. # Fish No. # Fish Measured Aged Measured Aged
1978 88 6841 76 1463 29 7684 29 1308 1979 80 6973 79 1647 13 3991 13 656 1980 69 4990 67 1119 10 2784 10 536 1981 59 4304 59 1231 17 4147 16 842 1982 151 11970 147 2579 17 4756 8 858 1983 146 12544 138 2945 15 3822 14 604 1984 100 8721 100 2431 7 1889 7 385 1985 100 8366 100 2321 18 7644 18 1062 1986 94 7515 94 2222 19 5745 19 888 1987 80 6395 79 1704 33 9477 33 1288 1988 76 6483 76 1576 43 11709 43 1984 1989 66 5547 66 1350 32 8716 32 1561 1990 83 7158 83 1700 40 9901 40 2012 1991 88 7708 88 1865 45 10873 45 1782 1992 77 6549 77 1631 48 10878 48 1906
Sources: U.S. data:1978-1988 from Serchuk and Wigley 1990 (SAW 11, Working Paper 1); U.S. data, 1989-1992. fromNEFSC files; Canadian data, 1978-1992, from Hunt and Buzeta 1993 (CAFSAC Res Doc 93/39)
1992 was 1 sample per 244 mt (Hunt and Buzeta 1993). Canadian samples are primartly from otter trawl landings (Hunt 1988. 1990). Canadian sampling is not done by market category but representative samples of the landings are taken.
CATCH AT AGE
Age composition ofU .S. landings during 1978-1992 was estimated, by market category, from monthly length frequency and age samples, pooled by calendar quarter. Quarterly mean weights, by market category. were obtained from applying the U.S. cod length-weight equation:
In Weight (kg.live' = -11. 7231 + 3.0521ln Length (em)
to the quarterly market category sample length frequencies. Mean weight values were then divided into quarterly market category landings to derive estimated numbers landed by quarter, by market category. Quarterly age/length keys were then applied to the quarterly market category numbers at length distributions to provide numbers at age. These values were summed over market categories and quarters to attain the
annual U.S. landings-at -age matrix [fable 6). Derivation of catch by quarter, rather than by month, was performed since not all months had at least two length frequency samples per market category (Le., minimum desired for monthly catch estimates) .
For many of the length frequency samples, sample weights were also available. These were converted (x 1.17) to live weights and compared to the calculated weights from the length-weight equation. In most cases, the differences were small «5%) implying that use of the lengthweight equation to derive landings numbers imparted little, if any, bias to the catch calculations.
Canadianlandings-at-age data for 1978-1992 (Table 7) were taken from Hunt and Buzeta (1993) and combined with the U.S. data to produce an overall landings-at -age matrix for the 1978-1992 period (Table 8). The proportions of the total landings accounted for by the United States and Canada are also indicated in Table 8.
Commercial landings in 1992 were dominated by the 1989 and 1990 year classes [fable 9). Together, these two cohorts accounted for 65% of the landings by number and 41% by weight. As in 1991, the 1988 year class was more dominant in the U.S. fishery than in the Cana-
Page 7
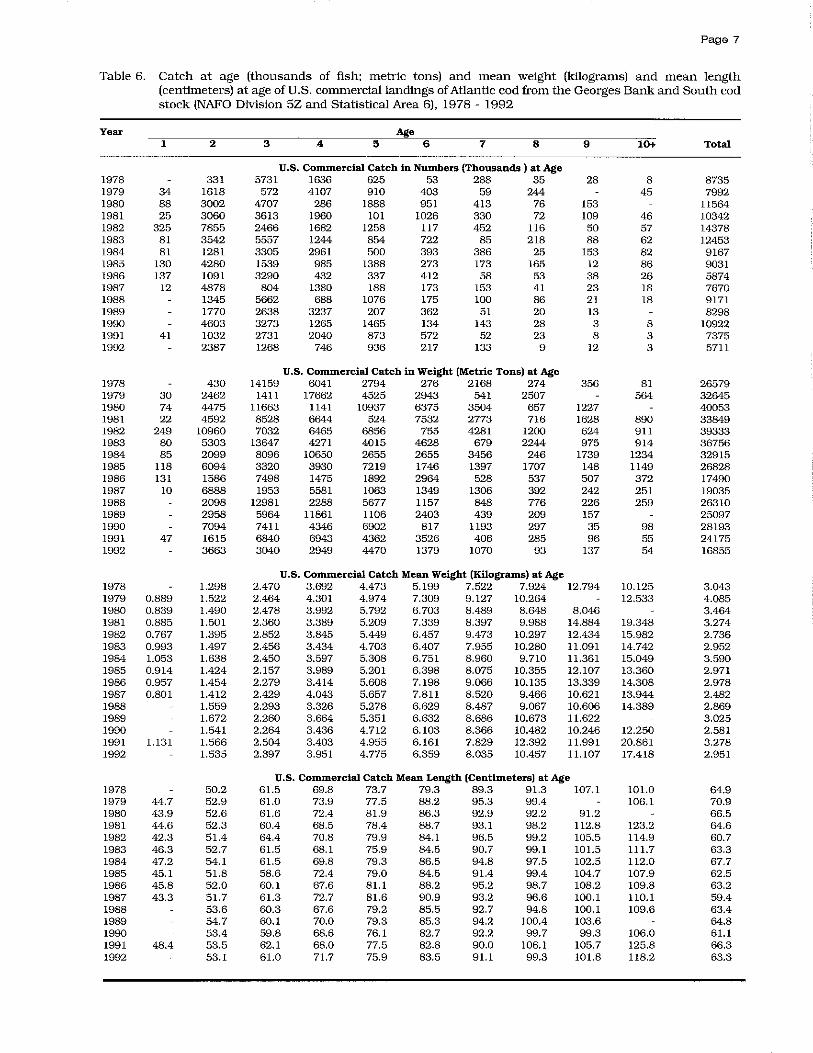
Table 6. Catch at age (thousands of fish: metric tons) and mean weight (kilograms) and mean length (centimeters) at age ofU .S. comrnerciallandings of Atlantic cod from the Georges Bank and South cod stock (NAFO Division 52 and Statistical Area 6). 1978 - 1992
Year Age 1 2 3 4 5 6 7 8 9 10+ Total
U.S. Commercial Catch in Numbers (Thousands) at Age 1978 331 5731 1636 625 53 288 35 28 8 8735 1979 34 1618 572 4107 910 403 59 244 45 7992 1980 88 3002 4707 286 1888 951 413 76 153 ll564 1981 25 3060 3613 1960 101 1026 330 72 109 46 10342 1982 325 7855 2466 1682 1258 ll7 452 ll6 50 57 14378 1983 81 3542 5557 1244 854 722 85 218 88 62 12453 1984 81 1281 3305 2961 500 393 386 25 153 82 9167 1985 130 4280 1539 985 1388 273 173 165 12 86 9031 1986 137 1091 3290 432 337 412 58 53 38 26 5874 1987 12 4878 804 1380 188 173 153 41 23 18 7670 1988 1345 5662 688 1076 175 100 86 21 18 9171 1989 1770 2638 3237 207 362 51 20 13 8298 1990 4603 3273 1265 1465 134 143 28 3 8 10922 1991 41 1032 2731 2040 873 572 52 23 8 3 7375 1992 2387 1268 746 936 217 133 9 12 3 5711
U.S. Commercial Catch in Weight (Metric Tons) at Age 1978 430 14159 6041 2794 276 2168 274 356 81 26579 1979 30 2462 14ll 17662 4525 2943 541 2507 564 32645 1980 74 4475 11663 1141 10937 6375 3504 657 1227 40053 1981 22 4592 8528 6644 524 7532 2773 716 1628 890 33849 1982 249 10960 7032 6465 6856 755 4281 1200 624 9ll 39333 1983 80 5303 13647 4271 4015 4628 679 2244 975 914 36756 1984 85 2099 8096 10650 2655 2655 3456 246 1739 1234 32915 1985 ll8 6094 3320 3930 7219 1746 1397 1707 148 ll49 26828 1986 131 1586 7498 1475 1892 2964 528 537 507 372 17490 1987 10 6888 1953 5581 1063 1349 1306 392 242 251 19035 1988 2098 12981 2288 5677 1157 848 776 226 259 26310 1989 2958 5964 11861 ll06 2403 439 209 157 25097 1990 7094 7411 4346 6902 817 ll93 297 35 98 28193 1991 47 1615 6840 6943 4362 3526 406 285 96 55 24175 1992 3663 3040 2949 4470 1379 1070 93 137 54 16855
U.S. Commercial Catch Mean Weight (Kilograms) at Age 1978 1.298 2.470 3.692 4.473 5.199 7.522 7.924 12.794 10.125 3.043 1979 0.889 1.522 2.464 4.301 4.974 7.309 9.127 10.264 12.533 4.085 1980 0.839 1.490 2.478 3.992 5.792 6.703 8.489 8.648 8.046 3.464 1981 0.885 1.501 2.360 3.389 5.209 7.339 8.397 9.988 14.884 19.348 3.274 1982 0.767 1.395 2.852 3.845 5.449 6.457 9.473 10.297 12.434 15.982 2.736 1983 0.993 1.497 2.456 3.434 4.703 6.407 7.955 10.280 11.091 14.742 2.952 1984 1.053 1.638 2.450 3.597 5.308 6.751 8.960 9.710 11.361 15.049 3.590 1985 0.914 1.424 2.157 3.989 5.201 6.398 8.075 10.355 12.107 13.360 2.971 1986 0.957 1.454 2.279 3.414 5.608 7.198 9.066 10.135 13.339 14.308 2.978 1987 0.801 1.412 2.429 4.043 5.657 7.8ll 8.520 9.466 10.621 13.944 2.482 1988 1.559 2.293 3.326 5.278 6.629 8.487 9.067 10.606 14.389 2.869 1989 1.672 2.260 3.664 5.351 6.632 8.686 10.673 11.622 3.025 1990 1.541 2.264 3.436 4.712 6.103 8.366 10.482 10.246 12.250 2.581 1991 1.131 1.566 2.504 3.403 4.955 6.161 7.829 12.392 11.991 20.861 3.278 1992 1.535 2.397 3.951 4.775 6.359 8.035 10.457 11.107 17.418 2.951
U.S. Commercial Catch Mean Length (Centimeters) at Age 1978 50.2 61.5 69.8 73.7 79.3 89.3 91.3 107.1 101.0 64.9 1979 44.7 52.9 61.0 73.9 77.5 88.2 95.3 99.4 106.1 70.9 1980 43.9 52.6 61.6 72.4 81.9 86.3 92.9 92.2 91.2 66.5 1981 44.6 52.3 60.4 68.5 78.4 88.7 93.1 98.2 ll2.8 123.2 64.6 1982 42.3 51.4 64.4 70.8 79.9 84.1 96.5 99.2 105.5 ll4.9 60.7 1983 46.3 52.7 61.5 68.1 75.9 84.5 90.7 99.1 101.5 111.7 63.3 1984 47.2 54.1 61.5 69.8 79.3 86.5 94.8 97.5 102.5 112.0 67.7 1985 45.1 51.8 58.6 72.4 79.0 84.5 91.4 99.4 104.7 107.9 62.5 1986 45.8 52.0 60.1 67.6 81.1 88.2 95.2 98.7 108.2 109.8 63.2 1987 43.3 51.7 61.3 72.7 81.6 90.9 93.2 96.6 100.1 llO.1 59.4 1988 53.6 60.3 67.6 79.2 85.5 92.7 94.8 100.1 109.6 63.4 1989 54.7 60.1 70.0 79.3 85.3 94.2 100.4 103.6 64.8 1990 53.4 59.8 68.6 76.1 82.7 92.2 99.7 99.3 106.0 61.1 1991 48.4 53.5 62.1 68.0 77.5 82.8 90.0 106.1 105.7 125.8 66.3 1992 53.1 61.0 71.7 75.9 83.5 91.1 99.3 101.8 ll8.2 63.3
Page 8
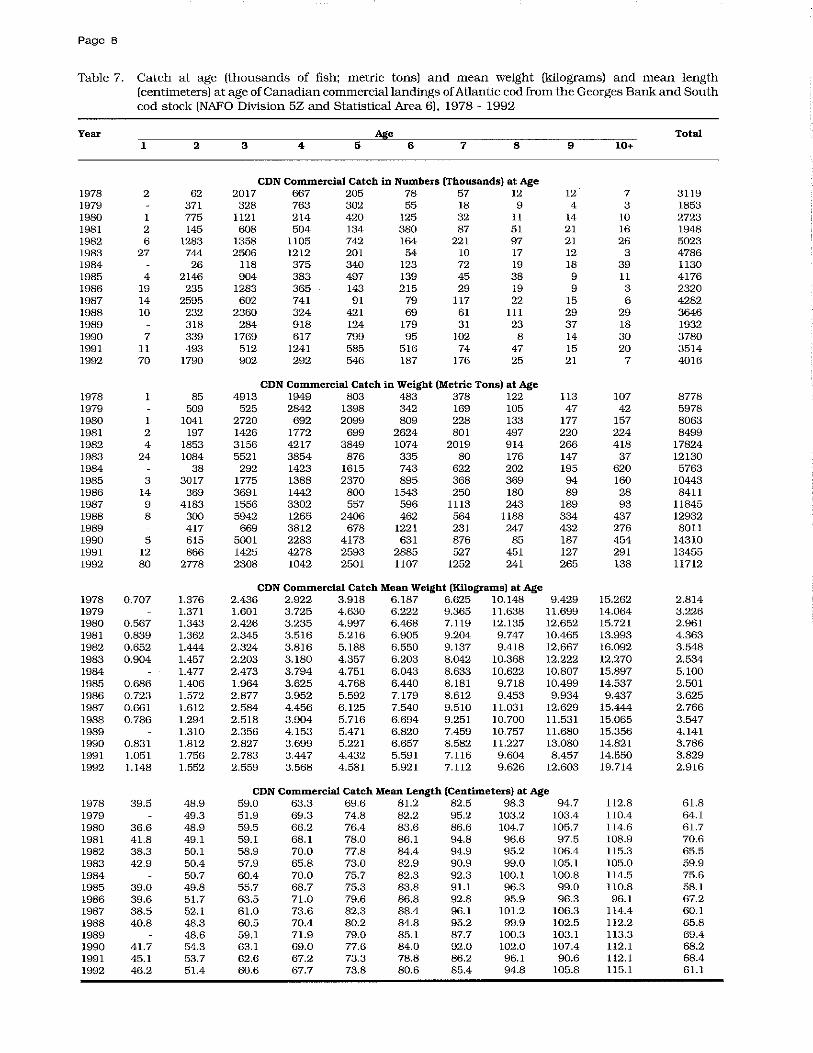
Table 7. Catch at age (thousands of fish; metric tons) and mean weight (kilograms) and mean length (centimeters) at age of Canadian commercial landings of Atlantic cod from the Georges Bank and South cod stock (NAFO Division 5Z and Statistical Area 6), 1978 . 1992
Year Aj(e Total 1 2 3 4 5 6 7 8 9 10+
CDN Commercial Catch in Numbers (Thousands) at Age 1978 2 62 2017 667 205 78 57 12 12 7 3119 1979 371 328 763 302 55 18 9 4 3 1853 1980 1 775 1121 214 420 125 32 11 14 10 2723 1981 2 145 608 504 134 380 87 51 21 16 1948 1982 6 1283 1358 1105 742 164 221 97 21 26 5023 1983 27 744 2506 1212 201 54 10 17 12 3 4786 1984 26 118 375 340 123 72 19 18 39 1130 1985 4 2146 904 383 497 139 45 38 9 11 4176 1986 19 235 1283 365 143 215 29 19 9 3 2320 1987 14 2595 602 741 91 79 117 22 15 6 4282 1988 10 232 2360 324 421 69 61 111 29 29 3646 1989 318 284 918 124 179 31 23 37 18 1932 1990 7 339 1769 617 799 95 102 8 14 30 3780 1991 11 493 512 1241 585 516 74 47 15 20 3514 1992 70 1790 902 292 546 187 176 25 21 7 4016
CDN Commercial Catch in Weight (Metric Tons) at Age 1978 85 4913 1949 803 483 378 122 113 107 8778 1979 509 525 2842 1398 342 169 105 47 42 5978 1980 1 1041 2720 692 2099 809 228 133 177 157 8063 1981 2 197 1426 1772 699 2624 801 497 220 224 8499 1982 4 1853 3156 4217 3849 1074 2019 914 266 418 17824 1983 24 1084 5521 3854 876 335 80 176 147 37 12130 1984 38 292 1423 1615 743 622 202 195 620 5763 1985 3 3017 1775 1388 2370 895 368 369 94 160 10443 1986 14 369 3691 1442 800 1543 250 180 89 28 8411 1987 9 4183 1556 3302 557 596 1113 243 189 93 11845 1988 8 300 5942 1265 2406 462 564 1188 334 437 12932 1989 417 669 3812 678 1221 231 247 432 276 8011 1990 5 615 5001 2283 4173 631 876 85 187 454 14310 1991 12 866 1425 4278 2593 2885 527 451 127 291 13455 1992 80 2778 2308 1042 2501 1107 1252 241 265 138 11712
CDN Commercial Catch Mean Weight (Kilograms) at Age 1978 0.707 1.376 2.436 2.922 3.918 6.187 6.625 10.148 9.429 15.262 2.814 1979 1.371 1.601 3.725 4.630 6.222 9.365 11.638 11.699 14.064 3.226 1980 0.567 1.343 2.426 3.235 4.997 6.468 7.119 12.135 12.652 15.721 2.961 1981 0.839 1.362 2.345 3.516 5.216 6.905 9.204 9.747 10.465 13.993 4.363 1982 0.652 1.444 2.324 3.816 5.188 6.550 9.137 9.418 12.667 16.092 3.548 1983 0.904 1.457 2.203 3.180 4.357 6.203 8.042 10.368 12.222 12.270 2.534 1984 1.477 2.473 3.794 4.751 6.043 8.633 10.622 10.807 15.897 5.100 1985 0.686 1.406 1.964 3.625 4.768 6.440 8.181 9.718 10.499 14.537 2.501 1986 0.723 1.572 2.877 3.952 5.592 7.179 8.612 9.453 9.934 9.437 3.625 1987 0.661 1.612 2.584 4.456 6.125 7.540 9.510 11.031 12.629 15.444 2.766 1988 0.786 1.294 2.518 3.904 5.716 6.694 9.251 10.700 11.531 15.065 3.547 1989 1.310 2.356 4.153 5.471 6.820 7.459 10.757 11.680 15.356 4.141 1990 0.831 1.812 2.827 3.699 5.221 6.657 8.582 11.227 13.080 14.821 3.786 1991 1.051 1.756 2.783 3.447 4.432 5.591 7.116 9.604 8.457 14.550 3.829 1992 1.148 1.552 2.559 3.568 4.581 5.921 7.112 9.626 12.603 19.714 2.916
CDN Commercial Catch Mean Length (Centimeters) at Age 1978 39.5 48.9 59.0 63.3 69.6 81.2 82.5 98.3 94.7 112.8 61.8 1979 49.3 51.9 69.3 74.8 82.2 95.2 103.2 103.4 110.4 64.1 1980 36.6 48.9 59.5 66.2 76.4 83.6 86.6 104.7 105.7 114.6 61.7 1981 41.8 49.1 59.1 68.1 78.0 86.1 94.8 96.6 97.5 108.9 70.6 1982 38.3 50.1 58.9 70.0 77.S 84.4 94.9 95.2 106.4 115.3 65.5 1983 42.9 50.4 57.9 65.8 73.0 82.9 90.9 99.0 105.1 105.0 59.9 1984 50.7 60.4 70.0 75.7 82.3 92.3 100.1 100.8 114.5 75.6 1985 39.0 49.8 55.7 68.7 75.3 83.8 91.1 96.3 99.0 110.8 58.1 1986 39.6 51.7 63.5 71.0 79.6 86.8 92.8 95.9 96.3 96.1 67.2 1987 38.5 52.1 61.0 73.6 82.3 88.4 96.1 101.2 106.3 114.4 60.1 1988 40.8 48.3 60.5 70.4 80.2 84.8 95.2 99.9 102.5 112.2 65.8 1989 48.6 59.1 71.9 79.0 85.1 87.7 100.3 103.1 113.3 69.4 1990 41.7 54.3 63.1 69.0 77.6 84.0 92.0 102.0 107.4 112.1 68.2 1991 45.1 53.7 62.6 67.2 73.3 78.8 86.2 96.1 90.6 112.1 68.4 1992 46.2 51.4 60.6 67.7 73.8 80.6 85.4 94.8 105.8 U5.1 61.1

Page 9
Table 8. Landings at age (tbousands of fish; metric tons) and mean weight (kilograms) and mean lengtb (centimeters) at age of total commercial landings of Atlantic cod from tbe Georges Bank and Soutb cod stock (NAFO Division 5Z and Statistical Area 6). 1978 - 1992
Year Age ~% of Total _~ding_~ ____ .
1 2 3 4 5 6 7 8 9 10+ Total U.S. Canada
Total Commercial Landings in Numbers (Thousands) at Age 1978 2 393 7748 2303 830 131 345 47 40 15 11854 73.7 26.3 1979 34 1989 900 4870 1212 458 77 253 4 48 9845 81.2 18.8 1980 89 3777 5828 500 2308 1076 445 87 167 10 14287 80.9 19.1 1981 27 3205 4221 2464 235 1406 417 123 130 62 12290 84.1 15.9 1982 331 9138 3824 2787 2000 281 673 213 71 83 19401 74.1 25.9 1983 108 4286 8063 2456 1055 776 95 235 100 65 17239 72.2 27.8 1984 81 1307 3423 3336 840 516 458 44 171 121 10297 89.0 11.0 1985 134 6426 2443 1368 1885 412 218 203 21 97 13207 68.4 31.6 1986 156 1326 4573 797 480 627 87 72 47 29 8194 71.7 28.3 1987 26 7473 1406 2121 279 252 270 63 38 24 11952 64.2 35.8 1988 10 1577 8022 1012 1497 244 161 197 50 47 12817 71.6 28.4 1989 2088 2922 4155 331 541 82 43 50 18 10230 81.1 18.9 1990 7 4942 5042 1882 2264 229 245 36 17 38 14702 74.3 25.7 1991 52 1525 3243 3281 1458 1088 126 70 23 23 10889 67.7 32.3 1992 70 4177 2170 1038 1482 404 309 34 33 10 9737 58.7 41.3
Total Commercial Landings in Weight (Tons) at Age 1978 1 515 18890 7990 3597 757 2549 395 465 198 35357 75.2 24,8 1979 30 2970 1936 20504 5923 3288 711 2611 44 606 38623 84.5 15.5 1980 75 5516 14382 1833 13036 7184 3735 793 1408 154 48116 83.2 16.8 1981 24 4789 9953 8416 1224 10156 3575 1212 1848 1151 42348 79.9 20.1 1982 253 12812 10187 10681 10705 1827 6303 2110 891 1388 57157 68.8 31.2 1983 105 6387 19167 8126 4891 4963 763 2418 1120 946 48886 75.2 24.8 1984 85 2137 8389 12074 4271 3401 4078 447 1938 1858 38678 85.1 14.9 1985 121 9111 5095 5319 9588 2644 1765 2073 246 1309 37271 72.0 28.0 1986 145 1955 11189 2917 2692 4505 776 717 596 409 25901 67.5 32.5 1987 19 11071 3509 8882 1619 1945 2416 633 426 360 30880 61.6 38.4 1988 8 2399 18923 3552 8085 1618 1412 1960 566 719 39242 67.0 33.0 1989 3375 6633 15673 1783 3625 669 455 588 298 33098 75.8 24.2 1990 5 7709 12412 6629 11075 1448 2069 382 222 552 42503 66.3 33.7 1991 59 2481 8265 11221 6955 6411 933 736 223 346 37630 64.2 35.8 1992 80 6441 5348 3991 6971 2486 2322 334 402 192 28567 59.0 41.0
Total Commercial Landings Mean Weight (Kilograms) at Age 1978 0.707 1.310 2.461 3.469 4.336 5.787 7.374 8.492 11.785 13.200 2.983 1979 0.889 1.494 2.149 4.211 4.888 7.178 9.183 10.313 11.699 12.625 3.923 1980 0.836 1.460 2.468 3.668 5.647 6.676 8.390 9.089 8.432 15.400 3.368 1981 0.882 1.495 2.358 3.415 5.213 7.222 8.565 9.888 14.170 18.565 3.446 1982 0.765 1.402 2.664 3.834 5.352 6.511 9.363 9.897 12.503 16.723 2.946 1983 0.971 1.490 2.377 3.309 4.637 6.393 7.964 10.286 11.227 14.554 2.836 1984 1.053 1.635 2.451 3.619 5.083 6.582 8.909 10.104 11.303 15.356 3.756 1985 0.907 1.418 2.086 3.887 5.087 6.412 8.097 10.236 11.418 13.494 2.822 1986 0.929 1.475 2.447 3.660 5.603 7.191 8.915 9.955 12.687 14.104 3.161 1987 0.726 1.481 2.495 4.187 5.810 7.726 8.949 10.013 11.414 15.000 2.584 1988 0.786 1.520 2.359 3.511 5.401 6.647 8.776 9.987 11.143 15.298 3.062 1989 1.617 2.269 3.772 5.396 6.694 8.222 10.718 11.665 17.111 3.235 1990 0.831 1.560 2.462 3.522 4.892 6.333 8.456 10.648 12.580 14.526 2.891 1991 1.114 1.627 2.548 3.420 4.769 5.891 7.410 10.520 9.686 15.373 3.456 1992 1.148 1.542 2.464 3.843 4.704 6.156 7.509 9.846 12.059 19.025 2.937
Total Commercial Landings Mean Length (Centimeters) at Age 1978 39.5 50.0 60.8 67.9 72.7 80.4 80.2 93.1 103.4 106.5 64.1 1979 44.7 52.2 57.7 73.2 76.8 87.5 95.3 99.5 103.4 106.4 69.6 1980 43.8 51.8 61.2 69.7 80.9 86.0 92.4 93.8 92.4 114.6 65.6 1981 44.4 52.2 60.2 68.4 78.2 88.0 93.5 97.5 110.3 119.5 65.6 1982 42.2 51.2 62.4 70.5 79.1 84.3 96.0 97.4 105.8 115.0 61.9 1983 45.5 52.3 60.4 67.0 75.3 84.4 90.7 99.1 101.9 111.4 62.4 1984 47.2 54.0 61.5 69.8 77.8 85.5 94.4 98.6 102.3 112.8 68.6 1985 44.9 51.1 57.5 71.4 78.0 84.3 91.3 98.8 102.3 108.2 61.1 1986 45.0 51.9 61.1 69.2 80.7 87.7 94.4 98.0 105.9 108.4 64.3 1987 40.7 51.8 61.2 73.0 81.8 90.1 94.5 98.2 102.5 111.2 59.7 1988 40.8 52.8 60.4 68.5 79.5 85.3 93.6 97.7 101.5 111.2 64.1 1989 53.8 60.0 70.4 79.2 85.2 91.7 100.3 103.2 113.3 65.7 1990 41.7 53.5 61.0 68.7 76.6 83.2 92.1 100.2 106.0 110.8 62.9 1991 47.7 53.6 62.2 67,7 75.8 80.9 87.8 99.4 95.9 113.9 67.0 1992 46.2 52.4 60.8 70.6 75.1 82.2 87.9 96.0 104.3 116.0 62.4

Table 9. Summary of U.S. and Canadian 1992 commercial landings of Atlantic cod from the Georges Bank and South cod stock NAFO Division 5Z and 1J ~
Statistical Area 6) to ro ~
0
U.S. Catch at Age Canadian Catch at Age Total 1992 Catch at Age
Age Catch in 0/0 of Catch in % of Catch in % of Catch in % of Catch in % of Catch in % of Numbers U.S. Weight U.S. Numbers Canadi,lln Weight Canadian Numbers Total Weight Total
(thousands) Total (mt) Total (thousands) Total (mt) Total (thousands) (mt)
1 70 1.7 80 0.7 70 0.7 80 0.3 2 2387 41.8 3663 21.7 1790 44.5 2778 23.7 4177 42.9 6441 22.5 3 1268 22.2 3040 18.0 902 22.5 2308 19.7 2170 22.3 5348 18.7 4 746 13.1 2949 17.5 292 7.3 1042 8.9 1038 10.7 3991 14.0 5 936 16.4 4470 26.5 546 13.6 2501 21.3 1482 15.2 6971 24.4 6 217 3.8 1379 8.2 187 4.7 1107 9.5 404 4.2 2486 8.7 7 133 2.3 1070 6.4 176 4.4 1252 10.7 309 3.2 2322 8.1 8 9 0.1 93 0.6 25 0.6 241 2.1 34 0.4 334 1.2 9+ 15 0.3 191 1.1 28 0.7 403 3.4 43 0.4 594 2.1
Total 57ll 100.0 16855 100.0 4016 100.0 ll712 100.0 9727 100.0 28567 100.0
Mean Weight Per Fish = 2.95 kg Mean Weight Per Fish= 2.92 kg Mean Weight Per Fish= 2.94 kg
Table 10. Mean weight at age (kilograms) at the beginning of the year (January 1) for Georges Bank and South cod stock (NAFO Division 5Z and Subarea 6). 1978-1993. Values derived from catch mean weights at age using the procedures described by Rivard (1980).
Age Year: 1978 1979 1980 1981 1982 1983 1984 1985 1986 1987 1988 1989 1990 1991 1992 1993
1 0.486 0.694 0.625 0.700 0.548 0.748 0.907 0.7ll 0.736 0.502 0.548 0.583 0.594 0.659 0.659 0.673 2 1.023 1.028 1.139 I.ll8 I.ll2 1.068 1.260 1.222 1.157 1.173 1.050 1.127 1.123 1.163 1.163 1.3ll 3 1.881 1.678 1.920 1.855 1.996 1.826 1.9ll 1.847 1.863 1.918 1.869 1.857 1.995 1.994 2.002 1.814 4 2.922 3.219 2.808 2.903 3.007 2.969 2.933 3.087 2.763 3.201 2.960 2.983 2.827 2.902 3.129 3.032 5 3.370 4.ll8 4.876 4.373 4.275 4.216 4.101 4.291 4.667 4.6ll 4.755 4.353 4.296 4.098 4.0ll 4.720 6 4.594 5.579 5.712 6.386 5.826 5.849 5.525 5.709 6.048 6.579 6.214 6.013 5.846 5.368 5.418 5.517 7 6.235 7.290 7.760 7.562 8.223 7.201 7.547 7.300 7.561 8.022 8.234 7.393 7.524 6.850 6.651 6.994 8 7.235 8.721 9.136 9.108 9.207 9.814 8.970 9.549 8.978 9.448 9.454 9.699 9.357 9.432 8.542 8.478 9 10.004 9.967 9.325 11.349 l1.ll9 10.541 10.783 10.741 11.396 10.660 10.563 10.793 11.612 10.156 11.263 11.350
10+ 13.200 12.625 15.400 18.565 16.723 14.554 15.356 13.494 14.104 15.000 15.298 17.1ll 14.526 15.373 15.373 15.373

dian fisheJY; the 1988 cohort accounted for 13% of the U.S. landings in number. but only 7% of the Canadian landings. The 1990 year class dominated the 1992 Canadian landings (44% by number; 24% by weight), with the 1989 and 1987 cohorts being the next most important in terms of numbers and weight. respectively.
MEAN WEIGHTS AT AGE
Mean weights at age in the landings for ages 1-10+ during 1978-1992 are given in Table 8 and, based on landings patterns, are considered midyear values. Although no consistent trends in size or weight at age are evident over the 15-year time series, mean weights in 1990 and 1991 for age groups 2 and 3 were among the highest on record; both mean weights declined in 1992. Mean weights for age groups 4-6 in 1990-1991 were among the lowest on record, but the mean weights for ages 4 and 6 increased in 1992. Both the U.S. and Canadian landings exhibited these patterns, although the changes are more pronounced in the Canadian data.
Mean weights at age for calculating stock biomass at the beginning of the year are provided in Table 10. These values were derived from the catch mean weights at age data [fable 8) using the procedures described by Rivard (1980).
STOCK ABUNDANCE AND BIOMASS INDICES
COMMERCIAL CATCH RATES
United States commercial LPUE indices (landings per unit effort, expressed in metric tons landed per day fished) were calculated, by tonnage class (Class 2: 5-50 GRT; Class 3: 51-150 GRT; Class 4: 151-500 GRT), from otter trawl trips landing cod from Georges Bank (Subdivision 5Ze). Indices were derived based on all trips landing cod, and for 'directed trips' in which cod comprised 50% or more of the total trip catch by weight (Tables 11 and 12). 'Directed trips' have accounted for greater than 50% (and as high as 79%) of U.S. Georges Bank otter trawl landings of cod since 1973 [fable 13). In 1992, 'directed trips' accounted for 56% of the U.S. landings. During 1988-1991, the U.S. fisheJYfor cod became highly directed (Le., near 75% of the U.S. otter trawl cod landings were taken in 'di-
Page 11
rected trips'). The sharp decline in the percentage of cod taken on directed trips in 1992 is a substantial departure from the recent four years.
Since 1970, both total and directed U.S. LPUE indices have generally exhibited siroilar trends (Table 11; Figure 2). The LPUE values for Class 3 and 4 vessels (which account for more than 95% of the U.S. otter trawl landings of Georges Bank cod) generally increased during the early 1970s, leveled off during the mid-1970s, and then sharply increased, attaining peak levels in the late 1970s. Subsequently, LPUE indices trended downward until 1988 when both total and directed indices increased. In 1990, LPUE values again increased, but both LPUE indices declined in 1991 and continued to decline in 1992. Canadian LPUE indices are not considered to be reliable indicators of stock abundance (Hunt 1990), and have not been used in any of the recent Canadian assessments of the Georges Bank cod stock (Hunt and Buzeta 1992). In terms of 'calculated effort' (total landings/total U.S. LPUE index), both total and U.S. fishing effort peaked at record-high levels in 1988, declined in 1989 and 1990, but have since increased to about the 1988 peak (Table 14).
Standardized fishing effort and LPUE was estimated for the U.S. otter trawl subfleet by applying a five-factor (year, area, quarter, tonnage class and depth) General Linear Model (GLM) to log LPUE data derived for all interviewed otter trawl trips taking cod from 1978 through 1992 [fable 15). Details regarding data selection and preparation and model formulation are provided by Mayo et at. (1994). The model accounted for just over 25% of the total sum of squares, although all five factors were highly Significant. Standardized effort for each area-quarter-tonnage class-depth categoJY was estimated by multiplying the sum of the nominal effort for that cell by the product of the retransformed GLM coefficients for each factor. The estimated standardized subfleet effort was then accumulated over all categories to derive the annual estimates in Table 16. Total standardized effort was then calculated by raising the subfleet effort to account for all cod landings. Both series of U.S. effort estimates (Tables 14 and 16) show the same trends over time, Le., an increase during the 1980s with peak effort occurring in 1988-89 followed by a stabilization. Expanded effort estimates obtained from both series have remained relatively constant since 1988, fluctuating between 23,000 and 25,000 days fished (Tables 14 and 16; Figure 3). Both analyses indicate a sharp decline in LPUE of about 30 to 40% between 1991 and 1992.

Page 12
Table II. United States commercial landings (Ll', days fished (DF)', and landings per day fished (LjDF), by vessel tonnage class (Class 2: 5-50 GRT: Class 3: 51-150 GRT; Class 4: 151-500 GR11, of Atlantic cod for otter trawl trips catching cod from Georges Bank (NAFO Subdivision 5Ze), 1965 - 1992. Data are alsO' prDvided fDr otter trawl trips in which cDd cDnstituted 50% Dr mDre Dfthe tDtal trip catch, by weight [,directed trips'].
Class 2 Class 3 Class 4 Totals Year L DF L/DF L DF L/DF L DF L/DF L L/DF"
All Trips 1965 487 1661 0.29 5201 9719 0.54 4351 4175 1.04 10039 0.74 1966 386 1555 0.25 4754 10505 0.45 4731 4510 1.05 9S71 0.73 1967 437 1069 0.41 5292 8570 0.62 4519 3789 1.19 10248 0.86 1968 321 570 0.56 6861 8534 0.80 4903 3397 1.44 12085 1.05 1969 433 500 0.87 7942 7953 1.00 4819 2783 1.73 13194 1.26 1970 508 535 0.95 6729 8296 0.81 4033 2218 1.82 11270 1.1S 1971 563 681 0.83 7652 8808 0.87 4215 2195 1.92 12430 1.22 1972 524 721 0.73 6382 9257 0.69 3274 1766 1.85 10180 1.07 1973 322 550 0.59 7814 8668 0.90 4295 1701 2.52 12431 1.45 1974 585 617 0.95 8222 9438 0.87 5266 2097 2.51 14073 1.49 1975 509 534 0.95 7029 8684 0.81 4527 2085 2.17 12065 1.33 1976 421 474 0.89 7861 7791 1.01 3969 1469 2.70 12251 1.55 1977 850 607 1.40 13250 9492 1.40 4423 1472 3.00 18523 1.78 1978 1165 715 1.63 14853 9411 1.58 4829 1551 3.11 20847 1.94 1979 956 658 1.45 18377 9924 1.85 7116 2507 2.84 26449 2.10 1980 1062 882 1.20 21331 10961 1.95 10053 3726 2.70 32446 2.16 1981 1184 845 1.40 17025 10615 1.60 9404 3797 2.48 27613 1.S9 1982 1406 695 2.02 20468 10717 1.91 11450 4296 2.67 33324 2.18 1983 835 429 1.95 17112 10694 1.60 13011 5116 2.54 30958 2.00 1984 375 427 0.88 14883 13605 1.09 10899 5746 1.90 26157 1.42 1985 370 453 0.82 12852 13629 0.94 8215 5501 1.49 21437 1.15 1986 150 233 0.64 8014 10442 0.77 5411 4354 1.24 13575 0.96 1987 108 220 0.49 8505 12067 0.70 5090 4770 1.07 13703 0.84 1988 100 233 0.43 12808 13791 0.93 7345 5799 1.27 20253 1.05 1989 144 320 0.45 10104 13142 0.77 7676 5269 1.46 17924 1.06 1990 141 260 0.54 11496 13557 0.85 9345 5497 1.70 20982 1.23 1991 89 239 0.37 8867 12825 0.69 7887 5398 1.46 16843 1.05 1992 42 170 0.25 5757 12707 0.45 4734 5261 0.90 10533 0.65
50% Trips 1965 18 8 2.25 353 86 4.10 819 159 5.15 1190 4.79 1966 7 <l 370 88 4.20 991 199 4.98 1368 4.74 1967 33 17 1.94 874 238 3.67 1464 31S 4.60 2371 4.22 1968 16 3 5.33 1665 464 3.59 1442 328 4.40 3123 3.97 1969 73 9 8.11 2612 773 3.38 1475 359 4.11 4160 3.72 1970 164 25 6.56 1695 534 3.17 1739 388 4.48 3598 3.96 1971 117 15 7.80 2232 721 3.10 2163 494 4.38 4512 3.84 1972 152 54 2.81 2137 716 2.98 1879 445 4.22 4168 3.53 1973 52 16 3.25 3242 820 3.95 3010 486 6.19 6304 5.01 1974 259 119 2.18 3707 1115 3.32 3899 703 5.55 7865 4.39 1975 246 85 2.89 2678 842 3.18 3128 585 5.35 6052 4.29 1976 159 66 2.41 3665 1089 3.37 2664 464 5.74 6488 4.32 1977 502 120 4.1S 6595 1342 4.91 2899 373 7.77 9996 5.70 1978 846 215 3.93 6554 1644 3.99 2427 330 7.35 9827 4.81 1979 612 168 3.64 9714 2558 3.80 4270 840 5.08 14596 4.17 1980 644 196 3.29 11727 2909 4.03 5616 1067 5.26 17987 4.39 1981 766 153 5.01 9414 2591 3.63 4312 953 4.52 14492 3.97 1982 1046 212 4.93 14724 3631 4.06 7791 1521 5.12 23561 4.45 1983 566 130 4.35 11884 3033 3.92 8795 1872 4.70 21245 4.25 1984 140 55 2.55 9156 3454 2.65 6620 1918 3.45 15916 2.98 1985 184 65 2.83 8725 4346 2.01 6053 2330 2.60 14962 2.26 1986 58 18 3.22 5258 2969 1.77 3755 1406 2.67 9071 2.15 1987 36 IS 2.00 5743 3874 1.48 3354 1781 1.88 9133 1.63 1988 37 22 1.68 9974 6457 1.54 5527 2731 2.02 15538 1.71 1989 66 56 1.18 7866 6021 1.31 6252 3097 2.02 14184 1.62 1990 61 16 3.81 8401 4954 1.70 7629 3153 2.42 16091 2.05 1991 27 12 2.25 5910 4339 1.36 5817 2559 2.27 11754 1.81 1992 4 7 0.57 3159 2957 1.07 2722 1605 1.70 5885 1.36
1 Metric tons, live weight. 2 Days fished with trawl on bottom; derived by dividing hours fished with trawl on bottom by 24. 3 TO'tal L/DF was derived by weighting individual tonnage class L/DF values by the percentage of total landings accounted for
by each vessel class and summing over the three vessel class categories.

Page 13
Table 12. United States commercial vessel trips (T), days fished (DF), , and average days fished per trip (DF/ T), by vessel tonnage class (Class 2: 5-50 GRr: Class 3: 51-150 GRr: Class 4: 151-500 GRI), of Atlantic cod for otter trawl trips catching cod from Georges Bank (NAFO Subdivision 5Ze), 1965 -1992. Data are also provided for otter trawl trips in which cod constituted 50% or more of the total trip catch, by weight ['directed trips'J.
Class 2 __ .QLC!ss~ ____ ____ Class 4 Totals Year T DF DF/T T DF DF/T T DF DF/T T DF DF/T
All Trips 1965 897 1661 1.85 2885 9719 3.37 886 4175 4.71 4668 15555 3.33 1966 873 1555 1.78 3173 10505 3.31 970 4510 4.65 5016 16570 3.30 1967 824 1069 1.30 2810 8570 3.05 875 3789 4.33 4509 13428 2.98 1968 508 570 1.12 2600 8534 3.28 789 3397 4.31 3897 12501 3.21 1969 330 500 1.52 2428 7953 3.28 637 2783 4.37 3395 11236 3.31 1970 412 535 1.30 2614 8296 3.17 614 2218 3.61 3640 11049 3.04 1971 680 681 1.00 2524 8808 3.49 538 2195 4.08 3742 11684 3.12 1972 628 721 1.15 2544 9257 3.64 468 1766 3.77 3640 11744 3.23 1973 412 550 1.33 2491 8668 3.48 510 1701 3.34 3413 10919 3.20 1974 606 617 1.02 2561 9438 3.69 613 2097 3.42 3780 12152 3.21 1975 471 534 1.13 2491 8684 3.49 637 2085 3.27 3599 11303 3.14 1976 359 474 1.32 2281 7791 3.42 478 1469 3.07 3118 9734 3.12 1977 561 607 1.08 3177 9492 2.99 572 1472 2.57 4310 11571 2.68 1978 845 715 0.85 3457 9411 2.72 654 1551 2.37 4956 11677 2.36 1979 577 658 1.14 4389 9924 2.26 1119 2507 2.24 6085 13089 2.15 1980 726 882 1.21 4868 10961 2.25 1324 3726 2.81 6918 15569 2.25 1981 810 845 1.04 4036 10615 2.63 1276 3797 2.98 6122 15257 2.49 1982 799 695 0.87 3892 10717 2.75 1209 4296 3.55 5900 15708 2.66 1983 522 429 0.82 3336 10694 3.21 1299 5116 3.94 5157 16239 3.15 1984 488 427 0.88 3723 13605 3.65 1322 5746 4.35 5533 19778 3.57 1985 426 453 1.06 3556 13629 3.83 1216 5501 4.52 5198 19583 3.77 1986 340 233 0.69 2699 10442 3.87 1018 4354 4.28 4057 15029 3.70 1987 314 220 0.70 3044 12067 3.96 1117 4770 4.27 4475 17057 3.81 1988 278 223 0.80 3297 13791 4.18 1283 5799 4.52 4858 19813 4.08 1989 336 320 0.95 3142 13142 4.18 1231 5269 4.28 4709 18731 3.98 1990 271 260 0.96 3143 13557 4.31 1296 5497 4.24 4710 19314 4.10 1991 189 239 1.26 2791 12825 4.60 1170 5398 4.61 4150 18462 4.45 1992 128 170 1.33 2448 12707 5.19 1068 5261 4.93 3644 18138 4.98
50% Trips 1965 9 8 0.89 54 86 1.59 47 159 3.38 110 253 2.30 1966 1 <1 45 88 1.96 63 199 3.16 109 287 2.63 1967 11 17 1.55 III 238 2.14 101 318 3.15 223 573 2.57 1968 5 3 0.60 153 464 3.03 97 328 3.38 255 795 3.12 1969 17 9 0.53 244 773 3.17 88 359 4.08 349 1141 3.27 1970 43 25 0.58 190 534 2.81 120 388 3.23 353 947 2.68 1971 47 15 0.32 210 721 3.43 130 494 3.80 387 1230 3.18 1972 55 54 0.98 247 716 2.90 118 445 3.77 420 1215 2.89 1973 14 16 1.14 267 820 3.07 160 486 3.04 441 1322 3.00 1974 67 119 1.78 356 1115 3.13 232 703 3.03 655 1937 2.96 1975 50 85 1.70 306 842 2.75 209 585 2.80 565 1512 2.68 1976 40 66 1.65 386 1089 2.82 168 464 2.76 594 1619 2.73 1977 87 120 1.38 601 1342 2.23 167 373 2.23 855 1835 2.15 1978 186 215 1.16 781 1644 2.10 184 330 1.79 1151 2189 1.90 1979 121 168 1.39 1227 2558 2.08 396 840 2.12 1744 3566 2.04 1980 153 196 1.28 1309 2909 2.22 457 1067 2.33 1919 4172 2.17 1981 171 153 0.89 1050 2591 2.47 348 953 2.74 1569 3697 2.36 1982 191 212 1.11 1329 3631 2.73 469 1521 3.24 1989 5364 2.70 1983 102 130 1.27 970 3033 3.13 505 1872 3.71 1577 5035 3.19 1984 34 55 1.62 963 3454 3.59 465 1918 4.12 1462 5427 3.71 1985 37 65 1.76 1059 4346 4.10 509 2330 4.58 1605 6741 4.20 1986 27 18 0.67 746 2969 3.98 331 1406 4.25 1104 4393 3.98 1987 11 18 1.64 887 3874 4.37 406 1781 4.39 1304 5673 4.35 1988 15 22 1.47 1427 6457 4.52 589 2731 4.64 2031 9210 4.53 1989 29 56 1.93 1353 6021 4.45 703 3097 4.41 2085 9174 4.40 1990 23 16 0.70 1165 4954 4.25 717 3153 4.40 1905 8123 4.26 1991 15 12 0.80 961 4339 4.52 591 2559 4.33 1567 6910 4.41 1992 5 7 1.40 605 2957 4.89 353 1605 4.55 963 4569 4.74
I Days fished with trawl on bottom; derived by dividing hours fished with trawl on bottom by 24.

Page 14
Table 13. Percentage. within vessel tonnage class'. of Atlantic cod otter-trawl landings (Lj2. vessel trips (Tl and effort (DFj3 from Georges Bank (NAFO Subdivision 52e) accounted for by otter trawl trips in which cod constituted 50% or more of the total trip catch. by weight ['directed trips'l. 1965 - 1992
Class 2 Class 3 Class 4 Totals Year L T DF L T DF L T DF L T DF
1965 3.7 1.0 0.5 6.8 1.9 0.9 18.8 5.3 3.8 11.9 2.4 1.6 1966 1.8 0.1 <0.1 7.8 1.4 0.8 20.9 6.5 4.4 13.9 2.2 1.7 1967 7.6 1.3 1.6 16.5 4.0 2.8 32.4 11.5 8.4 23.1 4.9 4.3 1968 5.0 1.0 0.5 24.3 5.9 5.4 29.4 12.3 9.7 25.8 6.5 6.4 1969 16.9 5.2 1.8 32.9 10.0 9.7 30.6 13.8 12.9 31.5 10.3 10.2 1970 32.3 10.4 4.7 25.2 7.3 6.4 43.1 19.5 17.5 31.9 9.7 8.6 1971 20.8 6.9 2.2 29.2 8.3 8.2 51.3 24.2 22.5 36.3 10.3 10.5 1972 29.0 8.8 7.5 33,5 9.7 7.7 57.4 25.2 25.2 40.9 11.5 10.3 1973 16,1 3.4 2.9 41.5 10.7 9.5 70.1 31.4 28,6 50.7 12,9 12.1 1974 44.3 ILl 19.3 45.1 13.9 ll.8 74.0 37.8 33.5 55.9 17.3 15.9 1975 48,3 10,6 15.9 38.1 12.3 9,7 69.1 32.8 28.1 50.2 15,7 13.4 1976 37.8 ILl 13.9 46.6 16.9 14.0 67.1 35.1 31.6 53.0 19.1 16.6 1977 59.1 15.5 19.8 49.8 18.9 14.1 65.5 29.2 25.3 54.0 19.8 15.9 1978 72.6 22.0 30,1 44.1 22.6 17,5 50.3 28.1 21.3 47.1 23.2 18.7 1979 64.0 21.0 25.5 52.9 28.0 25.8 60.0 35.4 33.5 55,2 28.7 27.2 1980 60.6 2Ll 22,2 55.0 26,9 26.5 55,9 34,5 28.6 55,4 27.7 26.8 1981 64,7 2Ll 18,1 55.3 26,0 24.4 45,9 27,3 25.1 52,5 25.6 24.2 1982 74.4 23.9 30.5 71.9 34.1 33.9 68.0 38.8 35.4 70.7 33.7 34.1 1983 67.8 19.5 30.3 69.4 29.1 28.4 67,6 38.9 36.6 68.6 30.6 31.0 1984 37,3 7.0 12.9 61.5 25.9 25.4 60,7 35.2 33.4 60,8 26.4 27.4 1985 49,7 8.7 14.3 67.9 29.8 31.9 73,7 41.9 42.4 69.8 30,9 34,4 1986 38.7 7.9 7.7 65,6 27.6 28.4 69,4 32.5 32,3 66.8 27,2 29.2 1987 33.3 3.5 8.2 67,5 29,1 32.1 65,9 36,3 37,3 66.6 29,1 33.3 1988 37.0 5.4 9.4 77.9 43.3 46.8 75.2 45.9 47.1 76.7 41.8 46.5 1989 45.8 8.6 17,5 77.9 43.1 45.8 81.4 57.1 58.8 79.1 44,3 49.0 1990 43.3 8.5 6,2 73.1 37.1 36,5 81.6 55.3 57.4 76.7 40.4 42.1 1991 30.3 7.9 5,0 66.7 34.4 33,8 73.8 50.5 47,4 69.8 37.8 37.4 1992 9,5 3.9 4.1 54.9 24,7 23.3 57.5 33.1 30.5 55.9 26.4 25.2
; Class 2: 5-50 GRf; Class 3: 51-150 GRf; Class 4: 151-500 GRf, , Metric tons, Uve weight. , Effort expressed as days fished with trawl on bottom; derived by dividing hours fished with trawl on bottom by 24.
8 .. -.---- ---------------.----------.-.---.--. 8
7
-c 6 Ql .c II) ;;:5 >'" 04 ~
Ql 0.
3 II) c ~ 2
1
USA LPUE (Dir trips)
.....
Standardized LPUE
/--~j~/ /-----------./
USA LPUE (All trips)
.. , .
o -----.l __ L __ L~. __ l I . L."L .. __ L.J .. I I! I I
62 64 66 68 70 72 74 76 78 80 82, 84 86 88 90
YEAR
7
6
5
4
3
2
1
0 92
-c Ql .c II)
;;: >-'" 0 ~
Ql 0. II)
c ~
Figure 2. Trends in U.S. LPUE (landings per day fished) of Georges Bank cod. The 1965-1992 indices are based on all otter trawl trips landing cod (All trips) and on otter trawl trips in which cod constituted 50% or more of the trip landings by weight (Dir trips). A standardized LPUE series from 1978-1992 based on a GLM incorporating year, tonnage class, area, quarter, and depth, is also included.

Page 15
Table 14. Total and U.S. commercial landings, U.S. landings-per-unit of effort indices (LPUE: all cod trips), and derived effort indices for Georges Bank cod, 1965-1992
Year Total U,S, Landings Landings
(mt) (mtj
1965 38333 11410 1966 53134 11990 1967 36752 13157 1968 43136 15279 1969 37939 16782 1970 25652 14899 1971 28179 16178 1972 25059 13406 1973 28923 16202 1974 27331 18377 1975 25008 16017 1976 19926 14906 1977 27367 21138 1978 35357 26579 1979 38623 32645 1980 48116 40053 1981 42348 33849 1982 57157 39333 1983 48886 36756 1984 38678 32915 1985 37271 26828 1986 25901 17490 1987 30880 19035 1988 39242 26310 1989 33098 25097 1990 42503 28193 1991 37630 24175 1992 28567 16855
Given the differences in the two methods used for computing fishing effort, it is not surprising that the two methods produce slightly different results. The GLM method accounts for spatial and seasonal effects, as well as tonnage class differences. The 'calculated effort' approach does not explicitly consider these factors and hence may be more sensitive to changes in fleet directivity. The increased dtrectivity of the U.S. fishery to high levels during 1988-1991 probably inflates the 'all cod trips' U.S. LPUE indices in the most recent years since a greater proportion of the total cod landings is currently represented by dtrected trips. Hence, the 'calculated effort' values for 1988-1991 should probably be considered as underestimates. Conversely, the decrease in 'dtrectivity' noted in 1992 may have caused an overestimate of the 1992 'calculated effort.'
The age composition of the landings corresponding to the effort subfleet was estimated and used with standardized effort estimates to calculate LPUE at age indices for calibrating the VPA.
U,S. Total U.S. LPUE Index Calculated Calculated
(All Cod Trips) Days Fished Days Fished
0.745 51483 15324 0.730 72811 16430 0.862 42616 15256 1.053 40954 14506 1.262 30054 13294 1.178 21781 12650 1.224 23018 13215 1.065 23527 12586 1.452 19924 11161 1.487 18380 12358 1.326 18857 12077 1.553 12827 9596 1.782 15357 11862 1.937 18252 13720 2.102 18375 15531 2.158 22298 18562 1.891 22393 17899 2.176 26270 18078 2.005 24388 18337 1.424 27152 23106 1.149 32446 23355 0.956 27096 18386 0.836 36947 22775 1.051 37344 25037 1.063 31139 23611 1.226 34654 22987 1.049 35877 23049 0.651 43851 25873
Numbers landed at age were estimated byapplying quarterly commercial age-length keys to quarterly commercial numbers landed at length by market category. The LPUE at age indices were derived by dividing the estimated numbers landed at age by corresponding standardized fishing effort in each year from 1978 through 1992. Further details regarding data selection and preparation and estimation procedures are provided by Mayo et al. (1994).
RESEARCH VESSEL SURVEY INDICES
Indices of cod abundance (stratified mean catch per tow in numbers) and biomass (stratified mean weight per tow in kilograms) derived from Northeast Fisheries Science Center (NEFSC) research vessel bottom trawl surveys have been used to monitor changes and assess trends in population size and recruitment of U.S. cod stocks

Page 16
Table 15. General linear model (GLM) analysis of LPUE of Georges Bank cod (NAFO Subdivision 52e) for interviewed trips landing cod as a function of year, area, quarter, tonnage class and depth with no interaction
SAS General Linear Models Procedure
Dependent Variable:LNCPUEDF
Source
Model
Error
Corrected Total
Source
YEAR AREA QTR TONCLASS DEPTHCD
Source
YEAR AREA QTR TONCLASS DEPTHCD
Parameter
INTERCEPT AREA
QTR
TONCLASS
DEPTHCD
522 523 524 525 526 521
1 3 4 2
31 32 41 33
1 2 3
DF Sum ofSquares
27 28516.42490940
52179 81599.90019330
52206 110116.32510271
R-Square C.V. 0.258966 -646.8736
DF Type I SS
14 10439.97027882 5 5174.90711295 3 3745.70569133 3 5672.12786313 2 3483.71396317
DF Type III SS
14 13140.20128030 5 7474.17955441 3 2875.21677184 3 5933.08867445 2 3483.71396317
Estimate T for HO: Parameter=O
0.724000592 B 25.20 -0.445165897 B -28.67 -0.018132063 B -0.86 -0.744920018 B -40.73 -0.857301608 B -36.51 -1.204446759 B -59.93 0.000000000 B
-0.059039765 B -3.88 -0.596095117 B -38.64 -0.434279166 B -26.84 0.000000000 B
-0.783352144 B -31.65 -0.543263442 B -33.55 0.417412098 B 31.34 0.000000000 B 0.729218401 B 46.49 0.375635575 B 24.34 0.000000000 B
Mean Square FValue Pr > F
1056.16388553 675.36 0.0001
1.56384561
RootMSE LNCPUEDF Mean 1.25053813 -0.19332033
Mean Square F Value Pr > F
745.71216277 476.85 0.0001 1034.98142259 661.82 0.0001 1248.56856378 798.40 0.0001 1890.70928771 1209.01 0.0001 1741.85698159 1113.83 0.0001
Mean Square F Value Pr > F
938.58580574 600.18 0.0001 1494.83591088 955.87 0.0001 958.40559061 612.85 0.0001
1977.69622482 1264.64 0.0001 1741.85698159 1113.83 0.0001
Pr> ITI Std Error of Retransformed Estimate Estimate
0.0001 0.02872607 0.0001 0.01552672 0.640795 0.3872 0.02097022 0.982247 0.0001 0.01828704 0.474852 0.0001 0.02348380 0.424422 0.0001 0.02009898 0.299918
1.000000 0.0001 0.01522176 0.942778 0.0001 0.01542695 0.551024 0.0001 0.01617803 0.647816
1.000000 0.0001 0.02474775 0.457012 0.0001 0.01619049 0.580926 0.0001 0.01331944 1.518163
1.000000 0.0001 0.01568675 2.073714 0.0001 0.01543178 1.459090
1.000000

Page 17
Table 16. Georges Bank cod landings (metric tons). nominal and standardized effort (days fished) and landings
"C Q)
..c:: Ul
u: Ul >-ca 0 -0 Ul 0 0 0
per day fished (LPUE). United States only
Year U.S. Nominal Standardized Landings
(mt) Effort LPUE Effort LPUE Raised Effort
1978 15776 8078 1.953 5982 2.637 10079 1979 20584 9547 2.156 7788 2.643 12394 1980 25213 10217 2.468 8600 2.932 13661 1981 18340 9149 2.005 8113 2.260 14977 1982 23292 10051 2.317 8859 2.629 14961 1983 22072 11668 1.892 10456 2.111 17412 1984 19669 14641 1.343 12495 1.574 20912 1985 18012 16447 1.095 14892 1.209 22190 1986 11572 12520 0.924 11834 0.978 17883 1987 12731 14945 0.852 13791 0.923 20622 1988 19010 17769 1.070 16911 1.124 23407 1989 15557 15834 0.983 15407 1.010 24849 1990 18358 15882 1.156 14836 1.237 22791 1991 14173 14857 0.954 14917 0.950 25447 1992 8786 13606 0.646 12845 0.684 24642
35 35
30 30
25 25 / Calculated 20 Standardized 20
/ 15 .; 15
10 10
5 5
o 0 77 78 79 80 81 82 83 84 85 86 87 88 89 90 91 92
YEAR
"C Q)
..c:: III
Ll.. Ul >-ca 0 -0 Ul 0 0 0
Figure 3. Trends in U.S. fishing effort (days fished) on Georges Bank cod. 1978-1992. Results are based on all otter trawl trips landing cod. A standardized effort series based on a GLM incorporating year, tonnage class, area, quarter. and depth is also included.

Page 18
Table 17. Standardized stratified mean catch per tow in numbers and weight (kilograms) for Atlantic cod in NEFC offshore spring and autumn research vessel bottom trawl surveys on Georges Bank (Strata 13-25), 1963 - 1993[a,b.c]
Year Spring Autumn
No,/Tow Wt/Tow NO,/Tow Wt/Tow
1963 4.37 17.8 1964 2.98 11.6 1965 4.25 11.7 1966 4.81 8.1 1967 10.38 13.6 1968 4.72 12.6 3.30 8.6 1969 4.64 17.8 2.20 8.0 1970 4.34 15.6 5.07 12.5 1971 3.39 14.2 3.19 9.9 1972 8.97 19.0 13.09 23.0 1973 18.68 [d] 39.7 [d] 12.28 30.8 1974 14.75 36.4 3.49 8.2 1975 6.89 26.0 6.41 14.1 1976 7.06 18.6 10.44 17.7 1977 6.30 15.4 5.45 12.5 1978 12.31 31.2 8.59 23.3 1979 5.16 16.9 5.95 16.5 1980 7.75 24.9 2.91 6.7 1981 10.44 26.1 9.04 19.0 1982 8.20[e] 15.4[e] 3.71 6.9 1983 7.70 24.0 3.64 6.5 1984 4.08 15.4 4.75 10.3 1985 6.94 21.5 2.43 3.5 1986 5.04 16.7 3.12 4.7 1987 3.26 10.3 2.33 4.4 1988 5.86 13.5 3.11 5.8 1989 4.80 10.8 4.78 4.6 1990 4.74 11.6 3.62[f] 7.1[f] 1991 4.39 9.0 0.96 1.4 1992 2.67 7.5 1.87 3.0 1993 2.48 7.3 2.15 2.2
(a] During 1963-1984. BMV oval doors were used in spring and autumn surveys; since 1985. Portuguese polyvalent doors have been used in both surveys. Adjustments have been made to the 1963-1984 catch per tow data to standardize these data to polyvalent door equivalents. Conversion coefficients of 1.56 (numbers) and 1.62 (weight) were used in this standardization (NEFC 1991).
(b] Spring surveys during 1981-1982 and 1989-1991 and autumn surveys duIing 1977-1981 and 1989-1991,1993 were accomplished with the RjV Delaware II; in all other years, the surveys were accomplished using the RjV Albatross W. Adjustments have been made to theRjV Delaware II catch per tow data to standardize these to RjV Albatross IV equivalents. Conversion coefficients ofO. 79 (numbers) and 0.67 (weight) were used in this standardization (NEFC 1991).
(cl Spring surveys during 1973-1981 were accomplished with a '41 Yankee' trawl; in all other years, spring surveys were accomplished with a '36 Yankee' trawl. No adjustments have been made to the catch per tow data for these gear differences.
[d] Excludes unusually high catch of 1894 cod (2558 kg) at Station 230 (Strata tow 20-4).
[e] Excludes unusually high catch of 1032 cod (4096 kg) at Station 323 (Strata tow 16-7).
[f) Excludes unusually high catch of 111 cod (504 kg) at Station 205 (Strata tow 23-4).
Page 19
50,-------------------------------------------, 50
45
3:: 40 •
45
40 3:: t2
35 t2 · '. Spring Survey .... 35 cu 0-
Ci 30 .lI:: -
• • • •
• •
• • • • ~ ..
30
.... cu-0--Cl .lI:: -25 ..-.1::
... 25 • • .1:: Cl 'm 20 s:
• •
• .. ••
• • , • • •
• • • ". . • • •
82 84 86 88 90 92
Cl 20 Q)
s: 15 c::
cu cu
10 :2:
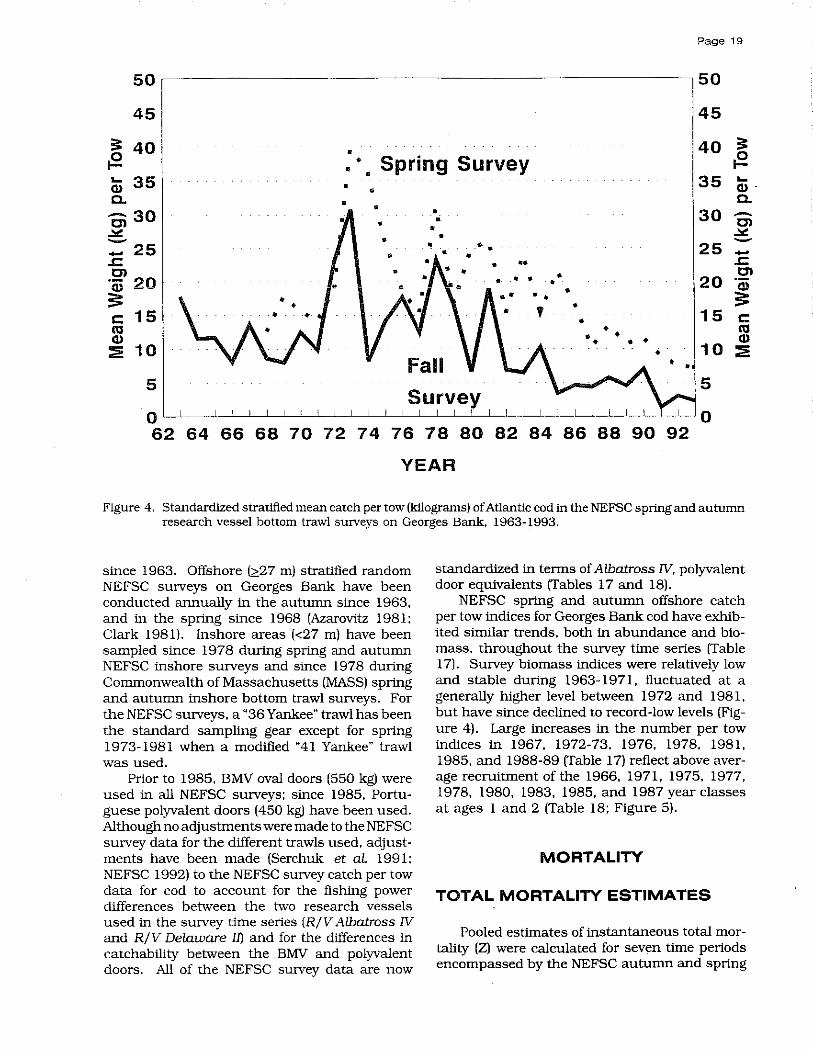
Figure 4. Standardized stratified mean catch per tow (kilograms) of Atlantic cod in the NEFSC spring and autumn research vessel bottom trawl surveys on Georges Bank, 1963-1993.
since 1963. Offshore (;::27 m) stratified random NEFSC surveys on Georges Bank have been conducted annually in the autumn since 1963, and in the spring since 1968 (Azarovitz 1981; Clark 1981). Inshore areas «27 m) have been sampled since 1978 during spring and autumn NEFSC inshore surveys and since 1978 during Commonwealth of Massachusetts (MASS) spring and autumn inshore bottom trawl surveys. For the NEFSC surveys. a "36 Yankee" trawl has been the standard sampling gear except for spring 1973-1981 when a modified • 41 Yankee" trawl was used.
Prior to 1985, BMV oval doors (550 kg) were used in all NEFSC surveys; since 1985, Portuguese polyvalent doors (450 kg) have been used. Although no adjustments were made to the NEFSC survey data for the different trawls used, adjustments have been made (Serchuk et aL 1991; NEFSC 1992) to the NEFSC survey catch per tow data for cod to account for the fishing power differences between the two research vessels used in the survey time series (R/V Albatross N and R/V Delaware I1) and for the differences in catchability between the BMV and polyvalent doors. All of the NEFSC survey data are now
standardized in terms of Albatross N, polyvalent door equivalents (Tables 17 and 18).
NEFSC spring and autumn offshore catch per tow indices for Georges Bank cod have exhibited similar trends, both in abundance and biomass, throughout the survey time series (Table 17). Survey biomass indices were relatively low and stable during 1963-1971, fluctuated at a generally higher level between 1972 and 1981, but have since declined to record-low levels (Figure 4). Large increases in the number per tow indices in 1967, 1972-73, 1976, 1978, 1981, 1985, and 1988-89 (Table 17) reflect above average recruitment of the 1966, 1971, 1975, 1977, 1978, 1980, 1983, 1985, and 1987 year classes at ages 1 and 2 (Table 18; Figure 5).
MORTALITY
TOTAL MORTALITY ESTIMATES
Pooled estimates of instantaneous total mortality (Z) were calculated for seven time periods encompassed by the NEFSC autumn and spring

Page 20 YEAR CLASS STRENGTH: AGE 1
8,---------------------------------------,-8
! (a) 71
;;: ~ 61 ~ Q) ,
Co 51 ci Z4 c:
'" Q)
::;3
~2 <I:
1
7
~
Q)
5 Co
ci Zi
4 c:
'" Q)
3 ::;
2 ~ <I:
1
o 0 62 64 66 68 70 72 74 76 78 80 82 84 86 88 90 92
YEAR CLASS
YEAR CLASS STRENGTH: AGE 2 7'1--------------------------------------------~7
(b) ,i ! 6f
;;:
: 5 Q)
Co
ci 4 Z c: : 31 :E I
N Q) 21 Cl <I:
1
i6 ,
15 ~ ~
Q)
Co
4 ci Z c:
3 : ::; N
2 Q)
Cl <I:
1
O~~~~UL~LI~~~~UL.uLR~~UL~LI~~~lo 62 64 66 68 70 72 74 76 78 80 82 84 86 88 90 92
YEAR CLASS
Figure 5. Relative year class strengths of Georges Bank cod at (a) age I, and (b) age 2 based on standardized catch per tow (number) indices from NEFSC autunm research vessel bottom trawl surveys, 1963-1992.
offshore surveys: 1964-1967, 1968-1972, 1973-1976, 1977-1981, 1982-1984, 1985-1987, and 1988-1992 (Table 19). Total mortality was calculated from survey catch per tow at age data for fully recruited age groups (age 3+) by the log, ratio of the pooled age 3+ / age 4+ indices in the autumn surveys, and the pooled age 4+/age 5+ indices in the spring surveys. For example, the 1988-1992 values were derived from:
Autumn
In ( L age 3+ for 1987-91 / L age 4+ for 1988-92)
Spring
In ( L age 4+ for 1988-92 / L age 5+ for 1989-93)
Different age groups were used in the autumn and spring analyses so that Z could be evaluated over identical year classes within each time period.

The pooled estimates indicate that total mortality was high (0.73) during 1964-1967, declined significantly during 1968-1972 (0.34). increased to between 0.56 and 0.63 during 1973-1981, and peaked at record-high levels (0.68-1.10) during 1982-1987 (Table 19). Totalmortality estimates for the most recent 1988-1992 period (0.83) are lower than those for 1985-1987, but higher than in all other time periods. Values of Z derived from the spring surveys are generally lower than those calculated from the autumn data. Rather than selecting one survey series over the other, total moriality was calculated by taking a geometric mean of the spring and autumn estimates in each time period.
NATURAL MORTALITY
Instantaneous natural mortality (M) for Georges Bank cod is assumed to be 0.20, the conventional value of M used for all Northwest Atlantic cod stocks (Paloheimo and Koehler 1968; Pinhorn 1975; Minet 1978).
ESTIMATION OF FISHING MORTALITY RATES
AND STOCK SIZE
VIRTUAL POPULATION ANALYSIS CALIBRATION
The ADAPT (Gavaris 1988, Conser and Powers 1990) calibration method was used to derive estimates of terminal Fvalues in 1992. The total stock catch at age (Table 8) was included in the VPA with true ages 1-9 and a 10+ group represented from 1978 through 1992. As in previous assessments, age-disaggregated analyses were performed. In addition to the standard U.S. spring and autumn bottom trawl survey indices used in previous calibrations, several indices were either revised or added in the present analysis: the revised U.S. commercial otter trawl subfleet LPUE at age indices (Mayo et aI. 1994) and the Canadian spring bottom trawl survey indices from 1986-1992 (Hunt, personal communication).
Several exploratory ADAPT calibrations were performed using NEFSC spring and autumn and Canadian spring survey abundance indices and the U.S. commercial LPUE indices to estimate stock sizes forages 1-6,1-7, and 1-8 in 1993. All
Page 21
indices and years received equal weight. Age 9 was considered to be insuffiCiently represented in the tuning series to be used in the calibrations. By estimating the stock size of ages 1-8 in 1993, the F's on each age in 1992 were estimated independently without influence from adjacent ages or from the partial recruitment vector. These results produced reasonable stock size estimates for all ages up to 8 years in each of the initial calibrations.
In contrast to the previous assessment (Serchuk et al. 1993). the coefficients of variation (CV) on the estimated stock sizes for ages 7 and 8 were reasonably low (0.36 and 0.38). Each of the runs, however, produced similar results with a high F on age 5 in 1992. Although some patterns in the residuals were evident for many of the tuning indices, there did not appear to be any benefits in terms of improved precision by employing either time-tapered or index-speCific weighting in the present analyses.
The final ADAPT calibration was performed with the NEFSC and Canadian spring survey abundance indices for ages 1-8, the NEFSC autumn survey abundance indices for ages 1-6 and U.S. commercial LPUE indices for ages 2 to 6. The NEFSC autumn survey was lagged by one age and year whereby age 0 to 5 indices were related to age 1 to 6 stock sizes in the subsequent year for corresponding cohorts. Since F on age 1 is negligible, the age 1 autumn index was also related to the age 1 stock size in the same year to improve the 1993 age 1 recruitment estimate. To eliminate duplication, the age 1 index was not related to the age 2 stock sizes in the subsequent year. All NEFSC and Canadian indices were related to January 1 stock sizes and the U.S. commercial LPUE indices were related to midyear stock sizes. A smoothed flat -topped partial recruitment vector was employed with full recruitment on age 3 as indicated by previous separable VPA results (Serchuk et al. 1993).
The ADAPT formulation employed in the final VPA calibration provided direct stock size estimates for ages 1 through 8 in 1993 and corresponding estimates of F on ages 1 through 7 in 1992. Since the age at full recruitment was defined as 3 years in the input partial recruitment vector, F's on ages 8 and 9 in the terminal year were estimated as the mean of the age 3 through 7 F's. In all years prior to the terminal year, F on the oldest true age (9) was determined from weighted estimates of the Z for ages 3 through 9. In all years, the age 9 F was applied to the 10+ group. Spawning stock biomass (SSB) was calculated at spawning time [March 1] by applying maturity ogives for 1978-1981. 1982-
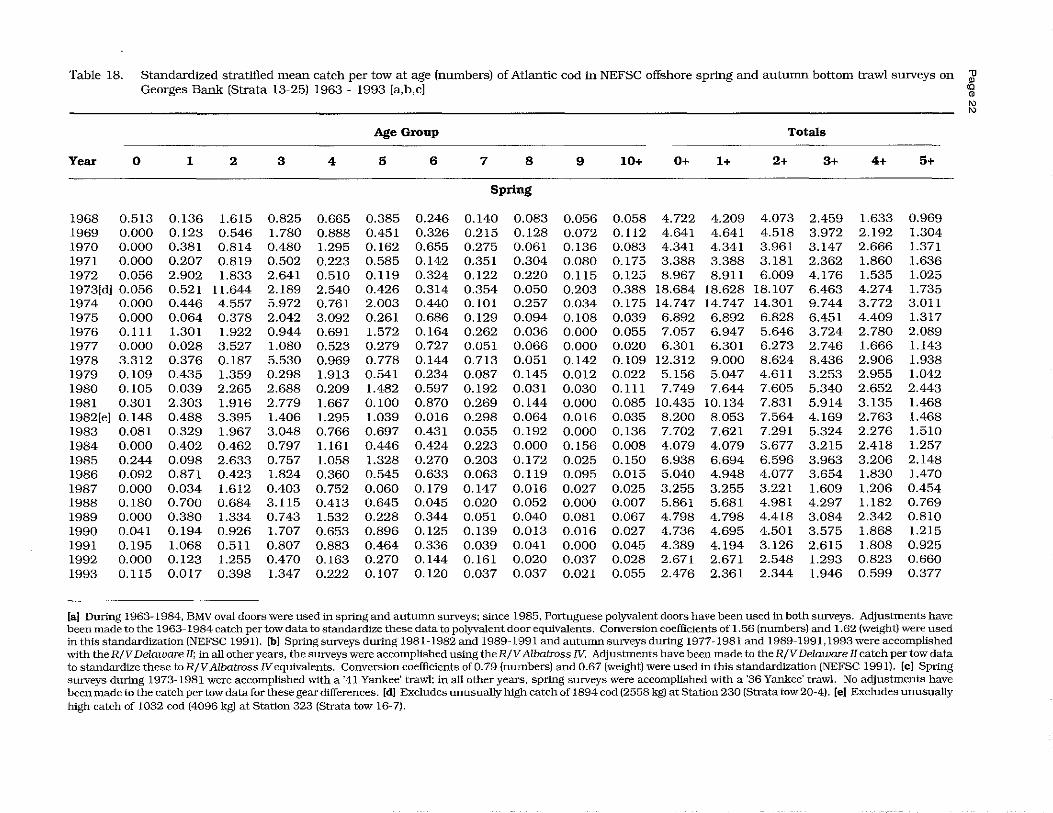
Table 18. Standardized stratified mean catch per tow at age (numbers) of Atlantic cod in NEFSC offshore spring and autumn bottom trawl surveys on 'U • Georges Bank (Strata 13-25) 1963 - 1993 [a,b,c] co 0
'" '" Age Group Totals
Year 0 1 2 3 4 5 6 7 8 9 10+ 0+ 1+ 2+ 3+ 4+ 5+
Spring
1968 0.513 0.136 1.615 0.825 0.665 0.385 0.246 0.140 0.083 0.056 0.058 4.722 4.209 4.073 2.459 1.633 0.969 1969 0.000 0.123 0.546 1.780 0.888 0.451 0.326 0.215 0.128 0.072 0.112 4.641 4.641 4.518 3.972 2.192 1.304 1970 0.000 0.381 0.814 0.480 1.295 0.162 0.655 0.275 0.061 0.136 0.083 4.341 4.341 3.961 3.147 2.666 1.371 1971 0.000 0.207 0.819 0.502 0.223 0.585 0.142 0.351 0.304 0.080 0.175 3.388 3.388 3.181 2.362 1.860 1.636 1972 0.056 2.902 1.833 2.641 0.510 0.119 0.324 0.122 0.220 0.115 0.125 8.967 8.911 6.009 4.176 1.535 1.025 1973[d] 0.056 0.521 11.644 2.189 2.540 0.426 0.314 0.354 0.050 0.203 0.388 18.684 18.628 18.107 6.463 4.274 1.735 1974 0.000 0.446 4.557 5.972 0.761 2.003 0.440 0.101 0.257 0.034 0.175 14.747 14.747 14.301 9.744 3.772 3.011 1975 0.000 0.064 0.378 2.042 3.092 0.261 0.686 0.129 0.094 0.108 0.039 6.892 6.892 6.828 6.451 4.409 1.317 1976 0.111 1.301 1.922 0.944 0.691 1.572 0.164 0.262 0.036 0.000 0.055 7.057 6.947 5.646 3.724 2.780 2.089 1977 0.000 0.028 3.527 1.080 0.523 0.279 0.727 0.051 0.066 0.000 0.020 6.301 6.301 6.273 2.746 1.666 1.143 1978 3.312 0.376 0.187 5.530 0.969 0.778 0.144 0.713 0.051 0.142 0.109 12.312 9.000 8.624 8.436 2.906 1.938 1979 0.109 0.435 1.359 0.298 1.913 0.541 0.234 0.087 0.145 0.012 0.022 5.156 5.047 4.611 3.253 2.955 1.042 1980 0.105 0.039 2.265 2.688 0.209 1.482 0.597 0.192 0.031 0.030 0.111 7.749 7.644 7.605 5.340 2.652 2.443 1981 0.301 2.303 1.916 2.779 1.667 0.100 0.870 0.269 0.144 0.000 0.085 10.435 10.134 7.831 5.914 3.135 1.468 1982[e] 0.148 0.488 3.395 1.406 1.295 1.039 0.016 0.298 0.064 0.016 0.035 8.200 8.053 7.564 4.169 2.763 1.468 1983 0.081 0.329 1.967 3.048 0.766 0.697 0.431 0.055 0.192 0.000 0.136 7.702 7.621 7.291 5.324 2.276 1.510 1984 0.000 0.402 0.462 0.797 1.161 0.446 0.424 0.223 0.000 0.156 0.008 4.079 4.079 3.677 3.215 2.418 1.257 1985 0.244 0.098 2.633 0.757 1.058 1.328 0.270 0.203 0.172 0.025 0.150 6.938 6.694 6.596 3.963 3.206 2.148 1986 0.092 0.871 0.423 1.824 0.360 0.545 0.633 0.063 0.119 0.095 0.015 5.040 4.948 4.077 3.654 1.830 1.470 1987 0.000 0.034 1.612 0.403 0.752 0.060 0.179 0.147 0.016 0.027 0.025 3.255 3.255 3.221 1.609 1.206 0.454 1988 0.180 0.700 0.684 3.115 0.413 0.645 0.045 0.020 0.052 0.000 0.007 5.861 5.681 4.981 4.297 1.182 0.769 1989 0.000 0.380 1.334 0.743 1.532 0.228 0.344 0.051 0.040 0.081 0.067 4.798 4.798 4.418 3.084 2.342 0.810 1990 0.041 0.194 0.926 1.707 0.653 0.896 0.125 0.139 0.013 0.016 0.027 4.736 4.695 4.501 3.575 1.868 1.215 1991 0.195 1.068 0.511 0.807 0.883 0.464 0.336 0.039 0.041 0.000 0.045 4.389 4.194 3.126 2.615 1.808 0.925 1992 0.000 0.123 1.255 0.470 0.163 0.270 0.144 0.161 0.020 0.037 0.028 2.671 2.671 2.548 1.293 0.823 0.660 1993 0.115 0.017 0.398 1.347 0.222 0.107 0.120 0.037 0.037 0.021 0.055 2.476 2.361 2.344 1.946 0.599 0.377
[a) Duling 1963-1984, BMV oval doors were used in spring and autumn surveys; since 1985, Portuguese polyvalent doors have been used in both surveys. Adjustments have been made to the 1963-1984 catch per tow data to standardize these data to polyvalent door equivalents. Conversion coeffiCients of 1.56 (numbers) and 1.62 (weight) were used in this standardization (NEFSC 1991). [b] Spring smveys during 1981-1982 and 1989-1991 and autumn surveys during 1977-1981 and 1989-1991,1993 were accomplished with the R/V Delaware II; in all other years, the sunreys were accomplished using the RjV Albatross Iv. Adjustments have been made to the RjV Delaware II catch per tow data to standardize these to RjV Albatross N equivalents. Conversion coeffiCients of 0.79 (numbers) and 0.67 (weight) were used in this standardization (NEFSC 1991). [c] SpIing sunreys during 1973-1981 were accomplished with a '41 Yankee' trawl; in all other years, spring sunreys were accomplished with a '36 Yankee' trawl. No adjustments have been made to the catch per tow data for these gear differences. [d] Excludes unusually high catch of 1894 cod (2558 kg) at Station 230 (Strata tow 20-4). [el Excludes unusually high catch of 1032 cod (4096 kg) at Station 323 (Strata tow 16-7).

Table 18. Continued.
Age Group Totals
Year 0 1 2 3 4 5 6 7 8 9 10+ 0+ 1+ 2+ 3+ 4+ 5+
Autumn
1963 0.019 0.719 0.778 0.920 0.897 0.354 0.326 0.175 0.103 0.014 0.069 4.374 4.356 3.636 2.858 1.938 1.041 1964 0.009 0.640 0.699 0.588 0.538 0.145 0.136 0.062 0.050 0.030 0.083 2.980 2.970 2.331 1.632 1.044 0.505 1965 0.173 1.299 0.998 0.707 0.484 0.167 0.179 0.112 0.081 0.023 0.023 4.248 4.075 2.775 1.777 1.070 0.587 1966 1.025 1.693 1.000 0.515 0.264 0.100 0.095 0.062 0.039 0.002 0.017 4.811 3.786 2.094 1.094 0.579 0.315 1967 0.072 7.596 1.334 0.523 0.406 0.133 0.133 0.055 0.051 0.012 0.070 10.383 10.312 2.716 1.382 0.860 0.454 1968 0.070 0.314 1.611 0.783 0.271 0.073 0.067 0.027 0.023 0.008 0.048 3.296 3.226 2.913 1.301 0.518 0.246 1969 0.000 0.343 0.622 0.626 0.331 0.094 0.061 0.019 0.023 0.022 0.059 2.200 2.200 1.856 1.234 0.608 0.278 1970 0.413 1.688 1.353 0.524 0.694 0.153 0.000 0.033 0.055 0.055 0.098 5.065 4.652 2.964 1.611 1.087 0.393 1971 0.399 0.602 0.632 0.390 0.301 0.476 0.183 0.042 0.089 0.000 0.075 3.189 2.789 2.187 1.555 1.165 0.864 1972 0.947 7.443 1.295 1.771 0.399 0.243 0.571 0.109 0.204 0.022 0.0831 3.087 12.140 4.697 3.402 1.632 1.232 1973 0.203 1.749 6.070 1.182 2.012 0.211 0.226 0.175 0.062 0.139 0.251 12.280 12.078 10.329 4.259 3.076 1.064 1974 0.462 0.409 0.654 1.521 0.164 0.114 0.103 0.000 0.069 0.000 0.000 3.494 3.033 2.624 1.970 0.449 0.285 1975 2.377 0.994 0.421 0.624 1.685 0.112 0.156 0.000 0.000 0.000 0.037 6.407 4.029 3.036 2.615 1.991 0.306 1976 0.000 6.148 2.072 0.763 0.278 0.739 0.055 0.270 0.039 0.053 0.020 10.436 10.436 4.288 2.217 1.454 1.176 1977 0.152 0.237 3.424 0.702 0.251 0.174 0.396 0.007 0.027 0.000 0.078 5.447 5.296 5.059 1.635 0.933 0.682 1978 0.396 1.855 0.255 4.180 0.964 0.335 0.165 0.344 0.051 0.030 0.014 8.587 8.192 6.337 6.082 1.902 0.938 1979 0.118 1.619 1.717 0.224 1.613 0.296 0.180 0.036 0.115 0.007 0.022 5.948 5.829 4.210 2.493 2.269 0.656 1980 0.280 0.818 0.564 0.774 0.076 0.251 0.053 0.067 0.025 0.000 0.000 2.908 2.629 1.810 1.246 0.472 0.396 1981 0.261 3.525 2.250 1.559 0.589 0.054 0.579 0.057 0.064 0.018 0.083 9.040 8.778 5.254 3.003 1.444 0.855 1982 0.320 0.875 2.094 0.220 0.069 0.097 0.000 0.016 0.000 0.000 0.022 3.711 3.391 2.516 0.423 0.203 0.134 1983 1.031 0.647 1.022 0.796 0.055 0.047 0.003 0.000 0.012 0.000 0.023 3.636 2.605 1.958 0.936 0.140 0.086 1984 0.186 2.496 0.101 0.886 0.870 0.017 0.062 0.039 0.006 0.039 0.044 4.747 4.561 2.065 1.964 1.078 0.207 1985 1.084 0.220 0.803 0.103 0.115 0.101 0.000 0.000 0.004 0.000 0.000 2.430 1.346 1.126 0.323 0.220 0.105 1986 0.096 2.280 0.153 0.382 0.010 0.061 0.090 0.016 0.000 0.008 0.028 3.124 3.028 0.748 0.595 0.213 0.203 1987 0.204 0.414 1.353 0.112 0.195 0.028 0.012 0.000 0.000 0.007 0.000 2.325 2.121 1.707 0.354 0.242 0.047 1988 0.549 0.903 0.433 0.909 0.091 0.178 0.000 0.011 0.039 0.000 0.000 3.113 2.564 1.661 1.228 0.319 0.228 1989 0.262 2.738 1.030 0.183 0.499 0.055 0.008 0.004 0.000 0.000 0.000 4.780 4.518 1.780 0.750 0.566 0.067 1990[f] 0.156 0.362 1.534 1.164 0.209 0.145 0.012 0.013- 0.000 0.000 0.022 3.617 3.460 3.098 1.564 0.401 0.192 1991 0.040 0.415 0.168 0.277 0.028 0.029 0.000 0.000 0.000 0.000 0.000 0.957 0.917 0.502 0.334 0.057 0.029 1992 0.033 0.454 1.024 0.180 0.112 0.030 0.010 0.000 0.000 0.000 0.000 1.843 1.810 1.356 0.332 0.152 0.040 1993 0.178 0.969 0.531 0.382 0.017 0.026 0.000 0.000 0.026 0.021 0.000 2.149 1.971 1.002 0.471 0.089 0.072
[f) Excludes unusually high catch of 111 cod (504 kg) at Station 205 (Strata tow 23-4). 1J ~ co ID
'" OJ

Page 24
Table 19. Estimates of instantaneous total mortality (2) and fishing mortality [F)' for the Georges Bank cod stock for seven time-periods. 1964 - 1992. derived from NEFC offshore spring and autumn bottom trawl survey data2
Time Spring Autumn Period
Z F
1964-1967
1968-1972 0.34 0.14
1973-1976 0.70 0.50
1977-1981 0.47 0.27
1982-1984 0.42 0.22
1985-1987 0.84 0.64
1988-1992 0.67 0.47
1 Instantaneous natural mortality (M) assumed to be 0.20. 2 Estimates derived from:
Z F
0.73 0.53
0.35 0.15
0.56 0.36
0.67 0.47
1.12 0.92
1.45 1.25
1.04 0.84
Georges Bank spring: In (l: age 4+ for year i to j/ 2: age 5+ for years i+ 1 to j+ 1). Georges Bank autumn: In (2: age 3+ for years i-I to j-l/ !: age 4+ for years i to j).
120 110
COMM LANDINGS -- 100 I-a 90
AVG F (AGES 4-8) LL 0 80 CI)
70 0 0 0 60 -(J) 50 CJ z 40 c z 30 <! 20 ...I
10 0
Geometric Mean
Z F
0.73 0.53
0.34 0.14
0.63 0.43
0.56 0.36
0.68 0.48
1.10 0.90
0.83 0.63
1.2 1.1 1.0 0.9 0.8 0.7 0.6 0.5 0.4 0.3 0.2 0.1 0.0
787980 81 82 83 84 85 86 87 88 89 90 91 9293
YEAR
Figure 6. Trends in total commercial landings and fishing mortality for Georges Bank cod. 1978-1993.
-to • '¢
(J) W CJ <! -LL
CJ > <!

Page 25
Table 20. Estimates of beginning year stock size (tbousands of fish), instantaneous fishing mortality and spawning stock biomass (metric tons) for Georges Bank cod estimated from virtual population analysis (VPA) calibrated using tbe ADAPT procedure, 1978-1993
Stock Numbers (Jan 1) in Thousands
Age 1978 1979 1980 1981 1982 1983 1984 1985 1986 1987 1988 1989 1990 1991 1992 1993
1 27727 23533 20212 41466 17487 9625 27440 8550 43151 16513 23359 17005 9493 22355 5530 3242 2 4267 22699 19237 16468 33925 14018 7782 22393 6879 35188 13496 19115 13922 7765 18256 4464 3 25474 3138 16785 12332 10583 19507 7599 5189 12519 4432 22048 9623 13761 6927 4978 11167 4 7962 13846 1755 8469 6277 5204 8675 3124 2038 6112 2357 10792 5235 6704 2737 2112 5 2906 4435 6929 984 4704 2618 2039 4084 1320 947 3085 1014 5076 2583 2520 1301 6 1102 1628 2534 3585 593 2042 1188 909 1638 646 523 1171 531 2108 795 723 7 1433 784 919 1101 1663 232 970 506 371 774 301 207 469 227 741 286 8 67 861 572 349 524 752 104 379 217 225 389 101 96 163 72 327 9 135 13 476 390 175 237 403 45 127 113 128 140 44 46 70 28
10+ 50 150 28 184 202 152 282 205 78 70 119 50 96 45 21 36
-------------------------------------1+ 71125 71087 69447 85328 76133 54385 56482 45385 68338 65021 65804 59219 48723 48923 35720 23685
Fishing Mortality
Age 1978 1979 1980 1981 1982 1983 1984 1985 1986 1987 1988 1989 1990 1991 1992
1 0.00 0.00 0.00 0.00 0.02 0.01 0.00 0.02 0.00 0.00 0.00 0.00 0.00 0.00 0.01 2 0.11 0.10 0.24 0.24 0.35 0.41 0.21 0.38 0.24 0.27 0.14 0.13 0.50 0.24 0.29 3 0.41 0.38 0.48 0.48 0.51 0.61 0.69 0.73 0.52 0.43 0.51 0.41 0.52 0.73 0.66 4 0.39 0.49 0.38 0.39 0.67 0.74 0.55 0.66 0.57 0.48 0.64 0.55 0.51 0.78 0.54 5 0.38 0.36 0.46 0.31 0.63 0.59 0.61 0.71 0.51 0.39 0.77 0.45 0.68 0.98 1.05 6 0.14 0.37 0.63 0.57 0.74 0.54 0.65 0.70 0.55 0.56 0.72 0.71 0.65 0.85 0.82 7 0.31 0.11 0.77 0.54 0.59 0.60 0.74 0.65 0.30 0.49 0.89 0.57 0.86 0.95 0.62 8 1.48 0.39 0.18 0.49 0.60 0.42 0.63 0.89 0.46 0.37 0.82 0.64 0.54 0.65 0.74 9 0.39 0.43 0.49 0.46 0.60 0.63 0.63 0.72 0.53 0.47 0.57 0.50 0.56 0.81 0.74
10+ 0.39 0.43 0.49 0.46 0.60 0.63 0.63 0.72 0.53 0.47 0.57 0.50 0.56 0.81 0.74 ---------------------------------_.
3+ 0.52 0.35 0.48 0.46 0.62 0.58 0.65 0.72 0.48 0.45 0.73 0.56 0.63 0.82 0.74 4+ 0.54 0.35 0.48 0.46 0.65 0.58 0.64 0.72 0.48 0.46 0.77 0.59 0.65 0.84 0.75
SSB at the Start of the Spawning Season - Males and Females (Tons)
Age 1978 1979 1980 1981 1982 1983 1984 1985 1986 1987 1988 1989 1990 1991 1992
1 913 1105 855 1964 1201 904 3129 762 7058 1843 2847 2204 1254 4707 1234 2 1410 7543 6919 5815 16168 6351 4308 11673 473324435 8576 13057 8910 5366 14108 3 33770 3728 22430 15947 15761 26133 10518 6888 18831 6964 33291 14693 22163 10765 7862 4 20261 38126 4296 21399 15824 12820 21768 8102 4857 17108 5939 27822 12891 16196 7415 5 8891 16635 30275 3957 17499 9676 7307 15048 5468 3956 12484 3961 18834 8698 8208 6 4784 8256 12599 20142 2955 10549 5695 4470 8744 3744 2786 6047 2692 9506 3633 7 8209 5422 6068 7359 11981 1458 6257 3209 2584 5536 2066 1348 2960 1285 4301 8 368 6804 4902 2835 4228 6656 809 3018 1748 1936 3105 850 792 1333 526 9 1227 113 3958 3961 1702 2172 3787 415 1281 1074 1185 1349 446 393 673
10+ 602 1703 388 3062 2958 1926 3770 2374 968 946 1596 762 1234 586 340 ---------------------------------_.
1+ 80436 89435 92689 86441 90276 78644 67348 55959 56271 67543 73875 72094 72177 58833 48300
Percent Mature (Females)
Age 1978 1979 1980 1981 1982 1983 1984 1985 1986 1987 1988 1989 1990 1991 1992
1 7 7 7 7 13 13 13 13 23 23 23 23 23 23 23 2 34 34 34 34 47 47 47 47 64 64 64 64 64 64 64 3 78 78 78 78 84 84 84 84 91 91 91 91 91 91 91 4 96 96 96 96 97 97 97 97 98 98 98 98 98 98 98 5 100 100 100 100 100 100 100 100 100 100 100 100 100 100 100 6 100 100 100 100 100 100 100 100 100 100 100 100 100 100 100 7 100 100 100 100 100 100 100 100 100 100 100 100 100 100 100 8 100 100 100 100 100 100 100 100 100 100 100 100 100 100 100 9 100 100 100 100 100 100 100 100 100 100 100 100 100 100 100
10+ 100 100 100 100 100 100 100 100 100 100 100 100 100 100 100

Page 26
60 120 [-558 I -55 .....
110 w 100 ·-R •. 50 CI
or::( 45 - 90 !;;i I-
:E 80 40 ::I: u. en 0 70 ... , . - 35 u.
/I) 60 30 u. 0 0 25 0 0 50 - en w 40 20 Z en 0 en 30 15 -..J
10 ..J
20 -:E 10 -----' 5 -a:
o 0 77 78 79 80 81 82 83 84 85 86 87 88 89 90 91 92 93
RECRUITMENT YEAR CLASS, SSB YEAR
Figure 7. Trends in spawning stock biomass and recruitment for Georges Bank cod.
1985, and 1986-1992 (Table 20), dertved from O'Brten (1990).
Full results from the final VPA calibration including estimates ofF, stock size and spawning stock biomass at age as well as calibration diagnostics are presented in Appendix I, and estimates ofF, stock size, and spawning stock biomass are given in Table 20. The final calibration exhibited very low correlations « 0.10) among estimates of slopes (q), and moderately low correlations « 0.20) between stock sizes and q's. The CVs on the age 1 to 8 stock size estimates were less than 0.40 in all cases, and ranged from 0.24 on age 3 to 0.38 on age 8 (Appendix 1; Page 50).
Average fishing mortality (ages 4 to 8, unweighted) in 1992 was estimated at 0.75 (Table 20, Figure 6). slightly lower than in 1991 (0.84) but higher than in 1989 and 1990 (0.59 and 0.65, respectively). The 11 % decrease in F is consistent with the 12% decrease in standardized fishing effort between 1991 and 1992 as indicated by the GLM (Table 16). Excluding the unusually high estimate of age 8 F in 1978, the mean fishing mortality on ages 4 to 8 increased from less than 0.5 prtor to 1982 to 0.6 to 0.7 durtng 1982-1985. After declining in 1986 and 1987, average F increased durtng the late 1980s, reaching a record high of 0.84 in 1991 before declining in 1992.
Spawning stock biomass (SSB) declined from
more than 90,000 mt durtng the early 1980s to about 56,000 mt in 1985 and 1986. Following the recruitment and maturation of the strong 1983 and 1985 year classes, SSB increased to about 73,000 mtin 1988 and 1989 (Table 20, Figure 7). The SSB has since declined to 59,000 mtin 1991 and to a record low 48,000 mt in 1992.
Since 1978 recruitment at age 1 has ranged from approximately 6 million (1991 year class) to 43 million (1985 year class) with most estimates between 17 and 27 million fish (Table 20, Figure 7). Over the 1978-1991 pertod, geomernc mean recruitment for the 1977-1990 year classes equalled 20 million fish. Except for the slightly above average 1990 year class, recruitment since 1989 has been below average, and the 1989 and 1991 year classes appear to be among the poorest on record. The estimate for the 1990 year class in the present assessment is consistent with that presented in the 1992 assessment (Serchuk et al. 1993) and is now considered to approximate the long-term average.
PRECISION OF F AND sse
The uncertainty associated with the estimates of stock size and fishing mortality from the final VPA was evaluated using a bootstrap procedure

(Efron 1982). Two hundred bootstrap iterations were performed to derive standard errors, coefficients of variation (CV s) and bias estimates for the age 1 to 8 stock size estimates at the stari of 1993 (Appendix 2: Table 1), the catchability estimates (q) for each index of abundance used in calibrating the VPA (Appendix 2: Table 2), and the age 1 to 7 F's in 1992 (Appendix 2: Table 3). Frequency distributions ofthe 1992 age 4 to 8 mean fishing mortality and spawning stock biomass bootstrap estimates were generated and cumulative probability curves were produced (Figures 8 and 9).
The bootstrap results indicate that age-specific stock sizes in 1993 were well estimated for all ages with CVs ranging from 0.22 to 0.39 (Appendix 2: Table 1). The CVs on the catchability estimates of the indices of abundance used in the final ADAPT calibration ranged from 0.14 to 0.16 for the U.S. spring and autumn bottom trawl survey indices and the five U.S. commercial LPUE indices (Appendix 2: Table 2). Canadian bottom trawl indices had CVs ranging from 0.21 to 0.24, perhaps due to the shorter time series of this survey.
The age-specific F's for ages 1 to 7 in 1992 were reasonably well estimated with CVs ranging from 0.19 to 0.28 (Appendix 2: Table 3) as was the mean (ages 4 to 8) fully recruited fishing mortality (CV = 0.11) (Appendix 2: Table 4). The mean bootstrap estimate of the fully recruited F in 1992 was identical to the VPA point estimate (F'992 = 0.75). The distribution of the F '992 estimates obtained from the 200 bootstrap replications ranged between F=0.53 and F=0.96 (Figure 8). Based on the cumulative probability curve (Figure 8), there is an 80% probability that the 1992 F lies between 0.64 and 0.87. This implies that there is a 90% probability that the 1992 F was greater than 0.64 (ee., about 1.8X the overfishing definition of F2D% = 0.36).
The fishing mortality estimate for 1992 was intermediate to the 1991 F (0.82) and the projected 1993 F (0.67). Given the amount ofprecision associated with the 1992 F estimate, there is about a 30% probability that F '992 was less than F 1991 and an equal probability that the projected F'993 will be less than F,992·
The bootstrap mean of spawning stock biomass in 1992 (49,000 mt) was rather precise (CV = 0.08) and slightly higher than the VPA point estimate (48,300 mt) (Appendix 2: Table 5). Estimates of SSB in 1992 obtained from the 200 individual bootstrap replicates ranged from 40,500 mt to 60,700 mt (Figure 9). Based on the cumulative probability curve (Figure 9), there is an 80% probability that the 1992 SSB was between 43,800 mt and 53,600 mt.
Page 27
Fishing Mortality .. .
100
>- 90
" 80 c Q)
70 :J CT so Q) ~
50 "-- 40 C Q) 30
" ~ 20 Q)
a.. 10
D
I I
1\ ~
j ~n 1
I 1111111 I~ 0.0 0.2 0.4 0.6 0.8 1.0 1.2 1.4 1.6 1.B 2.0
Fishing Mortality Rate
Figure 8. Precision of the estimates of the instantaneous rate of fishing mortalily (F) on the fully-recruited ages (ages 4+) in 1992 for Georges Bank cod. The vertical bars display both the range of the estimator and the probabilily of individual values within the range. The solid line gives the probabilily that F is greater than any selected value on the X-axis. The precision estimates were derived from 200 bootstrap replications of the final ADAPT VPA formulation.
Spawning Stock Biomass 100
>- 90
" 80 c Q)
70 :J CT 60 Q) ~
50 "-- 40 C Q) 30
" 20 i ~
Q)
a.. 10 I a ,
a 10 20 30 40 50 60 70
SSB (OOOs MT)
Figure 9. Precision of the estimates of spawning stock biomass (SSB) at the beginning of the 1992 spawning season (March 1) for Georges Bank cod. The vertical bars display both the range of the estimator and the probability of individual values within the range. The solid line gives the probabilily that SSB is less than any selected value on the X-axis. The precision estimates were derived from 200 bootstrap replications of the fmal ADAPT VPA formulation.
80

Table 2l. Results of retrospective analysis for Georges Bank cod based on final unweighted ADAPT formulation "U ~
"' ID Stock Size (Age 2+) (Thousands) '" CD
Terminal Year Year 1978 1979 1980 1981 1982 1983 1984 1985 1986 1987 1988 1989 1990 1991 1992 1993
1985 43731 48163 50467 44488 61403 48913 31715 42547 28323 1986 43365 47446 48971 43315 58209 44795 27891 33821 20911 33772 1987 43315 47419 49012 43396 58007 43925 27660 34014 21511 37792 25229 1988 43407 47574 49257 43788 58662 44937 28950 37406 25355 44678 32360 30864 1989 43399 47577 49280 43899 58621 44766 28978 37792 26105 48528 38413 36532 47873 1990 43397 47566 49259 43887 58631 44736 28989 37398 25686 48831 40734 40311 46610 34638 1991 43397 47549 49232 43862 58639 44740 29014 36709 25209 48626 42129 39754 38719 25932 29741 1992 43398 47553 49235 43862 58646 44760 29042 36835 25187 48508 42445 42214 39230 26568 30190 20443
Fishing Mortality
Terminal Year Year 1978 1979 1980 1981 1982 1983 1984 1985 1986 1987 1988 1989 1990 1991 1992
1985 0.3910 0.4261 0.4800 0.4393 0.5798 0.5705 0.5154 0.6289 1986 0.3952 0.4326 0.4922 0.4647 0.6113 0.6400 0.6306 0.8041 0.6634 1987 0.3958 0.4336 0.4927 0.4639 0.6090 0.6450 0.6623 0.8205 0.6329 0.6875 1988 0.3948 0.4319 0.4900 0.4596 0.5980 0.6292 0.6259 0.7302 0.5090 0.4606 0.7494 1989 0.3949 0.4320 0.4899 0.4592 0.5950 0.6302 0.6317 0.7282 0.4980 0.4352 0.5678 0.5726 1990 0.3949 0.4321 0.4901 0.4596 0.5953 0.6299 0.6328 0.7275 0.5093 0.4490 0.5612 0.5432 0.6209 1991 0.3949 0.4321 0.4904 0.4600 0.5960 0.6297 0.6326 0.7259 0.5304 0.4657 0.5655 0.5073 0.6318 0.8887 1992 0.3949 0.4321 0.4903 0.4600 0.5959 0.6296 0.6319 0.7242 0.5264 0.4666 0.5680 0.4998 0.5630 0.8105 0.7383
Spawning Stock Biomass (Tons)
Terminal Year Year 1978 1979 1980 1981 1982 1983 1984 1985 1986 1987 1988 1989 1990 1991 1992
1985 81135 90606 94548 89224 94444 85274 77481 68099 1986 80349 89284 92379 85818 89178 77369 65483 52052 46989 1987 80274 89167 92265 85754 89028 76824 64379 51203 47259 50439 1988 80452 89465 92732 86473 90265 78692 67564 56292 56170 64500 64176 1989 80445 89454 92735 86519 90358 78694 67508 56499 57575 68604 72515 68252 1990 80439 89442 92711 86481 90319 78658 67404 56233 57040 68379 73861 71765 75802 1991 80433 89430 92681 86431 90263 78619 67286 55849 56157 67439 73298 70339 69282 56353 1992 80436 89435 92689 86441 90276 78644 67348 55959 56271 67543 73875 72094 72177 58833 48300

RETROSPECTIVE ANALYSES
Retrospective analyses of the Georges Bank cod VPA were carried out using the final ADAPT formulation with the terminal year ranging from 1992 back to 1985. The mean F in these analyses was based on ages 3+. and therefore, results given in Table 21 and Figure 10 differ slightly from the final VPA. Convergence of estimates is generally evident within three years, and often within two years, prior to any given terminal year. Retrospective patterns are evident for Georges Bank cod, particularly with respect to terminal F. Mean F (ages 3+) was generally overestimated by the ADAPT calibration in most years and total stock size and SSB was most often underestimated. Terminal F's appear to have been well estimated in the more recent years since 1989, but estimates for 1985-1988 are considerably different from the estimates derived from the converged portions of the longer series.
Despite these patterns, the retrospective analysis provides additional evidence to substantiate the recent increase in F to about 0.8 in 1991.
Retrospective patterns for age 2+ stock size and SSB are similar, both indicating poorer estimates of terminal year values from 1985-1988. Although subject to some variability, stock size and SSB appear to have been estimated with. a high degree of reliability in the most recent years.
YIELD AND SPAWNING STOCK BIOMASS PER RECRUIT
Yield-per-recruit (ypR), total stock biomass per recruit, and spawning stock biomass per recruit (SSB jR) analyses were performed using the Thompson and Bell (1934) method. The exploitation pattern for input to the yield and SSB per recruit analyses and short-term projections was computed from the most recent five years of the F matrix derived from the VPA [fable 20). Geometric mean F at age was computed for the 1987-1991 period and divided by the geometric mean of the fully recruited F to derive the partial recruitment vector. The final exploitation pattern was smoothed, applying full exploitation on ages 4 and older. The final exploitation pattern was as follows:
Age 1: Age 2: Age 3: Ages 4+:
0.0019 0.3620 0.8169 1.0000
Page 29
(a) Stock Size (Ages 2+)
120 ~ 100
80 r 1 60~~ 40~~ 20 8S 87 88 92 o . 1 ' , ,
78 79 80 81 82 83 84 85 86 87 88 89 90 91 92 93
(b) Fishing Mortality Yeor
0.9 91 0.8 88 ; 0.7 92 0.6
lL 0.5 , 01 0.4 > 0.3 .:
0.2 0.1 0.0
78 79 80 81 82 83 84 85 86 87 88 89 90 91 92 93
(e) SSB Year
W 120
J 0
1 00 ~ 0 9-00 80 : 85
90 c 8 0 60~
89 I- 87 91 0 .0 86 j ·c 1ii 20 ~ :;;
0' 78 79 80 81 82 83 84 85 85 87 88 89 90 91 92 93
Yeo r
Figure 10. Retrospective analysis of (a) age 2+ stock size, (b) mean (ages 3+) fishing mortality, and (c) spawning stock biomass for Georges Bank cod. Retrospective analysis was carned out using the final ADAPT fonnulation for terminal years from 1992 back to 1985.
This pattern is similar to that obtained from the separable VPA and to that presented in the 1992 U.S. cod assessment (Serchuk et at 1993; NEFSC 1993), and was used in theYFR and SSBj R analyses and for the catch and stock size projections for 1993 and 1994.
Mean weights at age used in the YFR analyses were computed as a four-year arithmetic average oflandings mean weights at age (Table 8) over the 1989-1992 period. Mean weights at age for use in the SSBjR analyses were computed as the fouryear arithmetic average of stock mean weights at age [fable 10) over the period 1989-1992. The maturation ogive was taken from O'Brien et al. (1993).
The input data for the YFR and SSBjR analyses are given in Table 22, and the results are presented in Table 22 and in Figure 11. The results indicate that FO,1 = 0.16, F m= = 0.30, and F20% = 0.36. These values are nearly identical to those presented in the 1992 U.S. cod assessment (Le., FO.1 = 0.16, F m= = 0.29, and F20% = 0.35) (Serchuk et at 1993).

Page 30
Table 22. Yield and spawning stock biomass per recruit analysis for Georges Bank cod
NEFC Yield and Stock Size per Recruit Program - PDBYPRC PC Ver.1.2 [Method of Thompson and Bell (1934)] I-Jan-1992
Run Date: 15-11-1993; Time: 11:47:53.88 Georges Bank Cod
Proportion of F before spawning: .1667 Proportion of M before spawning: .1667 Natural Mortality- is Constant at: .200 Initial age is: I; Last age is: 10 Last age is a PLUS group; Original age-specific PRs, Mats, and Mean Wts from file: ==> GBCOD.DAT
Age-specific Input data for Yield per Recruit Analysis
Age Fish Mort Nat Mort Proportion Average Weigh!.!... Pattern Pattern Mature Catch Stock
I .0019 1.0000 .2300 1.031 .646 2 .3620 1.0000 .6400 1.587 1.190 3 .8169 1.0000 .9100 2.436 1.951 4 1.0000 1.0000 .9800 3.639 2.973 5 1.0000 1.0000 1.0000 4.940 4.281 6 1.0000 1.0000 1.0000 6.269 5.537 7 1.0000 1.0000 1.0000 7.899 7.005 8 1.0000 1.0000 1.0000 10.433 8.952 9 1.0000 1.0000 1.0000 11.498 11.095 10+ 1.0000 1.0000 1.0000 15.670 15.373
Summary of Yield per Recruit Analysis for:Georges Bank cod Slope of the Yield/Recruit Curve at F=O.OO: 27.0904
F level at slope=l/IO of the above slope (FO
•1): .157
Yield/Recruit corresponding to F 0.1: 1.6451 F level to produce Maximum Yield/Recruit (F max): .296
Yield/Recruit corresponding to Fmax: 1.7791 F level at 20 % of Max Spawning Potential (F~w): .358
SSB /Recruit corresponding to F 20: 5.4347
Listing of Yield per Recruit Results for:Georges Bank Cod
FMORT TOTCTHN TOTCTHW TOTSTKN TOTSTKW SPNSTKN
.00 .00000 .00000 5.5167 29.0963 4.2370
.07 .17675 1.14080 4.6367 19.0500 3.3577
.13 .28345 1.57069 4.1069 13.7296 2.8285 FO. l
.16 .31122 1.64506 3.9693 12.4674 2.6911
.20 .35518 1.72933 3.7518 10.5910 2.4740
.27 .40692 1. 77587 3.4964 8.5944 2.2192 F_ .30 .42475 1.77910 3.4086 7.9643 2.1317
.34 .44616 1.77480 3.3034 7.2492 2.0267 F20% .36 .45742 1.76913 3.2482 6.8920 1.9717
.40 .47706 1.75399 3.1520 6.3000 1.8759
.47 .50210 1.72591 3.0298 5.6041 1.7541
.54 .52287 1.69615 2.9289 5.0770 1.6535
.60 .54043 1.66719 2.8438 4.6667 1.5689
.67 .55551 1.64003 2.7712 4.3395 1.4966
.74 .56862 1.61498 2.7082 4.0733 1.4340
.80 .58016 1.59205 2.6530 3.8528 1.3791
.87 .59041 1.57111 2.6041 3.6673 1.3305
.94 .59960 1.55197 2.5605 3.5091 1.2872 1.01 .60790 1.53446 2.5214 3.3727 1.2483 1.07 .61543 1.51839 2.4859 3.2538 1.2131 1.14 .62232 1.50362 2.4536 3.1492 1.1810 1.21 .62865 1.48999 2.4241 3.0565 1.1517 1.27 .63449 1.47738 2.3969 2.9736 1.1247 1.34 .63990 1.46570 2.3718 2.8991 1.0998
SPNSTKW %MSP
27.1764 100.00 17.2789 63.58 12.0676 44.40 10.8361 39.87 9.0102 33.15 7.0754 26.04 6.4670 23.80 5.7780 21.26 5.4347 20.00 4.8666 17.91 4.2010 15.46 3.6988 13.61 3.3091 12.18 2.9994 11.04 2.7482 10.11 2.5407 9.35 2.3667 8.71 2.2187 8.16 2.0913 7.70 1.9806 7.29 1.8835 6.93 1.7975 6.61 1.7209 6.33 1.6522 6.08
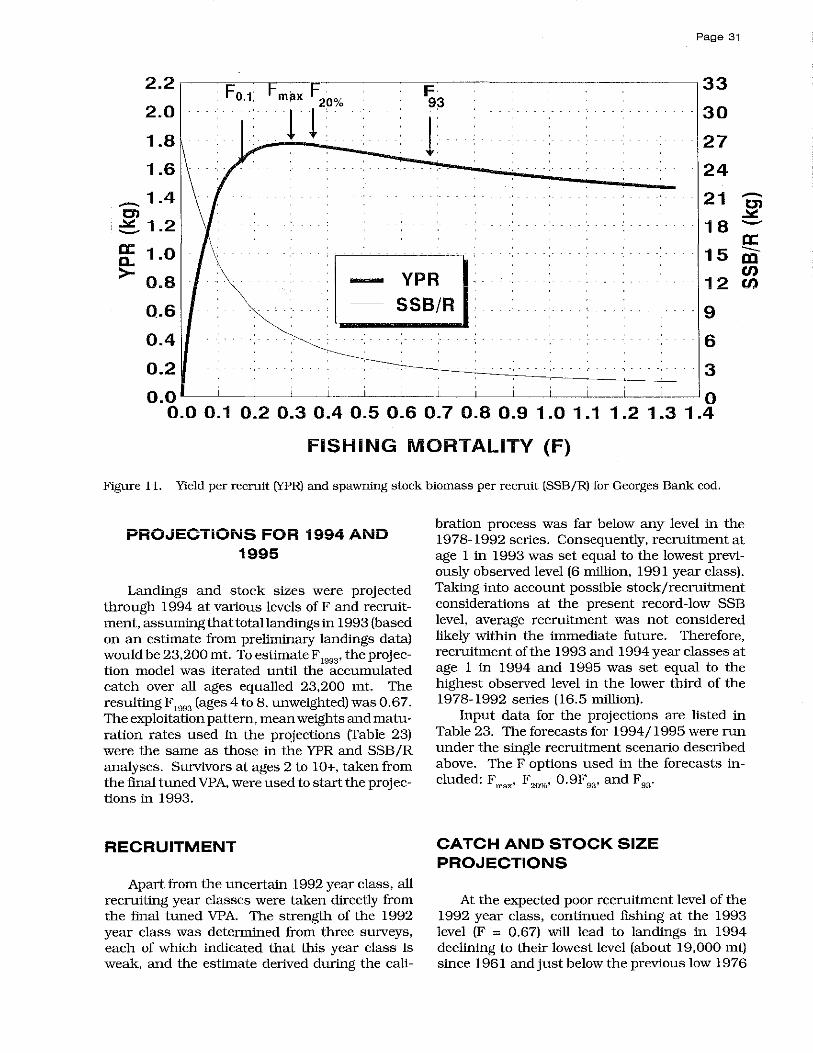
Page 31
2.2 - 33 Fo.t Fm~x F F 20% 93
2.0 11 30
1 1.8 27
1.6 24 _ 1.4 21 ..-..
Cl Cl ..lo::
==- 1.2 18 -ex: 1.0
0: 15 -D.. m
>- 0.8 YPR (f) - 12 (f)
0.6 SSBjR 9
0.4 6
0.2 3 0.0 -----'- I J i __ L.-.-i_ 0
0.00.1 0.20.30.4 0.5 0.6 0.7 0.8 0.9 1.0 1.1 1.2 1.3 1.4
FISHING MORTALITY (F)
F1gure 11. Yield per recruit (YPR) and spawning stock biomass per recruit (SSB/R) for Georges Bank cod.
PROJECTiONS FOR 1994 AND 1995
Landings and stock sizes were projected through 1994 at various levels of F and recruitment. assuming thattotallandtngs in 1993 (based on an estimate from preliminary landings data) would be 23.200 mt. To estimate F 1993' the projection model was iterated until the accumulated catch over all ages equalled 23,200 mt. The resulting F
1993 (ages 4 to 8, unweighted) was 0.67.
The exploitation pattern, mean weights and maturation rates used in the projections (Table 23) were the same as those in the YPR and SSB /R analyses. Survivors at ages 2 to 10+, taken from the final tuned VPA, were used to start the projections in 1993.
RECRUITMENT
Apart from the uncertain 1992 year class, all recruiting year classes were taken directly from the final tuned VPA. The strength of the 1992 year class was determined from three surveys, each of which indicated that this year class is weak, and the estimate derived during the cali-
bration process was far below any level in the 1978-1992 series. Consequently, recruitment at age 1 in 1993 was set equal to the lowest previously observed level (6 million, 1991 year class). Taking into account possible stock/recruitment considerations at the present record-low SSB level, average recruitment was not considered likely within the immediate future. Therefore, recruitment of the 1993 and 1994 year classes at age 1 in 1994 and 1995 was set equal to the highest observed level in the lower third of the 1978-1992 series (16.5 million).
Input data for the projections are listed in Table 23. The forecasts for 1994/1995 were run under the single recruitment scenario described above. The F options used in the forecasts included: F _' F20%, 0.9F93 , and F93 •
CATCH AND STOCK SIZE PROJECTIONS
At the expected poor recruitment level of the 1992 year class, continued fishing at the 1993 level (F = 0.67) will lead to landings in 1994 declining to their lowest level (about 19,000 mt) since 1961 and just below the previous low 1976

Page 32
Table 23. Forcasted landings of Georges Bank cod in 1994 and spawning stock biomass (SSB) in 1994 and 1995. In all of the forecasts the strength of the 1992 year class was set at the lowest level previously observed (6 million) and tbe 1993 and 1994 year classes were setto tbe higbestlevel observed in the lowest third of the 1978-1992 recruitment series.
The NEFC/PDB Catch and Stock Size Prediction Program - PDBPRED Run Date: 15-11-1993; Time: 10:53:48.11: Projection 4# 1
Input for Projections:
Number of Years: 3; Initial Year: 1993 Final Year: 1995 Number of Ages: 10: Age at Recruitment: 1: Last Age: 10 Natural Mortality is assumed constant over time at: .200 Proportion of F before spawning: .1667 Proportion of M before spawning: .1667 Last age is a PLUS group; Original age-specific PRs, Mats, and Mean Wts from file: ==> GBCOD.DAT
Year
1993 1994 1995
Year-Specific Input Data for Projection # 1
Recruits at Agel
6000. 16500. 16500.
Reference F
.670
.670
.670
Natural Mortality
.200
.200
.200
Target Catch
N/A N/A N/A
Age-Specific Input Data for Projection # 1
Age Stock Size Fish Mort Nat Mort Proportion Average Weights in 1993 Pattern Pattern Mature Catch Stock
1 6000. .0019 1.0000 .2300 1.031 .646 2 4464. .3620 1.0000 .6400 1.587 1.190 3 11167. .8169 1.0000 .9100 2.436 1.951 4 2112. 1.0000 1.0000 .9800 3.639 2.973 5 1301. 1.0000 1.0000 1.0000 4.940 4.281 6 723. 1.0000 1.0000 1.0000 6.269 5.537 7 286. 1.0000 1.0000 1.0000 7.899 7.005 8 327. 1.0000 1.0000 1.0000 10.433 8.952 9 28. 1.0000 1.0000 1.0000 11.498 11.095 10+ 36. 1.0000 1.0000 1.0000 15.670 15.373
Run Date: 15-11-1993: Time: 11:01:08.56; Projection 4# 0
Year: 1993 Year: 1994- Year: 1995 Factor Ref Stock SpStock Catch Factor Ref Stock SpStock Catch Stock SpStock
F Biomass Biomass F Biomass Biomass Biomass Biomass
1.00 .67 52621 40139 23159 .00 .00 49749 37355 0 72597 55863 .10 .07 37002 2429 70023 52916 .20 .13 36652 4718 67604 50172 .30 .20 36307 6873 65331 47618 .40 .27 35965 8903 63193 45240 .50 .34 35626 10816 61183 43026 .60 .40 35292 12619 59293 40963 .70 .47 34960 14319 57515 39040 .80 .54 34632 15921 55842 37248 .90 .60 34308 17433 54268 35578
1.00 .67 33987 18858 52787 34020 1.10 .74 33669 20203 51393 32566 1.20 .80 33355 21473 50081 31210 1.30 .87 33044 22671 48845 29943 1.40 .94 32737 23803 47682 28761 1.50 1.00 32432 24871 46586 27657 1.60 1.07 32131 25881 45553 26624 1.70 1.14 31833 26835 44580 25659 1.80 1.21 31538 27737 43663 24757 1.90 1.27 31246 28589 42798 23913 2.00 1.34 30958 29396 41983 23122

Table 23. Continued.
The NEFCjPDB Catch and Stock Size Prediction Program - PDBPRED Run Date: 15-11-1993: Time: 10:53:48.33; Projection # 1 Fsq
Georges Bank cod
Year F{rel) Recruits Total Stock Spawning Stock Number Weight Number Weight
1993 . 670 6000 . 26444. 52622. 17087. 40139. 1994 . 670 16500. 31579. 49749 . 15118. 33988. 1995 . 670 16500 . 37562. 52788. 18021. 34020.
RunDate: 15-11-1993; Time: 10:55:04.68; Projection 4/: 2 0.9xFsq Georges Bank cod
Year F{rel) Recruits ~~T~o~t~u~S~t~o~c~k~ __ ~~S.pa~gStock Number Weight Number Weight
1993 1994 1995
. 670
. 600
. 600
6000. 16500 . 16500.
26444. 31579. 37947 .
52622. 49749. 54337.
17087 . 15226. 18454.
40139. 34323. 35650.
Run Date: 15-11-1993; Time: 10:55:39.17; Projection # 3. F20% Georges Bank cod
Year F{rel) Recruits Total Stock Spawning Stock Number Weight Number Weight
1993 . 670 6000 . 26444. 52622. 17087. 40139. 1994 . 360 16500 . 31579. 49749. 15603. 35501. 1995 . 360 16500 . 39448. 60464. 20165. 42239.
Run Date: 15-11-1993; Time: 12:52:09.81; Projection # 4. Fmax Georges Bank cod
Year F{rel) Recruits Total Stock Spawning Stock Number Weight Number Weight
1993 . 670 6000. 26444. 52622. 17087. 40139. 1994 . 300 16500. 31579. 49749. 15700. 35803. 1995 . 300 16500. 39873. 62218. 20656. 44164 .
Run Date: 15-11-1993; Time: 10:55:21.92; Projection 4/: 5, FO.l Georges Bank cod
Year F{rel) Recruits Total Stock Spawning Stock Nuniber Weight Number Weight
1993 . 670 6000 . 26444. 52622. 17087. 40139. 1994 . 160 16500 . 31579. 49749. 15928. 36518. 1995 . 160 16500. 40953. 66706 . 21916. 49160.
Forecast Summary Table for Georges Bank cod. 1993-1995.
Recruitment 1993 1994 in1994-95 (No. offish F(93) Landings SSB Basis F(94) at agel) (mt) (mt) (mt)
16.5million 0.67 23.159 40.139 Fm= 0.30 0.67 23.159 40.139 F,,,,, 0.36 0.67 23.159 40.139 O.9F
93 0.60
0.67 23.159 40.139 F" 0.67
Catch Number Weight
7340. 23159. 5355. 18859. 5856. 17465.
Catch .. _' __ _ Number Weight
7340. 4921. 5507.
23159. 17367. 16765.
Catch Number Weight
7340. 23159. 3234. 11502. 3959. 12920.
Catch Number Weight
7340 . 23159. 2759. 9832 . 3463. 11495.
Catch Number Weight
7340. 23159. 1556. 5570. 2078. 7173.
Landings SSB (mt) (mt)
9.832 35.803 11.502 35.501 17.367 34.323 18.859 33.988
1995
Page 33
SSB
44.164 42.239 35.650 34.020

Page 34
- 40 I-~ 35 u.. 0 en 30 0 0 025 "-"
o::t ,01 20 01 ...... z: 15 (/)
F • . 0.1
-l. + -l. .~
.~~
80
70
60
50
40
30 ~
-I-~ u.. 0 en 0 0 0 "-"
II) 01 01 T""
z (!} 10 z: c z 5
- LANDINGS SSB
20
10
m en en
:3 o .L 0 0.0 0.1 0.2 0.3.0.4 0.5 0.6 0.7 0.8 0.9 1.0 1.1 1.2 1.3 1.4
FISHING MORTALITY (F)
Figure 12. Predicted catches in 1994 and spawning stock biomasses in 1995 for Georges Bank cod over a range of fishing mortalities io 1994 from F=O to F=1.34.
level [fable 23). Ifrecruitment of tbe 1993 and 1994 year classes remains below average. SSB will decline from about 40.000 mt in 1993 to a 'new' record low of 34,000 mt in 1994 and 1995 (Figure 12).
CONCLUSIONS
The Georges Bank cod stock is at a low biomass level and is overexploited. Fishing mortality in 1992 declined from tbe record-high 1991 level but spawning stock biomass continued to decline to a record low. Apart from tbe 1990 year class, recent recruitment has been below average or poor.
Continued fishing at current levels of fishing mortality will result in further declines in SSB to all-time low levels. At a minimum, fishing mortality should be reduced to avoid further declines in stock size. A 10% reduction in fishing mortality in 1994 would not result in any appreciable shortterm increase in SSB between 1994 and 1995. Recovery of the stock will require a marked reduction in fishing mortality.
ACKNOWLEDGMENTS
We express our appreciation to Ray Conser for his considerable efforts in the development and implementation oftbe algOrithms used in the ADAPT and bootstrapping procedures. We especially thank Stratis Gavaris and Joe Hunt for their insightful suggestions concerning tbeADAPTVPA calibrations.
The authors wish to acknowledge Tom Helser, Katby Sosebee, Brenda Figuerido and Dan Hayes who constructed the U.S. otter trawl subfleet standardized effort series and the corresponding landings at age matrix.
REFERENCES
Azarovitz, T.R. 1981. A brief historical review of tbe Woods Hole Laboratory trawl survey time series. In Doubleday, W.G. and D. Rivard (eds.J. Bottom Trawl Surveys. Can, Spec. PubL Fish. Aquat. Sci. 58:62-67.

Clark, S,H. 1981. Use of trawl survey data in assessmentsInDoubleday, W.G. and D. Rivard (eds.), Bottom Trawl Surveys. Can. Spec. Publ. Fish. Aquat. ScL 58:82-92.
Conser, RJ. and J.E. Powers. 1990. Extension of the ADAPT VPA tuning method designed to facilitate assessment work on tuna and swordfish stocks. ICCAT [International Commission for Conservation of Atlantic Tunas] CoIl. Vol. ScL Pap. 32: 461-467.
Efron, B. 1982. The jackknife, the bootstrap and other resampling plans. Phita. Soc. for Ind. and Appl. Math. 38.
Gavaris, S. 1988. An adaptive framework for the estimation of population size. CAFSAC ]Canadian Atlantic Fisheries Scientijk Advisory Committee] Res. Doc. 88/29.
Hunt, J. J. 1988. Status of the Atlantic cod stock on Georges Bank, NAFO Division 5Z and Subarea 6, in 1987. CAFSAC [Canadian Atlantic Fisheries Scientifi<; Advisory Committee] Res. Doc. 88/73.
Hunt, J. J. 1990. Status of the Atlantic cod stock on Georges Bank in Unit Areas 5Zj and 5Zm, 1978-89. CAFSAC [Canadian Atlantic Fisheries Scientijk AdviSOry Committee] Res. Doc.90/ 80.
Hunt, J. J., andM.-1. Buzeta. 1992. Status of the Atlantic cod stock on Georges Bank in Unit Areas 5Zj and 5Zm, 1978-91. CAFSAC [Canadian Atlantic Fisheries Scientific Advisory Committee] Res. Doc. 92/48.
Hunt, J. J., and M.-l. Buzeta. 1993. Biological Update of Georges Bank Cod in Unit Areas 5Zj,m for 1978-92. DFO Atl. Fish. Res. Doc. 93/39.
Hunt, J. J., M-l. Buzeta, and J.D. Neilson. 1991. Status of the Atlantic cod stock on Georges Bank in Unit Areas 5Zj and 5Zm, 1978-90. CAFSAC [Canadian Atlantic Fisheries Scientific Advisory Committee Res. Doc. 91/41.
Mayo, RK, T.E. Helser, L. O'Brien, KA. Sosebee, B.F. Figuerido, and D. Hayes. 1994. Estimation of standardized otter trawl effort and landings per unit effort at age for Gulf of Maine and Georges Bank cod. Woods Hole, MA: NOAA/ NMFS/NEFSC. NEFSC [Northeast Fisheries Science Center] Ref. Doc. 94-12.
Minet, J. P. 1978. Dynamics and yield assessment of the northeastern Gulf of St. Lawrence cod stock. ICNAF [International Commission for Northwest Atlantic Fisheries] Sel. Pap. 3: 7-16.
NEFC [Northeast Fisheries Center]. 1986. Report of the Third NEFC Stock Assessment Workshop (Third SAW). Woods Hole, MA: NOAA/ NMFS/NEFC. Woods Hole Lab. Ref. Doc. 86-14.
Page 35
NEFC [Northeast Fisheries Center]. 1989. Report of the Seventh NEFC Stock Assessment Workshop (Seventh SAW). Woods Hole, MA: NOAA/NMFS/NEFC. NEFC [Northeast Fisheries Center] Ref. Doc. 89-04.
NEFC [Northeast Fisheries Center]. 1990. Report of the Eleventh NEFC Stock Assessment Workshop, Fall 1990. Woods Hole, MA: NOAA/ NMFS/NEFC. NEFC [Northeast Fisheries Science Center] Ref. Doc. 90-09.
NEFSC [Northeast Fisheries Science Center]. 1991. Report of the Twelfth Northeast Regional Stock Assessment Workshop, Spring 1991. Woods Hole, MA: NOAA/NMFS/NEFSC. NEFSC [Northeast Fisheries Science Center] Ref. Doc. 91-03.
NEFSC [Northeast Fisheries Science Center]. 1992. Report of the Thirteenth Northeast Regional StockAssessment Workshop (13th SAW). Woods Hole, MA: NOAA/NMFS/NEFSC. NEFSC [Northeast Fisheries Science Center] Ref. Doc. 92-02.
NEFSC [Northeast Fisheries Science Center]. 1993. Report of Fifteenth Northeast Regional Stock Assessment Workshop (15th SAW): Stock Assessment Review Committee (SARC) Consensus Summary of Assessments. Woods Hole, MA: NOAA/NMFS/NEFSC. NEFSC [Northeast Fisheries Science Center] Ref. Doc. 93-06.
O'Brien, L. 1990. Effects of fluctuations in stock abundance upon life history parameters of Atlantic cod, Gadus morhua L., for the 1970-1987 year classes from Georges Bank and the Gulf of Maine. Seattle: Universi1y of Washington. Master's thesis.
O'Brien, L., J. Burnett, and RK Mayo. 1993. Maturation of nineteen species of finfish off the Northeast coast of the United States, 1985-1990. NOAA Tech. Rep. NMFS 113.
Paloheimo, J. E., andA. C. Koehler. 1968. Analysis of the southern Gulf of St. Lawrence cod populations. J. Fish. Res. Board Can. 25(3): 555-578.
Pinhorn, A. T. 1975. Estimates of natural mortali1y for the cod stock complex in ICNAF Division 2J, 3K and 3L. ICNAF [International Commission for Northwest Atlantic Fisheries] Fish. Res. Bull. 11: 31-36.
Recreational Fishery Statistics Working Group. 1992, unpublished. MFRSS (Marine Recreational Fishery Statistics Survey) catch statistics for Atlantic cod. Plenary Working Paper No. 2, 13th Northeast Regional Stock Assessment Workshop.
Rivard, D. 1980. APL programs for stock assessment. Can. Tech. Rep. Fish. Aquat. Sci. 953.

Page 36
Serchuk, F,M, 1989, unpublished, Status and assessment of the Georges Bank and Gulf of Maine cod stocks - 1988, Working Paper No, 1, 7th NEFC Stock Assessment Workshop,
Serchuk, F.M" RK. Mayo, S.W. Wigley, L. O'Brien and N. Buxton. 1991, unpublished. Revised assessment of the Georges Bank cod stock-1991. Working Paper No. 18, 13th Northeast Regional Stock Assessment Workshop:
Serchuk, F. M., and S. E. Wigley. 1986. Assessment and status of the Georges Bank and Gulf of Maine Atlantic cod stocks. Woods Hole, MA: NOAA/NMFS/NEFC. Woods Hole Lab. Ref. Doc. 86-12.
Serchuk, F.M., and S. E. Wigley. 1990, unpublished. Revised assessment of the Georges Bank cod stock, 1990. Working Paper No. 1., 11 th NEFC Stock Assessment Workshop.
Serchuk, F.M., and S.E. Wigley. 1992. Assessment and management of the Georges Bank cod fishery: an historical review and evaluation. J. Northw. Atl. Fish. ScL 13: 25-52.
Serchuk, F.M" L. O'Brien, RK. Mayo, and S.E. Wigley. 1993. Assessment ofthe Georges Bauk cod stock for 1992. Woods Hole, MA: NOAA/ NMFS/ NEFSC. NEFSC [Northeast Fisheries Science Center] Ref. Doc. 93-05.
Thompson, W. F" andF. H. Bell. 1934. Biological statistics of the Pacific halibut fishery. 2. Effect of changes in intensity upon total yield and yield per unit of gear. Rep. Int. Fish. [Pacific Halibut) Comm. 8.
United States Department of Commerce. 1979. Fisheries of the United States, 1978. CWTent Fish. Stat. 7800.
Page 37
Appendix 1
Full Listing of ADAPT VPA Calibration Output and Diagnostics

ADAPT Run Number 136 COD: GEORGES BANK STOCK GBCOD93_UNWT
1993 11 12 17564
Output option selected for input parameters: full Output option selected for results: full
INPUT PARAMETERS AND OPTIONS SELECTED
Natural mortality is 0.2
OLdest age (not in the pLus group) is 9
For all yrs prior to the terminal year (1992), backcaLcuLated stock sizes for the following ages used to estimate totaL mortality (Z) for age 9: 34 5 6 789 This method for estimating F on the oLdest age is generaLly used when a fLat~topped partial recruitment curve is thought to be characteristic of the stock.
F for age 10+ is then calcuLated from the foLlowing ratios of F[age 10+] to Frage 9]
1978 1.0000 1979 1.0000 1980 1.0000 1981 1.0000 1982 1.0000 1983 1.0000 1984 1.0000 1985 1.0000 1986 1.0000 1987 1.0000 1988 1. 0000 1989 1.0000 1990 1.0000 1991 1.0000 1992 1.0000
Stock size of the 10+ group is then calculated using the foLLowing method: CATCHEQ
Partial recruitment estimate for 1992 1 0.0034 2 0.4410 3 1.0000 4 1.0000 5 1.0000 6 1.0000 7 1.0000 8 1.0000 9 1.0000
Objective function is SUM w*( LOG(OBS) ~ LOG(PRED) )**2
Indices normaLized (by dividing by mean observed value) before tuning to VPA stocksizes
The residuals for years prior to the terminaL year are downweighted using the following algorithm: NONE
Biomass estimates (other than SSB) reflect mean stock sizes. SSB caLculated as in the NEFSC projection program (see note beLow SSB table for description of the algorithm).
Initial estimates of parameters for the Marquardt aLgorithm and Lower and upper bounds on the parameter estimates:
Page 39

Page 40
Par.
N 1 N 2 N 3 N 4 N 5 N 6 N 7 N 8 qRV SPR 1 qRV SPR 2 qRV SPR 3 qRV SPR 4 qRV SPR 5 qRV SPR 6 qRV SPR 7 qRV SPR 8 qRV CAN 1 qRV CAN 2 qRV CAN 3 qRV CAN 4 qRV CAN 5 qRV CAN 6 qRV CAN 7 qRV CAN 8 qRV AUT 1 qRV FAL 1 qRV FAL 3 qRV FAL 4 qRV FAL 5 qRV FAL 6 qCM CPE 2 qCM CPE 3 qCM CPE 4 qCM CPE 5 qCM CPE 6
Initial Est
2.0000000E3 9.0000000E3 4.0000000E3 5.0000000E3 2.0000000E3 2.0000000E3 2.0000000E3 1.0000000E3 1.0000000E·4 1. OOOOOOOE· 4 1.0000000E·4 1.0000000E-4 1.0000000E-4 1. 0000000E-4 1.0000000E·4 1.0000000E·4 1.0000000E·4 1. OOOOOOOE· 4 1.0000000E·4 1.0000000E-4 1.0000000E-4 1.0000000E-4 1. 0000000E-4 1. 0000000E-4 1. 0000000E-4 1.0000000E·4 1.0000000E ·4 1.0000000E·4 1.0000000E·4 1.0000000E·4 1.0000000E-4 1.0000000E-4 1. 0000000E-4 1. 0000000E-4 1. 0000000E-4
Lower Bnd
1.0000000EO 1.0000000EO 1.0000000EO 1.0000000EO 1. OOOOOOOEO 1. OOOOOOOEO 1. OOOOOOOEO 1. OOOOOOOEO O.OOOOOOOEO O.OOOOOOOEO O.OOOOOOOEO O.OOOOOOOEO O.OOOOOOOEO O.OOOOOOOEO O.OOOOOOOEO O.OOOOOOOEO O.OOOOOOOEO O.OOOOOOOEO O.OOOOOOOEO O.OOOOOOOEO O.OOOOOOOEO O.OOOOOOOEO O.OOOOOOOEO O.OOOOOOOEO O.OOOOOOOEO O.OOOOOOOEO O.OOOOOOOEO O.OOOOOOOEO O.OOOOOOOEO O.OOOOOOOEO O.OOOOOOOEO O.OOOOOOOEO O.OOOOOOOEO O.OOOOOOOEO O.OOOOOOOEO
Upper Bnd
1 .0000000E6 1.0000000E6 1.0000000E6 1.0000000E6 1.0000000E6 1.0000000E6 1.0000000E6 1.0000000E6 1.0000000EO 1.0000000EO 1. OOOOOOOEO 1. OOOOOOOEO 1. OOOOOOOEO 1. OOOOOOOEO 1.0000000EO 1.0000000EO 1.0000000EO 1.0000000EO 1.0000000EO 1.0000000EO 1.0000000EO 1.0000000EO 1. OOOOOOOEO 1 .OOOOOOOEO 1.0000000EO 1.0000000EO 1.0000000EO 1.0000000EO 1.0000000EO 1.0000000EO 1.0000000EO 1.0000000EO 1. OOOOOOOEO 1.0000000EO 1.0000000EO
The following indices of abundance are available:
1 RV SPR 1 2 RV SPR 2 3 RV SPR 3 4 RV SPR 4 5 RV SPR 5 6 RV SPR 6 7 RV SPR 7 8 RV SPR 8 9 RV CAN 1
10 RV CAN 2 11 RV CAN 3 12 RV CAN 4 13 RV CAN 5 14 RV CAN 6 15 RV CAN 7 16 RV CAN 8 17 RV AUT 1 18 RV FAL 1 19 RV FAL 2 20 RV FAL 3 21 RV FAL 4 22 RV FAL 5 23 RV FAL 6 24 CM CPE 2 25 CM CPE 3 26 CM CPE 4 27 CM CPE 5 28 CM CPE 6
Indices that will be used in this run are:
1 2 3 4 5 6 7 8 9 10 11 12 13 14 15 16 17 18 20 21 22 23 24 25 26 27 28

Page 41
Obs Indices (before transformation) by index & yri with index means
• 1978 1979 1980 1981 1982 1983 1984 ---+----------------------------------------------------------------------1 • 0.376 0.435 0.039 2.303 0.488 0.329 0.402 2 • 0.187 1.359 2.265 1.916 3.395 1.967 0.462 3 • 5.530 0.298 2.688 2.779 1.406 3.048 0.797 4 • 0.969 1.913 0.209 1.667 1.295 0.766 1.161 5 • 0.778 0.541 1.482 0.100 1.039 0.697 0.446 6 • 0.144 0.234 0.597 0.870 0.016 0.431 0.424 7 • 0.713 0.087 0.192 0.269 0.298 0.055 0.223 8 • 0.051 0.145 0.031 0.144 0.064 0.192 0.000 9 • ·999.000 -999.000 -999.000 -999.000 -999.000 -999.000 -999.000
10 • -999.000 -999.000 -999.000 -999.000 -999.000 -999.000 -999.000 11 • -999.000 -999.000 -999.000 -999.000 -999.000 -999.000 -999.000 12 • -999.000 -999.000 -999.000 -999.000 -999.000 -999.000 -999.000 13 • -999.000 -999.000 -999.000 -999.000 -999.000 -999.000 -999.000 14 • -999.000 -999.000 -999.000 -999.000 -999.000 -999.000 -999.000 15 • -999.000 -999.000 -999.000 -999.000 -999.000 -999.000 -999.000 16 • -999.000 -999.000 -999.000 -999.000 -999.000 -999.000 -999.000 17 • 1.855 1.619 0.818 3.525 0.875 0.647 2.496 18 • 0.152 0.396 0.118 0.2BO 0.261 0.320 1.031 20 • 3.424 0.255 1.717 0.564 2.250 2.094 1.022 21 • 0.702 4.180 0.224 0.774 1.559 0.220 0.796 22 • 0.251 0.964 1.613 0.076 0.589 0.069 0.055 23 • 0.174 0.335 0.296 0.251 0.054 0.097 0.047 24 • 0.035 0.224 0.292 0.210 0.624 0.230 0.074 25 • 0.590 0.050 0.383 0.270 0.175 0.336 0.164 26 • 0.174 0.318 0.023 0.143 0.109 0.069 0.142 27 • 0.067 0.067 0.105 0.012 0.076 0.047 0.023 28 • 0.004 0.025 0.070 0.046 0.007 0.036 0.019
• 1985 1986 1987 1988 1989 1990 1991 1992 1993******* ---+----------------------------------------------------------------------------1 • 0.098 0.871 0.034 0.700 0.380 0.194 1.068 0.123 0.017 0.491 2 • 2.633 0.423 1.612 0.684 1.334 0.926 0.511 1.255 0.398 1.333 3 • 0.757 1.824 0.403 3.115 0.743 1.707 0.807 0.470 1.347 1.732 4 • 1.058 0.360 0.752 0.413 1.532 0.653 0.883 0.163 0.222 0.876 5 • 1.328 0.545 0.060 0.645 0.228 0.896 0.465 0.270 0.107 0.602 6 • 0.270 0.633 0.179 0.045 0.344 0.125 0.336 0.144 0.120 0.307 7 • 0.203 0.063 0.147 0.020 0.051 0.139 0.039 0.161 0.037 0.169 8 • 0.172 0.119 0.016 0.052 0.040 0.013 0.040 0.020 0.037 0.076 9 • -999.000 0.600 0.250 0.280 1.640 0.420 1.180 0.110 0.050 0.566
10 • -999.000 2.270 2.130 1.010 2.780 2.440 1.150 2.860 0.600 1.905 11 • -999.000 2.810 0.930 4.660 1.380 3.780 1.830 1. 770 2.830 2.499 12 • -999.000 0.370 1.090 0.580 2.840 2.080 2.130 0.800 1.040 1.366 13. -999.000 0.650 0.340 1.020 0.360 3.870 1.030 0.980 0.620 1.109 14 • -999.000 0.440 0.120 0.130 0.420 0.420 1.290 0.600 1.230 0.581 15 • -999.000 0.260 0.220 0.080 0.050 0.930 0.150 0.430 0.440 0.320 16 • -999.000 0.040 0.080 0.170 0.100 0.120 0.220 0.120 0.420 0.159 17 • 0.220 2.280 0.414 0.903 2.738 0.362 0.415 0.454 1.229 1.303 18 • 0.186 1.084 0.096 0.204 0.549 0.262 0.156 0.040 0.033 0.323 20 • 0.101 0.803 0.153 1.353 0.433 1.030 1.534 0.168 1.024 1.120 21 • 0.886 0.103 0.382 0.112 0.909 0.183 1.164 0.277 0.180 0.791 22 • 0.870 0.115 0.010 0.195 0.091 0.499 0.209 0.028 0.112 0.359 23 • 0.017 0.101 0.061 0.028 0.178 0.055 0.145 0.029 0.030 0.119 24 • 0.237 0.065 0.260 0.062 0.087 0.244 0.051 0.123 -999.000 0.188 25 • 0.082 0.195 0.045 0.240 0.122 0.158 0.110 0.056 -999.000 0.198 26 • 0.041 0.024 0.063 0.038 0.131 0.055 0.084 0.027 -999.000 0.096 27 • 0.057 0.017 0.008 0.047 0.009 0.060 0.034 0.036 -999.000 0.044 28 • 0.011 0.022 0.008 0.007 0.014 0.005 0.023 0.008 -999.000 0.020

Page 42
SUMMARY OF WEIGHTING USED IN THE OBJECTIVE FUNCTION
EXOGENOUS WEIGHTS BY INDEX AND YR (omega)
• 1978 1979 1980 1981 1982 1983 1984 1985 1986 1987 ---+--------------------------------------------------------------------------1 • 1.00 1.00 1.00 1.00 1.00 1.00 1.00 1.00 1.00 1.00 2 • 1.00 1.00 1.00 1.00 1.00 1.00 1.00 1.00 1.00 1.00 3 • 1.00 1.00 1.00 1.00 1.00 1.00 1.00 1.00 1.00 1.00 4 • 1.00 1.00 1.00 1.00 1.00 1.00 1.00 1.00 1.00 1.00 5 • 1.00 1.00 1.00 1.00 1.00 1.00 1.00 1.001.001.00 6 • 1.00 1.00 1.00 1.00 1.00 1.00 1.00 1.001.001.00 7 • 1.00 1.00 1.00 1.00 1.00 1.00 1.00 1.00 1.00 1.00 8 • 1.00 1.00 1.00 1.00 1.00 1.00 ·99.00 1.00 1.00 1.00 9 • -99.00 -99.00 -99.00 -99.00 -99.00 -99.00 -99.00 -99.00 1.00 1.00
10 • -99.00 -99.00 -99.00 -99.00 -99.00 -99.00 -99.00 -99.00 1.00 1.00 11 • -99.00 -99.00 -99.00 -99.00 -99.00 -99.00 -99.00 -99.00 1.00 1.00 12 • -99.00 -99.00 -99.00 -99.00 -99.00 -99.00 -99.00 -99.00 1.00 1.00 13 • -99.00 -99.00 -99.00 -99.00 -99.00 -99.00 -99.00 -99.00 1.00 1.00 14 • -99.00 -99.00 -99.00 -99.00 -99.00 -99.00 -99.00 -99.00 1.00 1.00 15 • -99.00 -99.00 -99.00 -99.00 -99.00 -99.00 -99.00 -99.00 1.00 1.00 16 • -99.00 -99.00 -99.00 -99.00 -99.00 -99.00 -99.00 -99.00 1.00 1.00 17 • 1.00 1.00 1.00 1.00 1.00 1.00 1.00 1.00 1.00 1.00 18 • 1.00 1.00 1.00 1.00 1.00 1.00 1.00 1.00 1.00 1.00 20 • 1.00 1.00 1.00 1.00 1.00 1.00 1.00 1.00 1.00 1.00 21 • 1.00 1.00 1.00 1.00 1.00 1.00 1.00 1.00 1.00 1.00 22 • 1.00 1.00 1.00 1.00 1.00 1.00 1.00 1.00 1.00 1.00 23 • 1.00 1.00 1.00 1.00 1.00 1.00 1.00 1.00 1.00 1.00 24 • 1.00 1.00 1.00 1.00 1.00 1.00 1.00 1.00 1.00 1.00 25 • 1.00 1.00 1.00 1.00 1.00 1.00 1.00 1.00 1.00 1.00 26 • 1.00 1.00 1.00 1.00 1.00 1.00 1.00 1.00 1.00 1.00 27 • 1.00 1.00 1.00 1.00 1.00 1.00 1.00 1.001.001.00 28 • 1.00 1.00 1.00 1.00 1.00 1.00 1.00 1.00 1.00 1.00
• 1988 1989 1990 1991 1992 1993 ---+---------------------------------1 • 1.00 1.00 1.00 1.00 1.00 1.00 2 = 1.00 1.00 1.00 1.00 1.00 1.00 3. 1.00 1.00 1.00 1.00 1.00 1.00 4.1.00 1.00 1.00 1.00 1.00 1.00 5 • 1.00 1.00 1.00 1.00 1.00 1.00 6 • 1.00 1.00 1.00 1.00 1.00 1.00 7 • 1.00 1.00 1.00 1.00 1.00 1.00 8 • 1.00 1.00 1.00 1.00 1.00 1.00 9 • 1.00 1.00 1.00 1.00 1.00 1.00
10 • 1.00 1.00 1.00 1.00 1.00 1.00 11 • 1.00 1.00 1.00 1.00 1.00 1.00 12.1.00 1.00 1.00 1.00 1.00 1.00 13 • 1.00 1.00 1.00 1.00 1.00 1.00 14.1.00 1.00 1.00 1.00 1.00 1.00 15.1.001.001.001.001.00 1.00 16 • 1.00 1.00 1.00 1.00 1.00 1.00 17.1.001.001.001.001.00 1.00 18. 1.00 1.00 1.00 1.00 1.00 1.00 20. 1.00 1.00 1.00 1.00 1.00 1.00 21 • 1.00 1.00 1.00 1.00 1.00 1.00 22 • 1.00 1.00 1.00 1.00 1.00 1.00 23 • 1.00 1.00 1.00 1.00 1.00 1.00 24 • 1.00 1.00 1.00 1.00 1.00 -99.00 25 • 1.00 1.00 1.00 1.00 1.00 -99.00 26.1.00 1.00 1.00 1.00 1.00 -99.00 27.1.001.00 1.00 1.00 1.00 -99.00 28.1.001.001.00 1.00 1.00 -99.00
Negative weights in the above table indicate missing values
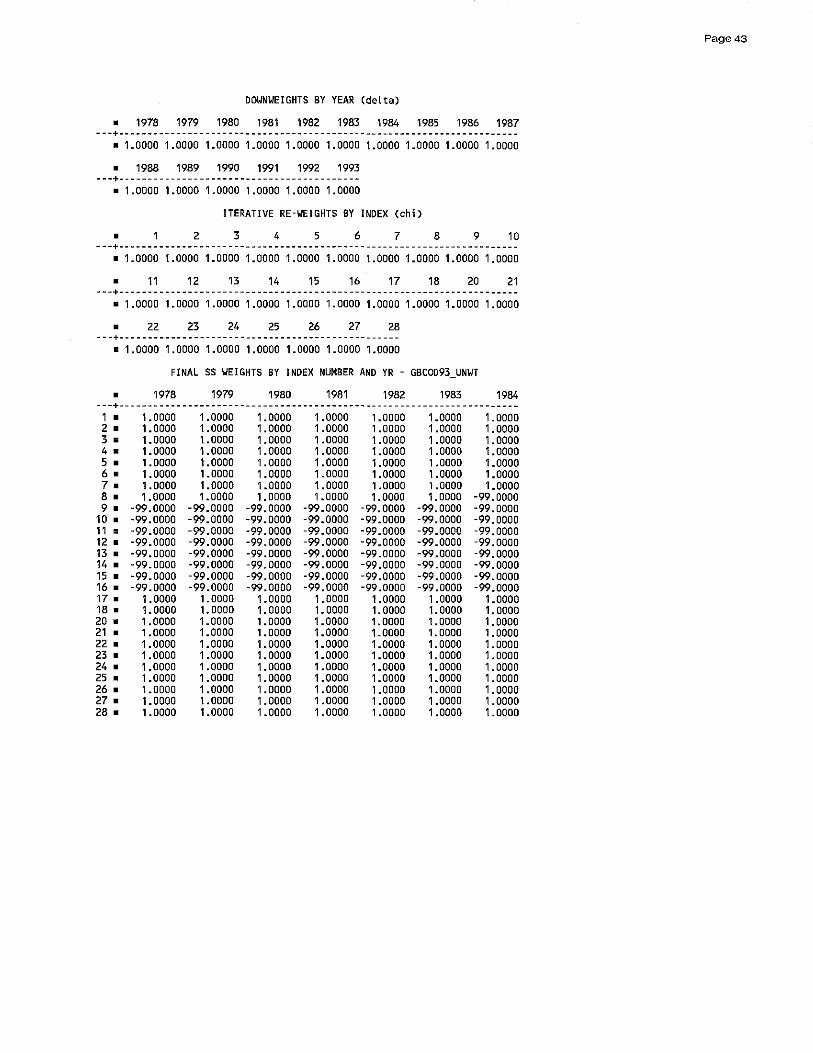
Page 43
DOWNWEIGHTS BY YEAR (deLta)
• 1978 1979 1980 1981 1982 1983 1984 1985 1986 1987 ---+----------------------------------------------------------------------
• 1.0000 1.0000 1.0000 1.0000 1.0000 1.0000 1.0000 1.0000 1.0000 1.0000
• 1988 1989 1990 1991 1992 1993 ---+------------------------------------------
• 1.0000 1.0000 1.0000 1.0000 1.0000 1.0000
ITERATIVE RE·WEIGHTS BY INDEX (chi)
• 2 3 4 5 6 7 8 9 10 ---+----------------------------------------------------------------------
• 1.0000 1.0000 1.0000 1.0000 1.0000 1.0000 1.0000 1.0000 1.0000 1.0000
• 11 12 13 14 15 16 17 18 20 21 ---+----------------------------------------------------------------------
• 1.0000 1.0000 1.0000 1.0000 1.0000 1.0000 1.0000 1.0000 1.0000 1.0000
• 22 23 24 25 26 27 28 ---+-------------------------------------------------
• 1.0000 1.0000 1.0000 1.0000 1.0000 1.0000 1.0000
FINAL SS WEIGHTS BY INDEX NUMBER AND YR . GBCOD93_UNWT
• 1978 1979 1980 1981 1982 1983 1984 ---+----------------------------------------------------------------------1 • 1.0000 1.0000 1.0000 1.0000 1.0000 1.0000 1.0000 2 • 1.0000 1.0000 1.0000 1.0000 1. 0000 1 .0000 1.0000 3 • 1.0000 1.0000 1.0000 1.0000 1.0000 1.0000 1.0000 4 • 1.0000 1.0000 1.0000 1.0000 1.0000 1.0000 1.0000 5 • 1.0000 1.0000 1.0000 1 .0000 1.0000 1.0000 1.0000 6 • 1.0000 1.0000 1.0000 1.0000 1.0000 1.0000 1.0000 7. 1.0000 1.0000 1.0000 1.0000 1.0000 1.0000 1.0000 8 • 1.0000 1.0000 1.0000 1.0000 1.0000 1.0000 ·99.0000 9 • ·99.0000 ·99.0000 ·99.0000 ·99.0000 ·99.0000 ·99.0000 ·99.0000
10 • ·99.0000 ·99.0000 ·99.0000 ·99.0000 ·99.0000 ·99.0000 ·99.0000 11 • ·99.0000 ·99.0000 ·99.0000 ·99.0000 ·99.0000 ·99.0000 ·99.0000 12 • ·99.0000 ·99.0000 ·99.0000 ·99.0000 ·99.0000 ·99.0000 ·99.0000 13 • ·99.0000 ·99.0000 ·99.0000 ·99.0000 ·99.0000 ·99.0000 ·99.0000 14 • ·99.0000 ·99.0000 ·99.0000 ·99.0000 ·99.0000 ·99.0000 ·99.0000 15 • -99.0000 -99.0000 ·99.0000 -99.0000 -99.0000 -99.0000 ·99.0000 16 • ·99.0000 -99.0000 ·99.0000 -99.0000 -99.0000 -99.0000 ·99.0000 17 • 1.0000 1.0000 1.0000 1.0000 1.0000 1.0000 1.0000 18 • 1.0000 1. 0000 1.0000 1. 0000 1. 0000 1. 0000 1. 0000 20 • 1.0000 1.0000 1.0000 1.0000 1.0000 1.0000 1.0000 21 • 1.0000 1.0000 1.0000 1.0000 1.0000 1.0000 1.0000 22 • 1.0000 1.0000 1.0000 1.0000 1.0000 1.0000 1.0000 23 • 1.0000 1.0000 1.0000 1.0000 1.0000 1.0000 1.0000 24 • 1.0000 1.0000 1.0000 1.0000 1.0000 1.0000 1.0000 25 • 1.0000 1.0000 1.0000 1.0000 1.0000 1.0000 1 .0000 26 • 1.0000 1.0000 1.0000 1.0000 1.0000 1.0000 1.0000 27 • 1.0000 1.0000 1.0000 1.0000 1.0000 1.0000 1.0000 2B • 1.0000 1.0000 1.0000 1.0000 1.0000 1.0000 1.0000

Page 44
• 1985 1986 1987 1988 1989 1990 1991 1992 1993 ---+---------------------------------------------------------------------1. 1.00001.00001.00001.0000 1.0000 1.0000 1.0000 1.0000 2. 1.00001.00001.00001.0000 1.0000 1.0000 1.0000 1.0000 3. 1.00001.00001.0000 1.0000 1.0000 1.0000 1.0000 1.0000 4 • 1.0000 1.0000 1.0000 1.0000 1.0000 1.0000 1.0000 1.0000 5. 1.00001.00001.0000 1.0000 1.0000 1.0000 1.0000 1.0000 6. 1.00001.00001.00001.00001.00001.00001.00001.0000 7. 1.00001.00001.00001.00001.00001.00001.00001.0000 8. 1.00001.00001.00001.00001.00001.00001.00001.0000 9. -99.00001.00001.00001.00001.00001.00001.00001.0000
10. -99.0000 1.0000 1.0000 1.0000 1.0000 1.0000 1.0000 1.0000 11. -99.00001.00001.00001.00001.00001.0000 1.0000 1.0000 12. -99.00001.00001.00001.00001.00001.0000 1.0000 1.0000 13. -99.00001.00001.00001.00001.00001.0000 1.0000 1.0000 14. -99.00001.00001.00001.00001.00001.0000 1.0000 1.0000 15. -99.00001.00001.0000 1.0000 1.0000 1.0000 1.0000 1.0000 16. -99.00001.00001.0000 1.0000 1.0000 1.0000 1.0000 1.0000 17. 1.00001.00001.0000 1.0000 1.0000 1.0000 1.0000 1.0000 18. 1.00001.0000 1.0000 1.0000 1.0000 1.0000 1.0000 1.0000 20. 1.00001.0000 1.0000 1.0000 1.0000 1.0000 1.0000 1.0000 21. 1.00001.00001.00001.00001.00001.00001.00001.0000 22. 1.00001.00001.00001.00001.00001.00001.00001.0000 23. 1.00001.00001.00001.00001.00001.00001.00001.0000 24. 1.00001.00001.00001.00001.00001.00001.00001.0000 25. 1.0000 1.0000 1.0000 1.0000 1.0000 1.0000 1.0000 1.0000 26. 1.00001.00001.00001.00001.00001.0000 1.0000 1.0000 27. 1.00001.00001.00001.00001.00001.0000 1.0000 1.0000 28. 1.00001.00001.0000 1.0000 1.0000 1.0000 1.0000 1.0000
Negative weights in the above table indicate missing values
1.0000 1.0000 1.0000 1.0000 1.0000 1.0000 1.0000 1.0000 1 .0000 1 .0000 1.0000 1.0000 1.0000 1.0000 1.0000 1.0000 1.0000 1.0000 1.0000 1.0000 1.0000 1.0000
-99.0000 -99.0000 -99.0000 -99.0000 -99.0000
CATCH AT AGE (thousands) - GBCOD93_UNWT
• 1978 1979 1980 1981 1982 1983 1984 1985 1986 ---+-------------------------------------------------------------------------------------------------1 • 2.000 34.000 89.000 27.000 331.000 108.000 81.000 134.000 156.000 2 • 393.000 1989.000 3777.000 3205.000 9138.000 4286.000 1307.000 6426.000 1326.000 3 • 7748.000 900.000 5828.000 4221.000 3824.000 8063.000 3423.000 2443.000 4573.000 4 • 2303.000 4870.000 500.000 2464.000 2787.000 2456.000 3336.000 1368.000 797.000 5 • 830.000 1212.000 2308.000 235.000 2000.000 1055.000 840.000 1885.000 480.000 6 • 131.000 458.000 1076.000 1406.000 281.000 776.000 516.000 412.000 627.000 7 • 345.000 77.000 445.000 417.000 673.000 95.000 458.000 218.000 87.000 8 • 47.000 253.000 87.000 123.000 213.000 235.000 44.000 203.000 72.000 9 • 40.000 4.000 167.000 130.000 71.000 100.000 171.000 21.000 47.000
10 • 15.000 48.000 10.000 62.000 83.000 65.000 121.000 97.000 29.000 ---+-------------------------------------------------------------------------------------------------1+. 11854.000 9845.000 14287.000 12290.000 19401.000 17239.000 10297.000 13207.000 8194.000
• 1987 1988 1989 1990 1991 1992 ---+-----------------------------------------------------------------1 • 26.000 10.000 0.001 7.000 52.000 70.000 2 • 7473.000 1577.000 2088.000 4942.000 1525.000 4177.000 3 • 1406.000 8022.000 2922.000 5042.000 3243.000 2170.000 4 • 2121.000 1012.000 4155.000 1882.000 3281.000 1038.000 5 • 279.000 1497.000 331.000 2264.000 1458.000 1482.000 6 • 252.000 244.000 541.000 229.000 1088.000 404.000 7 • 270.000 161.000 82.000 245.000 126.000 309.000 8 • 63.000 197.000 43.000 36.000 70.000 34.000 9 • 38.000 50.000 50.000 17.000 23.000 33.000
10 • 24.000 47.000 18.000 38.000 23.000 10.000 ---+-----------------------------------------------------------------1+. 11952.000 12817.000 10230.001 14702.000 10889.000 9727.000
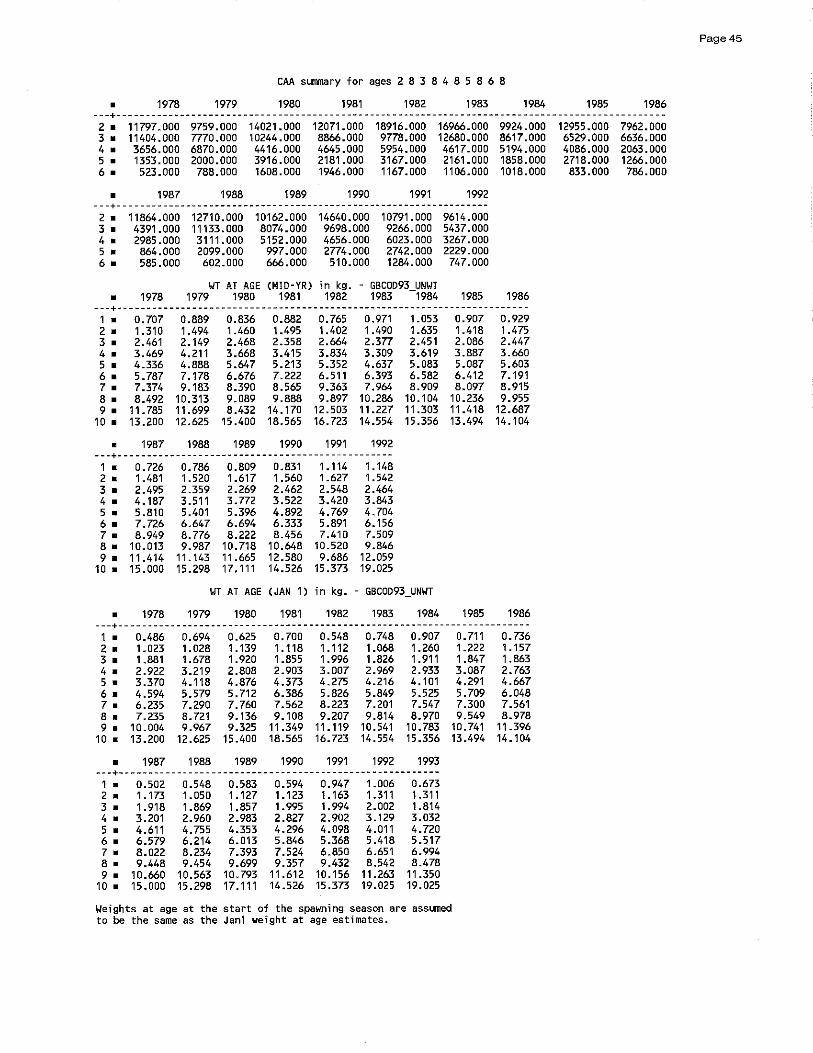
CAA summary for ages 2 8 3 8 4 8 5 8 6 8
• 1978 1979 1980 1981 1982 1983 1984 1985 1986 ---+------------------------------------------------------------------------------------------------2 • 11797"000 9759"000 14021.000 12071.000 18916"000 16966"000 9924"000 3 • 11404"000 7770"000 10244"000 8866"000 9778"000 12680"000 8617"000 4 • 3656"000 6870"000 4416"000 4645"000 5954"000 4617"000 5194"000 5 • 1353"000 2000"000 3916"000 2181"000 3167"000 2161.000 1858"000 6 • 523"000 788"000 1608"000 1946"000 1167"000 1106"000 1018"000
• 1987 1988 1989 1990 1991 1992 ---+-----------------------------------------------------------------2 • 11864"000 12710"000 10162"000 14640"000 10791"000 9614"000 3 • 4391.000 11133"000 8074"000 9698"000 9266"000 5437"000 4 • 2985"000 3111 "000 5152"000 4656"000 6023"000 3267"000 5 • 864"000 2099"000 997"000 2774"000 2742"000 2229"000 6 • 585"000 602"000 666"000 510"000 1284"000 747"000
WT AT AGE (MID"YR) in kg. - GBCOD93 _ UNWT • 1978 1979 1980 1981 1982 1983 1984 1985 19B6
---+------------------------------------------------------------------------1 • 0"707 0"889 0"836 0"882 0"765 0"971 1.053 0"907 0"929 2 • 1 "310 1.494 1 "460 1.495 1.402 1"490 1.635 1 "41B 1.475 3 • 2"461 2" 149 2"468 2"358 2"664 2"377 2"451 2"086 2"447 4 • 3"469 4"211 3"668 3"415 3"834 3"309 3"619 3"887 3"660 5 • 4"336 4"888 5"647 5"213 5"352 4"637 5"083 5"087 5"603 6 • 5"787 7" 178 6"676 7"222 6"511 6"393 6"582 6"412 7" 191 7 • 7"374 9" 183 8"390 8"565 9"363 7"964 8"909 8"097 8"915 8 • 8"492 10"313 9"089 9"888 9"897 10"286 10" 104 10"236 9"955 9 • 11.785 11.699 8"432 14" 170 12"503 11.227 11.303 11.418 12"687
10 • 13" 200 12"625 15"400 18"565 16"723 14"554 15"356 13"494 14" 104
• 1987 1988 1989 1990 1991 1992 ---+-------------------------------------_ .. _--------1 • 0.726 0.786 0"809 0"831 1. 114 1" 148 2 • 1 "481 1.520 1.617 1.560 1.627 1.542 3 • 2"495 2"359 2"269 2"462 2"548 2"464 4 • 4" 187 3"511 3"772 3"522 3"420 3"843 5 • 5"810 5"401 5"396 4"892 4"769 4.704 6 • 7.726 6"647 6"694 6.333 5"891 6"156 7 • 8"949 8"776 8"222 8"456 7"410 7"509 8 • 10"013 9"987 10"718 10"648 10"520 9"846 9 • 11.414 11.143 11.665 12.580 9"686 12"059
10 • 15"000 15"298 17"111 14"526 15"373 19"025
WT AT AGE (JAN 1) in kg. - GBCOD93_UNWT
• 1978 1979 1980 1981 1982 1983 1984 1985 1986 ---+------------------------------------------------------------------------1 • 0"486 0"694 0"625 0"700 0"548 0.748 0"907 2 • 1.023 1.028 1" 139 1.118 1.112 1.068 1.260 3 • 1"881 1.678 1.920 1.855 1.996 1.826 1.911 4 • 2"922 3"219 2"808 2"903 3"007 2"969 2"933 5 • 3"370 4" 118 4"876 4"373 4"275 4"216 4" 101 6 • 4"594 5"579 5"712 6"386 5"826 5"849 5"525 7 • 6"235 7"290 7"760 7"562 8"223 7"201 7"547 8 • 7"235 8"721 9"136 9" 108 9"207 9"814 8"970 9 • 10"004 9"967 9"325 11 "349 11.119 10"541 10"783
10 • 13"200 12"625 15"400 18"565 16"723 14"554 15"356
• 1987 1988 1989 1990 1991 1992 1993 ---+--------------------------------------------------------1. 0"502 0"548 0"583 0"594 0"947 1"006 0"673 2. 1.173 1"050 1.127 1.123 1.163 1.311 1.311 3. 1"918 1"869 1"857 1"995 1"994 2"002 1"814 4. 3"201 2"960 2"983 2"827 2"902 3"129 3"032 5. 4"611 4"755 4"353 4"296 4"098 4"011 4"720 6. 6"579 6"214 6"013 5"846 5"368 5"418 5"517 7. 8"022 8"234 7"393 7"524 6"850 6"651 6"994 8. 9"448 9"454 9"699 9"357 9"432 8"542 8"478 9. 10"660 10"563 10.793 11.612 10"156 11.263 11.350
10. 15"000 15"298 17"111 14"526 15"373 19"025 19"025
Weights at age at the start of the spawning season are assumed to be the same as the Jan1 weight at age estimates.
0.711 0"736 1.222 1.157 1 "847 1.863 3"087 2.763 4"291 4"667 5"709 6"048 7"300 7"561 9"549 8"978
10"741 11.396 13"494 14" 104
12955"000 7962"000 6529"000 6636"000 4086"000 2063"000 2718"000 1266"000 833"000 786"000
Page 45

Page 46
PERCENT MATURE (females) - GBCOD93_UNWT
• 1978 1979 1980 1981 1982 1983 1984 1985 1986 1987 1988 1989 1990 1991 1992 ---+---------------------------------------------------------------------------1. 7 7 7 7 13 13 13 13 23 23 23 23 23 23 23 2. 34 34 34 34 47 47 47 47 64 64 64 64 64 64 64 3. 78 78 78 78 84 84 84 84 91 91 91 91 91 91 91 4. % % % % ~ ~ ~ ~ ~ ~ ~ ~ ~ ~ ~ 5. 100 100 100 100 100 100 100 100 100 100 100 100 100 100 100 6. 100 100 100 100 100 100 100 100 100 100 100 100 100 100 100 7. 100 100 100 100 100 100 100 100 100 100 100 100 100 100 100 8. 100 100 100 100 100 100 100 100 100 100 100 100 100 100 100 9. 100 100 100 100 100 100 100 100 100 100 100 100 100 100 100
10. 100 100 100 100 100 100 100 100 100 100 100 100 100 100 100
SEX RATIO (Percent Female) - GBCOD93_UNWT
• 1978 1979 1980 1981 1982 1983 1984 1985 1986 1987 1988 1989 1990 1991 1992 ---+---------------------------------------------------------------------------1. 50 50 50 50 50 50 50 50 50 50 50 50 50 50 50 2. 50 50 50 50 50 50 50 50 50 50 50 50 50 50 50 3. 50 50 50 50 50 50 50 50 50 50 50 50 50 50 50 4. 50 50 50 50 50 50 50 50 50 50 50 50 50 50 50 5. 50 50 50 50 50 50 50 50 50 50 50 ~ 50 50 50 6. 50 50 50 50 50 50 50 50 50 50 50 50 50 50 50 7. 50 50 50 50 50 50 50 50 50 50 50 50 50 50 50 8. 50 50 50 50 50 50 50 50 50 50 50 50 50 50 50 9. 50 50 50 50 50 50 50 50 50 50 50 50 50 50 50
10. 50 50 50 50 50 50 50 50 50 50 50 50 50 50 50

BEGIN MARQUARDT ALGORITHM
LAMBDA RSS NPHI
1.0DOODE-2 8.4497DE2 8.44970E2
par 2.00000E3
ODOOOE3 .OOOOOE-4 1.0000DE-4
1.00000E-4
4.000DOE3 1.00000E3
1.00000E-4 1.00000E-4
1.00000E-4
5.00DOOE3 1.00000E-4
1.00000E-4 1.00000E-4
1.00000E-4
2. 1
9.00000E3 2.00000E3
1.00000E-4 1.00000E-4
1.00000E-4 1.00000E-4
1.00000E-4 1.00000E-4
1.0DOOOE-4 1.00000E-4
1.00000E-4
2.DOOOOE3 1.00000E-4
1.00000E-4 1.00000E-4
1.00000E-4 1.00000E-4
1.00000E-4 1.00000E-4
1.00000E-4
LAM BOA RSS NPHI
1.00000E-1 7.20276E2 7.20276E2
par 2.D8593E3
78318E3 .73223E-5 1.33793E-4
1.145D2E-4
1.91966E3 9.45949E-5
1.25183E-4 1.07895E-4
9.25182E-5
1 . 9
9.14719E-5 9.58264E-5
8.31616E3 1.62896E3
1.05268E-4 9.28037E-5
1.21979E-4 9.62579E-5
1.01448E-4
4.42305E3 8.94103E2
1.11357E-4 9.74241E-5
1.29671E-4 1.02354E-4 1.07846E-4
4.58470E3 8.89951E-5
1.18478E-4 9.99844E-5
1.39257E-4 1.06986E-4
1.15419E-4 1.18414E-4 1.22137E-4
LAMBOA RSS NPHI
1.00000EO 6.17141E2 6.17141E2
par 2. 16758E3
61731E3 .49087E-5 1.74536E-4
4.24885E3 8.02172E-5
1.38029E-4 9.97873E-5
1. 9
1.29095E-4 8.44451E-5 9.21644E-5
7.76299E3 1.35857E3
1.10095E-4 8.667D2E-5
1.45847E-4 9.29607E-5
1.02636E-4
4.84088E3 8.13809E2
1.22536E-4 9.49758E-5
1.64201E-4 1.04377E-4
1.15269E-4
1.85519E3 8.99425E-5
1.53505E-4 1.15264E-4 8.62658E-5 1. 88483E-4
1.13517E-4 1.31249E-4
1.37887E-4 1.46372E-4
LAMBDA RSS NPHI
1.00000E1 5.37943E2 5.37943E2
par 2. 23077E3
53220E3 .27857E-5 2.18041E-4
4.00778E3 7.35814E-5
1.56241E-4 9.92634E-5
2.42329E-4
1.82730E3 8.61157E-5
1.81677E-4 1.21008E-4 8.13224E-5
1. 9
1.41642E-4 7.89666E-5
8.90734E-5
7.32104E3 1.20144E3
1.13892E-4 8.16925E-5
1.68058E-4 9.01570E-5
1.03312E-4
5.21047E3 7.84640E2
1.32203E-4 9.26420E-5
1.98999E-4 1.05717E-4 1.21399E-4
1. 18749E-4 1.45599E-4
1.56013E-4 1.69895E-4
LAMBDA RSS NPHI
par
1.00000EO 2.88113E2 2.88113E2
2.27719E3 78215E3
4.49635E3 1.03602E3
1.29425E-4 5.70371E-5
2.75961E-4
6.72052E3 2.98653E3 4.26207E-5
2.50030E-4 9.45511E-5
5.63904E-4
2.04846E3 6.63992E-5
1 . 8
• 13749E-5 4.78754E-4
1.98305E-4 5.27260E-5
7.29992E-5 7.55687E-5
1.03479E-4
1. 22492E3 1.78575E-4 7.83095E-5 3.85921E-4
1.08671E-4 1.49123E-4
1.40825E-4 2.18041E-4
3. 37784E-4 1.42629E-4 5.73565E-5
2.49285E-4 2.97721E-4
Page 47

Page 48
LAMBDA RSS NPHI
1.DOOOOE1 2.61317E2 2.61317E2
par 2.34354E3
65713E3 .07097E·5 5.54498E·4 2.10146E·4
4.48122E3 9. 29489E2
1.32078E·4 5.58909E·5 3.02700E·4
7.02987E3 1. 12412E3 1.86680E·4 7.77439E·5 4.38883E·4
2.91021E3 4.15400E-5
2.69817E-4 9.45428E-5 6.69727E·4
1.99339E3 6.54072E·5 3.76013E-4
1 . 8
5.15525E·5 7.21011E·5
7.47301E·5 1.04139E·4
1.09752E·4 1.53657E·4
1.44669E·4 2.32022E-4
1.47177E-4 5.61849E·5
2.68937E·4 3.26683E·4
LAMBDA RSS NPHI
1.00000EO 1. 79157E2 1. 79157E2
par 2.59005E3
52642E3 .64082E·5 9.65812E·4 2.56748E·4
4.26197E3 7.48399E2 1.41647E·4 4.97657E·5 4.17353E·4
8.46341E3 1.15232E3 2.21688E·4 7.33753E·5 6.92329E·4
2.70232E3 3.60417E·5 3.62123E-4 9.22718E·5
1.98309E3 5.98244E-5 5.68416E-4
1. 7
4.55254E·5 6.67564E·5
6.96569E·5 1.04799E·4
1.11907E·4 1. 71854E·4
1.23517E·3 1.58680E-4 2.96143E-4
1.62044E-4 5.01292E-5 3.60529E-4 4.70098E-4
LAMBDA RSS NPHI
par
1.00000E·1 1.38375E2 1.38375E2
4.39040E3 1.35532E2 1.59305E·4 4.55522E·5
1.05732E4 1.48303E2 2.79190E·4 7.20699E·5
2.21726E3 3.22745E-5 5.29236E·4 9.40931E-5
1.44106E3 5.64349E-5 9.48316E-4
5. 7
3.08381E3 71850E2 .44930E·5 1.88414E·3 3.51078E·4
4.13117E·5 6.38883E·5
6.71008E·4 6.70515E·5
1.10390E·4
1.28951E·3 1.20274E·4 2.02149E·4
2.69121E-3 1.85191E·4 4.04471E·4
1.95524E-4 4.58504E-5 5.26279E-4 7.34953E-4
LAMBDA RSS NPHI
1.00000E·2 1.21685E2 1.21685E2
par 3.23088E3
17921E2 .43608E·5 2.63005E·3 3.87215E·4
1.11271E4 2.74180E2 2.95900E·4 7.17158E-5
2.08092E3 3.20234E·5
6.00296E·4 9.43627E·5 4.18890E-3
1.29436E3 5.61259E-5
1.16758E-3 2.05703E-4 4.54847E·5
7. 7
4.45428E3 2.58264E2 1.63388E·4 4.50253E·5 8.10813E·4 6.68812E·5
1.11558E·4 4.09831E·5 6.36624E·5
1. 73560E-3 1.22252E·4 2.09135E-4
1.91684E·4 4.41024E·4
5.96568E·4 8.65069E·4
LAMBDA RSS NPHI
1.00000E·3 1.21167E2 1.21167E2
par 3.24135E3
21127E2 .42522E·5 2.80694E·3 3.87861E·4
4.46371E3 2.89257E2
1.63127E·4 4.48977E·5 8.23317E·4
1.11662E4 3.25726E2 2.95906E·4 7.15310E·5
2.10846E3 3.19763E·5 6.04193E-4 9.40995E·5
1.29848E3 5.60511E-5
1.20139E·3 2.05211E·4 4.54178E-5
7. 7
4.09228E·5 6.35725E·5
6.67834E·5 1.11376E·4
1.83943E·3 1.22028E·4 2.08923E·4
4. 70153E· 3 1.91448E·4 4.41759E-4
6.00388E-4 8.76712E-4
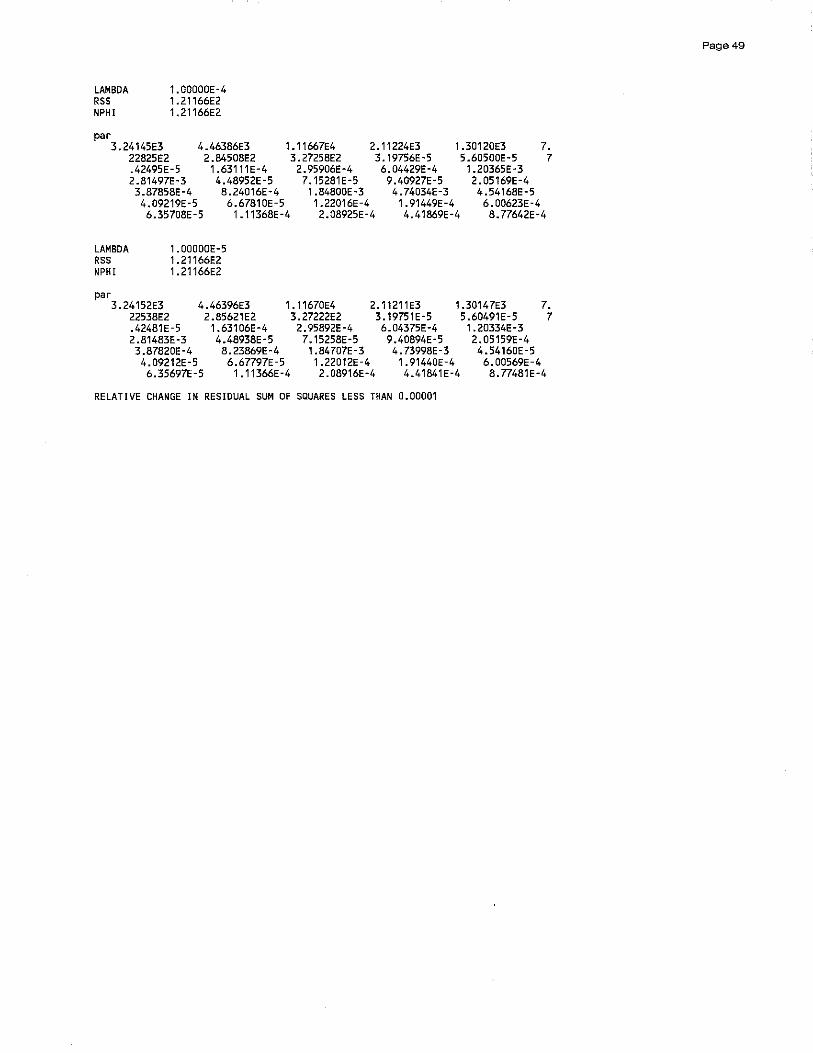
LAMBDA RSS NPHI
1.00000E-4 1. 21166E2 1.21166E2
par 3_24145E3
22825E2 _42495E-5 2_81497E-3 3_87858E-4
4_46386E3 2_84508E2
1.63111E-4 4_48952E-5 8_24016E-4
2_11224E3 3_19756E-5 6_04429E-4 9_40927E-5 4J4D34E-3
1_30120E3 5_60500E-5
1.20365E-3 2_05169E-4 4_54168E-5
7_ 7
4_09219E-5 6_35708E-5
1.11667E4 3_27258E2
2_95906E-4 7_15281E-5
1_84800E-3 1.22016E-4 2_08925E-4
6_6781DE-5 1.11368E-4
1_91449E-4 4_41869E-4
6_00623E-4 8J7642E-4
LAMBDA RSS NPHI
1_000DDE-5 1.21166E2 1.21166E2
par 3_24152E3
22538E2 _42481E-5 2_81483E-3 3_87820E-4
4_46396E3 2_85621E2
1.63106E-4 4_48938E-5 8_23869E-4
1_11670E4 3_27222E2 2_95892E-4 7_15258E-5
2_11211E3 3_19751E-5 6_04375E-4 9_40894E-5 4_73998E-3
1.30147E3 5_60491E-5
1_20334E-3 2_05159E-4 4_54160E-5
7_ 7
4_09212E-5 6_35697E-5
6_67797E-5 1_11366E-4
1.84707E-3 1_22012E-4 2_08916E-4
1.91440E-4 4_41841E-4
6_00569E-4 8J7481E-4
RELATIVE CHANGE IN RESIDUAL SUM OF SQUARES LESS THAN 0_00001
Page 49
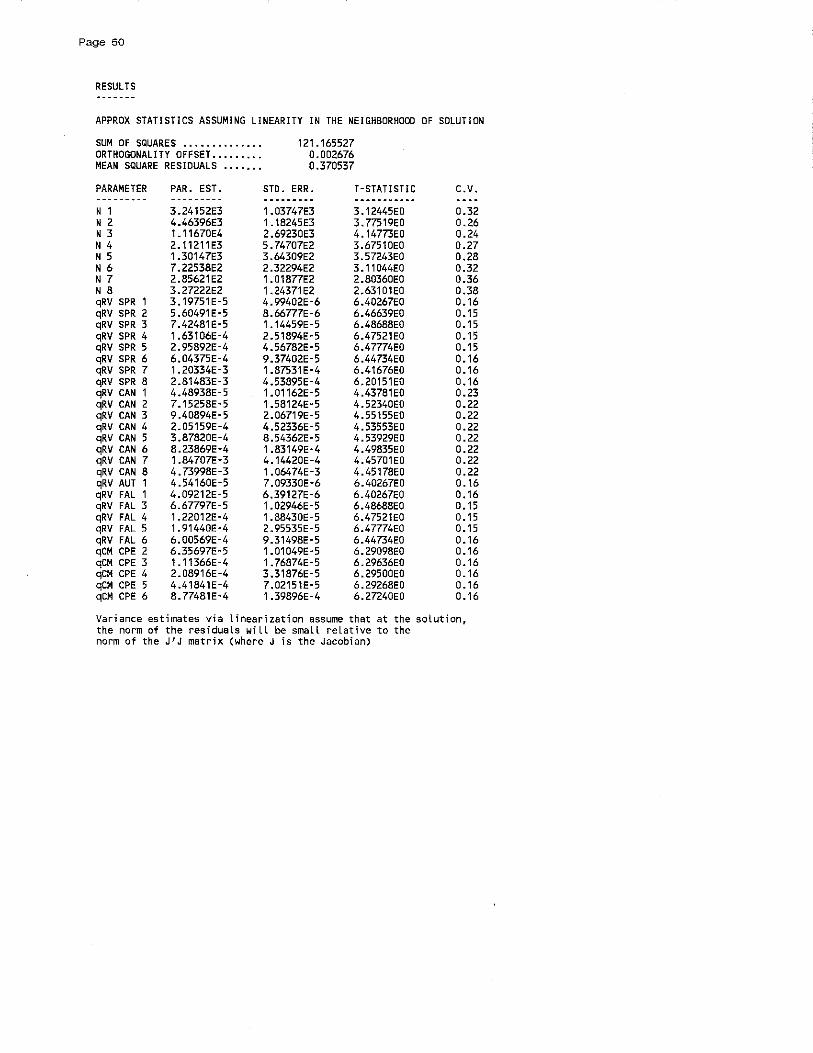
Page 50
RESULTS
APPROX STATISTICS ASSUMING LINEARITY IN THE NEIGHBORHOOD OF SOLUTION
SUM OF SQUARES ...•.......••. 121.165527 ORTHOGONAL! TY OFFSET. .....••• 0.002676 MEAN SQUARE RESIOUALS ....•.. 0.370537
PARAMETER PAR. EST. STD. ERR. T-STATISTIC C.V. --------- --------- --------- -----------N 1 3.24152E3 1.03747E3 3.12445EO 0.32 N 2 4.46396E3 1.18245E3 3.77519EO 0.26 N 3 1. 11670E4 2.69230E3 4.14mEO 0.24 N 4 2.11211E3 5.74707E2 3.67510EO 0.27 N 5 1.30147E3 3.64309E2 3.57243EO 0.28 N 6 7.22538E2 2.32294E2 3.11044EO 0.32 N 7 2.85621E2 1.01877E2 2.80360EO 0.36 N 8 3.27222E2 1.24371E2 2.63101EO 0.38 qRV SPR 1 3.19751E-5 4.99402E-6 6.40267£0 0.16 qRV SPR 2 5.60491E-5 8.66777E-6 6.46639EO 0.15 qRV SPR 3 7.42481E-5 1.14459E-5 6.48688EO 0.15 qRV SPR 4 1.63106E-4 2.51894E-5 6.47521EO 0.15 qRV SPR 5 2.95892E-4 4.56782E-5 6.47774EO 0.15 qRV SPR 6 6.04375E-4 9.37402E-5 6.44734EO 0.16 qRV SPR 7 1.20334E-3 1.87531E-4 6.41676EO 0.16 qRV SPR 8 2.81483E-3 4.53895E-4 6.20151EO 0.16 qRV CAN 1 4.48938E-5 1.01162E-5 4.43781EO 0.23 qRV CAN 2 7.15258E-5 1.58124E-5 4.52340EO 0.22 qRV CAN 3 9.40894E-5 2.06719E-5 4.55155EO 0.22 qRV CAN 4 2.05159E-4 4.52336E-5 4.53553EO 0.22 qRV CAN 5 3.87820E-4 8.54362E-5 4.53929EO 0.22 qRV CAN 6 8.23869E-4 1.83149E-4 4.49835EO 0.22 qRV CAN 7 1.84707E-3 4.14420E-4 4.45701EO 0.22 qRV CAN 8 4.73998E-3 1.06474E-3 4.45178EO 0.22 qRV AUT 1 4.54160E-5 7.09330E-6 6.40267EO 0.16 qRV FAL 1 4.09212E-5 6.39127E-6 6.40267EO 0.16 qRV FAL 3 6.67797E-5 1.02946E-5 6.48688EO 0.15 qRV FAL 4 1.22012E-4 1.88430E-5 6.47521EO 0.15 qRV FAL 5 1.91440E-4 2.95535E-5 6. 47774EO 0.15 qRV FAL 6 6.00569E-4 9.31498E-5 6.44734EO 0.16 qCM CPE 2 6.35697E-5 1.01049E-5 6. 29098EO 0.16 qCM CPE 3 1.11366E-4 1. 76874E-5 6. 29636EO 0.16 qCM CPE 4 2.08916E-4 3.31876E-5 6.29500EO 0.16 qCM CPE 5 4.41841E-4 7.02151E-5 6. 29268EO 0.16 qCM CPE 6 8.77481E-4 1.39896E-4 6.27240EO 0.16
Variance estimates via linearization assume that at the solution, the norm of the residuals will be small relative to the norm of the J'J matrix (where J is the Jacobian)

PARAMETER II residuaLs II norms of the cols of JIJ
N 1 N 2 N 3 N 4 N 5 N 6 N 7 N 8 qRV SPR 1 qRV SPR 2 qRV SPR 3 qRV SPR 4 qRV SPR 5 qRV SPR 6 qRV SPR 7 qRV SPR 8 qRV CAN 1 qRV CAN 2 qRV CAN 3 qRV CAN 4 qRV CAN 5 qRV CAN 6 qRV CAN 7 qRV CAN 8 qRV AUT 1 qRV FAL 1 qRV FAL 3 qRV FAL 4 qRV FAL 5 qRV FAL 6 qCM CPE 2 qCM CPE 3 qCM CPE 4 qCM CPE 5 qCM CPE 6
1.10075E1
Frobenius Norm of J/J is Std NaturaL Norm of J/J is
1.54429E1 1.21470E1 4.35614EO 1.39622E1 1.25714E1 1.04009E1 1. 72373E1 9. 48076EO 1.54943E10 5.04263E9 2.87358E9 5.95460E8 1.80938E8 4.33693E7 1.09399E7 1.87439E6 3.93000E9 1.54824E9 8.94713E8 1.88185E8 5.26628E7 1.16694E7 2.32165E6 3.52542E5 7.68027E9 9.46015E9 3.55227E9 1.06411E9 4.32245E8 4.39207E7 3.67508E9 1.19746E9 3.40269E8 7.60736E7 1.92882E7
2. 168666264E10 1.54942851E10
CATCHABILITY ESTIMATES IN ORIGINAL UNITS
ESTIMATE STO. ERR. C.V. ~--------- ----------
qRV SPR 1 1.57050E·5 2.45289E·6 0.16 qRV SPR 2 7.47134E-5 1.15541E-5 0.15 qRV SPR 3 1.28630E-4 1.98293E-5 0.15 qRV SPR 4 1.42873E-4 2.20647E-5 0.15 qRV SPR 5 1.78032E-4 2.74837E-5 0.15 qRV SPR 6 1.85543E-4 2.87782E-5 0.16 qRV SPR 7 2.02768E-4 3.15997E-5 0.16 qRV SPR 8 2.13242E-4 3.43855E-5 0.16 qRV CAN 1 2.54211E-5 5.72829E-6 0.23 qRV CAN 2 1.36257E-4 3.01226E-5 0.22 qRV CAN 3 2.35106E-4 5.16540E-5 0.22 qRV CAN 4 2.80298E-4 6.18004E-5 0.22 qRV CAN 5 4. 29996E-4 9.47274E-5 0.22 qRV CAN 6 4.78874E-4 1.06455E-4 0.22 qRV CAN 7 5.91064E-4 1.32614E-4 0.22 qRV CAN 8 7.52472E-4 1.69027E-4 0.22 qRV AUT 1 5.91836E-5 9.24358E-6 0.16 qRV FAL 1 1.32178E-5 2.06443E-6 0.16 qRV FAL 3 7.48166E-5 1.15335E-5 0.15 qRV FAL 4 9.64805E-5 1.49000E-5 0.15 qRV FAL 5 6.87517E-5 1.06135E-5 0.15 qRV FAL 6 7. 12786E-5 1.10555E-5 0.16 qCM CPE 2 1. 19363E-5 1.89737E-6 0.16 qCM CPE 3 2.21025E-5 3.51035E-6 0.16 qCM CPE 4 2.00683E-5 3.18797E-6 0.16 qCM CPE 5 1.95426E-5 3.10561E-6 0.16 qCM CPE 6 1.79303E-5 2.85860E-6 0.16
QUotient
7.12790E-1 9.06194E-1 2.52690EO 7.88381E-1 8.75599E-1 1.05833EO 6.38587E-1 1.16104EO 7.10425E-10 2. 18289E-9 3.83059E-9 1.84857E-8 6.08359E-8 2.53809E-7 1.00618E-6 5.87258E-6 2.80089E-9 7.10968E-9 1.23028E-8 5.84930E-8 2.09019E-7 9.43280E-7 4.74125E-6 3.12233E-5 1.43322E-9 1.16357E-9 3.09873E-9 1.03443E-8 2.54659E-8 2.50622E-7 2.99518E-9 9.19239E-9 3.23495E-8 1. 44696E-7 5.70687E-7
Page 51

CORRELATION BETWEEN PARAMETERS ESTIMATED
1.00 0007 0005 0004 0002 0001 0001 0001 -0014 -0001 -0001 -0001 -0000 -0000 -0000 -0000 -0020 -0002 -0001 -0001 -0000 -0000 -0000 -0000 -0 014 -0014 -0001 -0001 -0000 -0000 -0001 -0000 -0000 -0000 -0000 1J
0007 1.00 0007 0005 0002 0001 0001 0001 -0012 -0011 -0001 -0001 -0000 -0000 -0000 -0000 -0017 -0016 -0001 -0001 -0001 -0000 ~
-0000 -0000 -0012 -0012 -0001 -0001 -0000 -0000 -0001 -0001 -0000 -0000 -0000 <0 ro
0005 0007 1.00 0006 0003 0002 0001 0001 -0009 -0 008 -0010 -0001 -0001 -0000 -0000 -0000 -0012 -0012 -0014 -0001 -0001 -0 001 '" -0001 -0001 -0009 -0009 -0010 -0001 -0001 -0000 -0009 -0001 -0000 -0000 -0000 I\l
0004 0005 0006 1.00 0005 0002 0002 0002 -0006 -0006 -0007 -0012 -0001 -0001 -0001 -0 002 -0008 -0008 -0009 -0016 -0001 -0001 -0002 -0003 -0006 -0006 -0007 -0012 -0001 -0001 -0006 -0009 -0001 -0001 -0001
0002 0002 0003 0005 1.00 0004 0003 0003 -0003 -0003 -0004 -0008 -0012 -0001 -0002 -0003 -0004 -0004 -0006 -0011 -0017 -0 002 -0002 -0004 -0003 -0003 -0004 -0008 -0012 -0001 -0003 -0006 -0009 -0001 -0001
0001 0001 0002 0002 0004 1.00 0006 0005 -0002 -0002 -0002 -0003 -0006 -0014 -0003 -0005 -0002 -0002 -0003 -0004 -0008 -0020 -0004 -0006 -0002 -0002 -0002 -0003 -0006 -0014 -0002 -0002 -0 004 -0009 -0002
0001 0001 0001 0002 0003 0006 1.00 0008 -0002 -0001 -0002 -0002 -0004 -0008 -0016 -0005 -0002 -0002 -0002 -0003 -0005 -0011 -0 023 -0006 -0002 -0002 -0002 -0002 -0004 -0008 -0001 -0002 -0003 -0005 -0 012
0001 0001 0001 0002 0003 0005 0008 1000 -0001 -0001 -0001 -0002 -0003 -0006 -0011 -0019 -0001 -0001 -0002 -0003 -0 004 -0008 -0015 -0026 -0001 -0001 -0001 -0002 -0003 -0006 -0001 -0002 -0 002 -0004 -0008
-0014 -0012 -0009 -0006 -0003 -0002 -0002 -0 001 1.00 0002 0001 0001 0001 0000 0000 0000 0006 0003 0002 0001 0001 0001 0001 0001 0004 0004 0001 0001 0001 0000 0001 0001 0000 0000 0000
-0001 -0011 -0008 -0006 -0003 -0002 -0001 -0001 0002 1.00 0001 0001 0.00 0000 0000 0000 0003 0003 0002 0001 0001 0001 0001 0001 0002 0002 0001 0001 0000 0000 0001 0001 0000 0.00 0000
-0 001 -0001 -0010 -0007 -0004 -0002 -0002 -0001 0001 0001 1.00 0001 0001 0000 0000 0001 0002 0002 0002 0002 0001 0001 0001 0001 0001 0001 0002 0001 0001 0000 0001 0001 0001 0000 0000
-0001 -0001 -0 001 -0012 -0008 -0003 -0002 -0002 0001 0001 0001 1.00 0001 0001 0001 0001 0001 0001 0002 0003 0002 0001 0001 0001 0001 0001 0001 0002 0001 0001 0001 0001 0001 0,,00 0001
-0000 -0000 -0001 -0001 -0012 -0006 -0004 -0003 0001 0000 0001 0001 1.00 0001 0001 0001 0001 0001 0001 0002 0003 0002 0001 0002 0001 0001 0001 0001 0002 0001 0001 0001 0001 0.01 0001
-0000 -0000 -0000 -0001 -0001 -0014 -0008 -0006 0000 0000 0000 0001 0001 1.00 0002 0002 0001 0001 0001 0001 0002 0004 0003 0002 0000 0000 0000 0001 0001 0003 0000 0001 0001 0.02 0001
-0000 -0000 -0000 -0001 -0002 -0003 -0 016 -0011 0000 0000 0000 0001 0.01 0002 1.00 0003 0001 0001 0001 0001 0001 0003 0005 0004 0000 0000 0000 0001 0001 0002 0000 0001 0001 0001 0003
-0000 -0000 -0000 -0002 -0003 -0005 -0005 -0019 0000 0000 0001 0001 0001 0002 0003 1.00 0001 0001 0001 0001 0002 0002 0004 0005 0000 0000 0001 0001 0001 0002 0000 0001 0001 0.01 0002
-0 020 -0017 -0012 -0008 -0004 -0002 -0002 -0001 0006 0003 0002 0001 0001 0001 0001 0001 1.00 0005 0003 0002 0001 0001 0001 0001 0006 0006 0002 0001 0001 0001 0002 0001 0001 0.00 0000
-0002 -0016 -0012 -0008 -0004 -0002 -0002 -0001 0003 0003 0002 0001 0001 0001 0001 0001 0005 1.00 0003 0002 0001 0001 0001 0001 0003 0003 0002 0001 0001 0001 0002 0001 0001 0000 0000
-0001 -0001 -0014 -0 009 -0006 -0003 -0002 -0002 0002 0002 0002 0002 0001 0001 0001 0001 0003 0003 1.00 0002 0001 0001 0001 0001 0002 0002 0002 0002 0001 0001 0002 0001 0001 0000 0000
-0001 -0001 -0001 -0016 -0011 -0004 -0003 -0 003 0001 0001 0002 0003 0002 0001 0001 0001 0002 0002 0002 1.00 0002 0001 0001 0002 0001 0001 0002 0003 0002 0001 0001 0002 0001 0.01 0001
-0000 -0001 -0001 -0001 -0017 -0008 -0005 -0004 0001 0001 0001 0002 0003 0002 0001 0002 0001 0001 0001 0002 1.00 0002 0002 0002 0001 0001 0001 0002 0003 0002 0001 0001 0002 0001 0001
-0000 -0000 -0001 -0 001 -0002 -0020 -0011 -0008 0001 0001 0001 0001 0002 0004 0003 0002 0001 0001 0001 0001 0002 1.00 0004 0003 0001 0001 0001 0001 0002 0004 0001 0001 0001 0.03 0002
-0000 -0000 -0001 -0002 -0002 -0004 -0023 -0015 0001 0001 0001 0001 0001 0003 0005 0004 0001 0001 0001 0001 0002 0004 1.00 0005 0001 0001 0001 0001 0001 0003 0001 0001 0001 0.02 0004
-0000 -0000 -0001 -0003 -0004 -0006 -0006 -0026 0001 0001 0001 0001 0002 0002 0004 0005 0001 0001 0001 0002 0002 0003 0005 1.00 0001 0001 0001 0001 0002 0002 0001 0001 0001 0.02 0003
-0014 -0012 -0009 -0006 -0003 -0002 -0002 -0001 0004 0002 0001 0001 0001 0000 0000 0000 0006 0003 0002 0001 0001 0001 0001 0001 1.00 0004 0001 0001 0001 0000 0001 0001 0000 0000 0000
-0014 -0012 -0009 -0006 -0003 -0 002 -0002 -0001 0004 0002 0001 0001 0001 0000 0000 0000 0006 0003 0002 0001 0001 0001 0001 0001 0004 1.00 0001 0001 0001 0000 0001 0001 0000 DoDO 0000
-0001 -0001 -0010 -0007 -0004 -0002 -0002 -0001 0001 0001 0002 0001 0.01 0000 0000 0001 0002 0002 0002 0002 0001 0001 0001 0001 0001 0001 1.00 0001 0001 0000 0001 0001 0001 0.00 0000
-0001 -0001 -0 001 -0012 -0008 -0003 -0002 -0002 0001 0001 0001 0002 0.01 0001 0001 0001 0001 0001 0002 0003 0002 0001 0001 0001 0001 0001 0001 1.00 0001 0001 0001 0001 0001 0.00 0001
-0000 -0000 -0001 -0001 -0012 -0006 -0004 -0003 0001 0000 0001 0001 0002 0001 0001 0001 0001 0001 0001 0002 0003 0002 0001 0002 0001 0001 0001 0001 1.00 0001 0001 0001 0001 0.01 0001
-0000 -0000 -0000 -0001 -0001 -0014 -0008 -0 006 0000 0000 0000 0001 0001 0003 0002 0002 0001 0001 0001 0001 0002 0004 0003 0002 0000 0000 0000 0001 0001 1.00 0000 0001 0001 0002 0001
-0001 -0001 -0009 -0 006 -0003 -0002 -0001 -0001 0001 0001 0001 0001 0001 0000 0000 0000 0002 0002 0002 0001 0001 0001 0001 0001 0001 0001 0001 0001 0001 0000 1.00 0001 0000 DoDO 0000
-0000 -0001 -0001 -0 009 -0006 -0002 -0002 -0002 0001 0001 0001 0001 0001 0001 0001 0001 0001 0001 0001 0002 0001 0001

0.01 0.01 0.01 0.01 0.01 0.01 0.01 0.01 0.01 1.00 ·0.00 ·0.00 ·0.00 ·0.01 ·0.09 ·0.04 ·0.03 ·0.02 0.00 0.00 0.01
0.01 0.01 0.00 0.00 0.01 0.01 0.01 0.01 0.00 0.01 ·0.00 ·0.00 ·0.00 ·0.01 ·0.01 ·0.09 ·0.05 ·0.04 0.00 0.00 0.00
0.02 0.02 0.00 0.00 0.00 0.00 0.01 0.02 0.00 0.00 ·0.00 ·0.00 ·0.00 ·0.01 ·0.01 ·0.02 ·0.12 ·0.08 0.00 0.00 0.00
0.04 0.03 0.00 0.00 0.00 0.01 0.01 0.01 0.00 0.00
CORRELATION BETWEEN PARAMETERS ESTIMATED (SYMBOLIC FORM) N 1 • N 2 • N 3 • N 4 • N 5 • N 6 • N 7 • N 8 • qRV SPR 1 * qRV SPR 2 * qRV SPR 3 * qRV SPR 4 * qRV SPR 5 * qRV SPR 6 • qRV SPR 7
,; qRV SPR 8 * qRV CAN 1 * qRV CAN 2 * qRV CAN 3 • qRV CAN 4 * qRV CAN 5 * qRV CAN 6 • qRV CAN 7 * qRV CAN 8 * qRV AUT 1 * qRV FAL 1 * qRV FAL 3 ,; qRV FAL 4 * qRV FAL 5 * qRV FAL 6 qCM CPE 2 qCM CPE 3 .. qCM CPE 4 qCM CPE 5 . qCM CPE 6 •
SYMBOLS: = LARGE NEGATIVE CORRELATION whenever -1 <= R < ·L MODERATE NEGATIVE CORRELATION whenever -l <= R < ·M SMALL CORRELATION whenever -M <= R <= +M
+ MODERATE POStTIVE CORRELATION whenever +M < R <= +L • LARGE POSITIVE CORRELATION whenever +L < R <= +1
Where R 15 the estimated correlation, M is 0.2 and L is 0.5
0.01 0.00 0.00 0.01 0.01 0.01 1.00 0.01 0.01 0.00 0.01 0.02 0.01 1.00 0.01 0.01 0.01 0.01 0.01 0.01 1.00
* ,; * ,;
• ,;
0.01 0.01 0.01 0.01 0.01
0.01 0.01 0.00 0.00 0.00
0.03 0.02 0.00 0.00 0.00
0.01 0.02 0.01
0.01 0.01 0.03
0.01 0.01 0.02
"1J
<1l ID
'" '"

Page 54
SUMMMARY OF RESIDUALS
Index 1 RV SPR 1 Index is tuned to the sum of Janl full stock sizes (in number) for ages: 1 SORTED BY YEAR
Yr Observed Pred Weight Wt Res Std Res Pred Stocksize 1978 -0.2673 -0.1204 1.0000 -0.1469 -0.2413 27727.077 1979 -0.1209 -0.2844 1.0000 0.1635 0.2686 23533.095 1980 -2.5332 -0.4365 1.0000 -2.0967 -3.4445 20212.059 1981 1.5453 0.2821 1.0000 1.2633 2.0753 41465.729 1982 -0.0064 -0.5813 1.0000 0.5749 0.9445 17486.983 1983 -0.4002 -1.1785 1.0000 0.7782 1.2785 9624.575 1984 -0.1991 -0.1308 1.0000 -0.0684 -0.1123 27440.450 1985 -1.6118 -1.2968 1.0000 -0.3150 -0.5174 8550.297 1986 0.5729 0.3219 1.0000 0.2510 0.4123 43150.924 1987 -2.6704 -0.6387 1.0000 -2.0318 -3.3378 16512.988 1988 0.3543 -0.2918 1 .0000 0.6461 1.0615 23358.727 1989 -0.2566 -0.6093 1 .0000 0.3527 0.5794 17004.555 1990 -0.9272 -1.1923 1 .0000 0.2651 0.4355 9492.506 1991 0.7768 -0.3357 1.0000 1.1126 1.8278 22354.971 1992 -1.3846 -1.7327 1.0000 0.3481 0.5718 5529.658 1993 -3.3636 -2.2668 1.0000 -1.0968 -1.8018 3241.522
Partial variance for this index is 0.98245
Index 2 RV SPR 2 Index is tuned to the sum of Janl full stock sizes (in number) for ages: 2 SORTED BY YEAR
Yr Observed Pred Weight Wt Res Std Res Pred Stocksize 1978 -1.9630 -1.4305 1.0000 -0.5325 -0.8748 4267.437 1979 0.0191 0.2408 1.0000 -0.2217 -0.3641 22699.201 1980 0.5302 0.0753 1.0000 0.4549 0.7473 19236.504 1981 0.3630 -0.0801 1.0000 0.4431 0.7280 16467.704 1982 0.9350 0.6426 1.0000 0.2923 0.4802 33924.837 1983 0.3892 -0.2412 1.0000 0.6304 1.0356 14017.629 1984 -1.0601 -0.8297 1.0000 -0.2305 -0.3786 7782.213 1985 0.6807 0.2272 1.0000 0.4535 0.7450 22393.049 1986 -1.1478 -0.9530 1.0000 -0.1948 -0.3200 6879.143 1987 0.1900 0.6792 1.0000 -0.4891 -0.8035 35187.834 1988 -0.6672 -0.2791 1.0000 -0.3881 -0.6376 13496.165 1989 0.0010 0.0690 1.0000 -0.0680 -0.1117 19115.460 1990 -0.3644 -0.2480 1.0000 -0.1164 -0.1912 13922.151 1991 -0.9586 -0.8318 1.0000 -0.1267 -0.2082 7765.472 1992 -0.0603 0.0229 1.0000 -0.0832 -0.1368 18255.650 1993 -1.2087 -1.3855 1.0000 0.1768 0.2904 4463.963
Partial variance for this index is 0.134509
Index 3 RV SPR 3 Index is tuned to the sum of Janl full stock sizes (in number) for ages: 3 SORTED BY YEAR
Yr Observed Pred Weight Wt Res Std Res Pred Stocksize 1978 1.1607 0.6373 1.0000 0.5234 0.8598 25474.026 1979 -1.7603 -1.4567 1.0000 -0.3037 -0.4989 3138.281 1980 0.4392 0.2201 1.0000 0.2191 0.3599 16784.812 1981 0.4726 -0.0881 1 .0000 0.5607 0.9212 12331.947 1982 -0.2087 -0.2411 1.0000 0.0325 0.0533 10582.612 1983 0.5650 0.3704 1.0000 0.1946 0.3197 19506.903 1984 -0.7762 -0.5724 1.0000 -0.2038 -0.3349 7598.531 1985 -0.8279 -0.9538 1.0000 0.1259 0.2068 5188.914 1986 0.0515 -0.0731 1.0000 0.1246 0.2046 12519.392 1987 -1.4583 -1 .1114 1.0000 -0.3469 -0.5699 4432.352 1988 0.5867 0.4929 1.0000 0.0938 0.1542 22047.512 1989 -0.8471 -0.3362 1.0000 -0.5109 -0.8393 9622.797 1990 -0.0147 0.0215 1 .0000 -0.0362 -0.0594 13761.114 1991 -0.7645 -0.6649 1.0000 -0.0995 -0.1635 6926.787 1992 -1.3046 -0.9953 1.0000 -0.3092 -0.5080 4977.954 1993 -0.2517 -0.1874 1.0000 -0.0643 -0.1056 11169.957
Partial variance for this index is 0.091241

Page 55
Index 4 RV SPR 4 Index is tuned to the sum of Jan1 full stock sizes (in number) for ages: 4 SORTED BY YEAR
Yr Observed Pred Weight Wt Res Std Res Pred Stocksize 1978 0.1007 0.2613 1.0000 -0.1606 -0.2639 7961.932 1979 0.7809 0.8146 1.0000 -0.0337 -0.0554 13845.688 1980 -1.4328 -1.2509 1.0000 -0.1819 -0.2989 1755.053 1981 0.6437 0.3230 1.0000 0.3207 0.5268 8468.850 1982 0.3912 0.0236 1.0000 0.3676 0.6039 6277.225 1983 -0.1342 -0.1639 1.0000 0.0297 0.0488 5204.211 1984 0.2814 0.3471 1.0000 -0.0657 -0.1079 8675.197 1985 0.1888 -0.6743 1.0000 0.8631 1.4179 3123.893 1986 -0.8892 -1.1015 1.0000 0.2123 0.3487 2037.806 1987 -0.1526 -0.0031 1.0000 -0.1495 -0.2456 6112_190 1988 -0.7519 -0.9561 1.0000 0.2042 0.3355 2356.701 1989 0.5589 0.5655 1.0000 -0.0066 -0.0108 10792.370 1990 -0.2944 -0_1581 1.0000 -0.1364 -0.2240 5234.545 1991 0.0083 0.0894 1.0000 -0.0812 -0.1333 6704.457 1992 -1.6816 -0.8066 1.0000 -0.8750 -1.4374 2736.785 1993 -1.3726 -1.0657 1.0000 -0.3070 -0.5043 2112.107
Partial variance for this index is 0.138898
Index 5 RV SPR 5 Index is tuned to the sum of Jan1 full stock sizes (in number) for ages: 5 SORTED BY YEAR
Yr Observed Pred Weight Wt Res Std Res Pred stocksize 1978 0.2576 -0.1510 1.0000 0.4086 0.6712 2905.869 1979 -0.1057 0.2717 1.0000 -0.3774 -0.6201 4434.838 1980 0.9014 0.7180 1.0000 0.1834 0.3013 6929.333 1981 -1.7963 -1.2334 1.0000 -0.5629 -0.9248 984.497 1982 0.5462 0.3307 1.0000 0.2155 0.3540 4704.188 1983 0.1475 -0.2555 1.0000 0.4030 0.6621 2617.576 1984 -0.2990 -0.5055 1.0000 0.2065 0.3392 2038.567 1985 0.7917 0.1893 1.0000 0.6024 0.9896 4084.113 1986 -0.0989 -0.9403 1.0000 0.8413 1.3821 1319.809 1987 -2.3054 -1.2719 1.0000 -1.0334 -1.6977 947.259 1988 0.0695 -0.0912 1.0000 0.1607 0.2640 3085.078 1989 -0.9725 -1.2040 1.0000 0.2316 0.3804 1013.808 1990 0.3981 0_4068 1.0000 -0.0088 -0.0144 5076.446 1991 -0.2587 -0.2689 1.0000 0.0102 0.0167 2582.779 1992 -0.8013 -0.2934 1.0000 -0.5079 -0.8345 2520.374 1993 -1.7269 -0.9543 1.0000 -0.7726 -1.2693 1301.469
Partial vari ance for this index is 0.271001
Index 6 RV SPR 6 Index is tuned to the sum of Jan1 full stock sizes (in number) for ages: 6 SORTED BY YEAR
Yr Observed Pred Weight Wt Res Std Res Pred stocksize 1978 -0.7604 -0.4063 1.0000 -0.3541 -0.5817 1102.177 1979 -0.2715 -0.0161 1.0000 -0_2554 -0.4195 1628.109 1980 0_6659 0.4263 1.0000 0.2395 0_3935 2534.275 1981 1.0417 0.7732 1.0000 0.2686 0_4412 3584.893 1982 -2.9529 -1.0254 1.0000 -1.9275 -3.1665 593.401 1983 0.3382 0.2103 1.0000 0.1280 0.2102 2041.789 1984 0.3236 -0.3309 1.0000 0.6545 1.0753 1188.486 1985 -0.1284 -0.5990 1.0000 0.4706 0.7731 908.974 1986 0.7236 -0.0100 1.0000 0.7336 1. 2052 1638_171 1987 -0.5395 -0.9401 1.0000 0.4007 0.6582 646.247 1988 -1.9202 -1.1515 1.0000 -0.7686 -1.2627 523.100 1989 0.1151 -0.3454 1.0000 0.4605 0.7565 1171.306 1990 -0.9000 -1.1374 1.0000 0.2375 0.3901 530.535 1991 0.0895 0.2420 1.0000 -0.1525 -0.2505 2107.690 1992 -0.7570 -0.7325 1.0000 -0.0245 -0.0402 795_348 1993 -0_9394 -0.8285 1.0000 -0.1108 -0.1820 722.538
Partial variance for this index is 0.428168

Page 56
Index 7 RV SPR 7 Index is tuned to the sum of Jan1 full stock sizes (in number) for ages: 7 SORTED BY YEAR
Yr Observed Pred Weight Wt Res Std Res Pred Stocksize 1978 1.4424 0.5450 1.0000 0.8974 1.4743 1433.187 1979 ·0.6569 -0.0584 1.0000 -0.59B5 -0.9832 783.853 1980 0.1299 0.1002 1.0000 0.0297 0.0489 918.568 1981 0.4665 0.2816 1.0000 0.1849 0.3038 1101.284 1982 0.5709 0.6936 1.0000 -0.1227 -0.2016 1662.861 1983 -1.1269 -1.27n 1.0000 0.1508 0.2478 231.5n 1984 0.2806 0.1542 1.0000 0.1264 0.2077 969.521 1985 0.1863 -0.4958 1.0000 0.6821 1.1205 506.154 1986 -0.9838 -0.8053 1.0000 -0.1785 -0.2932 371.412 1987 -0.1365 -0.0712 1.0000 -0.0653 -0.1073 m.888 1988 -2.1312 -1.0153 1.0000 -1.1160 -1.8333 301.083 1989 -1.2038 -1.3875 1.0000 0.1837 0.3018 207.498 1990 -0.1922 -0.5711 1.0000 0.3789 0.6224 469.468 1991 -1.4709 -1.2970 1.0000 -0.1739 -0.2856 227.157 1992 -0.0456 -0.1144 1.0000 0.0689 0.1131 741.168 1993 -1.5160 -1.0680 1.0000 -0.4481 -0.7361 285.621
Partial variance for this index is 0.232057
Index 8 RV SPR 8 Index is tuned to the sum of Jan1 full stock sizes (in number) for ages: 8 SORTED BY YEAR
Yr Observed Pred Weight Wt Res Std Res Pred stocksize 1978 -0.3863 -1.6632 1.0000 1.2769 2.0976 67.334 1979 0.6498 0.8855 1.0000 -0.2357 -0.3873 861.225 1980 -0.8871 0.4764 1.0000 -1.3636 -2.2400 572.092 1981 0.6436 -0.0166 1.0000 0.6602 1.0846 349.407 1982 -0.1673 0.3893 1.0000 -0.5566 -0.9144 524.338 1983 0.9293 0.7505 1.0000 0.1788 0.2938 752.480 1985 0.8200 0.0656 1.0000 0.7543 1.2392 379.361 1986 0.4516 -0.4923 1.0000 0.9439 1.5506 217.149 1987 -1.5549 -0.4551 1.0000 -1.0998 -1.8068 225.366 1988 -0.3763 0.0915 1.0000 -0.4678 -0.7685 389.299 1989 -0.6512 -1.2594 1.0000 0.6082 0.9992 100.827 1990 -1.7907 -1.3118 1.0000 -0.4789 -0.7867 95.688 1991 -0.6314 -0.7811 1.0000 0.1496 0.2458 162.682 1992 -1.3318 -1.5966 1.0000 0.2648 0.4350 71.971 1993 -0.7166 -0.0822 1. 0000 -0.6344 -1.0422 327.222
Partial vari ance for this index is 0.606073
Index 9 RV CAN 1 Index is tuned to the sum of Jan1 full stock sizes (in number) for ages: 1 SORTED BY YEAR
Yr Observed Pred Weight Wt Res Std Res Pred Stocksize 1986 0.0579 0.6612 1. 0000 -0.6034 - 0.9912 43150.924 1987 -0.8176 -0.2993 1.0000 -0.5183 -0.8514 16512.988 1988 -0.7042 0.0475 1.0000 -0.7518 -1.2350 23358.727 1989 1.0634 -0.2700 1.0000 1.3334 2.1905 17004.555 1990 -0.2988 -0.8530 1.0000 0.5542 0.9104 9492.506 1991 0.7342 0.0036 1.0000 0.7306 1.2003 22354.971 1992 -1.6386 -1.3933 1.0000 -0.2452 -0.4029 5529.658 1993 -2.4270 -1.9274 1.0000 -0.4996 -0.8207 3241.522
Partial vari ance for this index is 0.615539
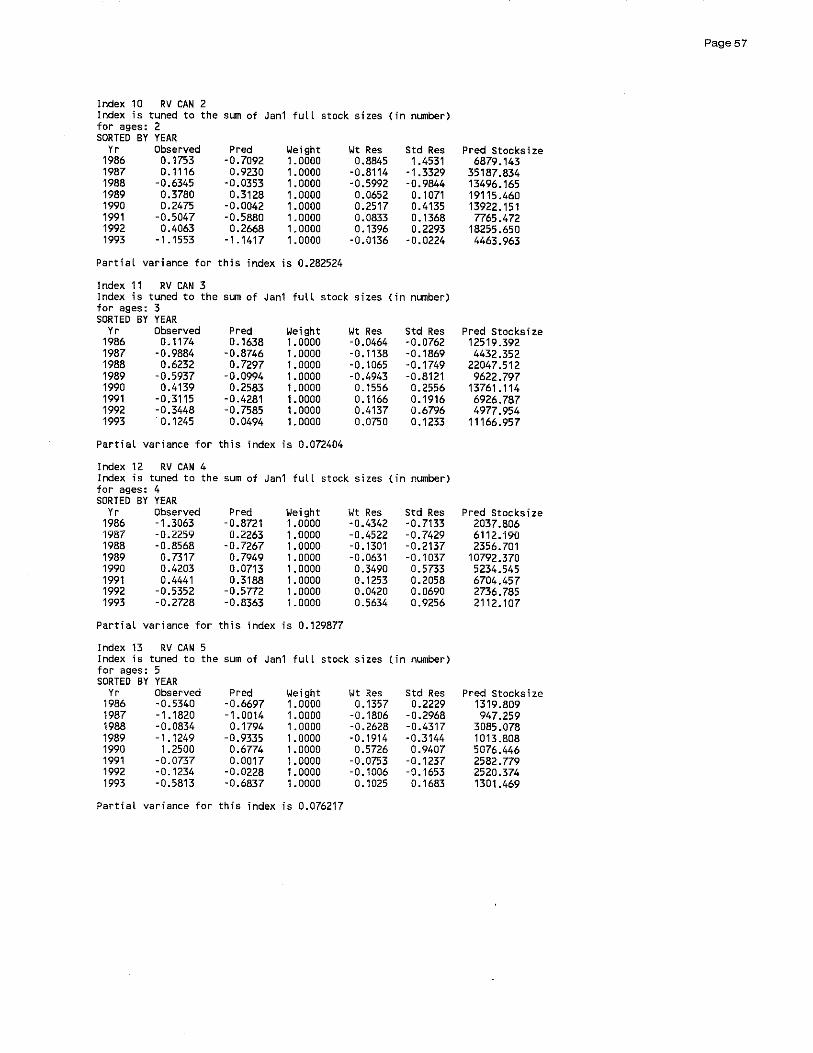
Page 57
Index 10 RV CAN 2 Index is tuned to the sum of Jan1 fuLL stock sizes ( i n number) for ages: 2 SORTED BY YEAR
Yr Observed Pred Weight Wt Res Std Res Pred Stocks i ze 1986 0.1753 -0.7092 1.0000 0.8845 1.4531 6879.143 1987 0.1116 0.9230 1.0000 -0.8114 ·1.3329 35187.834 1988 -0.6345 -0.0353 1.0000 ·0.5992 ·0.9844 13496.165 1989 0.3780 0.3128 1.0000 0.0652 0.1071 19115.460 1990 0.2475 -0.0042 1.0000 0.2517 0.4135 13922.151 1991 -0.5047 ·0.5880 1.0000 0.0833 0.1368 7765.472 1992 0.4063 0.2668 1.0000 0.1396 0.2293 18255.650 1993 -1.1553 ·1.1417 1.0000 -0.0136 ·0.0224 4463.963
PartiaL variance for this index is 0.282524
Index 11 RV CAN 3 Index is tuned to the sum of Jan1 full stock sizes (in number) for ages: 3 SORTED BY YEAR
Yr Observed Pred Weight Wt Res Std Res Pred stocksize 1986 0.1174 0.1638 1.0000 -0.0464 -0.0762 12519.392 1987 ·0.9884 -0.8746 1.0000 -0.1138 -0.1869 4432.352 1988 0.6232 0.7297 1.0000 ·0.1065 -0.1749 22047.512 1989 -0.5937 -0.0994 1.0000 -0.4943 -0.8121 9622.797 1990 0.4139 0.2583 1.0000 0.1556 0.2556 13761.114 1991 -0.3115 -0.4281 1.0000 0.1166 0.1916 6926.787 1992 -0.3448 -0.7585 1.0000 0.4137 0.6796 4977.954 1993 0.1245 0.0494 1.0000 0.0750 0.1233 11166.957
PartiaL variance for this index is 0.072404
Index 12 RV CAN 4 Index is tuned to the sum of Jan1 full stock sizes (in number) for ages: 4 SORTED BY YEAR
Yr Observed Pred Wei ght Wt Res Std Res Pred Stocksize 1986 -1.3063 -0.8721 1.0000 -0.4342 ·0.7133 2037.806 1987 -0.2259 0.2263 1.0000 -0.4522 -0.7429 6112.190 1988 ·0.8568 -0.7267 1.0000 -0.1301 -0.2137 2356.701 1989 0.7317 0.7949 1.0000 -0.0631 -0.1037 10792.370 1990 0.4203 0.0713 1.0000 0.3490 0.5733 5234.545 1991 0.4441 0.3188 1.0000 0.1253 0.2058 6704.457 1992 -0.5352 -0.5772 1.0000 0.0420 0.0690 2736.785 1993 -0.2728 -0.8363 1.0000 0.5634 0.9256 2112.107
Partial variance for this index is 0.129877
Index 13 RV CAN 5 Index is tuned to the sum of Jan1 full stock sizes (in number) for ages: 5 SORTED BY YEAR
Yr Observed Pred Wei ght Wt Res Std Res Pred stocksize 1986 -0.5340 -0.6697 1.0000 0.1357 0.2229 1319.809 1987 -1.1820 -1.0014 1.0000 -0.1806 -0.2968 947.259 1988 -0.0834 0.1794 1.0000 -0.2628 -0.4317 3085.078 1989 -1.1249 -0.9335 1.0000 ·0.1914 -0.3144 1013.808 1990 1.2500 0.6774 1.0000 0.5726 0.9407 5076.446 1991 -0.0737 0.0017 1.0000 -0.0753 -0.1237 2582.779 1992 ·0.1234 ·0.0228 1.0000 -0.1006 -0.1653 2520.374 1993 -0.5813 ·0.6837 1.0000 0.1025 0.1683 1301.469
Partial variance for this index is 0.076217
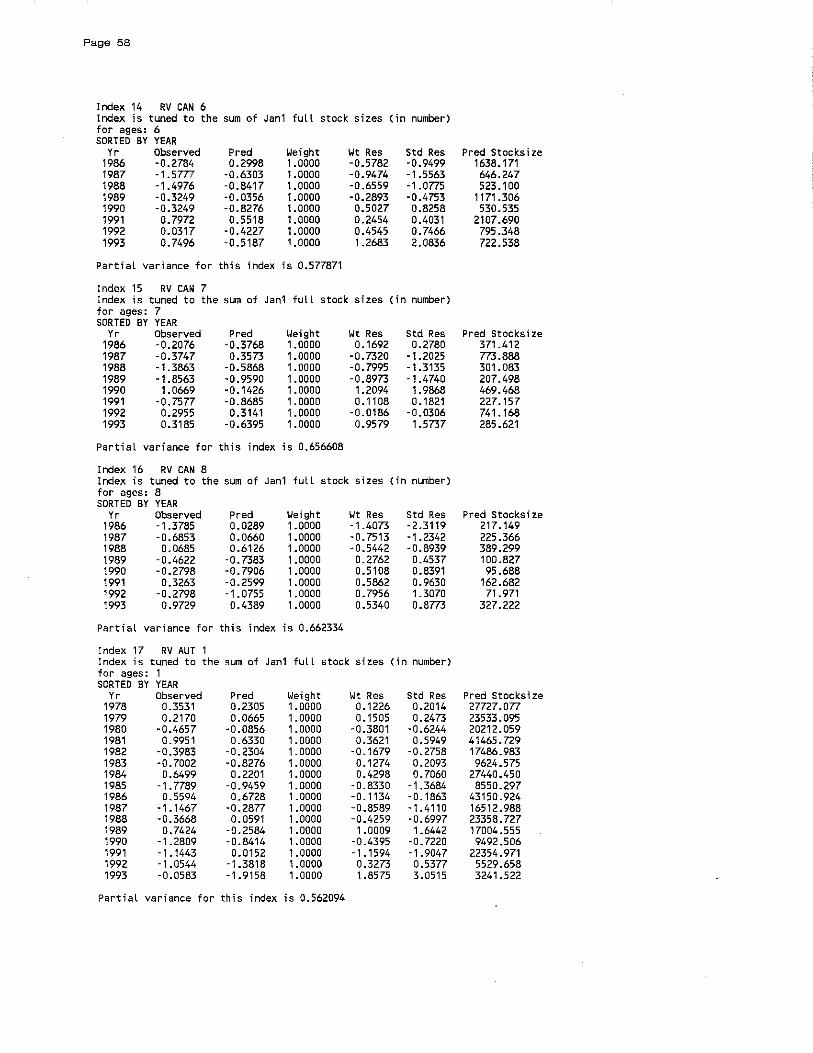
Page 58
Index 14 RV CAN 6 Index is tuned to the sum of Jan1 full stock sizes (in number) for ages: 6 SORTED BY YEAR
Yr Observed Pred IJeight Wt Res Std Res Pred Stocks i ze 1986 -0_2784 0_2998 1.0000 -0_5782 -0_9499 1638_171 1987 -1.5777 -0_6303 1.0000 -0_9474 -1.5563 646_247 1988 -1.4976 -0_8417 1.0000 -0_6559 -1_0775 523_100 1989 -0_3249 -0_0356 1.0000 -0_2893 -0_4753 1171_306 1990 -0_3249 -0_8276 1.0000 0_5027 0_8258 530_535 1991 0_7972 05518 1.0000 0_2454 0_4031 2107_690 1992 0_0317 -0_4227 1.0000 0_4545 OJ466 795_348 1993 0_7496 -0_5187 1.0000 1.2683 2_0836 722_538
Partial variance for this index is 0_577871
Index 15 RV CAN 7 Index is tuned to the sum of Jan1 full stock sizes (in number) for ages: 7 SORTED BY YEAR
Yr Observed Pred !.Ieight Wt Res Std Res Pred Stocks i ze 1986 -0_2076 -0_3768 1.0000 0_1692 0_2780 371.412 1987 -0_3747 0_3573 1.0000 -0_7320 -1. 2025 m_888 1988 -1.3863 -0_5868 1.0000 -0_7995 -1.3135 301.083 1989 -1.8563 -0_9590 1.0000 -0_8973 -1.4740 207_498 1990 1.0669 -0_1426 1.0000 1.2094 1.9868 469_468 1991 -0_7577 -0_8685 1.0000 0_1108 0_1821 227_157 1992 0_2955 0_3141 1.0000 -0_0186 -0_0306 741.168 1993 0_3185 -0_6395 1.0000 0_9579 1.5737 285_621
Partial variance for this index is 0_656608
Index 16 RV CAN 8 Index is tuned to the sum of Jan1 full stock sizes (in number) for ages: 8 SORTED BY YEAR
Yr Observed Pred !.Ieight !.It Res Std Res Pred Stocks; ze 1986 -1.3785 0_0289 1.0000 -1.4073 -2_3119 217_149 1987 -0_6853 0_0660 1.0000 -OJ513 -1.2342 225 _366 1988 0_0685 0_6126 1.0000 -0_5442 -0_8939 389_299 1989 -0_4622 -0_7383 1.0000 0_2762 0_4537 100_827 1990 -0_2798 -OJ906 1.0000 0_5108 0_8391 95_688 1991 0_3263 -0_2599 1.0000 0_5862 0_9630 162_682 1992 -0_2798 -1. 0755 1.0000 OJ956 1.3070 71.971 1993 0_9729 0_4389 1.0000 0_5340 0_8773 327_222
Partial vari ance for this index is 0_662334
Index 17 RV AUT Index is tuned to the sum of Jan1 full stock sizes (in number) for ages: 1 SORTED BY YEAR
Yr Observed Pred Weight Wt Res Std Res Pred Stocksize 1978 0_3531 0_2305 1.0000 0_1226 0_2014 27727_077 1979 0_2170 0_0665 1.0000 0_1505 0_2473 23533_095 1980 -0_4657 -0_0856 1.0000 -0_3801 -0_6244 20212_059 1981 0_9951 0_6330 1.0000 0_3621 0_5949 41465 J29 1982 -0_3983 -0_2304 1.0000 -0_1679 -0_2758 17486_983 1983 -OJ002 -0_8276 1.0000 0_1274 0_2093 9624_575 1984 0_6499 0_2201 1.0000 0_4298 0_7060 27440_450 1985 -1. 7789 -0_9459 1.0000 -0_8330 -1.3684 8550_297 1986 0_5594 0_6728 1.0000 -0_1134 -0_1863 43150_924 1987 -1.1467 -0_2877 1.0000 -0_8589 -1.4110 16512_988 1988 -0_3668 0_0591 1.0000 -0_4259 -0_6997 23358J27 1989 OJ424 -0_2584 1.0000 1.0009 1.6442 17004_555 1990 -1_2809 -0_8414 1.0000 -0_4395 -0_7220 9492_506 1991 -1.1443 0_0152 1.0000 -1.1594 -1_9047 22354_971 1992 -1. 0544 -1.3818 1.0000 0_3273 0_5377 5529_658 1993 -0_0583 -1.9158 1.0000 1.8575 3_0515 3241.522
Partial variance for this index is 0_562094

Page 59
Index 18 RV FAL 1 Index is tuned to the sum of Jan1 full stock sizes (in number) for ages: 1 SORTED BY YEAR
Yr Observed Pred Weight Wt Res Std Res Pred Stocksize 1978 -0.7565 0.1263 1.0000 -0.8828 -1.4503 27727.077 1979 0.2027 -0.0377 1.0000 0.2404 0.3950 23533.095 1980 -1.0044 -0.1898 1.0000 -0.8145 -1.3381 20212.059 1981 -0.1438 0.5288 1.0000 -0.6725 -1.1048 41465.729 1982 -0.2121 -0.3346 1.0000 0.1225 0.2013 17486.983 1983 -0.0100 -0.9318 1.0000 0.9218 1.5143 9624.575 1984 1.1608 0.1159 1.0000 1.0449 1.7165 27440.450 1985 -0.5539 -1.0501 1. 0000 0.4963 0.8153 8550.297 1986 1.2107 0.5686 1.0000 0.6421 1.0549 43150.924 1987 -1.2133 -0.3920 1.0000 -0.8214 -1.3493 16512.988 1988 -0.4596 -0.0451 1.0000 -0.4144 -0.6808 23358.727 1989 0.5304 -0.3626 1.0000 0.8931 1.4671 17004.555 1990 -0.2083 -0.9456 1.0000 0.7373 1.2113 9492.506 1991 -0.7251 -0.0891 1.0000 -0.6361 -1.0449 22354.971 1992 -2.0816 -1.4860 1.0000 -0.5956 -0.9784 5529.658 1993 -2.2812 -2.0201 1.0000 -0.2611 -0.4289 3241.522
Part; al variance for this index is 0.515729
Index 20 RV FAL 3 Index is tuned to the sum of Jan1 full stock sizes (in number) for ages: 3 SORTED BY YEAR
Yr Observed Pred Weight Wt Res Std Res Pred Stocksize 1978 1.1171 0.5313 1.0000 0.5858 0.9623 25474.026 1979 -1.4797 -1.5627 1.0000 0.0830 0.1363 3138.281 1980 0.4268 0.1141 1.0000 0.3127 0.5136 16784.812 1981 -0.6856 -0.1942 1.0000 -0.4914 -0.8073 12331.947 1982 0.6975 -0.3471 1.0000 1.0446 1. 7161 10582.612 1983 0.6252 0.2644 1.0000 0.3608 0.5927 19506.903 1984 -0.0921 -0.6784 1.0000 0.5863 0.9632 7598.531 1985 -2.4023 -1.0598 1.0000 -1.3425 -2.2054 5188.914 1986 -0.3330 -0.1791 1.0000 -0.1540 -0.2529 12519.392 1987 -1.9910 -1.2174 1.0000 -0.7735 -1.2708 4432.352 1988 0.1887 0.3868 1.0000 -0.1982 -0.3255 22047.512 1989 -0.9507 -0.4422 1.0000 -0.5084 -0.8353 9622.797 1990 -0.0839 -0.0845 1.0000 0.0006 0.0010 13761.114 1991 0.3144 -0.7710 1.0000 1.0853 1. 7830 6926.787 1992 -1.8958 -1.1013 1.0000 -0.7945 -1.3052 4977.954 1993 -0.0899 -0.2934 1.0000 0.2035 0.3343 11166.957
Partial variance for this index is 0.464304
Index 21 RV FAL 4 Index is tuned to the sum of Jan1 full stock sizes (in number) for ages: 4 SORTED BY YEAR
Yr Observed Pred Weight Wt Res Std Res Pred Stocksize 1978 -0.1184 -0.0290 1.0000 -0.0894 -0.1469 7961.932 1979 1.6652 0.5243 1.0000 1.1408 1.8741 13845.688 1980 -1.2600 -1.5411 1.0000 0.2811 0.4618 1755.053 1981 -0.0215 0.0328 1.0000 - 0.0542 -0.0891 8468.850 1982 0.6788 -0.2667 1.0000 0.9455 1 .5533 6277.225 1983 -1.2795 -0.4542 1.0000 -0.8254 -1.3559 5204.211 1984 0.0061 0.0568 1.0000 -0.0507 -0.0833 8675.197 1985 0.1138 -0.9646 1.0000 1.0784 1.7716 3123.893 1986 -2.0382 -1.3918 1.0000 -0.6465 -1. 0620 2037.806 1987 -0.7276 -0.2933 1.0000 -0.4342 -0.7133 6112.190 1988 -1.9545 -1.2464 1.0000 -0.7081 -1.1633 2356.701 1989 0.1394 0.2752 1.0000 -0.1358 -0.2231 10792.370 1990 -1.4620 -0.4484 1.0000 -1.0136 -1.6651 5234.545 1991 0.3864 -0.2009 1.0000 0.5872 0.9647 6704.457 1992 -1.0479 -1.0968 1.0000 0.0489 0.0804 2736.785 1993 -1.4800 -1.3559 1.0000 -0.1241 -0.2038 2112.107
Partial variance for this index is 0.452167

Page 60
Index 22 RV FAL 5 Index is tuned to the sum of Jan1 full stock sizes (in number) for ages: 5 SORTED BY YEAR
Yr Observed Pred Weight Wt Res Std Res Pred Stocksi ze 1978 -0.3566 -0.5864 1.0000 0.2299 0.3776 2905.869 1979 0.9871 -0.1637 1.0000 1.1508 1.8906 4434.838 1980 1.5023 0.2826 1.0000 1.2197 2.0038 6929.333 1981 -1.5476 -1.6688 1.0000 0.1212 0.1991 984.497 1982 0.4949 -0.1047 1.0000 0.5996 0.9851 4704.188 1983 -1.6548 -0.6909 1.0000 -0.9639 -1.5835 2617.576 1984 -1.8836 -0.9409 1.0000 -0.9427 -1.5487 2038.567 1985 0.8854 -0.2461 1.0000 1.1314 1.8587 4084.113 1986 -1.1387 -1.3757 1.0000 0.2369 0.3893 1319.809 1987 -3.5811 -1.7074 1.0000 -1.8737 -3.0782 947.259 1988 -0.6107 -0.5266 1.0000 -0.0841 -0.1381 3085.078 1989 -1.3728 -1.6395 1.0000 0.2666 0.4380 1013.808 1990 0.3295 -0.0286 1.0000 0.3581 0.5882 5076.446 1991 -0.5435 -0.7043 1.0000 0.1609 0.2643 2582.779 1992 -2.5641 -0.7288 1.0000 -1.8353 -3.0150 2520.374 1993 -1.1652 -1.3897 1.0000 0.2245 0.3688 1301.469
PartiaL variance for this index is 0.921879
Index 23 RV FAL 6 Index is tuned to the sum of Jan1 full stock sizes (in number) for ages: 6 SORTED BY YEAR
Yr Observed Pred Weight Wt Res Std Res Pred Stocksize 1978 0.3812 -0.4126 1.0000 0.7938 1.3041 1102.177 1979 1.0383 -0.0225 1.0000 1.0608 1. 7426 1628.109 1980 0.9131 0.4200 1.0000 0.4931 0.8101 2534.275 1981 0.7506 0.7669 1.0000 -0.0162 -0.0267 3584.893 1982 -0.7833 -1.0318 1.0000 0.2484 0.4081 593.401 1983 -0.2047 0.2039 1.0000 -0.4086 -0.6713 2041.789 1984 -0.9306 -0.3372 1.0000 -0.5934 -0.9748 1188.486 1985 -1.9339 -0.6053 1.0000 -1.3286 -2.1826 908.974 1986 -0.1614 -0.0163 1.0000 -0.1451 -0.2383 1638.171 1987 -0.6656 -0.9465 1.0000 0.2809 0.4614 646.247 1988 -1.4443 -1.1579 1.0000 -0.2864 -0.4705 523.100 1989 0.4053 -0.3518 1.0000 0.7571 1.2437 1171.306 1990 -0.7637 -1.1437 1.0000 0.3800 0.6243 530.535 1991 0.2027 0.2357 1.0000 -0.0330 -0.0542 2107.690 1992 -1.4013 -0.7389 1.0000 -0.6624 -1.0882 795.348 1993 -1.3753 -0.8349 1.0000 -0.5404 -0.8878 722.538
Partial variance for this index is 0.40644
Index 24 CM CPE 2 Index is tuned to the sum of mean full stock sizes (in number) for ages: 2 SORTED BY YEAR
Yr Observed Pred Weight Wt Res Std Res Pred stocksize 1978 -1.6768 -1.4543 1.0000 -0.2225 -0.3655 3673.985 1979 0.1785 0.2196 1.0000 -0.0411 -0.0675 19593.458 1980 0.4402 -0.0129 1.0000 0.4531 0.7444 15529.241 1981 0.1120 -0.1672 1.0000 0.2792 0.4587 13309.001 1982 1.2003 0.5046 1.0000 0.6957 1.1429 26054.357 1983 0.2025 -0.4059 1.0000 0.6084 0.9994 10482.542 1984 -0.9351 -0.8996 1.0000 -0.0355 -0.0583 6398.210 1985 0.2316 0.0764 1.0000 0.1551 0.2549 16980.457 1986 -1.0663 -1.0389 1.0000 -0.0275 -0.0451 5566.408 1987 0.3270 0.5804 1.0000 -0.2535 -0.4164 28107.602 1988 -1.1114 -0.3176 1.0000 -0.7938 -1.3041 11450.502 1989 -0.7681 0.0350 1.0000 -0.8032 -1.3194 16291.908 1990 0.2622 -0.4510 1. 0000 0.7132 1.1716 10020.789 1991 -1.3097 -0.9200 1. 0000 -0.3896 -0.6401 6268.759 1992 -0.4249 -0.0869 1. 0000 -0.3380 -0.5553 14422.116
Partial variance for this index is 0.242914

Page 61
Index 25 CM CPE 3 Index is tuned to the sum of mean full stock sizes (in number) for ages: 3 SORTED BY YEAR
Yr Observed Pred IJeight IJt Res Std Res Pred Stock:size 1978 1.0897 0.7533 1.0000 0.3364 0.5526 19072.683 1979 -1.3745 -1.3278 1.0000 -0.0467 -0.0767 2380.050 1980 0.6565 0.3029 1.0000 0.3536 0.5809 12156.423 1981 0.3089 -0.0014 1.0000 0.3103 0.5098 8966.436 1982 -0.1247 -0.1697 1.0000 0.0450 0.0739 7577.943 1983 0.5261 0.3979 1.0000 0.1282 0.2106 13367.520 1984 -0.1904 -0.5787 1.0000 0.3883 0.6380 5034.046 1985 -0.8783 -0.9796 1.0000 0.1013 0.1664 3371.429 1986 -0.0162 -0.0048 1.0000 -0.0114 -0.0187 8936.205 1987 -1.4785 -1. 0053 1.0000 -0.4732 -0.7774 3285.986 1988 0.1881 0.5623 1.0000 -0.3741 -0.6146 15755.552 1989 -0.4886 -0.2198 1.0000 -0.2687 -0.4415 7207.384 1990 -0.2290 0.0888 1.0000 -0.3178 -0.5221 9813.530 1991 -0.5901 -0.6882 1.0000 0.0981 0.1612 4512.112 1992 -1.2574 -0.9881 1.0000 -0.2693 -0.4424 3342.747
Partial variance for this index is 0.082868
Index 26 CM CPE 4 Index is tuned to the sum of mean full stock: sizes (in number) for ages: 4 SORTED BY YEAR
Yr Observed Pred Weight Wt Res Std Res Pred Stocksize 1978 0.5914 0.2305 1.0000 0.3609 0.5928 6027.359 1979 1.1981 0.7359 1.0000 0.4622 0.7592 9991.696 1980 -1.4134 -1.2785 1.0000 -0.1350 -0.2217 1332.857 1981 0.3986 0.2910 1.0000 0.1076 0.1768 6403.123 1982 0.1258 -0.1346 1.0000 0.2603 0.4277 4183.989 1983 -0.3329 -0.3486 1.0000 0.0157 0.0258 3377.692 1984 0.3896 0.2415 1.0000 0.1481 0.2432 6094.116 1985 -0.8524 -0.8268 1.0000 -0.0256 -0.0420 2093.894 1986 -1.3870 -1.2126 1.0000 -0.1744 -0.2864 1423.586 1987 -0.4228 -0.0780 1.0000 -0.3448 -0.5665 4427.491 1988 -0.9191 -1.1009 1. 0000 0.1818 0.2987 1591.956 1989 0.3081 0.4595 1. 0000 -0.1514 -0.2487 7578.510 1990 -0.5601 -0.2430 1.0000 -0.3171 -0.5209 3753.841 1991 -0.1286 -0.1127 1.0000 -0.0159 -0.0262 4276.606 1992 -1.2802 -0.9078 1.0000 -0.3724 -0.6118 1931.031
PartiaL variance for this index is 0.066329
Index 27 CM CPE 5 Index is tuned to the sum of mean fuLL stock sizes (in number) for ages: 5 SORTED BY YEAR
Yr Observed Pred Wei ght Wt Res Std Res Pred Stock:size 1978 0.4183 -0.0258 1. 0000 0.4441 0.7296 2205.646 1979 0.4176 0.4059 1.0000 0.0117 0.0192 3396.389 1980 0.8601 0.8075 1.0000 0.0526 0.0864 5074.754 1981 -1.3290 -1.0749 1.0000 -0.2541 -0.4175 772.520 1982 0.5350 0.3432 1.0000 0.1918 0.3151 3189.927 1983 0.0639 -0.2235 1.0000 0.2874 0.4721 1809.963 1984 -0.6380 -0.4814 1.0000 -0.1566 -0.2573 1398.555 1985 0.2479 0.1681 1. 0000 0.0798 0.1311 2677.479 1986 -0.9423 -0.8752 1.0000 -0.0671 -0.1102 943.284 1987 -1 .7221 -1.1532 1.0000 -0.5688 -0.9345 714.313 1988 0.0508 -0.1357 1.0000 0.1865 0.3064 1976.103 1989 -1.5970 -1.1095 1.0000 -0.4875 -0.8009 746.272 1990 0.2968 0.4003 1.0000 -0.1035 -0.1700 3377.352 1991 -0.2555 -0.3997 1.0000 0.1442 0.2369 1517.548 1992 -0.2133 -0.4529 1.0000 0.2396 0.3935 1438.968
PartiaL variance for this index is 0.080593

Page 62
Index 28 CM CPE 6 Index is tuned to the sum of mean full stock sizes (in number) for ages: 6 SORTED BY YEAR
Yr Observed Pred Weight Wt Res Std Res Pred Stocksize 1978 -1. 7614 -0.1990 1.0000 -1.5624 -2.5667 933.991 1979 0.2135 0.0842 1.0000 0.1293 0.2124 1239.679 1980 1.2313 0.4113 1.0000 0.8200 1.3471 1719.388 1981 0.8215 0.7864 1.0000 0.0351 0.0577 2502.030 1982 -1.1042 -1.0864 1.0000 -0.0178 -0.0292 384.527 1983 0.5731 0.2337 1.0000 0.3394 0.5575 1439.712 1984 -0.0577 -0.3546 1.0000 0.2969 0.4877 799.363 1985 -0.6304 -0.6405 1.0000 0.0100 0.0165 600.625 1986 0.0686 0.0112 1.0000 0_0574 0.0943 1152.518 1987 -0.9778 -0.9250 1 .0000 -0.0528 -0_0867 451.906 1988 -1.0169 -1.2056 1.0000 0_1888 0.3101 341.320 1989 -0.3721 -0.3951 1.0000 0.0230 0.0378 767.645 1990 -1.3705 -1.1589 1.0000 -0.2116 -0.3476 357.654 1991 0.1325 0_1374 1.0000 -0.0049 -0.0081 1307.526 1992 -0.8788 -0.8284 1.0000 -0.0504 -0.0828 497.725
PartiaL variance for this index is 0.249918
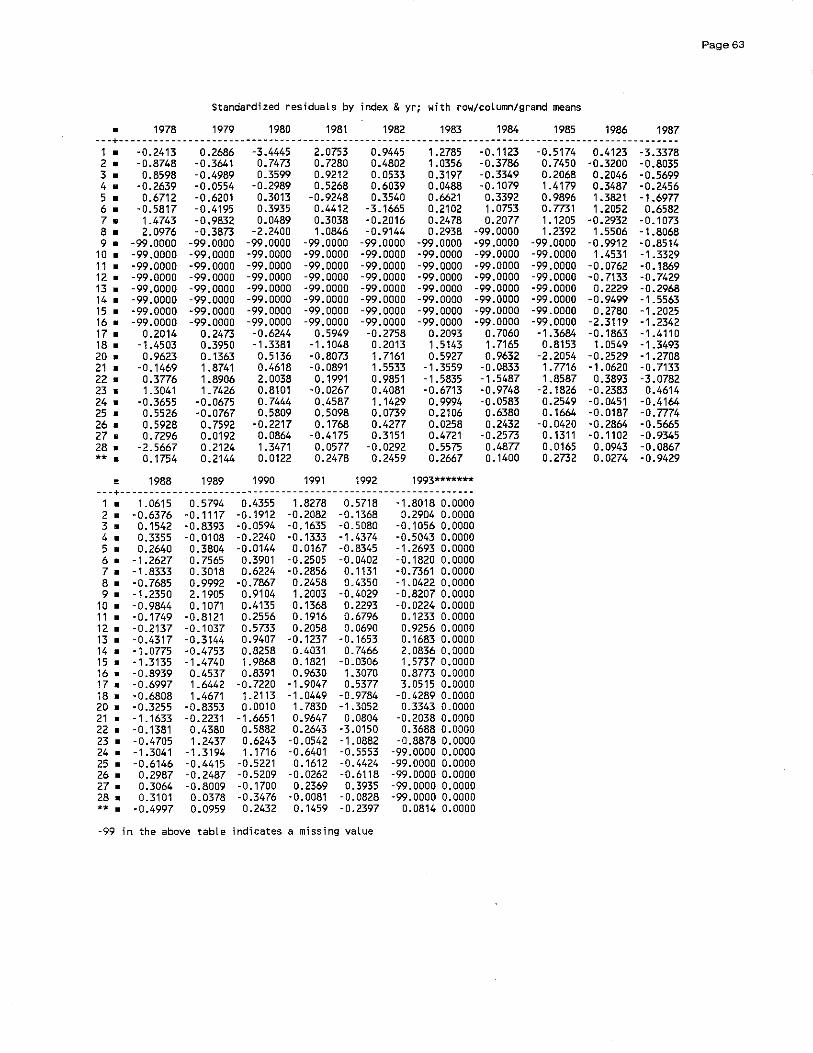
Page 63
Standardized residuals by index & yr; with row/column/grand means
• 1978 1979 1980 1981 1982 1983 1984 1985 1986 1987 ---+--------------------------------------------------------------------------------------------------1 • -0.2413 0.2686 -3_4445 2_0753 0.9445 1.2785 -0.1123 -0.5174 0_4123 -3_3378 2 • -0.8748 -0.3641 0.7473 0.7280 0.4802 1.0356 -0.3786 0.7450 -0_3200 -0_8035 3 • 0.8598 -0.4989 0_3599 0_9212 0.0533 0.3197 -0.3349 0.2068 0_2046 -0.5699 4 • -0.2639 -0.0554 -0_2989 0.5268 0.6039 0.0488 -0.1079 1.4179 0.3487 -0.2456 5 • 0.6712 -0.6201 0.3013 -0.9248 0.3540 0.6621 0.3392 0.9896 1.3821 -1.6977 6 • -0.5817 -0.4195 0.3935 0.4412 -3.1665 0.2102 1.0753 0.7731 1.2052 0.6582 7 • 1.4743 -0.9832 0.0489 0.3038 -0.2016 0.2478 0.2077 1. 1205 -0.2932 -0.1073 8 • 2.0976 -0.3873 -2.2400 1.0846 -0.9144 0.2938 -99.0000 1.2392 1.5506 -1.8068 9 • -99.0000 -99.0000 -99.0000 -99.0000 -99.0000 -99.0000 -99.0000 -99.0000 -0.9912 -0.8514
10 • -99.0000 -99.0000 -99.0000 -99_0000 -99.0000 -99.0000 -99.0000 -99.0000 1.4531 -1.3329 11 • -99.0000 -99.0000 -99.0000 -99.0000 -99.0000 -99.0000 -99.0000 -99.0000 -0.0762 -0.1869 12 • -99.0000 -99.0000 -99.0000 -99.0000 -99.0000 -99.0000 -99.0000 -99.0000 -0.7133 -0.7429 13 • -99.0000 -99.0000 -99.0000 -99.0000 -99.0000 -99.0000 -99.0000 -99.0000 0.2229 -0.2968 14 • -99.0000 -99.0000 -99.0000 -99.0000 -99.0000 -99.0000 -99.0000 -99.0000 -0.9499 -1.5563 15 • -99.0000 -99.0000 -99.0000 -99.0000 -99.0000 -99.0000 -99.0000 -99.0000 0.2780 -1.2025 16 • -99.0000 -99.0000 -99.0000 -99.0000 -99.0000 -99.0000 -99.0000 -99.0000 -2.3119 -1.2342 17 • 0.2014 0.2473 -0.6244 0.5949 -0.2758 0.2093 0.7060 -1.3684 -0.1863 -1.4110 18 • -1.4503 0.3950 -1.3381 -1.1048 0.2013 1.5143 1. 7165 0.8153 1.0549 -1.3493 20 • 0.9623 0.1363 0.5136 -0.8073 1.7161 0.5927 0.9632 -2.2054 -0.2529 -1.2708 21 • -0.1469 1.8741 0.4618 -0.0891 1.5533 -1.3559 -0.0833 1. 7716 -1.0620 -0.7133 22 • 0.3776 1.8906 2.0038 0.1991 0.9851 -1.5835 -1.5487 1.8587 0.3893 -3.0782 23 • 1.3041 1. 7426 0.8101 -0.0267 0_4081 -0.6713 -0.9748 -2.1826 -0.2383 0.4614 24 • -0.3655 -0_0675 0.7444 0.4587 1.1429 0.9994 -0.0583 0.2549 -0.0451 -0.4164 25 • 0.5526 -0.0767 0.5809 0.5098 0.0739 0.2106 0.6380 0.1664 -0.0187 -0.7774 26 • 0.5928 0.7592 -0.2217 0.1768 0.4277 0.0258 0.2432 -0.0420 -0.2864 -0.5665 27 • 0.7296 0.0192 0.0864 -0.4175 0.3151 0.4721 -0.2573 0.1311 -0.1102 -0.9345 28 • -2.5667 0.2124 1.3471 0.0577 -0.0292 0.5575 0.4877 0.0165 0.0943 -0.0867 •• • 0.1754 0_2144 0.0122 0.2478 0.2459 0.2667 0.1400 0.2732 0.0274 -0.9429
• 1988 1989 1990 1991 1992 1993******* ---+--------------------------------------------------------------1 • 1.0615 0_5794 0.4355 1.8278 0.5718 -1.8018 0.0000 2 • -0.6376 -0.1117 -0.1912 -0.2082 -0.1368 0.2904 0.0000 3 • 0.1542 -0.8393 -0.0594 -0_1635 -0.5080 -0.1056 0.0000 4 • 0.3355 -0.0108 -0.2240 -0_1333 -1.4374 -0_5043 0.0000 5 • 0.2640 0.3804 -0.0144 0.0167 -0.8345 -1.2693 0.0000 6 • -1.2627 0.7565 0.3901 -0.2505 -0.0402 -0.1820 0.0000 7 • -1.8333 0.3018 0.6224 -0.2856 0.1131 -0_7361 0.0000 8 • -0.7685 0.9992 -0.7867 0.2458 0.4350 -1. 0422 0.0000 9 • -1.2350 2.1905 0.9104 1 .2003 -0.4029 -0.8207 0.0000
10 • -0.9844 0.1071 0.4135 0.1368 0.2293 -0.0224 0.0000 11 • -0.1749 -0.8121 0.2556 0.1916 0.6796 0.1233 0.0000 12 • -0_2137 -0_1037 0.5733 0.2058 0.0690 0.9256 0.0000 13 • -0.4317 -0.3144 0.9407 -0.1237 -0.1653 0.1683 0.0000 14 • -1.0775 -0.4753 0.8258 0.4031 0.7466 2.0836 0.0000 15 • -1.3135 -1.4740 1.9868 0.1821 -0_0306 1.5737 0.0000 16 • -0.8939 0.4537 0_8391 0.9630 1.3070 0.8773 0_0000 17 • -0.6997 1.6442 -0_7220 -1.9047 0_5377 3.0515 0.0000 18 • -0.6808 1.4671 1_2113 -1.0449 -0_9784 -0.4289 0_0000 20 • -0.3255 -0_8353 0.0010 1.7830 -1.3052 0.3343 0_0000 21 • -1.1633 -0.2231 -1.6651 0.9647 0.0804 -0.2038 0.0000 22 • -0.1381 0.4380 0.5882 0_2643 -3.0150 0.3688 0.0000 23 • -0.4705 1.2437 0.6243 -0.0542 -1. 0882 -0.8878 0.0000 24 • -1.3041 -1.3194 1.1716 -0.6401 -0.5553 -99.0000 0.0000 25 • -0.6146 -0.4415 -0.5221 0.1612 -0.4424 -99.0000 0.0000 26 • 0.2987 -0.2487 -0.5209 -0.0262 -0.6118 -99.0000 0.0000 27 • 0.3064 -0.8009 -0.1700 0.2369 0.3935 -99.0000 0.0000 28 • 0.3101 0_0378 -0.3476 -0.0081 -0.0828 -99.0000 0.0000 •• • -0.4997 0_0959 0.2432 0.1459 -0.2397 0.0814 0.0000
-99 in the above table indicates a missing vaLue

Page 64
Percent of total sum of squares by index & yr; with row/column sums
• 1978 1979 1980 1981 1982 1983 1984 1985 1986 ---+----------------------------------------------------------------------1 • 0.02 0.02 3.63 1.32 0.27 0.50 0.00 0.08 0.05 2 • 0.23 0.04 0.17 0.16 0.07 0.33 0.04 0.17 0.03 3 • 0.23 0.08 0.04 0.26 0.00 0.03 0.03 0.01 0.01 4 • 0.02 0.00 0.03 0.08 0.11 0.00 0.00 0.61 0.04 5 • 0.14 0.12 0.03 0.26 0.04 0.13 0.04 0.30 0.58 6 • 0.10 0.05 0.05 0.06 3.07 0.01 0.35 0.18 0.44 7 • 0.66 0.30 0.00 0.03 0.01 0.02 0.01 0.38 0.03 8 • 1.35 0.05 1.53 0.36 0.26 0.03 '99.00 0.47 0.74 9 • '99.00 -99.00 -99.00 -99.00 -99.00 -99.00 -99.00 -99.00 0.30
10 • '99.00 -99.00 -99.00 -99.00 -99.00 -99.00 -99.00 -99.00 0.65 11 • -99.00 -99.00 -99.00 -99.00 -99.00 -99.00 -99.00 '99.00 0.00 12 • -99.00 -99.00 -99.00 -99.00 '99.00 -99.00 -99.00 -99.00 0.16 13. -99.00 -99.00 -99.00 -99.00 -99.00 -99.00 -99.00 -99.00 0.02 14 • -99.00 -99.00 -99.00 -99.00 -99.00 -99.00 -99.00 -99.00 0.28 15 • -99.00 -99.00 -99.00 -99.00 -99.00 -99.00 -99.00 -99.00 0.02 16 • -99.00 -99.00 -99.00 -99.00 -99.00 -99.00 -99.00 -99.00 1.63 17 • 0.01 0.02 0.12 0.11 0.02 0.01 0.15 0.57 0.01 18 • 0.64 0.05 0.55 0.37 0.01 0.70 0.90 0.20 0.34 20 • 0.28 0.01 0.08 0.20 0.90 0.11 0.28 1.49 0.02 21 • 0.01 1.07 0.07 0.00 0.74 0.56 0.00 0.96 0.34 22 • 0.04 1.09 1.23 0.01 0.30 0.77 0.73 1.06 0.05 23 • 0.52 0.93 0.20 0.00 0.05 0.14 0.29 1.46 0.02 24 • 0.04 0.00 0.17 0.06 0.40 0.31 0.00 0.02 0.00 25 • 0.09 0.00 0.10 0.08 0.00 0.01 0.12 0.01 0.00 26 • 0.11 0.18 0.02 0.01 0.06 0.00 0.02 0.00 0.03 27 • 0.16 0.00 0.00 0.05 0.03 0.07 0.02 0.01 0.00 28 • 2.01 0.01 0.55 0.00 0.00 0.10 0.07 0.00 0.00 ••• 6.68 4.01 8.56 3.44 6.34 3.82 3.09 7.99 5.79
• 1987 1988 1989 1990 1991 1992 1993******* ---+----------------------------------------------------1 • 3.41 0.34 0.10 0.06 1.02 0.10 0.99 11.92 2 • 0.20 0.12 0.00 0.01 0.01 0.01 0.03 1.63 3 • 0.10 0.01 0.22 0.00 0.01 0.08 0.00 1. 11 4 • 0.02 0.03 0.00 0.02 0.01 0.63 0.08 1.69 5 • 0.88 0.02 0.04 0.00 0.00 0.21 0.49 3.29 6 • 0.13 0.49 0.18 0.05 0.02 0.00 0.01 5.20 7 • 0.00 1.03 0.03 0.12 0.02 0.00 0.17 2.82 8 • 1.00 0.18 0.31 0.19 0.02 0.06 0.33 6.85 9 • 0.22 0.47 1.47 0.25 0.44 0.05 0.21 3.41
10 • 0.54 0.30 0.00 0.05 0.01 0.02 0.00 1.56 11 • 0.01 0.01 0.20 0.02 0.01 0.14 0.00 0.40 12 • 0.17 0.01 0.00 0.10 0.01 0.00 0.26 0.72 13 • 0.03 0.06 0.03 0.27 0.00 0.01 0.01 0.42 14 • 0.74 0.36 0.07 0.21 0.05 0.17 1.33 3.20 15 • 0.44 0.53 0.66 1.21 0.01 0.00 0.76 3.63 16 • 0.47 0.24 0.06 0.22 0.28 0.52 0.24 3.66 17 • 0.61 0.15 0.83 0.16 1.11 0.09 2.85 6.82 18 • 0.56 0.14 0.66 0.45 0.33 0.29 0.06 6.26 20 • 0.49 0.03 0.21 0.00 0.97 0.52 0.03 5.63 21 • 0.16 0.41 0.02 0.85 0.28 0.00 0.01 5.49 22 • 2.90 0.01 0.06 0.11 0.02 2.78 0.04 11.19 23 • 0.07 0.07 0.47 0.12 0.00 0.36 0.24 4.93 24 • 0.05 0.52 0.53 0.42 0.13 0.09 -99.00 2.75 25 • 0.18 0.12 0.06 0.08 0.01 0.06 -99.00 0.94 26 • 0.10 0.03 0.02 0.08 0.00 0.11 -99.00 0.75 27 • 0.27 0.03 0.20 0.01 0.02 0.05 -99.00 0.91 28 • 0.00 0.03 0.00 0.04 0.00 0.00 -99.00 2.83 •• • 13.74 5.73 6.43 5.08 4.80 6.37 8.14 100.00
-99 in the above table indicates a missing value
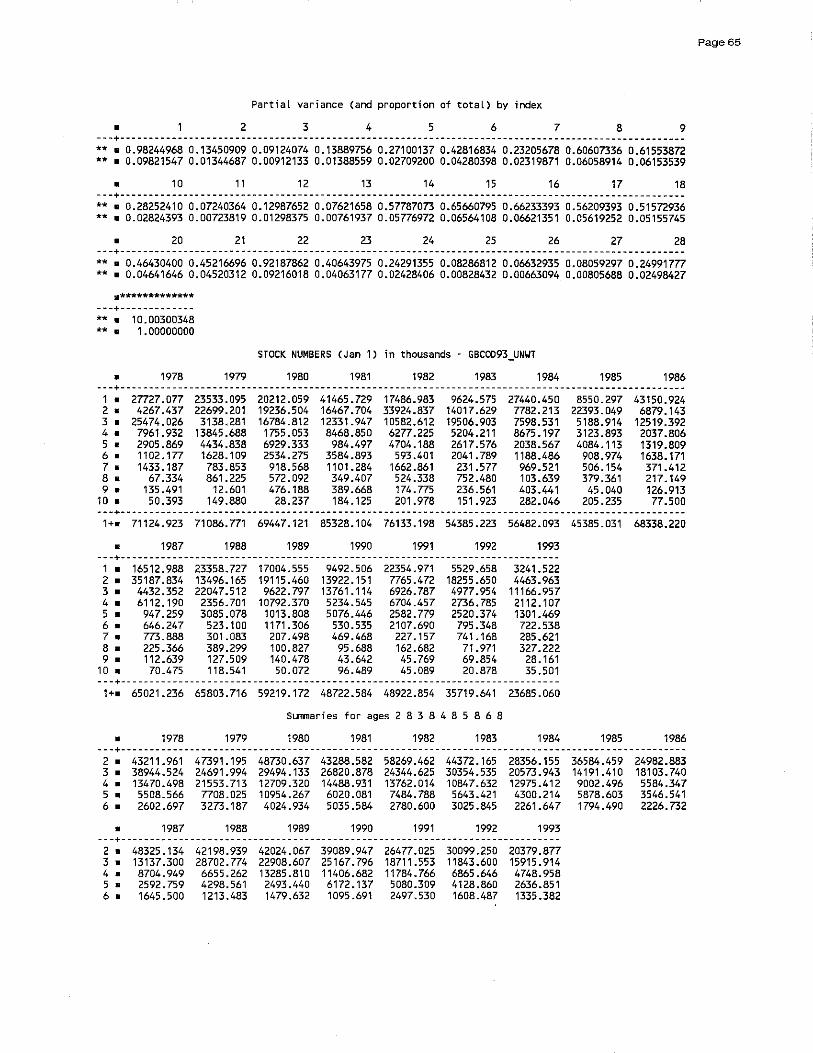
Partial variance (and proportion of total) by index
• 23456789 ---+---------------------------------------------------------------------------------------------------** • 0.98244968 0.13450909 0.09124074 0.13889756 0.27100137 0.42816834 0.23205678 0.60607336 0.61553872 ** • 0.09821547 0.01344687 0.00912133 0.01388559 0.02709200 0.04280398 0.02319871 0.06058914 0.06153539
• 10 11 12 13 14 15 16 17 18 ---+---------------------------------------------------------------------------------------------------** • 0.28252410 0.07240364 0.12987652 0.07621658 0.57787073 0.65660795 0.66233393 0.56209393 0.51572936 ** • 0.02824393 0.00723819 0.01298375 0.00761937 0.05776972 0.06564108 0.06621351 0.05619252 0.05155745
• 20 21 22 23 24 25 26 27 28 ---+---------------------------------------------------------------------------------------------------** • 0.46430400 0.45216696 0.92187862 0.40643975 0.24291355 0.08286812 0.06632935 0.08059297 0.24991777 ** • 0.04641646 0.04520312 0.09216018 0.04063177 0.02428406 0.00828432 0.00663094 0.00805688 0.02498427
.************* ---+-------------**. 10.00300348 **. 1.00000000
STOCK NUMBERS (Jan 1) in thousands - GBCOD93_UNYT
• 1978 1979 1980 1981 1982 1983 1984 1985 1986 ---+---------------------------------------------------------------------------------------------------1. 27727.077 23533.095 20212.059 41465.729 17486.983 9624.575 27440.450 8550.297 43150.924 2. 4267.437 22699.201 19236.504 16467.704 33924.837 14017.629 7782.213 22393.049 6879.143 3. 25474.026 3138.281 16784.812 12331.947 10582.612 19506.903 7598.531 5188.914 12519.392 4. 7961.932 13845.688 1755.053 8468.850 6277.225 5204.211 8675.197 3123.893 2037.806 5. 2905.869 4434.838 6929.333 984.497 4704.188 2617.576 2038.567 4084.113 1319.809 6. 1102.177 1628.109 2534.275 3584.893 593.401 2041.789 1188.486 908.974 1638.171 7. 1433.187 783.853 918.568 1101.284 1662.861 231.577 969.521 506.154 371.412 8 • 67.334 861.225 572.092 349.407 524.338 752.480 103.639 379.361 217.149 9. 135.491 12.601 476.188 389.668 174.775 236.561 403.441 45.040 126.913
10 • 50.393 149.880 28.237 184.125 201.978 151.923 282.046 205.235 77.500 ---+---------------------------------------------------------------------------------------------------1+. 71124.923 71086.771 69447.121 85328.104 76133.198 54385.223 56482.093 45385.031 68338.220
• 1987 1988 1989 1990 1991 1992 1993 ---+-----------------------------------------------------------------------------1 • 16512.988 23358.727 17004.555 9492.506 22354.971 5529.658 3241.522 2 • 35187.834 13496.165 19115.460 13922.151 7765.472 18255.650 4463.963 3 • 4432.352 22047.512 9622.797 13761.114 6926.787 4977.954 11166.957 4 • 6112.190 2356.701 10792.370 5234.545 6704.457 2736.785 2112.107 5 • 947.259 3085.078 1013.808 5076.446 2582.779 2520.374 1301.469 6 • 646.247 523.100 1171.306 530.535 2107.690 795.348 722.538 7 • 773.888 301.083 207.498 469.468 227.157 741. 168 285.621 8 • 225.366 389.299 100.827 95.688 162.682 71.971 327.222 9 • 112.639 127.509 140.478 43.642 45.769 69.854 28.161
10 • 70.475 118.541 50.072 96.489 45.089 20.878 35.501 ---+-----------------------------------------------------------------------------1+. 65021.236 65803.716 59219.172 48722.584 48922.854 35719.641 23685.060
Summaries for ages 2 8 3 8 4 8 5 8 6 8
• 1978 1979 1980 1981 1982 1983 1984 1985 1986 ---+---------------------------------------------------------------------------------------------------2. 43211.961 47391.195 48730.637 43288.582 58269.462 44372.165 28356.155 36584.459 24982.883 3. 38944.524 24691.994 29494.133 26820.878 24344.625 30354.535 20573.943 14191.410 18103.740 4. 13470.498 21553.713 12709.320 14488.931 13762.014 10847.632 12975.412 9002.496 5584.347 5. 5508.566 7708.025 10954.267 6020.081 7484.788 5643.421 4300.214 5878.603 3546.541 6. 2602.697 3273.187 4024.934 5035.584 2780.600 3025.845 2261.647 1794.490 2226.732
• 1987 1988 1989 1990 1991 1992 1993 ---+-----------------------------------------------------------------------------2 • 48325.134 42198.939 42024.067 39089.947 26477.025 30099.250 20379.877 3 • 13137.300 28702.774 22908.607 25167.796 18711.553 11843.600 15915.914 4 • 8704.949 6655.262 13285.810 11406.682 11784.766 6865.646 4748.958 5 • 2592.759 4298.561 2493.440 6172.137 5080.309 4128.860 2636.851 6 • 1645.500 1213.483 1479.632 1095.691 2497.530 1608.487 1335.382
Page 65

Page 66
fISHING MORTALITY - GBC0093_UNWT
• 1978 1979 1980 1981 1982 1983 1984 1985 1986 1987 1988 1989 1990 1991 1992 ---+-----------------------------------------------------------------------------------------------------------1 • 0.0001 0.0016 0.0049 0.0007 0.0211 0.0125 0.0033 0.0175 0.0040 0.0017 0.0005 0.0000 0.0008 0.0026 0.0141 2. 0.1073 0.1019 0.24460.24220.35340.41240.20530.38150.2396 0.2675 0.1383 0.12870.49810.2447 0.2915 3. 0.40970.38120.4841 0.47530.50970.61030.68890.73470.51700.43170.5144 0.4089 0.5191 0.7286 0.6573 4. 0.38520.49220.3781 0.38790.67470.73720.55340.66160.5661 0.48370.64350.55420.50640.7784 0.5433 5. 0.37930.35960.45900.30630.63460.58960.6077 0.7135 0.5141 0.39380.76850.44760.67900.9778 1.0494 6. 0.14080.37240.63340.56820.74100.54480.6536 0.6950 0.5499 0.5638 0.7247 0.7143 0.6482 0.8451 0.8241 7. 0.30930.11490.76660.54210.59290.60400.73830.6463 0.2996 0.48710.89400.57400.85980.9494 0.6176 8. 1.47590.39250.18400.49270.59590.42330.6334 0.8950 0.45640.36950.81930.63740.53750.6454 0.7383 9. 0.39490.43210.49030.46000.59590.62960.6319 0.7242 0.5264 0.46660.56800.49980.56300.8105 0.7383
10. 0.39490.4321 0.49030.46000.59590.62960.63190.72420.5264 0.4666 0.5680 0.4998 0.56300.8105 0.7383
Avg f for ages 2 8 3 8 4 8 5 8 6 8
• 1978 1979 1980 1981 1982 1983 1984 1985 1986 1987 1988 1989 1990 1991 1992 ---+---------------------------------------------------------------------------------_.----------------------2 • 0.4582 0.3164 0.4500 0.4307 0.5860 0.5602 0.5829 0.6754 0.4489 0.4282 0.6432 0.4950 0.6069 0.7385 0.6745 3 • 0.51670.3521 0.48420.4621 0.62480.58490.64590.72430.48380.45490.7274 0.5561 0.6250 0.82080.7383 4 • 0.5381 0.3463 0.4842 0.4594 0.6478 0.5798 0.6373 0.72230.47720.45960.7700 0.5855 0.6462 0.8392 0.7545 5 • 0.5763 0.3099 0.5108 0.4773 0.6411 0.5404 0.6582 0.7374 0.4550 0.4536 0.8016 0.5933 0.6811 0.85440.8074 6 • 0.6420 0.2933 0.5280 0.5343 0.6433 0.5240 0.6751 0.74540.43530.47350.81260.64190.68180.8133 0.7267
Avg F (weighted by N) for ages 2 8 3 8 4 8 5 8 6 8
• 1978 1979 1980 1981 1982 1983 1984 1985 1986 1987 1988 1989 1990 1991 1992 ---+---------------------------------------------------------------------------------------------------------2 • 0.3647 0.2733 0.3917 0.3752 0.4521 0.5552 0.5089 0.5093 0.4428 0.3203 0.4280 0.3295 0.5366 0.6342 0.4615 3 • 0.3929 0.4309 0.4877 0.4569 0.5896 0.6212 0.6237 0.7111 0.5201 0.46180.56420.49720.5579 0.79590.7236 4.0.36130.43820.49250.44120.65100.64080.5855 0.6975 0.5270 0.4772 0.72940.5611 0.60460.83550.7717 5 • 0.3268 0.3411 0.51080.51620.6311 0.55180.6504 0.7166 0.5046 0.4619 0.7765 0.5911 0.6879 0.91090.9231 6.0.2681 0.31600.59990.55720.62510.5191 0.68900.72350.49900.50110.79700.68940.7292 0.8416 0.7251
Avg F (wt by catch) for ages 2 8 3 8 4 8 5 8 6 8
• 1978 1979 1980 1981 1982 1983 1984 1985 1986 1987 1988 1989 1990 1991 1992 ---+---------------------------------------------------------------------------------------------------------2 • 0.3910 0.3748 0.4302 0.4056 0.4791 0.57180.5730 0.5484 0.4752 0.3404 0.5215 0.4305 0.54290.72280.5525 3 • 0.4008 0.4446 0.4987 0.4646 0.5965 0.62560.62870.71280.5223 0.4645 0.5758 0.5086 0.5657 0.8015 0.7531 4 • 0.3820 0.4529 0.5179 0.4550 0.6523 0.6524 0.5891 0.69970.53400.4800 0.7341 0.5652 0.6162 0.84070.8167 5 .0.3765 0.3573 0.5358 0.5307 0.6326 0.5560 0.6532 0.7189 0.5138 0.4708 0.7778 0.6109 0.6906 0.9154 0.9440 6 • 0.3719 0.3537 0.6460 0.5578 0.6291 0.5241 0.6908 0.7310 0.5136 0.5075 0.8009 0.6920 0.7421 0.8445 0.7348
BACKCALCULATED PARTIAL RECRUITMENT
• 1978 1979 1980 1981 1982 1983 1984 1985 1986 1987 1988 1989 1990 1991 1992 ---+---------------------------------------------------------------------------------------------------------1 • 0.0001 0.0032 0.0064 0.0013 0.0285 0.0169 0.0044 0.0195 0.0071 0.0031 0.0005 0.0000 0.0009 0.0026 0.0134 2.0.07270.20690.31910.42620.47690.55930.2781 0.42620.42320.47450.15470.18010.57930.25020.2778 3 • 0.27760.77440.6315 0.8365 0.68800.8278 0.9330 0.8208 0.9133 0.7656 0.5754 0.5724 0.6037 0.7451 0.6264 4.0.26101.00000.49330.68280.9105 1.00000.74950.73921.00000.85790.71990.77590.5890 0.7960 0.5177 5 .0.25700.73050.59880.53900.85650.79970.8231 0.79720.9081 0.69850.85960.62660.78971.00001.0000 6 • 0.0954 0.7565 0.8263 1.0000 1.0000 0.7390 0.8853 0.7766 0.9715 1.0000 0.8106 1.0000 0.7539 0.8643 0.7853 7.0.20960.2335 1.00000.9541 0.80020.81931.00000.7221 0.52930.86391.00000.80361.00000.97090.5885 8. 1.00000.79750.24000.86720.80430.57420.8579 1.0000 0.80630.65540.91650.89230.6251 0.66000.7036 9 .0.26760.87780.63970.80960.8043 0.8540 0.8559 0.8092 0.9300 0.8275 0.6354 0.6998 0.6548 0.8289 0.7036
10 .0.26760.87780.63970.80960.8043 0.8540 0.8559 0.8092 0.9300 0.8275 0.6354 0.6998 0.6548 0.8289 0.7036

MEAN BIOMASS (MTl
• 1978 1979 1980 1981 1982 1983 1984 1985 ---+---------------------------------------------------------------------.------.-----.-----.----1. 17766.460 18946.961 15278.735 33136.064 12001.644 8419.343 26147.370 6969.804 2. 4812.920 29272.626 22672.692 19896.957 36528.209 15618.988 10461.074 24078.289 3. 46937.873 5114.727 30002.051 21142.855 20187.641 31774.595 12338.448 7032.800 4. 20908.910 42075.033 4888.921 21866.665 16041.415 11176.784 22054.605 8138.965 5. 9563.682 16601.547 28657.134 4027.146 17072.492 8392.800 7108.855 13620.336 6 • 5405.008 8898.416 11478.634 18069.660 2503.657 9204.080 5261.409 3851.208 7. 8281.261 6174.869 4940.374 6658.901 10750.000 1267.290 5603.391 2765.205 8. 277.338 6701.428 4317.790 2492.662 3578.364 5759.605 710.477 2359.900 9 • 1203.479 109.270 2899.958 4042.086 1506.816 1804.885 3095.831 335.620
10. 501.357 1402.595 314.064 2502.346 2329.075 1502.616 2940.361 1807.392 ---+----------------------------------------------------------------------------.-----.----------1+0 115658.287 135297.473 125450.352 133835.342 122499.311 94920.985 95721.821 70959.519
• 1986 1987 1988 1989 1990 1991 1992 ---+---------------------------------------------------.-----.-----------------_. 1 • 36262.677 10856.526 16636.674 12468.319 7146.689 22543.078 5714.528 2. 8210.452 41627.359 17404.763 26344.015 15632.432 10199.270 22238.902 3. 21866.893 8198.535 37167.348 16353.554 24160.912 11496.861 8236.528 4. 5210.324 18537.905 5589.357 28586.138 13221.029 14625.993 7420.951 5. 5285.220 4150.160 10672.934 4026.884 16522.007 7237.185 6768.907 6. 8287.754 3491.425 2268.757 5138.613 2265.024 7702.635 3063.994 7. 2606.156 5009.155 1606.470 1187.687 2447.798 1000.481 3801.816 8. 1585.013 1720.413 2437.936 731.932 720.744 1155.152 459.703 9. 1144.545 938.413 991.714 1178.575 384.050 279.001 546.467
10 • 776.984 771.607 1265.749 616.219 980.449 436.234 257.672 ---+---------------------------------------------------.-----.-----._----._----.-1+. 91236.017 95301.498 96041.702 96631.935 83481.134 76675.892 58509.469
Summaries for ages 2 8 3 8 4 8 5 8 6 8
• 1978 1979 1980 1981 1982 1983 1984 1985 ---+-------------------------------------------------------------------------------------------2 • 96186.991 114838.647 106957.596 94154.846 106661.777 83194.141 63538.259 61846.703 3 • 91374.071 85566.021 84284.904 74257.889 70133.568 67575.153 53077.185 37768.414 4 • 44436.198 80451.294 54282.853 53115.034 49945.927 35800.558 40738.738 30735.614 5 • 23527.288 38376.261 49393.931 31248.369 33904.512 24623.774 18684.132 22596.649 6 • 13963.606 21774.714 20736.798 27221.223 16832.020 16230.974 11575.277 8976.314
• 1986 1987 1988 1989 1990 1991 1992 ---+-----------------------------------------------------------------------------2 • 53051.811 82734.952 77147.565 82368.822 74969.945 53417.578 51990.801 3 • 44841.359 41107.593 59742.803 56024.807 59337.513 43218.307 29751.899 4 • 22974.467 32909.058 22575.454 39671.253 35176.601 31721.446 21515.371 5 • 17764.143 14371.153 16986.097 11085.115 21955.572 17095.453 14094.420 6 • 12478.923 10220.992 6313.163 7058.231 5433.565 9858.268 7325.514
Page 67

Page 68
CATCH BIOMASS (MT)
• 1978 1979 1980 1981 1982 1983 1984 1985 1986 ---+---------------------------------------------------------------------------------------------------1 • 1.416 30.277 74.534 23.854 253.727 105.065 85.440 121.776 145.175 2 • 516.611 2981.571 5546.116 4818.822 12908.302 6440.659 2147.828 9185.187 1966.927 3 • 19229.765 1949.611 14523.386 10048.462 10290.530 19392.046 8499.649 5166.652 11305.046 4 • 8053.707 20709.767 1848.615 8482.986 10822.814 8239.760 12204.212 5384.679 2949.337 5 • 3627.630 5969.641 13154.624 1233.354 10834.664 4948.128 4319.950 9718.443 2716.928 6 • 761.142 3313.407 7270.922 10266.985 1855.110 5014.189 3438.828 2676.607 4557.508 7 • 2561.392 709.626 3787.184 3609.763 6373.898 765.435 4137.057 1787.030 780.773 8 • 409.324 2630.606 794.489 1228.226 2132.453 2438.286 449.994 2112.083 723.402 9 • 475.288 47.211 1421.984 1859.280 897.985 1136.312 1956.321 243.057 602.505
10 • 198.000 606.000 154.000 1151.030 1388.009 946.010 1858.076 1308.918 409.016 ---+---------------------------------------------------------------------------------------------------1+. 35834.275 38947.717 48575.854 42722.761 57757.491 49425.888 39097.355 37704.432 26156.619
• 1987 1988 1989 1990 1991 1992 ---+------------------------------------------------------------------1 • 18.908 7.873 0.001 5.827 58.027 80.513 2 • 11135.345 2406.567 3389.174 7786.282 2495.438 6482.986 3 • 3539.041 19117.409 6686.233 12541.307 8376.751 5414.142 4 • 8966.938 3597.026 15843.239 6695.314 11384.367 4031. 730 5 • 1634.329 8201.692 1802.367 11218.750 7076.823 7103.236 6 • 1968.449 1644.058 3670.387 1468.284 6509.658 2525.077 7 • 2439.848 1436.152 681. 762 2104.616 949.833 2347.955 8 • 635.756 1997.388 466.521 387.394 745.519 339.419 9 • 437.824 563.341 589.074 216.219 226.137 403.480
10 • 360.000 719.006 307.998 551.988 353.579 190.250 ---+------------------------------------------------------------------1+. 31136.439 39690.512 33436.755 42975.982 38176.133 28918.788
Summaries for ages 2 8 3 8 4 8 5 8 6 8
• 1978 1979 1980 1981 1982 1983 1984 1985 1986 ---+---------------------------------------------------------------------------------------------------2 • 35159.571 38264.229 46925.336 39688.597 55217.771 47238.502 35197.519 36030.681 24999.922 3 • 34642.960 35282.657 41379.220 34869.776 42309.469 40797.843 33049.691 26845.494 23032.995 4 • 15413.195 33333.047 26855.834 24821.314 32018.939 21405.797 24550.041 21678.842 11727.949 5 • 7359.489 12623.279 25007.219 16338.328 21196.125 13166.038 12345.829 16294.163 8778.612 6 • 3731.859 6653.639 11852.595 15104.974 10361.461 8217.910 8025.879 6575.720 6061.684
• 1987 1988 1989 1990 1991 1992 ---+------------------------------------------------------------------2 • 30319.707 38400.292 32539.682 42201.948 37538.389 28244.544 3 • 19184.361 35993.724 29150.508 34415.666 35042.951 21761.559 4 • 15645.321 16876.315 22464.275 21874.359 26666.200 16347.417 5 • 6678.383 13279.289 6621.036 15179.045 15281.833 12315.687 6 • 5044.053 5077.597 4818.670 3960.295 8205.010 5212.451

SSB AT THE START OF THE SPAWNING SEASON ~ males & females (MT)
• 1978 1979 1980 1981 1982 1983 1984 1985 1986 ~--+-------------------------------------------------- -------------------------------------------------
1. 913.000 1104.990 854.801 1963.743 1201.012 903.675 3129.126 762.422 7058.213 2. 1409.887 7542.601 6919.003 5814.637 16168.175 6351.309 4307.505 11672.574 4732.503 3. 33769.736 3727.906 22430.230 15947.311 15760.740 26133.224 10517.728 6888.204 18830.924 4. 20261.205 38125.921 4295.761 21399.245 15823.893 12820.066 21768.014 8101.587 4856.535 5. 8891.351 16635.405 30274.770 3956.594 17499.019 9675.681 7307.344 15048.271 5468.056 6. 4783.710 8256.441 12599.105 20141.849 2955.247 10548.763 5695.004 4470.055 8743.666 7. 8209.056 5421.932 6067.595 7358.608 11980.836 1458.404 6257.391 3208.909 2583.717 8. 368.419 6803.969 4902.475 2835.402 4227.696 6655.757 809.103 3018.277 1747.510 9. 1227.464 113.036 3957.828 3961.480 1701.833 2171.542 3786.798 414.696 1281.328
10. 602.389 1703.011 387.575 3062.148 2957.965 1925.513 3770.241 2374.014 968.398 ---+---------------~---------------------------------- -------------------------------------------------
1+. 80436.217 89435.211 92689.141 86441.018 90276.415 78643.934 67348.254 55959.010 56270.850
• 1987 1988 1989 1990 1991 1992 ---+---------------------------------~-~-~---~-------- ----------------1. 1842.600 2847.359 2203.810 1253.944 4706.757 1234.030 2. 24434.998 8576.118 13056.829 8910.123 5365.986 14108.403 3. 6964.278 33290.860 14692.732 22163.344 10764.816 7862.093 4. 17107.755 5938.968 27822.039 12890.648 16196.313 7414.636 5. 3956.473 12483.645 3961.176 18834.349 8698.081 8208.420 6. 3743.600 2786.404 6047.275 2692.430 9505.633 3633.100 7. 5536.273 2065.908 1348.276 2960.089 1284.782 4301.415 8. 1936.413 3105.238 850.468 791.753 1332.685 525.732 9. 1074.409 1185.004 1349.289 446.236 392.752 672.859
10. 945.955 1595.512 762.444 1234.198 585.693 339.683 ---+------------------------------------------------------------------1+. 67542.755 73875.015 72094.339 72177.114 58833.498 48300.372
The above SSBs by age (a) and year (y) are calculated following the algorithm used in the NEFSC projection program, i.e.
where
SSBea,Y) = wea,Y) x pea,Y) x Nea,Y) x exp[·zea,Y)]
= 0.1667 x Mea,Y) + 0.1667 x Fea,y) Jan 1 stock size estimates (maLes & femaLes)
- proportion mature (generalLy females)
zea,Y) N(a,y) pea,Y) wea,Y) - weight at age at the beginning of the spawning season (ie, March 1)
The W(a,Y) are assumed to be the same as the Jan1 weight at age estimates (see "WT AT AGEl! table in input section). Jan1 weights at age are calcuLated as geometric means in ADAPT from the mid-year weight at age estimates (from the catch) of the cohort in successive years.
MEAN STOCK NUMBERS (thousands) - GBCOD93_UNWT
• 1978 1979 1980 1981 1982 1983 1984 1985 1986 ---+-------------------------------------------------- -----------------------------------~-------------
1 • 25129.364 21312.667 18275.998 37569.234 15688.423 8670.796 24831.310 7684.458 39034.098 2 • 3673.985 19593.458 15529.241 13309.001 26054.357 10482.542 6398.210 16980.457 5566.408 3 • 19072.683 2380.050 12156.423 8966.436 7577.943 13367.520 5034.046 3371.429 8936.205 4 • 6027.359 9991.696 1332.857 6403.123 4183.989 3377.692 6094.116 2093.894 1423.586 5 • 2205.646 3396.389 5074.754 772.520 3189.927 1809.963 1398.555 2677.479 943.284 6 • 933.991 1239.679 1719.388 2502.030 384.527 1439.712 799.363 600.625 1152.518 7 • 1123.035 672.424 588.841 777.455 1148.136 159.127 628.958 341.510 292.334 8 • 32.659 649.804 475.057 252.090 361.560 559.946 70.316 230.549 159.218 9 • 102.120 9.340 343.923 285.257 120.516 160.763 273.895 29.394 90.214
10 • 37.982 111.097 20.394 134.788 139.274 103.244 191.480 133.940 55.090 ---+---------------------------------------------------------------------------------------------------1+. 58338.823 59356.603 55516.875 70971.933 58848.655 40131.307 45720.250 34143.735 57652.953
• 1987 1988 1989 1990 1991 1992 ---+------------------------------------------------------------------1 • 14953.893 21166.252 15412.014 8600.107 20236.157 4977.812 2 • 28107.602 11450.502 16291.908 10020.789 6268.759 14422.116 3 • 3285.986 15755.552 7207.384 9813.530 4512.112 3342.747 4 • 4427.491 1591.956 7578.510 3753.841 4276.606 1931.031 5 • 714.313 1976.103 746.272 3377.352 1517.548 1438.968 6 • 451.906 341.320 767.645 357.654 1307.526 497.725 7 • 559.745 183.053 144.452 289.475 135.018 506.301 8 • 171.818 244.111 68.290 67.688 109.805 46.689 9 • 82.216 88.999 101.035 30.529 28.805 45.316
10 • 51.440 82.739 36.013 67.496 28.377 13.544 ---+------------------------------------------------------------------1+. 52806.410 52880.588 48353.522 36378.462 38420.711 27222.249
Time stamp at end of run 1993 11 13 18 42 0
Page 69
Page 71
Appendix 2
Precision of Estimates of 1992 F and SSB

BOOTSTRAP RESULTS FOR GBCOD93 UNYT COO: GEORGES BANK STOCK -
Timestamp 1993 11 Z3 9 53 51
SEEO FOR THE RANDOM NUMBER GENERATOR: 74747 MAIN LOOP LIMIT IN MARQUARDT ALGORITHM: 50 NUMBER OF BOOTSTRAP REPLICATIONS ATTEMPTED: ZOO NUMBER FOR YHICH NLLS CONVERGEO: ZOO
Results from the converged replications are used for computing the statistics that follow. Other replications are ignored.
Appendix Z: TabLe 1. BOOTSTRAP OUTPUT VARIABLE: N_hat Age-specific stocksizes (on Jan 1, 1993) estimated by NllS
AGE
1 2 3 4 5 6 7 8
ADAPT ESTIMATE
3.242E3 4.464E3 1.117E4 2.112E3 1.301E3 7.225EZ 2.856E2 3.272E2
BIAS AGE ESTIMATE
BOOTSTRAP MEAN
3.410E3 4.478E3 1. 128E4 2.125E3 1.352E3 7.496EZ 3.070E2 3.452E2
BIAS STO ERROR
BOOTSTRAP STO ERROR
1.009E3 1. 178E3 Z.468E3 5.792E2 3.476E2 2.314EZ 1.020E2 1.131E2
PERCENT BIAS
C.V. FOR ADAPT SOLN
0.31 0.26 0.22 0.27 0.27 0.3Z 0.36 0.35
ADAPT EST CORRECTED
FOR BIAS
C.V FOR CORRECTED ESTIMATE
-------------------------------------------------------------------------1 1.685E2 7.137E1 5.20 3.D73E3 0.33 2 1.372E1 8.33DE1 0.31 4.450E3 0.26 3 1.132E2 1. 745E2 1.01 1. 105E4 0.22 4 1.315E1 4.096E1 0.62 2.D99E3 0.28 5 5.D41E1 2.458E1 3.87 1.251E3 0.28 6 2.7D5E1 1.636E1 3.74 6.955E2 0.33 7 2.142E1 7.214EO 7.50 2.642E2 0.39 8 1. 794E1 7.996EO 5.48 3.D93E2 0.37
Page 73
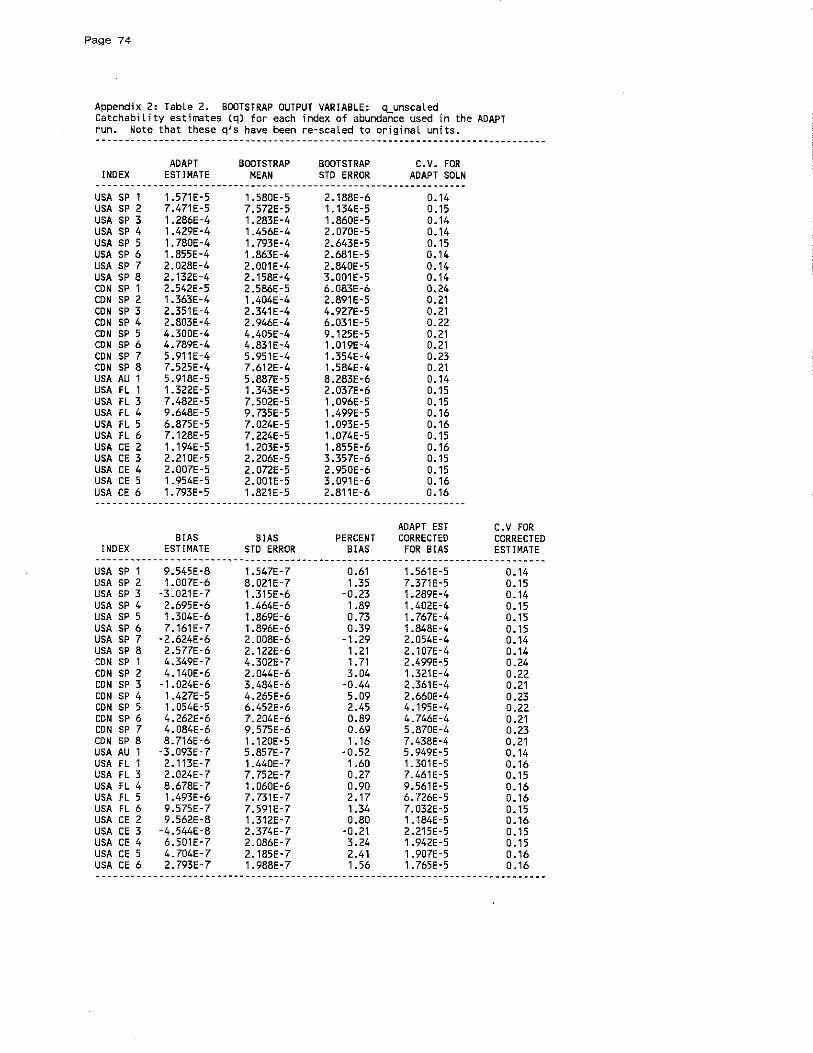
Page 74
Appendix 2: Table 2. BOOTSTRAP OUTPUT VARIABLE: CLunscaled Catchability estimates (q) for each index of abundance used in the ADAPT run. Note that these q/s have been re-scaled to original units. -------------------------------------------------------------------------------
AOAPT BOOTSTRAP BOOTSTRAP C.V. FOR INDEX ESTIMATE MEAN STO ERROR AOAPT SOLN
-----------------------------------------------------------------USA SP 1 1.571E-5 1.580E-5 2.188E-6 0.14 USA SP 2 7.471E-5 7.572E-5 1.134E-5 0.15 USA SP 3 1.286E-4 1.283E-4 1.860E-5 0.14 USA SP 4 1.429E-4 1.456E-4 2.070E-5 0.14 USA SP 5 1. 780E-4 1.793E-4 2.643E-5 0.15 USA SP 6 1.855E-4 1.863E-4 2.681E-5 0.14 USA SP 7 2.028E-4 2.001E-4 2.840E-5 0.14 USA SP 8 2.132E-4 2.158E-4 3.001E-5 0.14 CON SP 1 2.542E-5 2.586E-5 6.083E-6 0.24 CON SP 2 1.363E-4 1.404E-4 2.891E-5 0.21 CON SP 3 2.351E-4 2.341E-4 4.927E-5 0.21 CON SP 4 2.803E-4 2.946E-4 6.031E-5 0.22 CON SP 5 4.300E-4 4.405E-4 9.125E-5 0.21 CON SP 6 4.789E-4 4.831E-4 1.019E-4 0.21 CON SP 7 5.911E-4 5.951E-4 1.354E-4 0.23 CON SP 8 7.525E-4 7.612E-4 1.584E-4 0.21 USA AU 1 5.918E-5 5.887E-5 8.283E-6 0.14 USA FL 1 1.322E-5 1.343E-5 2.037E-6 0.15 USA FL 3 7.482E-5 7.502E-5 1.096E-5 0.15 USA FL 4 9.648E-5 9.735E-5 1.499E-5 0.16 USA FL 5 6.875E-5 7.024E-5 1.093E-5 0.16 USA FL 6 7.128E-5 7.224E-5 1.074E-5 0.15 USA CE 2 1.194E-5 1.203E-5 1.855E-6 0.16 USA CE 3 2.210E-5 2.206E-5 3.357E-6 0.15 USA CE 4 2.007E-5 2.072E-5 2.950E-6 0.15 USA CE 5 1.954E-5 2.001E-5 3.091E-6 0.16 USA CE 6 1.793E-5 1.821E-5 2.811E-6 0.16 -----------------------------------------------------------------
AOAPT EST C.V FOR BIAS BIAS PERCENT CORRECTED CORRECTED
INOEX ESTIMATE STO ERROR BIAS FOR BIAS ESTIMATE -------------------------------------------------------------------------------USA SP 1 9.545E-8 1.547E-7 0.61 1.561E-5 0.14 USA SP 2 1.007E-6 8.021E-7 1.35 7.371E-5 0.15 USA SP 3 -3.021E-7 1.315E-6 -0.23 1.289E-4 0.14 USA SP 4 2.695E-6 1.464E-6 1.89 1.402E-4 0.15 USA SP 5 1.304E-6 1.869E-6 0.73 1.767E-4 0.15 USA SP 6 7.161E-7 1.896E-6 0.39 1.848E-4 0.15 USA SP 7 -2.624E-6 2.008E-6 -1.29 2.054E-4 0.14 USA SP 8 2.577E-6 2.122E-6 1.21 2.107E-4 0.14 CON SP 1 4.349E-7 4.302E-7 1.71 2.499E-5 0.24 CON SP 2 4.140E-6 2.044E-6 3.04 1.321E-4 0.22 CON SP 3 -1.024E-6 3.484E-6 -0.44 2.361E-4 0.21 CON SP 4 1.427E-5 4.265E-6 5.09 2.660E-4 0.23 CON SP 5 1.054E-5 6.452E-6 2.45 4.195E-4 0.22 CON SP 6 4.262E-6 7.204E-6 0.89 4.746E-4 0.21 CON SP 7 4.084E-6 9.575E-6 0.69 5.870E-4 0.23 CON SP 8 8.716E-6 1.120E-5 1.16 7.438E-4 0.21 USA AU 1 -3.093E-7 5.857E-7 -0.52 5.949E-5 0.14 USA FL 1 2.113E-7 1.440E-7 1.60 1.301E-5 0.16 USA FL 3 2.024E-7 7.752E-7 0.27 7.461E-5 0.15 USA FL 4 8.678E-7 1.060E-6 0.90 9.561E-5 0.16 USA FL 5 1.493E-6 7.731E-7 2.17 6.726E-5 0.16 USA FL 6 9.575E-7 7.591E-7 1.34 7.032E-5 0.15 USA CE 2 9.562E-8 1.312E-7 0.80 1.184E-5 0.16 USA CE 3 -4.544E-8 2.374E-7 -0.21 2.215E-5 0.15 USA CE 4 6.501E-7 2.086E-7 3.24 1.942E-5 0.15 USA CE 5 4.704E-7 2.185E-7 2.41 1.907E-5 0.16 USA CE 6 2.793E-7 1.988E-7 1.56 1.765E-5 0.16 -------------------------------------------------------------------------------
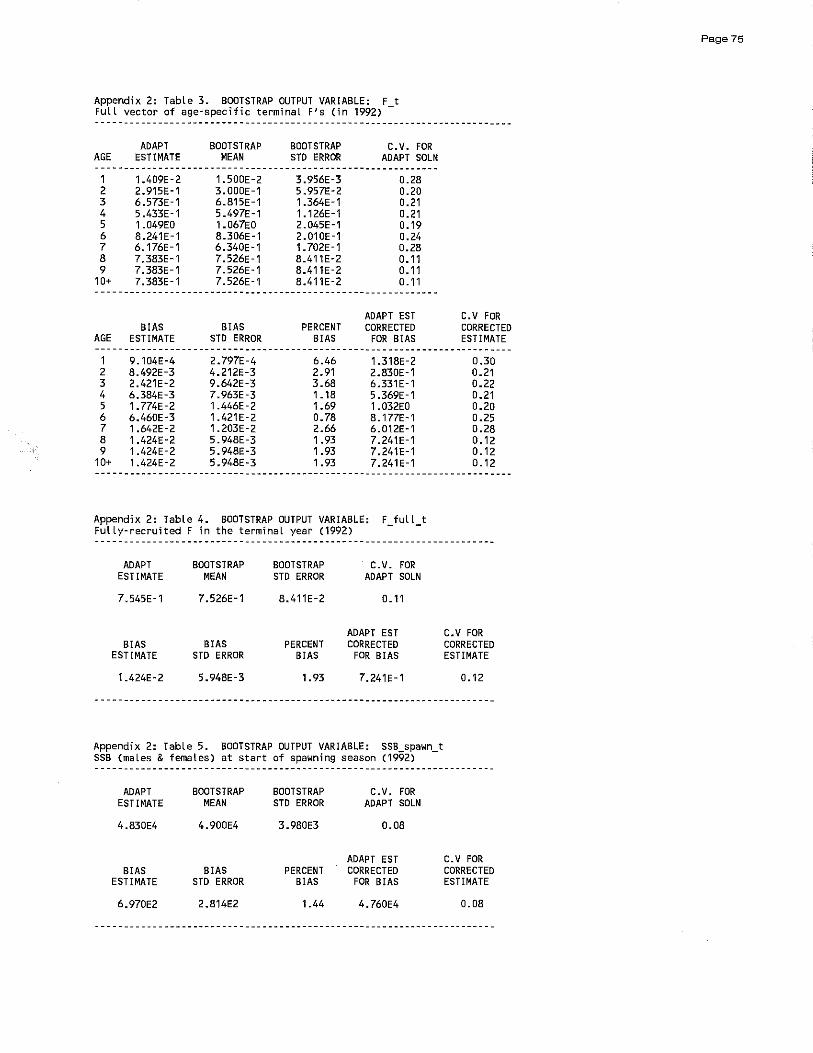
Appendix 2: TabLe 3. BOOTSTRAP OUTPUT VARIABLE: F t FulL vector of age~specific terminal Fls (in 1992) -
AGE
1 2 3 4 5 6 7 8 9
10+
AGE
ADAPT ESTIMATE
1.409E·2 2.915E·1 6.573E·1 5.433E·1 1.049EO 8.241E-1 6.176E-1 7.383E-1 7.383E-1 7.383E-1
BIAS ESTIMATE
BOOTSTRAP MEAN
1.500E-2 3.000E-1 6.815E-1 5.497E-1 1.067EO 8.306E-1 6.340E-1 7.526E-1 7.526E-1 7.526E-1
BIAS STO ERROR
BOOTSTRAP STO ERROR
3.956E-3 5.957E-2 1.364E-1 1.126E-1 2.045E-1 2.01 OE-1 1. 702E-1 8.411E-2 8.411E-2 8.411E-2
PERCENT BIAS
C.V. FOR ADAPT SOLN
0.28 0.20 0.21 0.21 0.19 0.24 0.28 0.11 0.11 0.11
ADAPT EST CORRECTED
FOR BIAS
C. V FOR CORRECTED ESTIMATE
~-------------------~~-~------------------------~~~~~--~-----------------
1 9.104E-4 2.797E-4 6.46 1.318E-2 2 8.492E-3 4.212E-3 2.91 2.830E-1 3 2.421E-2 9.642E-3 3.68 6.331E-1 4 6.384E-3 7.963E-3 1.18 5.369E-1 5 1.774E-2 1.446E-2 1.69 1.032EO 6 6.460E-3 1.421E-2 0.78 8.177E-1 7 1.642E-2 1.203E-2 2.66 6.012E-1 8 1.424E-2 5.948E-3 1.93 7.241E-1 9 1.424E-2 5.948E-3 1.93 7.241E-1
10+ 1.424E-2 5.948E-3 1.93 7.241E-1
Appendix 2: Table 4. BOOTSTRAP OUTPUT VARIABLE: F_full_t Fully-recruited F in the terminal year (1992)
ADAPT BOOTSTRAP BOOTSTRAP C.V. FOR ESTIMATE MEAN STO ERROR ADAPT SOLN
7.545E-1 7.526E-1 8.411E-2 0.11
ADAPT EST BIAS BIAS PERCENT CORRECTED
ESTIMATE STD ERROR BIAS FOR BIAS
1.424E-2 5.948E-3 1.93 7.241E-1
Appendix 2: TabLe 5. BOOTSTRAP OUTPUT VARIABLE: SSB_spawn_t SSB (maLes & females) at start of spawning season (1992)
ADAPT BOOTSTRAP BOOTSTRAP C.V. FOR ESTIMATE MEAN STO ERROR ADAPT SOLN
4.830E4 4.900E4 3.980E3 0.08
ADAPT EST BIAS BIAS PERCENT CORRECTED
ESTIMATE STD ERROR BIAS FOR BIAS
6.970E2 2.814E2 1.44 4.760E4
0.30 0.21 0.22 0.21 0.20 0.25 0.28 0.12 0.12 0.12
C.V FOR CORRECTED ESTIMATE
0.12
C.V FOR CORRECTED ESTIMATE
0.08
Page 75