Embed Size (px)
Citation preview
Assessment of the effects of diets containing DDGS with supplemental tallow on fat
digestibility, growth performance, carcass and pork fat quality in growing-finishing pigs
A THESIS
SUBMITTED TO THE FACULTY OF THE GRADUATE SCHOOL OF THE
UNIVERSITY OF MINNESOTA BY
Jenna Pomerenke
IN PARTIAL FULFILLMENT OF THE REQUIREMENTS
FOR THE DEGREE OF MASTER OF SCIENCE
Gerald C. Shurson (Advisor)
May, 2012

© Jenna Pomerenke, 2012

i
Acknowledgements
First and foremost, I need to thank my parents, Dave and Brenda Pomerenke, for
their continued love, support, and encouragement. Thanks, Dad and Mom, for raising me
on a family farm where my love for pigs became a passion for this great industry.
Additionally, I need to thank my husband, Brad Davis. Even though I’m now a dairy
farmer’s wife, I thank you for supporting my dreams and ambitions on the swine side.
Thank you so much for being a shoulder to cry on, an ear to listen, and even helping with
my research projects. I love you!
I also owe a great amount of thanks to Ralco Nutrition—specifically Dr. Jeff
Knott and Dr. Russell Fent. You both helped guide me to this career path. Thank you for
planting the “grad school/swine nutrition” seed in my mind. Furthermore, I thank Ralco
for sponsoring me thorough my time as a grad student. Without your financial
contribution, I never would have been here today.
The guidance from my committee members has been invaluable throughout the
past three years. Thank you for pushing me to think more about the issue at hand. You
all helped me strive to do the best in all aspects of my life. Thank you Dr. Lee Johnston
for all of your assistance with statistical questions and pushing me to think; Dr. Sam
Baidoo for your help with my digestibility trail; Dr. Dan Gallaher for teaching me the
fundamental principles of nutrition and use of your lab; and Dr. Jerry Shurson for all of
your guidance and support throughout the years. Jerry, thank you for all the great
opportunities throughout the past three years—from participating in National Pork Board
events to helping teach producers about diet formulation and more. I appreciate all you
have done over the past few years. Thank you for being a terrific advisor.
Finally, thank you to all of the graduate students, SROC staff, and meat lab staff
who assisted in data collection. I know the hours were long, but this research would not
have been possible without your help. I greatly appreciated your help. A special thanks
goes out to my fellow swine grad students: Christina Phillips, Ran Song, Xaiojing Li, Pai
Liu, Devi Pangeni, Andrea Hanson, and Erin Harris; thank you for making my time in
school enjoyable and memorable.

ii
Table of Contents
Page
Acknowledgements i
Table of Contents ii
List of Tables iv
List of Figures v
Chapter 1. Literature Review
Introduction 1
Understanding Fiber Utilization in Pigs 5
-What is Fiber? 5
-Fiber Digestion 7
-Hindgut Fermentation 8
Understanding Lipid Utilization in Pigs 9
-Types of Lipids 10
-Fatty Acid Characteristics 11
-Iodine Value 14
-Iodine Value Product 15
-Fat Digestion and Absorption 15
-Fat Deposition 19
- Regulation of Fat Deposition 21
-Fatty Acid Digestibility 22
-Fat Sources and Types 23
-Benefits of Supplemental Fats in Swine Diets 24
-Methods to Evaluate Fat Content 24
-Fat Source Quality 25
DDGS as a Feed Ingredient in Swine Diets 26
-Growth Performance and DDGS 26
-Effects of Feeding DDGS Diets on Carcass Characteristics 27
-DDGS Effects on Pork Fat Quality 28
-Pork Quality and DDGS 30
-Strategies to Improve Pork Fat Quality when Feeding DDGS 30
-CLA and Ractopamine 31
Tallow as a Supplemental Fat Source 32
-Digestibility 32
-Growth Performance 33

iii
-Carcass Characteristics 34
-Fat Quality 34
-Pork Quality and Tallow 35
DDGS and Tallow Interactions 35
-Growth Performance and Carcass Characteristics 35
-Fat and Fiber Digestibility 37
Digestibility Procedures 37
Summary 40
Chapter 2. Effects of adding supplemental tallow to diets containing
30% DDGS on growth performance, carcass characteristics and fat
quality in growing-finishing pigs
41
Overview 42
Introduction 44
Materials and Methods 45
-Animals 45
-Dietary Treatments 45
-Growth Performance Measurements 46
-Carcass Measurements 46
-Pork Fat Analysis 47
-Statistical Analysis 48
Results and Discussion 48
-Growth Performance 48
-Carcass Characteristics 51
-Fatty Acid Composition and IV of Backfat and Belly Fat 53
-Objective and Subjective Fat Color Scores 58
Chapter 3. Effects of adding supplemental tallow to diets containing
DDGS on fatty acid digestibility in growing pigs
71
Overview 72
Introduction 73
Materials and Methods 75
-Animals and Housing 75
-Cannulation Procedure 75
-Dietary Treatments and Feeding 76
-Sample Collection and Chemical Analysis 77

iv
-Calculations and Statistical Analysis 78
Results and Discussion 79
-Fecal Digestibility 79
-Ileal Digestibility 83
Chapter 4. Summary 101
Literature Cited 103
v
List of Tables
Table No. Chapter 1. Page No.
1.1 Nutrient content of DDGS and Corn 3
1.2 Typical fatty acids found in swine diets and tissue depots 13
1.3 Fatty acid content and iodine value of select feed ingredients 15
1.4 Comparison of common fats and oils for swine diets 24
1.5 Ileal digestibility of select fatty acids in control diets and diets
containing animal fat
33
Chapter 2.
2.1 Ingredient composition, as is 61
2.2 Fatty acid profile of ingredients, as is, % fatty acids in product 62
2.3 Composition of diets (as-fed basis) 63
2.4 Nutrient composition of diets (as-fed basis) 64
2.5 Effects of tallow and DDGS on pig growth performance 65
2.6 Effects of tallow and DDGS on carcass characteristics 66
2.7 Effects of tallow and DDGS on belly characteristics 67
2.8 Effects of tallow and DDGS on belly and backfat fatty acid
composition
68
2.9 Correlation of belly fat and backfat IV with diet IV 69
2.10 Effects of tallow and DDGS on belly and backfat color
characteristics
70
Chapter 3.
3.1 Fatty acid profile of DDGS and tallow, as-fed basis 95
3.2 Ingredient composition of diets, as-fed basis 96
3.3 Nutrient composition of diets, as-fed basis 97
3.4 Analyzed fatty acid composition of the diet, fecal and apparent
ileal digestibility as influenced by dietary level of DDGS and
tallow, expressed as a % of total dietary fat, and percentage of
apparent ileal digestible dietary fatty acids
98
vi
List of Figures
Figure No. Chapter 1. Page No.
1.1 Ethanol production in the US 1
1.2 Inclusion of DDGS in poultry and swine diets 2
1.3 Classification of carbohydrates 6
1.4 Microorganism concentrations in the GIT of pigs 8
1.5 Simple and mixed triglycerides 10
1.6 Lipid conversion, transport, and absorption 18
1.7 Origin of lipids in adipose tissue 19
1.8 Influence of age on fatty acid composition and adipocyte size 21

1
CHAPTER 1
LITERATURE REVIEW
Introduction
With the current record high feed prices in the United States, pork producers are
constantly seeking low-cost alternatives to conventional feed ingredients. Within the past
decade, the United States has experienced a rapid growth in corn ethanol production
(Figure 1.1).
Figure 1.1 Ethanol production in the US (Adapted from RFA, 2011).
Low corn prices and low transportation costs allowed the corn-based ethanol
industry to gain momentum and grow. Today, the ethanol industry has extended out of
the Midwest and stretches from California to North Carolina. In 2009, the United States
produced nearly 41,640 million liters of ethanol with production expected to increase to
49,210 million liters in 2010 (RFA, 2011).
With every gallon of ethanol produced, approximately 5.7 pounds of distillers
0
2000
4000
6000
8000
10000
12000
14000
1975 1980 1985 1990 1995 2000 2005 2010 2015
Mil
lio
ns
of
ga
llo
ns
of
eth
an
ol
Year
U.S. Ethanol Production

2
grains are produced (RFA, 2011). In 2010, the United States ethanol industry produced
32.5 million metric tons of distillers grains for livestock markets across the globe; of this
amount, 61% was further processed and dried while the remaining 39% was marketed as
wet distillers grains for use in cattle feeds (RFA, 2011). Both ample supply of DDGS
and its competitive price compared to other ingredients result in a readily available and
economically feasible ingredient for livestock producers. It is estimated that the majority
of distillers grains is fed to beef and dairy cattle (80%) while 10% is fed to swine and 9%
fed to poultry (RFA, 2011). Like the ethanol industry, the use of dried distiller’s grains
with solubles (DDGS) has also exponentially increased in the poultry and swine sectors
(Figure 1.2).
Figure 1.2 Inclusion of DDGS in poultry and swine diets (Shurson, 2009)
Currently, swine producers widely accept DDGS as a feed ingredient for all
phases of production. Due to feed ingredient price volatility, distillers dried grains with
solubles (DDGS) has become the most popular alternative feed ingredient in swine diets.

3
It is often added to grower-finisher diets at a rate ranging from 10 to 20% without
reducing pig performance, while still capturing the economic advantages DDGS offers.
During times of high corn and soybean meal prices relative to DDGS price, DDGS may
be used at high levels (> 40%) in some grower-finisher diets. These cost savings are a
result of partially replacing corn, soybean meal, and inorganic phosphorus (Whitney et
al., 2006) in swine diets. However, not all DDGS sources are the same. Much
variability in nutrient content of DDGS exists within and among ethanol plants.
The metabolizable energy (ME) content of DDGS is very similar to corn.
According to the National Swine Nutrition Guide (2010), corn has a ME of 3,421 kcal/kg
while DDGS has an ME of 3,414 kcal/kg. However, subsequent research has
determined that the average ME of DDGS ranges from 3,750 to 3,900 kcal/kg of DM
(Pedersen et al., 2007). Although the two feedstuffs are similar in terms of energy, they
differ quite substantially in the composition of other macro nutrients. In particular, DDGS
contains roughly three times more fat, fiber, and crude protein compared to corn as
shown in Table 1.1.
Table 1.1 Nutrient content of DDGS and corn, as-fed
DDGS Corn
Minimum Mean Maximum Minimum Mean Maximum
Crude Fat, % 8.8 9.8 11.2 2.6 3.2 3.4
NDF, % 29.4 33.3 36.5 7.2 8.9 10.8
ADF, % 9.6 11.6 12.7 2.8 3.3 4.5
Crude Protein, % 27.3 29.1 31.9 10.0 10.8 12.8
Adapted from Urriola, (2007) and Ridley et al. (2002)
Nutrient composition varies within and among various ethanol plants in the upper
Midwest (Spiehs et al., 2002). The fat content of DDGS can range from 8.8 to 12.4%
(Shurson and Alghamdi, 2008). However, DDGS are consistently high in unsaturated

4
fatty acids, and nearly 80% of fatty acids in DDGS are unsaturated (Xu et al., 2010b).
Xu et al. (2010b) found that DDGS contains high concentrations of the unsaturated fatty
acids including: oleic acid and linoleic acid, 25.70, and 55.35%, respectively.
Surprisingly, the linoleic acid content of DDGS is quite similar to the fatty acid
proportions found in corn oil and soybean oil. Based on NRC (1998) estimates, corn oil
contains 59.6% linoleic acid while soybean oil contains 51.0% linoleic acid. However,
little is known regarding the digestibility of fatty acids in DDGS.
Results from many studies agree that feeding high levels of DDGS increases the
incidence of soft pork fat (Xu et al., 2010b, Ulery et al., 2010, Benz et al., 2008). Soft
pork fat is a major concern for pork processors because it creates challenges associated
with processing and fabrication, processing yields, shelf-life, product attractiveness, and
acceptability in certain export markets. Furthermore, as the dietary level of DDGS
increases, the iodine value (IV), a measure of the degree of unsaturation, and level of
polyunsaturated fatty acids (PUFA) in pork adipose tissue increases.
It is well documented that pork fat quality is negatively impacted by feeding
DDGS (Widmer et al., 2008; Xu et al, 2010b). Distillers grains contains nearly 60%
linoleic acid which, is one of the most prevalent polyunsaturated fatty acids (PUFA) in
pork fat (Xu et al., 2010b). Unsaturated fats are preferentially deposited in pork fat
depots. Several alternative feeding strategies presently exist to prevent pork fat quality
problems while feeding DDGS. Some of those include removing DDGS from the diet
prior to harvest, feeding wheat and barley based diets, utilizing reduced-oil corn co-
products, adding conjugated linoleic acid (CLA), adding crude glycerol, or formulating
diets based on the iodine product value. However, not all of these strategies are readily

5
available nor are they economically feasible for pork producers. A review by Stein and
Shurson (2009) reported that results from most research studies show that the addition of
DDGS to growing-finishing pig diets does not change ADG, ADFI, or G:F compared to
when traditional corn-soybean meal diets are fed. Additionally, loin depth, backfat depth,
and percentage carcass lean largely remain unchanged due to the addition of DDGS to
growing finishing pig diets. However, effects of feeding DDGS diets on carcass yield
have resulted in inconsistent responses.
Beef tallow is a readily-available fat source that is high in saturated fatty acids
compared to other common animal fat sources. Pork fat firmness may be improved by
adding a saturated fat source to grower-finisher swine diets. However, no research studies
have been conducted to investigate the effects of adding supplemental tallow to diets
containing high levels of corn DDGS diets on growth performance, carcass
characteristics, pork fat quality, and fatty acid digestibility.
Understanding Fiber Utilization in Pigs
What is Fiber?
Carbohydrates are comprised of a variety of chemical compounds including:
cellulose, hemicelluloses, lignin, pectin, and gums. Carbohydrates represent
approximately 55-70% of the dry matter in swine diets (He, 2004). This broad and
complex category of carbohydrates encompasses many different carbohydrate measures
such as crude fiber, acid detergent fiber (ADF), neutral detergent fiber (NDF), and more
as illustrated in Figure 1.3.
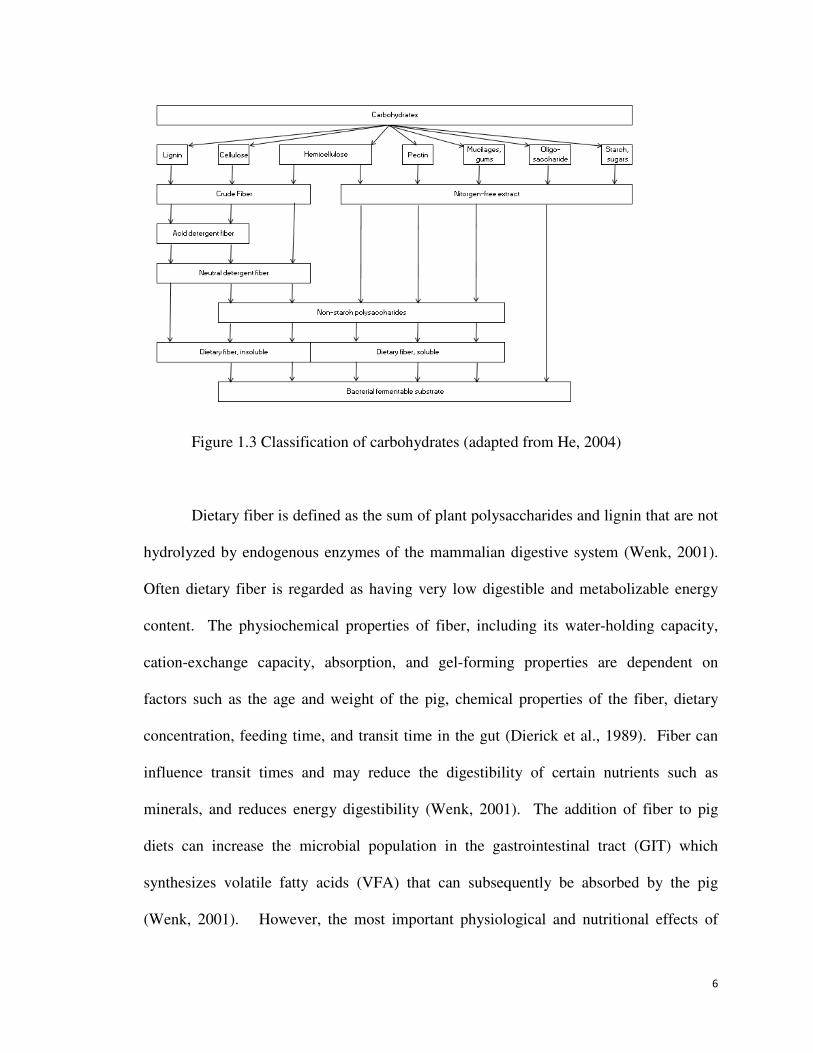
6
Figure 1.3 Classification of carbohydrates (adapted from He, 2004)
Dietary fiber is defined as the sum of plant polysaccharides and lignin that are not
hydrolyzed by endogenous enzymes of the mammalian digestive system (Wenk, 2001).
Often dietary fiber is regarded as having very low digestible and metabolizable energy
content. The physiochemical properties of fiber, including its water-holding capacity,
cation-exchange capacity, absorption, and gel-forming properties are dependent on
factors such as the age and weight of the pig, chemical properties of the fiber, dietary
concentration, feeding time, and transit time in the gut (Dierick et al., 1989). Fiber can
influence transit times and may reduce the digestibility of certain nutrients such as
minerals, and reduces energy digestibility (Wenk, 2001). The addition of fiber to pig
diets can increase the microbial population in the gastrointestinal tract (GIT) which
synthesizes volatile fatty acids (VFA) that can subsequently be absorbed by the pig
(Wenk, 2001). However, the most important physiological and nutritional effects of

7
fiber include increased feed intake due to a diluted energy concentration of the diet,
increased output of pancreatic and biliary secretions, and a reduction in the absorption of
certain minerals (Dierick et al., 1989). Different types of fiber have different effects on
digestion in the pig, and affect satiation, transit time, and energy digestibility.
Fiber Digestion
Fiber is a poorly understood dietary component in monogastric animals.
Digestibility of fibrous feed ingredients is greatly influenced by both physical and
chemical characteristics (Wilfart et al., 2007). Nutrient absorption is largely determined
by the type of fiber (enzymatic vs. fermentation) and site (small intestine vs. large
intestine) of digestion. Enzymatic digestion refers to degradation caused by endogenous
enzymes in the small intestine, whereas fermentation of fiber is caused by bacteria in the
large intestine. Typically, the small intestine is the site of enzymatic degradation whereas
the large intestine is associated with fermentation. Intensive microbial degradation of
fiber takes place in the lower ileum, cecum, and lower large intestine which is important
for VFA production and utilization (Wenk, 2001).
Wilfart et al. (2007) studied the impact of three levels of dietary fiber on nutrient
digestibility in growing pigs using diets consisting of low fiber, medium fiber, and high
fiber utilizing 0%, 20%, and 40% wheat bran, respectively. Furthermore, the fat content
of the diet was restricted to 2.4 to 2.5%. Pigs were cannulated at two sites, the
duodendum and ileum, to account for differences in nutrient absorption. Wilfart and
colleagues (2007) determined that apparent digestibility of most nutrients increased from
the duodenum and beyond. A significant decrease in fecal digestibility of ether extract
with increasing dietary fiber content (77.0 vs. 65.2%) was observed for the low fiber and

8
high fiber diets, respectively. This finding suggests a possible interaction between fat
and fiber digestibility.
Hindgut Fermentation
Energy from fibrous ingredients is supplied to the host animal from digestive
enzymes in the intestinal tract or from volatile fatty acids (VFA) which are produced by
anaerobic bacteria (Pond, 1987). In the large intestine, digestion of components such as
dietary fiber, lipids with high melting points, and insoluble proteins is driven by
microbial fermentation. Bacteroides succinogenes and Ruminococcus flavefaciens are
two of the most abundant cellulolytic organisms found in growing pigs and adult animals
(Varel, 1987). Furthermore, the number of cellulolytic bacteria in the pig’s large
intestine can increase with prolonged feeding of high fiber diets (Varel and Pond, 1985).
In the pig, but not other species, micro-organisms are concentrated in the cecum and
colon compared to other organs of the gastrointestinal tract (Figure 1.4).
Figure 1.4 Microorganism concentrations in the GIT of pigs (Wenk, 2001)
Fermentation of dietary fiber results in the production of VFA, with a typical ratio

9
of 60% acetate, 25% propionate, and 15% butyrate (Grieshop et al., 2000). These VFA,
which are rapidly absorbed, along with some vitamins, can contribute to the overall
nutrient supply of the animal (Wenk, 2001). Typically, 5 to 28% of the maintenance
energy requirement of a growing pig may be met by absorbed VFA (Pond, 1987;
Grieshop et al., 2000). Dietary energy from microbial fermentation is suspected to be
lower than that of carbohydrates which are absorbed as monosaccharides in the small
intestine (Dierick et al., 1989). This is primarily due to the losses of methane, hydrogen,
and heat resulting in a lower efficiency of metabolism (Dierick et al., 1989; Grieshop et
al., 2000). Approximately, 6% of the energy value from each gram of carbohydrate
digested in the hindgut of pigs is lost as heat during the fermentation process, and an
additional 35-60% is lost as methane and heat during the conversion to VFA to body
tissue (Dierick et al.,1989).
Understanding Lipid Utilization in Pigs
Lipids are a very important class of nutrients required for numerous physiological
and metabolic functions. Lipids have four main functions : 1) to supply energy for
maintenance and productive functions; 2) serve as a source of essential fatty acids, which
can only be supplied by the diet and serve as building blocks for hormones; 3) carry fat-
soluble vitamins; and 4) act as an integral portion of cell membranes (Pond et al 1995).
They contain nearly 2.25 times the amount of energy compared to carbohydrates or
protein (4 calories/gram), thus providing a considerable amount of energy (9
calories/gram; Pond et al., 1995). All lipids share common characteristics: insoluble in
water, yet soluble in organic solvents, contain long-chain hydrocarbons, and are present

10
or derived from living organisms. The lipid family includes several vital compounds
including triglycerides, phospholipids, cholesterol, and fat soluble vitamins (Pettigrew
and Moser, 1991). Furthermore, adding supplemental fat to diets can suppress dust,
facilitate pelleting, and decrease wear on feed mixers (Patience and Thacker, 1989).
However, including supplemental fat in swine diets also creates a few challenges
including reduced diet flowability and challenges such as handling fat and mixing it with
other ingredients (Pettigrew and Moser, 1991).
Types of Lipids
There are several different types of lipids. Triglycerides serve as the main
component of lipids; while minor components of lipids include mono- and diglycerides,
free fatty acids (FFA), phospholipids, sterols, and pigments. In swine diets, the majority
of lipids found in the diet are present as triglycerides. A triglyceride is comprised of
three fatty acid molecules which are attached to a single glycerol molecule via an ester
bond. Triglycerides can be either simple, where the fatty acids are identical, or mixed,
where two or three fatty acids are different (Figure 1.5).
Figure 1.5 Simple and mixed triglycerides (adapted from Food Fats and Oils, 2006)
Mono- and diglycerides are the result of the normal digestion of triglycerides.

11
Free fatty acids (FFA) are fatty acids that are unattached from a triglyceride. Typical
levels of FFA in refined fats and oils consist of less than 0.1% (Food Fats and Oils,
2006). Phospholipids contain either a glycerol or sphingosyl backbone, two fatty acids,
and a phosphate group often with choline attached to its end. The hydrocarbon tails of
the fatty acids are hydrophobic, but also hydrophilic due to the phosphate group.
Therefore, phospholipids are soluble in both water and oil. Phospholipids are most
commonly found in living cells and serve as a crucial part of the phospholipid bilayer of
cell membranes. Most phospholipids are removed from oil during refining. Cholesterol is
the primary animal fat sterol, whereas vegetable oil sterols are called phytosterols. The
type and concentration of sterols varies based on the source and refinement of the lipid
source. Several pigments are composed of lipids. For instance, carotenoids ranging from
yellow to deep red occur naturally in many fats and oils. However, during processing,
most pigments are removed to allow for acceptable color, flavor, and stability (Foods
Fats and Oils, 2006).
Fatty Acid Characteristics
The physical and chemical characteristics of fatty acids in a lipid define its
properties. One hundred grams of fat or oil will yield approximately 95 grams of fatty
acids (Food Fats and Oils, 2006). Fatty acids are classified according to their degree of
saturation. Saturated fatty acids contain only single carbon-to-carbon bonds and are the
least reactive. Unsaturated fatty acids contain one or more carbon-to-carbon double
bonds and are more reactive chemically compared to saturated fatty acids. As the
number of double bonds of a fatty acid increases, so does its reactivity, thus increasing its
chances of oxidation.

12
The melting point of fatty acids is dependent upon the degree of saturation and
chain length (Pettigrew and Moser, 1991). In saturated fatty acids, melting point
increases with chain length. Short-chain fatty acids have lower melting points than
longer-chained fatty acids. Melting points of unsaturated fatty acids are greatly affected
by the position and conformation of double bonds (Food Fat and Oils, 2006). For
example, oleic acid (C18:1) and its geometric isomer, elaidic acid (C18:1-trans) have
very different melting points. Oleic acid has a melting point of 16.3⁰ C, while elaidic
acid has a melting point of 43.7⁰ C.
The chemical and physical properties of fatty acids are determined by the chain
length and degree of saturation. For instance, lipids that are solid at room temperature
usually contain saturated fatty acids with a chain length of 10 carbons or more and are
called fat. Conversely, lipids that are liquid at room temperature and have less than 10
carbons are called oil (Pond et al., 1995). Finally, melting point and degree of saturation
are inversely related. For example, as the level of unsaturation increases, the melting
point decreases, thus resulting in a “softer” fat. Table 1.2 lists typical fatty acids found in
swine diets and fat depots as well as the chain length and number of double bonds and
melting point.

13
Table 1.2 Typical fatty acids found in swine diets and tissue depots
Fatty Acid Chain length Melting Point, °C
Caprylic C 8:0 16.5
Capric C10:0 31.4
Lauric C12:0 44.0
Myristic C14:0 58.0
Palmitic C16:0 63.0
Palmitoleic C16:1 1.5
Stearic C18:0 71.5
Oleic C18:1 16.3
Linoleic C18:2 -5.0
Linolenic C18:3 -11.3
Arachidic C20:0 75.4
Arachidonic C20:4 -49.5
Adapted from Azain (2001)
Medium-chain fatty acids have a chain length of 6 to 12 carbons. Long-chain
fatty acids of 14 to 20 carbons are most abundant in swine diets and pork fat depots
(Azain, 2001). The two most abundant fatty acid chain lengths in pig fat depots are 16
and 18 carbons. Palmitic acid (C16:0) is generally considered the end product of
lipogenesis and accounts for approximately 20 to 30% of the fatty acids in pork adipose
tissue. The other predominate fatty acids in pork fat depots are stearic (C18:0) and oleic
acids (C18:1), which account for 10 to 15% and 40 to 50% of the fatty acids, respectively
(Azain, 2001). In addition to being supplied in the diet, both stearic and oleic acids can
be synthesized from palmitate by elongation and desaturation.
Although no dietary requirement for fat exists, certain fatty acids are required for
proper growth and development. These required fatty acids are known as essential fatty
acids (EFA) and include linoleic (C18:2), linolenic (C18:3), and arachidonic (C20:4)
acids. It is important to note, however, that arachidonic acid can be synthesized from

14
linoleic acid (Pond et al., 1995). These EFA serve as an integral part of the lipid-protein
structure of cell membranes, and play an important role in the structure of compounds
known as eicosanoids that are involved in the regulation of hormone release from the
hypothalamus and pituitary glands (Pond et al., 1995). Diets that are deficient in EFA
result in scaly skin and necrosis of the tail, growth and reproductive failure, and edema
(Pond et al., 1995).
Iodine Value
Iodine value (IV) is a measure of the degree of unsaturation in fat. It is a
measurement of the mass of iodine, in grams, that is absorbed by 100 grams of an
unsaturated fat. Values for IV can either be calculated or determined in a laboratory. In
the lab, an iodine solution reacts with the double bonds of an unsaturated fat and is
determined by titration. Higher IV values indicate that a fat contains more double bonds.
Routinely, the IV is commonly calculated based on the fatty acid profile utilizing the
following equation (AOCS, 1998):
IV = C16:1 × 0.95) + (C18:1 × 0.86) + (C18:2 × 1.732) +
(C18:3 × 2.616) + (C20:1 × 0.785) + (C22:1 × 0.723)
The IV calculation emphasizes the amount of C18:2 and C18:3. Ultimately,
sources rich in both fatty acids have greater IV as demonstrated in Table 1.3.

15
Adapted from Madsen et al. (1992)
Iodine Value Product
One way to minimize high IV in pork carcass fat depots is to formulate diets
based on an iodine value product (IVP) basis. The IVP is a tool to help estimate the IV in
the diet based on IV levels of specific ingredients containing fats or oils in order to
minimize the risk of exceeding the desired IV in pork fat depots. The IVP and IV are
closely related. As the IVP of a diet increases, so also does the IV of the backfat (Madsen
et al, 1992). The IVP can be calculated as follows (Madsen et al., 1992):
IVP = percentage of dietary fat in diet × iodine value of fat source × 0.1
Fat Digestion and Absorption
Dietary triglycerides are hydrolyzed to 2-monoglycerides and free fatty acids in
the intestinal tract. The upper portion of the small intestine is the site of fatty acid
absorption. Bile is necessary for solubilization of dietary lipid and eventual absorption of
fat and fat-soluble vitamins.
Bile is produced by hepatocytes and is stored in the gall bladder. Bile is
composed of Na, K, Cl, bicarbonate, and several other organic components (bile salts,
Table 1.3 Crude fat, fatty acid content, and iodine value of selected feed ingredients
Feed stuff Crude
fat, %
C14:0 C16:0 C18:0 C18:1 C18:2 C18:3 IV
Barley 3.5 0.2 19.8 0.7 10.4 44.2 4.5 129
Soybean meal 3.1 0.4 18.3 4.2 15.9 51.8 6.8 137
Animal Fat 99.9 1.8 23.6 13.3 38.8 6.0 0.5 57
Soybean oil 99.9 - 10.0 2.0 29.0 51.0 7.0 140
Corn oil 99.9 0.1 10.4 1.6 30.7 54.6 1.7 127
Palm oil 99.9 12.0 8.3 2.2 23.6 4.0 0.1 29
Coconut fat 99.9 - 9.0 5.0 8.0 3.0 - 10

16
phospholipids, cholesterol, mucus, and bile pigments; Yen, 2001a). Bile salts aid in the
emulsification of fat and facilitate absorption by conjugating with the amino acids glycine
or taurine (Yen, 2001a). Bile acids are reabsorbed in the lower small intestine and
transported by the portal vein to the liver where they are recycled into bile again (Yen,
2001a). The recirculation of bile components provides a means for coping with demand,
because daily bile use by the pig far exceeds its capacity for synthesis (Yen, 2001a). Bile
secretion responds to dietary changes in pigs. For example, when dietary fat content was
increased from a low (2%) to a medium (10%) level, the secretion of bile acids increased
dramatically, whereas bile phospholipids and cholesterol rose moderately (Juste et al,
1983). However, when dietary fat content was raised to a high concentration (20%), bile
acid output did not increase further, but additional increases in output of phospholipids
and cholesterol were observed (Juste et al., 1983). Bile secretion by the hepatocytes in
pigs is continuous, but can be increased by the presence of bile salts, secretin, or
cholecystokinin in the blood (Kidder and Manners, 1978). However, for fat digestion,
bile is only needed intermittently. When fat content of diets rose from 2% to 10%, the
secretion rate of bile acids increased dramatically (Juste, 1983). However, increasing the
dietary fat content to 20% does not cause bile output to increase further, but rather, it
reaches a plateau.
In order for digestion and absorption to occur, triglycerides must be broken down
by bile and pancreatic lipases through a process known as emulsification. Emulsification
occurs and greatly reduces the particle size of lipids from 500 to 1000 µm (Pond et al.,
1995). With smaller particle size, greater surface area is exposed for pancreatic and
intestinal lipases. Lipase works to remove the outer two fatty acids from each triglyceride

17
molecule resulting in one beta-monoglyceride and two FFA (Yen, 2001a). Micelles or
small, spherical aggregates form to contain the FFA, beta-monoglycerides,
phospholipids, and cholesterols. Micelles are aggregates of mixed lipids and bile acids
suspended within the digesta. Micelles are arranged so that the interior of the micelle is
filled with the hydrophobic fatty acid tails. Eventually, the micelles reach and contact the
brush border of the small intestinal enterocytes where lipids are absorbed into the
mucosal cells and bile salts are recycled. Monoglycerides and FFA move out of the
micelles via diffusion into the enterocyte.
The proximal jejunum is the main site of absorption for lipids, but some
absorption does occur from the distal duodenum to the distal ileum (Pond et al., 1995;
Yen, 2001a). Glycerol and short-chain fatty acids are absorbed by passive transport.
Short-chain fatty acids pass directly to the portal blood system. Micelles diffuse through
the gut lumen to the brush border of the mucosal cells and allow monoglycerides and
fatty acids to diffuse across the apical membrane of the enteroycte (Yen, 2001a). As
depicted in Figure 1.6, long-chain fatty acids are converted to derivatives of coenzyme A
in the presence of ATP; the complex of fatty acyl-coenzyme A reacts with monoglyceride
within the epithelial cell to form di- and then triglycerides (Pond et al., 1995). Next,
chylomicrons are formed where a thin layer of protein coats the lipid droplet surface and
consists mainly of triglycerides with small quantities of phospholipids, cholesterol ester,
and protein. Chylomicrons are transported to the lymph system and, eventually, to the
blood system.

18
Figure 1.6 Lipid conversion, transport, and absorption (Pond et al., 1995)
Lipids found in the blood can be classified into four groups that vary in density
and composition: chylomicrons, very low-density lipoporteins (VLDL), low-density
lipoproteins (LDL), and high-density lipoproteins (HDL). The liver, fat depots, and
other tissues rapidly remove chylomicrons and other lipids from the blood.
Chain length of the fatty acid determines preferential digestibility in pigs. Short-
chain fatty acids (SCFA) are the end products of bacterial fermentation. Volatile fatty
acids (VFA) such as acetate, butyrate, and propionate are the main SCFA. Feeding
fibrous feedstuffs greatly increases the concentration of SCFA in the colon which can be
used as an energy source to the pig for hindgut fermentation (Wang et al., 2004; Anguita
et al., 2006). Medium-chain fatty acids from coconut oil have a higher apparent
digestibility compared to the long-chain fatty acids found in corn oil or tallow (Cera et
al., 1989). Medium-chain fatty acids are liberated preferentially in the case of mixed
triglycerides (Bach and Babayan, 1982). Furthermore, Cera et al. (1988) reported that

19
long-chain unsaturated fatty acids are hydrolyzed and absorbed at higher rates than those
fatty acids with a higher degree of saturation. Likewise, digestibility of fat seems to
reach a plateau three weeks following weaning of pigs at 21 d of age (Cera et al., 1988).
Fat Deposition
The primary storage site for triglycerides is in adipose tissue or depot fat since it
is readily capable of oxidizing fatty acids and synthesizing fat from dietary carbohydrates
and dietary fat (Figure 1.7).
Figure 1.7 Origin of lipids in adipose tissue (Adapted from Schinckel et al., 2002)
De novo synthesis forms triglycerides which are deposited into depot fat, and
phospholipids which serve as critical building blocks for cell membranes. However, the
contribution from each source is highly dependent on the amount of fat in the diet
(Schinckel et al., 2002). The depot fat of nonruminant animals strongly mimics the fatty
acid profile of the diet (Pond et al 1995, Babatunde et al 1967). Conversely, depot fat in
ruminants does not typically resemble dietary fat intake due to biohydrogenation of fat by
the rumen microflora.
Fat deposition is the continual accretion of lipids in adipose tissue and occurs
continuously. Adipocyte size and number relate to adipose tissue development. Adipose
tissue contains approximately 70-90% lipid, 5-20% water, and approximately 5%

20
connective tissue. The number of adipocytes is predetermined and associated with late
gestation and the pre-weaning period, whereas adipocyte size is related to the post-
weaning to finishing period (Azain, 2004). Subcutaneous fat depots are the most
important site of fat deposition. Several factors influence fatty acid composition in
adipose tissue including: diet, fatness, age, gender, breed, environmental temperature, and
depot sites.
Diet composition easily affects the fatty acid composition in various tissues
including fat depots and skeletal muscle (Koch et al., 1968, Brooks, 1971; Nurmberg et
al., 1998). It is estimated that a diet low in fat (3 to 4%) contributes 80% of deposited
triglycerides derived from corn or barley-based diets (Schinckel et al., 2002). Dietary
linoleic acid is preferentially deposited in fat depots (Koch, 1968). Pork fat containing
greater than 14% linoleic acid (C18:2) is associated with soft fat (Rentfrow et al., 2003).
Linoleic acid is not synthesized by the pig, nor is it significantly modified prior to
deposition (Ellis and McKeith, 1999). It is documented that the level of saturated fat in
pork fat can be altered by inclusion of unsaturated fat in the diet (Rentfrow et al. 2003).
Leaner pigs have a greater concentration of linoleic acid in their fat depots
because a greater proportion of fatty acids are derived from the diet rather than from de
novo synthesis (Ellis and McKeith, 1999; Nurnberg et al., 1998). Pigs are born with
approximately 2% body fat. As the age of pigs increases, the amount of adipose tissue
increases (Figure 1.8). Adipocyte diameter rapidly increases from 100 to 180 days of
age. After 180 days of age, little change is observed in adipocyte size. The percentage of
unsaturated fatty acids decreases with growth up to 180 days, while the percentage of
saturated fatty acids increases during this timeframe. Furthermore, the fatty acid profile

21
changes during growth (Nurnberg et al., 1998; Kloareg et al., 2007).
Figure 1.8 Influence of age on fatty acid composition and adipocyte size (Adapted from
Nurnberg et al., 1998)
At equal slaughter weights, intact males are leaner than gilts, and gilts are leaner
than barrows. Barrows deposit more saturated fatty acids compared to gilts (Koch et al.,
1968; Nurnberg et al., 1998). Genetics play an integral role in fat composition.
Intramuscular fat is highly heritable with h2 between 0.4 to 0.6 (Nurmberg et al., 1998).
Housing pigs above their thermoneutral zone and decreasing spatial allocation increases
iodine value in belly and backfat and decreases the saturated to unsaturated fatty acid
ratio (White et al., 2008). Koch et al. (1968) concluded that the inner layer of backfat
undergoes a more rapid change in composition compared to the middle or outer layers.
Regulation of Fat Deposition
If energy demands of the pig are being met, excess energy is stored in adipose
tissue. Regulation of fat deposition is dependent on the energy status of the animal. The
addition of dietary fat has been shown to inhibit de novo fatty acid synthesis in rats,
poultry, and pigs (Herzberg and Rogerson, 1988; Clarke, 2001). In rats and poultry,
polyunsaturated fatty acids have a greater ability to inhibit de novo lipogenesis compared

22
to saturated fatty acids. However, in pigs these same effects of polyunsaturated fatty
acids are not observed (Smith et al., 1996).
Adipose tissue produces a variety of hormones. Leptin is one hormone produced
by adipose tissue and has been shown to affect feeding behavior, animal health, and
reproduction (Ramsey, 2003). Leptin can indirectly inhibit glucose conversion to lipid
and directly inhibit lipogenesis in porcine adipocytes (Ramsay, 2003; Hausman et al.,
2009). Furthermore, leptin functions to promote the partitioning of energy away from
lipid accretion within porcine adipose tissue, in part, by decreasing insulin-mediated
stimulation of lipogenesis by reducing fatty acid utilization (Ramsay, 2003).
Unlike other mammals, adipose tissue in pigs is the main organ for fatty acid
synthesis (Duran-Montge et al., 2009). The dietary effects of various fats are tissue
specific and have been linked to the modification of mRNA abundance of genes for
encoding lipogenic enzymes (Duran-Montge et al., 2009).
Fatty Acid Digestibility
No results have been published on the digestibility of fatty acids of diets
containing DDGS. However, Stein (2009) determined that the apparent ileal digestibility
of acid-hydrolyzed ether extract (AEE) in DDGS and showed that it tended to increase as
the concentration of DDGS increased in the diet. However, in comparison to other
ingredients, the AEE digestibility of DDGS was rather low, ranging from 51.5 to 60.1%.
Very few studies have determined fatty acid digestibility in pigs. Most fatty acid
digestibility research deals with digestibility of various fats and oils rather than grain-
based energy ingredients like corn or soybean meal. Ozimek et al. (1984) determined
ileal and fecal digestibility of diets that contained either 10% beef tallow or rapeseed oil.

23
Apparent fecal digestibilites of saturated fatty acids were lower than corresponding ileal
digestibilites (Ozimek et al., 1984, Duran-Montgé et al., 2007). However, Duran-Montgé
et al. (2007) determined that unsaturated fatty acid digestibility was lower in the ileal
digesta and greater in the feces. Saturated fatty acid digestibility is lower than unsaturated
fatty acid digestibility irrespective of whether it was determined in feces or ileal digesta
(Ozimek et al., 1984).
Crude fat ileal digestibility was lower diets supplemented with tallow compared
to other fat sources including high oleic sunflower oil, sunflower oil, linseed oil, and a fat
blend containing tallow, sunflower oil, and linseed oil (Duran-Montgé et al., 2007).
Apparent fecal digestibility of saturated fatty acids was greater in tallow containing diets
compared to oil-supplemented diets, and apparent fecal digestibility of polyunsaturated
fatty acids was higher in oil-supplemented diets than in animal fat diets (Duran-Montgé
et al., 2007). Apparent fecal digestibility of stearic acid was negative in oil-supplemented
diets, but positive for diets containing animal fat, which suggests that microflora could
increase stearic acid concentrations in feces at the expense of PUFA (Duran-Montgé et
al., 2007). Apparent ileal digestibility of the sum of fatty acids and saturated fatty acids
was lower for tallow containing diets even though the diet contained a high concentration
of these fatty acids (Duran-Montgé et al., 2007).
Fat Sources and Types
Numerous fat sources from animal and plant origin exist for use in monogastric
animal diets. The most common animal fats used in the swine industry include beef
tallow, choice white grease, and poultry fat. Additionally, producers often include
vegetable based oils, including corn oil, soybean oil, and canola oil in swine diets. Of

24
these common dietary fats, their fatty acid composition varies greatly as depicted in Table
1.4. Of the common fats and oils added to swine diets, oils have a greater concentration
of unsaturated fatty acids as well as higher iodine values than animal fats. Conversely,
beef tallow has the greatest amount of saturated fatty acids and the lowest iodine value.
Table 1.4 Comparison of common fats and oils for use swine diets
Source Unsaturated fatty
acids, %
Saturated fatty
acids%
Iodine Value
Beef Tallow 47.9 52.1 44
Choice White
Grease
59.2 40.8 60
Poultry Fat 68.8 31.2 78
Corn Oil 86.7 13.3 125
Soybean Oil 84.9 15.1 130
Canola Oil 92.6 7.4 118
Adapted from NRC (1998)
Benefits of Supplemental Fats in Swine Diets
Fat is typically added to swine diets to serve as a source of energy. One of the
main benefits of including supplemental fat sources in swine diets is to improve growth
performance. Fat addition results in reduced feed intake, increased average daily gain
and improved feed efficiency (Azain, 2004). Dust reduction is a secondary benefit
associated with dietary fat inclusion. Diet palatability is improved with supplemental fat,
and fat plays in integral role in meat palatability.
Methods to Evaluate Fat Content
Many different types of analytical procedures exist for fat (ether extract) analysis.
Different solvents are used on different substrates. Unfortunately, accurate and precise
results can be difficult to achieve because of the myriad of laboratory procedures
available. Furthermore, laboratory to laboratory and technician to technician error exists

25
and affects the accuracy of results. For feedstuffs, ether extraction is the classical method
for lipid determination (Palmquist and Jenkins, 2004). The official AOAC method
(920.39) indicates that the solvent should be diethyl ether, yet it is often substituted with
petroleum ether or hexane which may influence completeness of extraction (Palmquist
and Jenkins, 2004). Hexanes are less polar and therefore, extract less membrane lipid
and yield a lower analyzed value. Acid-ether extraction is another technique used for oil
recovery. Generally, fatty acid analysis with the acid extraction procedure yields higher
values than without acid treatment, and this increase may be attributed to the increased
extraction of lactic acid (Palmquist and Jenkins, 2004). For tissues of animal origin, the
Folch method is commonly employed for lipid extraction (Folch et a.l, 1958). Other
procedures have been proposed by Bligh and Dryer (1959) and Sheppard (1963), which
use varying concentrations of chloroform:methanol or ethanol:ether solutions,
respectively.
Fat Source Quality
Fat quality is often characterized by five main measures: composition, titer, color,
impurities, and stability (Azain, 2001). Composition of fat generally refers to the fatty
acid profile, particularly total fatty acids and free fatty acid content (Azain, 2001). Titer,
or fat hardness, measures the temperature (in degrees Celsius) where a fat sample
solidifies, and it is inversely related to iodine value (Azain, 2001). The color of fat is
indirectly related to nutritional quality, but it can be an indicator of the composition of the
fat source. Impurities of fat sources are measured on the MIU (moisture, impurities and
unsaponifiables) index. No nutritional values are associated with MIU, however it can
include contaminants such as hair, bone, soil, or plastic. Stability can be measured by

26
lipid oxidation tests such as peroxide value, thiobarbituric acid (TBA) test, and active
oxygen method (AOM). The peroxide value measures the rancidity of a sample from the
concentration of peroxides and hydroperoxides formed in the initial stages of lipid
oxidation (Azain 2001; DeRouchey et al., 2004). However, peroxide values may be
misleading depending on the thermal and oxidative exposure the fat has undergone
(DeRouchey et al., 2004). Additionally, high peroxide values indicate rancid fat, whereas
moderate values may indicate depletion of peroxides after reaching high concentrations.
The TBA test is a popular and commonly used method to detect rancidity due to lipid
oxidation (Rosmini et al., 1996). The TBA test detects aldehydes that are produced in the
termination phase of lipid oxidation with 2-thiobarbituric acid. A spectrophotometer is
used to measure the red color resulting from the reaction. Similar to peroxide value, this
method may be misleading because aldehydes may not have formed or may have been
lost during processing and storage. Finally, the AOM predicts stability of a fat by
bubbling air through a fat solution and is defined as the number of hours required for the
peroxide concentration to reach 100 meq/kg of fat. Unstable fats reach this peak quickly.
Unfortunately, this method is very time-consuming. Other factors including the
digestibility of the dietary fat, daily quantity of ME and fat consumed, and environmental
temperature influence the nutritional value of fat as an energy source (Stahly, 1984).
DDGS as a Feed Ingredient in Swine Diets
Growth Performance and DDGS
Much research suggests that feeding levels up to 20% of DDGS maintains growth
performance in grower-finisher pigs. Several reports show that average daily gain is

27
maintained or improved when feeding less that 20% DDGS (Gralapp et al., 2002,
Widyaratne and Zijlstra 2007; Widmer et al., 2008). However, a few studies have shown
that a decrease in ADG occurs when feeding up to 30% DDGS (Whitney et al., 2006;
Benz et al., 2007; Linneen et al, 2008).
Average daily feed intake follows a similar pattern to ADG and it typically
remains unchanged compared to feeding conventional corn-soybean containing diets
(Stein and Shurson, 2009). Conversely, reductions in ADFI have been documented when
dietary levels of DDGS increased from 0 to 20% (Benz et al., 2007; Linneen et al., 2008).
Feed consumption may be decreased due to the reduced palatability of DDGS from some
sources because pigs prefer a corn-soy based diet over one containing DDGS (Hastad et
al., 2005a).
Feed efficiency largely remains unchanged with incorporation of DDGS in the
diet (Stein and Shurson, 2009). However, in certain circumstances, feed efficiency has
been shown to decline with increasing levels of DDGS in the diet (Whitney et al., 2006),
whereas Benz et al. (2007) found that pigs fed 5% DDGS tended to have improved feed
efficiency.
Effects of Feeding DDGS Diets on Carcass Characteristics
In general, carcass characteristic responses from feeding diets containing DDGS
are consistent where no change in backfat depth, loin depth, and percentage carcass lean
are observed compared to feeding corn-soybean meal diets to growing-finishing pigs.
Furthermore, characteristics such as hot carcass weight, backfat thickness, and loin depth
are usually not altered with the addition of DDGS (Widmer et al., 2008, Stein and
Shurson, 2009). However, for each of these carcass parameters, a few studies have shown

28
a reduction in final body weight (Leick et al., 2010), carcass weight (Linneen et al., 2008,
Whitney et al., 2006) and yield (Linneen et al., 2008) when 30% DDGS was included in
the diet. Similarly, backfat and fat-free lean index tended to decrease with increasing
levels of DDGS in the diet (Linneen et al., 2008).
Effects on dressing percentage is the most inconsistent response when feeding
diets containing up to 30% DDGS. In some instances, dressing percentage is reduced
(Cook et al, 2005; Whitney et al., 2006; Beltranena et al., 2009), whereas other
researchers have not detected significant changes (Linneen et al., 2008; Widmer et al.,
2008). The reason for this inconsistent response is not clear.
DDGS Effects on Pork Fat Quality
According to Wood et al. (1989), animal adipose tissue quality is affected by
changes in the proportions of lipids, water, and connective tissue during growth. As
animals age, the rate of fat accretion also increases due to a lower proportion of water and
a greater proportion of lipid. High quality pork fat must have less than 15%
polyunsaturated fatty acids and more than 15% stearic acid (NPPC, 2000). Additionally,
the IV of pork fat should be less than 70 (NPPC, 2000).
Soft pork fat is typically characterized as having a high proportion of unsaturated
fatty acids, specifically, linoleic acid (Wood et al., 1989; Maw et al, 2003). Soft fat is
influenced by many different variables, yet it is directly proportional to the unsaturated
fatty acid composition of the diet. Several challenges are related to soft fat. Soft pork
fat is a major concern for the pork processors because it can cause significant problems
during cutting, grinding, and slicing operations (Ellis and McKeith, 1999). Belly
firmness is perhaps the most notable fat quality concern because soft bellies result in

29
bacon slicing difficulties (Schinckel et al., 2002). Additionally, lower processing yields
and reduced value may result due to complications with soft fat (Ellis and McKeith,
1999).
Distiller’s grains with solubles have quite a profound effect on pork fat quality.
Several researchers have demonstrated that including high levels of DDGS (> 25%) in
grower-finisher diets decreases the quality of pork fat. According to Leick et al. (2010),
feeding an increasing dietary level of DDGS led to a decrease in belly firmness as
measured by the belly flop test where the distance from skin to skin was measured when
the belly was draped skin-side down on a stainless-steel rod. Similarly, Xu et al. (2010b),
Widmer et al. (2008), Whitney et al. (2006) found similar responses when feeding
increasing levels of DDGS. Because DDGS contains a high proportion of
polyunsaturated fatty acids compared to saturated fatty acids, soft pork fat is generally the
result. White et al. (2009) demonstrated that IV in back and belly fat increased while
feeding DDGS. Benz et al. (2007), confirmed that backfat, jowl fat, and belly fat IV
increased linearly with increasing dietary levels of DDGS.
The fatty acid composition of pork fat is a reflection of the fatty acid composition
of the diet. Benz et al. (2007) determined that C18:2 (linoleic acid) increased linearly in
backfat, jowl fat, and belly fat depots with increases in DDGS from 0 to 20%, while
saturated fatty acid levels linearly decreased in pork fat depots .
Fat color scores are also affected by inclusion of DDGS in swine growing-
finishing diets. Lightness (L*) decreases in belly fat depots when DDGS inclusion rates
increase (Widmer et al., 2008; Leick et al., 2010). Values for a*, an indicator of redness,
and b*, an indicator of yellowness, as measured in fat depots remain unchanged with the

30
inclusion of DDGS (Widmer et al., 2008).
Pork Quality and DDGS
Pork quality largely remains unchanged with inclusion of up to 30% DDGS in
grower-finisher swine diets. Results from Leick et al. (2010) indicate that increasing
dietary inclusion rates from 0, 15, 30, 45, or 60% DDGS had minimal effects on loin
quality, but decreased belly quality, bacon characteristics, and fat stability. Conversely,
cooking loss, shear force, bacon characteristics, and palatability were not affected by the
inclusion of up to 20% DDGS (Whitney et al., 2006; Widmer et al., 2008; Xu et al.,
2010a). Color characteristics of fresh ground pork shoulder and sausage as measured by
a Hunter MiniScan are improved when 5 % tallow is included in diets containing 30%
DDGS suggesting improved shelf life (Popowski et al., 2010). Feeding pigs 30% DDGS
diets, with or without 5% tallow, did not impact bacon slicing yield or quality, but bacon
from pigs fed DDGS had higher shatter scores compared to pigs fed corn-soybean meal
diets indicating that fat in bacon had a “spider-web” consistency and is less desirable for
consumers (LaBerge et al., 2011).
Strategies to Improve Pork Fat Quality when Feeding DDGS
Several alternatives exist to improve pork fat quality when feeding DDGS diets.
Removal of up to 30% DDGS from the diet for 21 to 30 d prior to harvest has been
shown to be effective in improving pork fat quality (Hill et al., 2008; Beltranena et al.,
2009; Xu et al., 2010a). Likewise, adding 0.6% conjugated linoleic acid to DDGS diets
10 to 30 d pre-harvest increases belly firmness and also improves fresh pork quality
(Schinckel et al, 2000; White et al., 2007). Replacing DDGS with other corn co-

31
products, such as corn germ meal that have reduced oil content also improves pork fat
quality (Widmer et al., 2008). Finally, swine diets can be formulated based on IVP.
Emphasis should be placed on formulating grower-finisher swine diets using IVP in order
to avoid pork carcasses with IV exceeding the recommended threshold (Madsen, 1992;
Boyd 1997).
CLA and Ractopamine
Conjugated linoleic acid (CLA) refers to a group of positional and geometric
isomers of linoleic acid (Eggert et al, 2001; White et al., 2009). Feeding CLA to pigs
increases the proportion of saturated fatty acids and increases belly and backfat firmness
(Ostrowska et al, 1999, Eggert et al., 2001; Dugan et al., 2004). Adding CLA decreased
the IV of the outer backfat layer from 71 to 68 (White et al., 2009). Additionally, bacon
leanness was reduced when 20% or more DDGS was included in the diet to finishing
pigs; however, with the addition of 0.6% CLA, these effects were partially reversed
(White et al., 2009).
Ractopamine is a beta adrenergic agonist that has been shown to increase growth
rate and carcass leanness in pigs (Weber et al., 2006; Schinckel et al, 2010; Gerlemann et
al, 2010). Additionally, feeding ractopamine decreased fatty acid synthesis in porcine
adipose tissues (Mersmann, 1998), which may alter the fatty acid composition of fat
depots. When feeding various levels of ractopamine and metabolizable energy, Evans et
al. (2009) found that ractopamine inclusion decreased SFA and increased MUFA content
of subcutenaous fat and intramuscular fat depots; however, ractopamine supplementation
did not change fatty acid profiles of belly fat. Inclusion of ractopamine in the diet
increased dressing percentage, decreased backfat depth, tended to decrease the SFA
32
content in bellies, but no other fatty acid properties were changed (Weber et al., 2006).
Similarly, Apple et al. (2007) and Leick et al. (2010) concluded that the addition of
ractopamine did not change belly firmness or significantly alter the fatty acid profile of
pork fat depots. However, Weber et al. (2006) concluded that CLA, added soybean oil,
and ractopamine work in an additive fashion to enhance carcass quality.
Tallow as a Supplemental Fat Source
Digestibility
Numerous studies have determined the fatty acid digestibility of tallow in swine
diets. In general, vegetable fats are better digested compared to fats of animal origin
(Cera et al., 1988; Cera et al., 1989). It is well documented that fecal digestibility values
are greater compared to ileal digestibility values when tallow is included in the diet
(Ozimek et al., 1984; Duran-Montge et al., 2007). The increase in fecal digestibility
coefficients may be due to the contribution of lipid from microorganisms in the hindgut
(Cho and Salton, 1966; Dowhan, 1997). However, ileal digestibility values serve as a
better reference point because absorption of fatty acids primarily occurs in the small
intestine. Saturated fatty acids tend to have a lower ileal digestibility than unsaturated
fatty acids (Jorgensen et al., 1993; Overland et al., 1994). Table 1.5 is a compilation of
four studies that determined ileal digestibility of selected fatty acids from either basal
diets or diets that contained various types of animal fat (rendered fat or tallow). In one
study, the digestibility coefficients were negative implying that there was too little C18:1
in the diet, thus providing incorrect estimations of digestibility of C18:1.

33
Table 1.5 Ileal digestibility of select fatty acids in
control diets and diets containing animal fat
Basal diets only
n Minimum Average Maximum
C16:0 4 74.6 83.7 90.9
C16:1 2 69.6 79.1 88.5
C18:0 4 -220.7 -24.3 76.4
C18:1 4 73.9 89.0 92.1
C18:2 4 75.4 88.5 98.5
C18:3 3 82.3 86.7 92.3
Animal fat diets
C16:0 10 64.3 82.4 94.5
C16:1 9 69.6 88.2 98.7
C18:0 10 -157.6 47.3 93.0
C18:1 10 85.1 93.7 97.5
C18:2 10 87.2 95.4 99.0
Adapted from Ozimek et al., 1984; Overland et al., 1994;
Jorgensen et al., 1993; Duran-Montge et al., 2007.
Growth Performance
Increasing dietary corn oil levels improves average daily gain, reduces daily feed
consumption, and improves gain:feed (Allee et al., 1971; Azain et al., 1991; Smith et al.,
1999;Engle et al, 2001). However, Seerley et al. (1978) did not detect any differences in
growth performance when feeding animal or poultry fat compared to feeding a corn-
soybean meal control diet. Allee et al. (1971) found that the addition of tallow to the diet
resulted in a tendency for pigs to gain faster and more efficiently. Barrows also gain
faster and tend to have a lower gain:feed ratio compared to gilts when fed diets
containing various levels of corn oil (Allee et al., 1971).
Carcass Characteristics

34
Miller et al. (1990) observed an increase in last-rib carcass fatness with addition
of 10% animal fat but did not specify the exact source. Loin muscle area was not
affected with addition of animal fat to the diet (Miller et al., 1990). Furthermore, belly
thickness was not affected with the addition of 5% beef tallow to the diet (Apple et al.,
2007). Gilt carcasses contained less backfat, a greater percentage of lean cuts, and a
greater l. dorsi muscle area than barrow carcasses when dietary fat (from corn oil)
increased in the diet (Allee et al., 1971).
Fat Quality
Pigs fed diets containing highly unsaturated sources of fat, such as safflower oil,
sunflower oil, canola oil, have less firm carcass fat which appears oily due to the lower
melting point of the unsaturated fatty acids (Miller et al., 1990). Carcass fat appeared
more oily and softer for pigs fed safflower oil compared to when animal fat or control
diets were fed (Miller et al., 1990). Inconsistent responses have been reported with the
addition of tallow to swine diets. Apple et al. (2007) observed increased total saturated
fatty acid levels of belly fat with dietary tallow inclusion compared to soybean oil
inclusion. However, palmitic and stearic acids, the two predominate saturated fatty acids
in tallow, did not differ in backfat of pigs fed 10 or 20% tallow compared with control
pigs (Brooks, 1971). Monounsaturated fatty acids increased linearly as dietary tallow
inclusion increased from 2.5 to 5.0% in a corn-soybean based diet (Averette Gatlin et al.,
2002). Furthermore, including 10 or 20% tallow resulted in a dramatic reduction of
linoleic acid in backfat (Brooks, 1971; Averette Gatlin et al., 2002) and a reduction in IV
(Apple et al., 2007). Likewise, including tallow in the diet resulted in the reduction of the
unsaturated/saturated ratio in backfat (Brooks, 1971; Apple et al., 2007). Belly-

35
suspension measurements, as indicators of fat firmness, from pigs fed beef tallow were
firmer than from pigs fed soybean oil, and belly fat color scores remained unaffected with
the addition of 5% tallow (Apple et al., 2007).
Pork Quality and Tallow
Lean color, firmness, and texture scores of pork were not different for diets
supplemented with either 10% animal fat or 10% safflower oil compared to control diets
(Miller et al., 1990). Sensory traits between loin chops from animals fed control diets
and diets containing 10% animal fat did not differ (Miller et al., 1990). Additionally,
thaw loss, cooking loss, and total weight loss did not differ with addition of fat (Miller et
al., 1990). Leszczynski et al. (1992) found no significant difference with 4% tallow
addition between saturated and unsaturated fatty acids in longissimus muscle. However,
bellies exhibited a greater change in fatty acid profile compared to the longissimus
muscle. Tallow addition caused the fatty acid composition of bacon to be less saturated
and more unsaturated (Leszczynski et al., 1992). Addition of 5% tallow did not affect
objective color scores of L*, a*, or b* for the rectus abdominus muscle (Apple et al.,
2007).
DDGS and Tallow Interactions
Growth Performance and Carcass Characteristics
Little research has been published on the interactions of combining a saturated fat
source and fibrous feedstuff such as DDGS in diets for growing-finishing pigs on growth
performance and carcass characteristics. Feoli et al. (2007a,b; 2008) fed a combination
of a saturated fat source (tallow) and sorghum-based DDGS to growing-finishing pigs. In

36
2007, they measured growth performance and carcass characteristics of finishing pigs fed
diets containing beef tallow and 40% sorghum-based DDGS. The experimental diets
consisted of a corn-soybean meal control diet and three diets containing 40% DDGS with
0, 2.5, or 5% added tallow to assess the effects of using a saturated fat source with
sorghum DDGS. Average daily gain and ADFI were higher for pigs fed the control diets
compared to pigs fed DDGS. However, increasing tallow from 0 to 5% in the diet
resulted in a linear increase in hot carcass weight, dressing percentage, and linear
decrease in backfat thickness. However, supplemental tallow additions did not improve
fat quality as measured by the iodine value of jowl fat. These results suggest that a
saturated fat source such as tallow will not counteract the negative effects of 40%
sorghum DDGS for finishing pigs even though a few carcass characteristics are
improved.
Later, in 2008, Feoli and co-workers reported the effects of adding various
saturated fat sources including beef tallow, palm oil, stearic acid, and coconut oil to diets
containing 40% sorghum-based DDGS on growth performance and carcass
characteristics. Their results demonstrated that using 40% sorghum DDGS with 5%
added fat, tended to reduce ADG, improve F:G, and reduce carcass fat firmness for all fat
sources except coconut oil. When 5% coconut oil was added to the DDGS diets, the
researchers found that carcass fat firmness levels, measured by iodine value of the jowl
fat, subjective scoring of belly firmness, and tip-to-tip distance of the bellies, was as good
as, or better than the carcass firmness characteristics of the corn-soybean meal control
treatment. Results from Feoli et al. (2008) suggest that carcass firmness may be
improved with the addition of coconut oil. The experiments (Feoli 2007a,b; 2008) imply

37
that feeding 5% tallow and 40% DDGS does not improve pork carcass fat quality
measurements.
Fat and Fiber Digestibility
Apparent ileal digestibility and apparent total tract digestibility of fat increases as
the amount of dietary fat increases (Jorgensen and Fernandaz, 2000; Stein, 2009; Kil et
al., 2010). However, the average apparent digestibility of extracted fat from corn oil was
greater than that of intact fat from corn germ meal, 81.9 and 63.2%, respectively (Kil et
al., 2010). Intact fat sources, such as corn germ meal or DDGS, may have lower
digestibility values because digestive enzymes may not have access to the substrate lipid
because carbohydrate molecules, specifically fiber, may block access to the digestive
lipase. Furthermore, the addition of increasing amounts of purified neutral detergent
fiber (NDF) did not change apparent ileal digestibility (AID), true ileal digestibility
(TID), or true total tract digestibility (TTTD) of fat (Kil et al., 2010). Conversely, other
results have demonstrated that increasing NDF content of the diet decreases the apparent
digestibility of fat (Just, 1982; Hansen et al., 2006).
Digestibility Procedures
Many different methodologies exist to determine fatty acid digestibility in pigs.
Most fatty acid digestibility studies utilize a T-cannula located at the terminal ileum
(Ozimek et al, 1984; Jorgensen et al., 1993; Htoo et al, 2008). With this technique, the
normal physiological function of the digestive tract remains intact. Although simple T-
cannulation is one of the most common techniques utilized to collect digesta, it does not

38
allow for total collection of digesta. Digestibility must be calculated based on an
indigestible marker.
Other techniques used to determine fatty acid digestibility in pigs include: post-
valvular T-cecum (PVTC) (Overland et al., 1994, Yen et al., 2001b) and ileo-rectal
anastomosis (IRA) (Duran-Montge et al., 2007). The cecum is completely removed in
the PVTC cannulation method and is replaced by a large, silicone T-cannula. Drawbacks
associated with the PVTC method relate to the possible physiological effect of cecectomy
on intestinal physiology (Yen 2001b). Finally, an alternative to ileal cannulation, is the
ileo-rectal anastomosis (IRA). This procedure surgically attaches the ileum to the rectum
which allows digesta to bypass the large intestine and be excreted via the anus for total
collection (Gabert et al., 2001; Yen, 2001b). The IRA method has been used for
determination of fatty acid digestibility, but it is largely criticized from an animal welfare
perspective because pigs discharge digesta from the anus following surgery and have a
greater demand for electrolytes and water. Other techniques used to determine
digestibility include the slaughter method; steered ileo-cecal-valve (SIVC) where the
cecum is not removed; and reentrant cannulation, where the flow of digesta is diverted
outside of the pig and returned to either the ileum or cecum.
Length of diet adaptation periods for nutrient digestibility research trials are
inconsistent as reported in the scientific literature. Adaptation periods can be as few as 2
days (Cera et al., 1988; Cera et al., 1989) to as many as 12 days (Noblet and Shi, 1993).
However, a 5-day adaptation period has been most frequently used (Jorgensen et al.,
1993; Jorgensen et al., 2000; Duran-Montge et al., 2007; Mitchaothai et al., 2008).
Inert marker selection and use also varies among published swine nutrient

39
digestibility studies. Common markers include chromium oxide, titanium dioxide, and
acid-insoluble ash. Markers are used to account for changes in the concentration of a
given nutrient (Gabert et al., 2001). As the nutrient of interest is digested and absorbed,
the concentration of the marker increases. When selecting an indigestible marker, it must
not be absorbed from the digestive tract, must be inert, and must not alter digestive
events. Chromium oxide has been is the most widely used marker for digestibility
studies. However, several researchers have reported problems with recovery of the
marker (Moore, 1957, McCarthy et al, 1974, Yin et al., 2001). Furthermore, chromium
oxide may have a carcinogenic effect. Although used less frequently, titanium dioxide is
another marker option. Titanium dioxide has higher recovery rates and is less variable
compared to chromium oxide (Jagger et al., 1992; Kavanagh et al. 2001). According to
Kerr et al. (2010), titanium dioxide is the preferred marker compared to chromic oxide or
iron oxide because it does not alter microbial numbers or bacteria diversity. Yet, when
chromic oxide, iron oxide, and titanium dioxide were compared, no difference in nutrient
digestibility was found (Kerr et al., 2010). Finally, acid-insoluble ash (AIA) is a
naturally occurring marker in the diet, but can increase the AIA content with the addition
of Celite (Kavanagh et al., 2001). Kavanagh et al. (2001) reported that fecal marker
recovery was greatest for AIA, lowest for titanium dioxide, and intermediate for chromic
oxide, 99.9, 92.3, and 96.0%, respectively.
For future digestibility studies, the choosing the best method is contingent upon a
variety of variables. First, the specific procedure selected must meet the needs,
resources, and capabilities of the researcher. Next, factors such as the number of animals
and housing availability should be considered to determine the length and number of

40
adaptation and collection periods. Finally, selection of inert markers is also an important
factor to consider because availability of the marker and recovery during laboratory
analysis are critical for accurate determination of nutrient digestibility.
Summary
Overall, it is clear that pork fat quality is reduced when high concentrations of
DDGS are fed to swine during the growing and finishing phases. Although certain
feeding strategies and management practices exist to minimize the negative consequences
associated with feeding high levels of DDGS, these alternatives are not always readily
available or economical to be implemented by pork producers. Beef tallow is a readily
available and relatively inexpensive supplemental fat source. Due to its low IV and high
level of saturated fatty acids, it appears to be an ideal choice as a supplemental dietary
saturated fat source compared to other animal fats or conventional vegetable oils. The
addition of tallow to the diet may offset the negative effects on pork fat quality when
feeding diets containing high levels of unsaturated fatty acids from DDGS. Furthermore,
the addition of tallow to swine diets has been shown to increase the saturated fatty acids
in the pork depot fat. By feeding these two feedstuffs, pork fat quality issues may be
alleviated even though previous research results reported by Feoli et al. (2007a,b; 2008)
have indicated the contrary when feeding sorghum DDGS diets. However, the effect of
feeding corn DDGS on fatty acid digestibility and how digestibility relates to pork fat
depot fatty acid profiles remains unclear. The objectives of the following studies are to
assess the effects of adding supplemental tallow to diets containing 30% DDGS on
growth performance, carcass characteristics, pork fat quality, and fatty acid digestibility.

41
CHAPTER 2
Effects of adding supplemental tallow to diets containing 30% DDGS on growth
performance, carcass characteristics, and fat quality in growing-finishing pigs

42
OVERVIEW:
A study was conducted to determine the effect of supplementing 5% beef tallow
to grower-finisher diets containing 30% corn dried distillers grains with solubles (DDGS)
on pig growth performance, carcass characteristics, and pork fat quality. Crossbred pigs
(n = 315) were blocked by initial BW (6.8 ± 1.1 kg) and randomly assigned to 1 of 4
dietary treatments in a 3-phase feeding program using a 2 × 2 factorial arrangement of
treatments. Pigs were housed in a confinement facility containing 40 pens, with 7 to 8
pigs per pen, to provide 10 replications per treatment. Gilts and barrows were housed
separately but fed common diets formulated to contain similar levels of available P and
Standardized Ileal Digestible Lys:ME among treatments. Diets consisted of the
following: corn-soybean meal control diet (CON), corn-soybean meal diets containing
5% tallow (T), 30% DDGS (D), and the combination of 5% tallow and 30% DDGS (TD).
Individual pig BW and pen feed disappearance were obtained to calculate ADG, ADFI,
and G:F approximately every 2 wk. For fat quality characteristics, one pig from each pen
was selected that was the closest to average pen BW at the time of harvest (n = 20
barrows and 20 gilts). Data were analyzed using the Proc Mixed functions of SAS with
random effect of block and fixed effects of DDGS, tallow, gender, and DDGS × tallow.
Barrows had higher ADG, ADFI, and backfat, but lower G:F, and percentage carcass lean
than gilts (P < 0.01). Overall ADG did not differ among treatments, but ADFI was higher
for pigs fed CON and D (2.8 and 2.8 kg/d, respectively) due to lower diet caloric density
compared with T and TD (2.6 and 2.5 kg, respectively; P < 0.01). Consequently, pigs fed
T and TD had higher G:F (0.40 and 0.41, respectively; P < 0.01) than those fed CON and
D (0.37 and 0.37, respectively). Carcass yield was greater for pigs fed T and TD (79.5

43
and 79.4%, respectively) compared with pigs fed CON and D (78.8 and 78.3%,
respectively; P < 0.01). Backfat depth was reduced for pigs fed DDGS diets (P < 0.02),
but increased for pigs fed tallow diets (P < 0.01), compared with CON. Hunter L* and
b* values for backfat and belly fat were greater (P < 0.01) for pigs fed CON and T diets
compared to pigs fed D and TD diets. Similarly, Japanese Color Score for belly fat was
higher (P < 0.03) for pigs fed D and TD. Pigs fed D and TD exhibited softer bellies
compared to pigs fed CON and T as indicated by a lower belly flop angle (P < 0.01). An
interaction between DDGS and tallow (P < 0.03) was observed for belly fat iodine value
(IV), indicating that tallow reduced IV when DDGS was included in the diet, compared
to IV of pigs fed diets containing DDGS without tallow. Saturated fatty acid (SFA)
levels in belly fat were reduced (P < 0.01) for T, D, and TD compared to CON. Belly fat
MUFA was not different for pigs fed diets containing DDGS (D and TD), but greater (P
< 0.01) for pigs fed tallow containing diets (T and DT). Belly and backfat PUFA were
higher (P < 0.01) for pigs fed D and TD compared to CON and T. Backfat IV increased
(P < 0.01) when either DDGS or tallow were included in the diet compared to CON. In
summary, adding 5% tallow to 30% DDGS diets improved G:F and carcass yield, but
pigs fed TD tended to have increased backfat depth compared to pigs fed CON. Adding
5% tallow to diets containing 30% DDGS did not improve pork fat firmness.
Key words: DDGS, pigs, pork fat quality, beef tallow

44
INTRODUCTION
Corn dried distillers grains with solubles (DDGS) is a readily available and
economical co-product of ethanol production, and is commonly added to grower-finisher
swine diets to partially replace corn, soybean meal, and inorganic phosphorus. However,
typical DDGS sources contain 10% oil, of which nearly 60% consists of the
polyunsaturated fatty acid, linoleic acid (C18:2; Xu et al., 2010b). Although some
negative growth performance responses have been reported (Whitney et al., 2006;
Linneen et al., 2008), results from several studies have shown that growth performance of
growing-finishing pigs is often unaffected compared to feeding corn-soybean meal diets
when levels up to 30% DDGS are added (Cook et al., 2005; DeDecker et al., 2005;
Gaines et al., 2007). Changes in carcass dressing percent are inconsistent when adding
DDGS to grower-finisher diets (Stein and Shurson, 2009), but pork fat quality is
consistently reduced. Specifically, when pigs are fed increasing levels of DDGS,
polyunsaturated fatty acids (PUFA), C18:2 content, and iodine value (IV) of pork fat are
increased (Widmer et al., 2008 ; Xu et al., 2010b), resulting in reduced belly firmness.
Because tallow is an economical and readily available saturated fat source for use in
animal feed, adding it to diets containing high levels of DDGS may override the negative
consequences associated with feeding DDGS on pork fat quality. Currently, little
information exists on the effects of feeding DDGS diets with supplemental tallow on
growth performance, carcass characteristics, and pork fat quality of grower-finisher pigs.
The objective of this study was to assess the effects of feeding 0 or 30% DDGS, with and
without supplemental tallow (0 or 5 %), on growth performance, carcass characteristics,
and pork fat quality of growing-finishing pigs.

45
MATERIALS AND METHODS
Animals
The University of Minnesota Institutional Animal Care and Use Committee
approved all experimental procedures. A total of 315 mixed sex pigs were housed in an
environmentally controlled grower-finisher facility at the University of Minnesota
Southern Research and Outreach Center in Waseca, MN. Pigs were blocked by initial
BW (6.8 ± 1.1 kg). Barrows and gilts were housed in separate pens (2.0 m × 3.0 m; 7 to
8 pigs/pen). Pens (n = 40) consisted of totally slatted concrete flooring, a self-feeder with
two spaces, and one cup drinker. When the average BW of pigs in each pen was about 30
kg, pens were randomly assigned to 1 of 4 dietary treatments for the beginning of the
experiment.
Dietary Treatments
A single lot of DDGS was obtained from Absolute Energy LLC (Lyle, MN) and
one batch of tallow was sourced from Origo (New Ulm, MN). Samples of DDGS were
analyzed for mycotoxins (HPLC) and fatty acid profile (AOCS 996.06), while tallow was
analyzed for moisture (AOCS Ca2C-25), impurities (Ca3A-46), and unsaponfiables
(Ca6A-40; MIU) and fatty acid profile (AOCS 996.06) by Minnesota Valley Testing
Laboratories (New Ulm, MN; Table 2.1 and Table 2.2) before diet formulation.
Proximate analysis (moisture, AOAC Official Method 934.01; crude fat, AOAC Official
Method 9290.39; crude fiber, AOAC Official Method 978.10, 2006; ash, AOAC Official
Method 942.05; crude protein, AOAC Official Method 984.13) and amino acid (AOAC
Official Method 982.30) content of DDGS were analyzed by the University of Missouri
Agricultural Experiment Station Chemical Laboratories (Columbia, MO). Mycotoxin

46
levels for aflatoxin, fumonisin, vomitoxin, and zearalenone were below industry
thresholds (200 ppb, 5ppm, 1ppm, 3 ppm, respectively; NSNG, 2010). Similarly, MIU
concentration of tallow was 0.42% indicating good quality. Diets consisted of the
following: corn-soybean meal control (CON), CON diet plus 5% tallow added at the
expense of corn (T), CON plus 30% DDGS (D), and CON plus 5% tallow and 30%
DDGS (TD; Table 2.3, Table 2.4). All diets were formulated to contain similar
standardized ileal digestible (SID) Lys:ME and available P content. All other nutrient
requirements met or exceeded NRC (1998) recommendations for pigs based on a lean
tissue gain of 350 g/d. Dietary levels of ME and SID Lys varied among dietary
treatments within each phase, but the SID Lys:ME ratio was maintained constant.
Growth Performance Measurements
Pigs were monitored on a daily basis to observe any adverse health conditions.
Individual pig weights and pen feed disappearance were measured at 2 wk intervals to
determine ADG, ADFI, and G:F. Pigs were fed according to a 3-phase feeding program
with diets changing by phase when average pen BW of 60 or 90 kg was reached. Pigs
had ad libitum access to feed and water for the duration of the experiment.
Carcass Measurements
The day prior to harvest, pigs (n = 315) were tattooed and weighed individually
for subsequent carcass identification. Pigs were harvested when the average BW of all
pigs was 113 kg. Carcass measurements were obtained at a commercial abattoir. Hot
carcass weight was determined on-line. All carcass characteristic measurements were
obtained from the right side of the carcass. Last rib backfat thickness and loin depth were
measured using ultrasound by a trained and certified technician at the abattoir. These

47
data, along with hot carcass weight (HCW) were determined at the commercial abattoir,
were used to calculate the percentage of carcass fat free lean according to procedures
described by NPPC (2002).
Pork Fat Analysis
For pork fat quality measurements, one pig per pen (n = 20 gilts and 20 barrows)
was selected based on BW closest to the average pen BW. Belly length and thickness
were measured and recorded as described by Scramlin et al. (2008). The degree of belly
firmness was assessed by draping the belly skin side down over a smoke stick. Distance
between the inner edges was recorded. The degree of firmness was calculated based on
the following equation (Xu et al, 2010): Degree = (cos-1
[(0.5(L2)-D
2)/(0.5(L
2))]), where
L is half the belly length and where D is the distance between the two ends. Prior to
measurement, bellies were squared up and measured approximately 57.6 cm in length but
belly width was not recorded.
Fat samples were collected from the belly and backfat for fatty acid analysis and
IV calculation. Belly tissue samples, approximately 5-cm diameter were collected at the
midline opposite the last rib. Similarly, a 5-cm sample of back fat was collected at the
10th rib on the right side of each carcass. Belly and backfat were measured for lightness
(L*), redness (a*), and yellowness (b*) using a HunterLab Miniscan with a D65
illuminant at 10⁰ (Hunter Associates Laboratory, Inc., Reston, VA). Belly and backfat
samples were also evaluated for visual fat color by 8 panelists using the NPPC (2000)
Japanese fat color scale (1 = white to 4= yellow). Once fat color scores were obtained,
samples were packed in sealed sample bags, and frozen at -18⁰ C until fatty acid analysis
was performed.

48
Upon analysis, fat was extracted using the Folch et al. (1957) method where a 2:1
chloroform:methanol mixture was used. Extracted fat was methylated to produce fatty
acid methyl esters for gas chromatography according to modifications based on the work
of Metcalfe and Schmitz (1961). Fatty acid profile was determined utilizing gas
chromatography according to AACC 58-17. Iodine value was calculated utilizing the
following equation (AOCS, 1998): (C16:1 ×0.95) + (C18:1 ×0.86) + (C18:2 × 1.732) +
(C18:3 × 2.616) + (C20:1 × 0.785) + (C22:1 × 0.723).
Statistical Analysis
Each pen was used as the experimental until for all data analysis. All analyses
were conduced utilizing the Mixed Procedure of SAS (SAS Inst. Inc., Cary, NC).
Dietary treatments were arranged in a 2 × 2 factorial with random effect of block and
fixed effects of gender, DDGS, tallow, and DDGS × tallow. The significance level was
declared at P < 0.05 and trends are described at 0.10 > P > 0.05. The pdiff option with
Tukey adjustment was used for comparison of treatment least squares means. Pearson
correlation coefficients were determined for associations between the belly and backfat
IV to the IV of the diet using the CORR procedure of SAS (SAS Inst. Inc., Cary, NC).
RESULTS AND DISCUSSION
Growth Performance
No pigs died during the experiment. Overall, ADG did not differ (P > 0.05)
among dietary treatments (Table 2.5). There tended (P < 0.06) to be an interaction
between DDGS and tallow for overall ADFI where the addition of tallow, regardless of
DDGS inclusion, depressed overall ADFI. A main effect of tallow existed for pigs fed T

49
and TD indicating lower (P < 0.01) overall ADFI compared with pigs fed CON and D for
all phases. Similarly, pigs fed D and TD (P < 0.04) exhibited lower overall ADFI
compared to pigs fed CON and T diets. Consequently, overall G:F was improved (P <
0.01) for pigs fed tallow (T and TD) compared to pigs not fed the tallow diets (CON and
D).
In a review by Stein and Shurson (2009), growth performance was usually not
affected by inclusion of up to 30% DDGS in growing-finishing diets. Specifically, 18 of
25 experiments showed no change in ADG, 15 of 23 experiments had no change in
ADFI, and 16 of 25 experiments showed no change in G:F. Occasionally, dietary DDGS
inclusion improved growth performance responses with 1 of 25, 2 of 23, and 4 of 25
experiments for ADG, ADFI, and G:F, respectively. However, in 6 of 25, 6 of 23, and 5
of 25 experiments had reduced ADG, ADFI, and G:F, respectively. Although in the
present experiment, ADG remained unchanged with the inclusion of DDGS compared to
CON, other performance criteria were negatively impacted by including 30% DDGS in
the diet. Specifically, ADFI was reduced with the addition of DDGS. This measure
may have been reduced due to reduced palatability of the DDGS source used as observed
by Hastad et al. (2005a). For example, DDGS may be considered poor quality if it has
been subjected to excessive drying temperatures causing a reduction in digestible amino
acid content (Stein and Shurson, 2009).
Increasing dietary fat level improves ADG, reduces ADFI, and improves G:F
(Allee et al., 1971; Srichana et al, 2005; Hastad et al., 2005b). Reductions of ADFI are
primarily caused by the increase in caloric density of the diet (Averette Gatlin et al.,
2002). Srichana et al. (2005) reported a 0.78 and 0.80% improvement in ADG for early

50
and late finishing pigs, respectively, for every one percentage of supplemental fat added
to the diet. Likewise, for every one percentage addition of supplemental dietary fat, G:F
improves 1.30 and 1.29% for early and late finishing pigs, respectively (Srichana et al.,
2005). Allee et al. (1971) found that the addition of tallow at 4, 7, and 10% of diets
tended to cause pigs to gain faster and more efficiently compared to pigs fed a 1% tallow-
containing diet. Likewise, Linneen et al. (2008) reported that ADG and G:F improved
linearly as the level of choice white grease increased from 0 to 3 or 6%. However, when
feeding a diet containing 30% DDGS and 3% choice white grease, DeDecker et al.
(2005) found no difference in ADG compared to the control, but observed a reduction in
ADFI and an increase in G:F. Similarly, when feeding a diet containing 45% DDGS and
0 or 5% tallow formulated on a true ileal digestible (TID) AA basis, keeping TID lys:ME
constant, Ulery et al. (2010) reported that adding tallow improved ADG and G:F. When
40% sorghum DDGS and 5% beef tallow were fed to pigs, no difference was observed in
G:F, however, ADG and ADFI were lower compared to the corn-soybean meal control
diet (Feoli et al., 2007a; Feoli et al., 2008). In the present study, an interaction between
DDGS and tallow tended to occur (P < 0.06) for ADFI. In this case, ADFI was reduced
when tallow was added to the diet irrespective of the content of DDGS. However, results
from a similar experiment using choice white grease showed no interaction (DeDecker et
al., 2005). Overall, responses due to the addition of supplemental tallow are relatively
consistent in improving ADG, reducing ADFI, and consequently improving G:F.
Growth performance responses for genders observed in the current study are in
agreement with previous findings (Chen et al., 1999; Latorre et al, 2004, Xu, 2010b)
where barrows had a higher ADG and ADFI compared to gilts. These results are not

51
surprising since lean tissue and fat deposition differ between barrows and gilts. Barrows
typically consume more feed, and thus energy, than gilts, and because barrows have a
lower energy need for lean tissue synthesis, extra energy is stored as fat (Cline and
Richert, 2001).
Carcass Characteristics
No pigs were removed from the experiment and all were harvested. Least squares
means for carcass characteristic responses are presented in Table 2.6. Pigs fed T had
greater (P < 0.02) HCW compared with pigs fed CON and D, but were not different from
TD. The addition of DDGS tended (P < 0.08) to cause a reduction of HCW compared to
pigs not fed DDGS. When more than 20% DDGS is fed to growing finishing pigs, HCW
may be reduced (Fu et al, 2004; Whitney et al., 2006; Linneen et al., 2008), whereas
results from other studies showed no change in HCW due to the addition of DDGS to the
diet (Benz et al., 2007; Xu et al., 2010b). The different responses in HCW may actually
be attributed to differences in visceral organ weight and gut fill. Previous research has
demonstrated that pigs fed high levels of fiber have increased gut fill and greater visceral
organ weight (Moeser et al., 2002). Pigs fed diets containing DDGS consumed more
crude fiber and NDF compared to pigs not fed DDGS containing diets (Table 2.4) due to
the fact that DDGS contains a higher concentration of fiber compared to corn and
soybean meal.
Percentage carcass yield and loin depth did not differ due to the addition of 30%
DDGS, and there was no DDGS × tallow interaction, which agrees with results reported
by Fu et al. (2004) and Widmer et al. (2008). However, Feoli et al. (2008) observed that
adding 5% fat to sorghum DDGS diets tended to improve dressing percentage.

52
Conversely, Cook et al. (2005) and Gaines et al. (2007) reported a reduction in carcass
yield when feeding diets containing up to 30% DDGS. However, Gaines et al. (2007)
also detected a reduction in loin depth with feeding DDGS. Carcass yield is often an
inconsistent response when feeding DDGS. These inconsistencies may be due to
increased gut fill and increased intestinal mass due to feeding fiber rich ingredients (Kass
et al., 1980; Anugwa et al 1989; Hansen et al., 1992). However, in the present study, the
addition of tallow caused a significant increase in carcass yield (P < 0.01) where pigs fed
T and TD had higher yields compared with pigs fed CON and D. These results are
consistent with those of other investigators who have demonstrated that adding
supplemental fat increases carcass yield (Hale, et al., 1968; Jackson et al., 2009).
Feeding 30% DDGS caused a reduction in last-rib backfat depth (P < 0.02)
compared to excluding DDGS from the diet. Similarly, including tallow in the diet
caused an increase (P < 0.01) in backfat depth compared to not feeding tallow. The
results of the present study disagree with previous reported results (Cook et al., 2005;
Whitney et al., 2006; and Widmer et al., 2008), which did not show any differences in
backfat depth as a result of feeding DDGS diets. However, Xu et al. (2010b) found a
similar response of backfat reduction while feeding DDGS with backfat depths at 2.92
and 2.74 cm for the control diet and 30% DDGS diet, respectively. Our results agree
with those from Xu et al. (2010b), where pigs fed DDGS had lower backfat depths
compared to pigs fed the control diet. Furthermore, the reduction in backfat observed in
the current study may be explained by the reduction in ADFI with feeding DDGS. Since
addition of 30% DDGS caused a reduction in feed intake, energy intake was reduced,
and, hence, less energy was available for backfat deposition. However, a reduction in

53
ADFI does not necessarily cause a reduction in backfat depth (Fu et al., 2004). Adding
supplemental tallow to the diet caused an increase in backfat depth (P < 0.01), with pigs
fed T exhibiting greater backfat depth compared to all other treatments. These results are
in agreement with those previously reported (Miller et al., 1990; Averette Gatlin et al.,
2002).
Percentage carcass fat free lean was not affected by dietary DDGS inclusion,
which agrees with previous research results (Fu et al., 2004; Cook et al., 2005; Whitney
et al., 2006), but not those reported by Gaines et al. (2007). However, carcass lean
percentage was reduced (P < 0.01) when 5% tallow was included in the diet compared to
diets not containing tallow. Conversely, Averette Gatlin et al. (2002) did not detect any
differences in carcass lean as a result of feeding various types of supplemental fat. The
reduction in percent carcass lean may be attributed to the increased energy density of the
tallow containing diets. Diets containing 5% tallow had higher calculated ME values
and, therefore, a greater concentration of energy to compensate for the reduction in ADFI
from pigs fed tallow. Excess energy above the pig’s requirement may have been
partitioned toward adipose tissue deposition. A significant interaction between DDGS
and tallow for percentage carcass lean was detected (P < 0.04). This interaction can be
explained by pigs fed the TD exhibiting an intermediate carcass lean percentage between
T and D, yet a lower carcass lean compared to pigs fed CON.
Fatty Acid Composition and IV of Backfat and Belly Fat
Pork fat quality can be characterized by belly firmness, iodine value (IV), and
fatty acid composition. Belly firmness, as measured by the belly flop angle, is a more
subjective measurement, but it is a visual tool to define fat firmness. Iodine value can be

54
calculated from the fatty acid profile of adipose tissue and provides a value relative to the
degree of unsaturation in pork fat. Finally, the fatty acid profile of pork fat is the most
specific indicator of pork fat quality. Pork fat quality is of particular importance to
bacon and sausage processors (NPPC, 2000) because soft fat, or fat high in unsaturated
fatty acids, creates challenges associated with processing. Specifically, in bacon
production, soft fat produces bacon slices that appear oily, flatten together, separate from
lean, and are subject to faster rates of oxidation. Current industry standards define
quality pork fat as having less than 15% polyunsaturated fatty acids, more than 15%
stearic acid, and an IV of less than 70 (NPPC, 2000). Previous work has correlated high
C18:2 content with poor fat quality (Cameron and Esner, 1991). Furthermore, Rentfrow
et al. (2003) reported that soft pork fat is associated with more than 14% linoleic acid.
Using average belly thickness as a covariate, belly firmness, measured by the
belly flop angle, was reduced for pigs fed D or TD (P < 0.01) compared to pigs fed CON
or T (Table 2.7). The reduction in belly firmness is in agreement with previous research
when 30% DDGS is included in the diet (Whitney, et al., 2006, Widmer et al., 2008; Xu
et al., 2010b). The addition of tallow tended to improve belly firmness compared to diets
not containing tallow. However, when Feoli et al. (2008) fed diets containing sorghum-
DDGS and 5% stearic acid or coconut oil, they found that the addition of these fat
sources improved the subjective scoring of belly firmness and tip to tip distance between
belly ends, which indicates the synergistic effects of feeding diets containing DDGS and
tallow. Stearic acid is the main saturated fatty acid found in tallow, and may be related to
improvements in belly firmness with dietary inclusion of tallow.
Bellies tended (P < 0.07) to be thicker for pigs fed diets containing tallow

55
compared to pigs not fed tallow, but no main effect of DDGS was evident for belly
thickness (Table 2.7). From the literature, belly thickness responses from feeding DDGS
diets are inconsistent. Whitney et al. (2006) found pigs fed 20 or 30% DDGS had thinner
bellies compared to pigs fed 0 or 10% DDGS, whereas Widmer et al. (2008) did not
report any difference in belly thickness as a result of feeding DDGS. Contrary to the
results from the present study, belly thickness was not affected due to addition of 5% beef
tallow to grower-finisher diets (Apple et al., 2007). Despite the results from the present
study and those reported in the literature, belly thickness may be a function of slaughter
weight, even though final body weight was not different, because heavier animals at
harvest have thicker bellies due to increased fat deposition (Correa et al., 2008).
No DDGS × tallow interactions were detected for pork fatty acid profile in belly
or backfat (Table 2.8). However, main effects of DDGS and tallow were observed in
belly fat and backfat. The lack of interactions suggests that DDGS and tallow do not
synergistically affect pork fat depots. The addition of DDGS or tallow to the diet reduced
total SFA in both belly and backfat depots (P < 0.01). Palmitic acid (C16:0) tended (P <
0.07) to be lower for pigs fed diets containing DDGS in the backfat, but belly fat C16:0
content was not affected by addition of 30% DDGS to the diet. In backfat, C16:0 was
reduced with the addition of tallow (P < 0.01). Stearic acid (C18:0) was lower (P < 0.02)
in belly fat, but not different in backfat, for pigs fed D and TD compared to pigs fed CON
and TD. The reduction of these two saturated fatty acids caused by an increase in DDGS
level agrees with previous results (Benz et al., 2007; White et al., 2009; and Xu et al.,
2010b). Pigs fed T and TD had lower C16:0 content in belly and backfat, and C18:0 was
reduced for pigs fed T and D in belly fat (P < 0.01).

56
In backfat, the addition of 30% DDGS decreased MUFA content (P < 0.01)
compared to diets not containing DDGS while the dietary inclusion of 5% tallow
compared to diets not containing tallow increased MUFA in both backfat and belly fat
depots (Table 2.8). Pigs fed D and TD compared with CON and T had lower levels (P <
0.04) of palmitoleic acid (C16:1) in belly fat, but no differences for C16:1 were observed
among treatments for backfat. Dietary tallow inclusion did not influence C16:1, but oleic
acid (C18:1) increased in both belly and backfat when pigs were fed T and TD (P <
0.001) compared with CON and D. Similarly, pigs fed D and TD had lower
concentrations of C18:1 in the backfat (P < 0.01), and C18:1 tended to be lower in belly
fat (P < 0.08) compared with pigs fed non-DDGS diets. Xu et al. (2010b) found similar
results while feeding diets containing up to 30% DDGS. Similar to the results from the
current study, MUFA concentrations increased in backfat when dietary tallow
concentration increased from 0 to 5% compared to other dietary fat sources (Averette
Gatlin et al., 2002).
Addition of 30% DDGS to the diets nearly doubled the PUFA concentration in
both backfat and belly fat (P < 0.01) compared with CON and T. Linoleic acid (C18:2)
concentrations were higher (P < 0.01) in both belly and backfat when pigs consumed
diets containing DDGS compared to diets not containing DDGS. These findings are in
agreement with previous work (Benz et al, 2007; Leick et al., 2010; Xu et al., 2010a; Xu
et al, 2010b). Linoleic acid is not synthesized by the pig, nor is it significantly modified
prior to deposition (Ellis and McKeith, 1999), so it must be obtained from the diet. Diet
composition easily affects the fatty acid composition in fat depots and skeletal muscle in
growing-finishing pigs (Koch et al., 1968, Brooks, 1971; Nurmberg et al., 1998).

57
Linoleic acid is the predominant fatty acid found in DDGS, and represents approximately
60% of the fatty acid content in corn oil. Furthermore, C18:2 is preferentially deposited
in pork adipose tissue (Koch, 1968), which explains why C18:2 content increases with
the addition of DDGS to the diet.
These results indicate that feeding 30% DDGS diets to growing-finishing pigs
negatively impacts the fatty acid composition of pork fat, which is primarily due to the
relatively high concentration of linoleic acid. Although soft pork fat may be a concern
for pork processors, the increase in PUFA levels in pork fat caused by DDGS inclusion
may be beneficial to human health because increases in PUFA intake are linked to a
reduction to coronary heart disease (Sanders, 2010). Furthermore, the addition of tallow
did little to improve the overall fatty acid profile of backfat and belly fat because
unsaturated fatty acids are preferentially deposited in adipose tissue.
Pork fat IV (Table 2.8), which is a measure of the ratio of unsaturated to saturated
fatty acids, was increased in backfat for pigs fed diets containing DDGS compared to no
DDGS (P < 0.01), and was increased for pigs fed tallow diets compared to pigs not fed
tallow containing diets (P < 0.01). These responses agree with those reported by Feoli et
al. (2007b) who observed an increase in IV when 2.5 or 5% tallow was added to 40%
sorghum DDGS containing diets. A significant interaction (P < 0.03) existed for belly
fat IV where pigs fed D had the highest IV and pigs fed CON had the lowest IV.
However, the IV for TD was greater than the CON but did not differ from T or D. It
remains unclear why a DDGS x tallow interaction was detected for IV in belly fat and not
backfat, but differences in lipogenic activity among adipose tissue sites may be
responsible. It is known that lipogenesis is the first-limiting pathway in the storage of
58
body fat, and it is the most tightly regulated by alterations in energy intake (Vernon et al.
1999). Furthermore, feeding high fat diets has been shown to inhibit de novo fatty acid
synthesis in pigs (Allee et al., 1971), which would allow for fat deposition to mimic the
fatty acid profile of the diet. Comparing different sources of subcutaneous fat, Bee
(2003) determined enzymatic activity of glucose-6-phosphate dehydrogenase, malic
enzyme (both important enzymes that supply NADPH for the reductive biosynthesis of
fatty acids), and fatty acid synthase (which catalyzes the synthesis of palmitate) were
greater when a diet contained a high amount of DE (3,343 kcal/kg) compared to a lower
DE (2,149 kcal/kg) diet. Therefore, in the present study, the calculated DE of the diets
containing tallow was higher (4,125 kcal/kg) compared with diets not containing tallow
(3,965 kcal/kg), which may lead to increased enzymatic activity in the adipose tissue. In
contrast, Widmer et al. (2008) reported that IV of belly fat remained unaffected by DDGS
inclusion. However, this may be explained due to the lower fat content of the control
diets compared to the diets containing DDGS used in this study because 1% soybean oil
was removed from the dietary formulation for each 10% DDGS added to the diet.
Belly fat IV is moderately, but positively correlated (0.49; P < 0.01) to the phase
3 diet IV (Table 2.9). Backfat IV and the phase 3 diet was also strongly associated (0.81;
P < 0.01), which may be linked to the interaction observed between DDGS and tallow in
backfat IV. These findings suggest and agree with previous research findings that
unsaturated fatty acids are preferentially deposited in the backfat compared to other fat
depots (Villegas, 1973).
Objective and Subjective Fat Color Scores
59
Fat color is an important quality characteristic that influences consumer buying
decisions at the retail meat case. The addition of tallow to the diet did not impact
objective nor subjective color scores of belly or backfat, and there were no DDGS ×
tallow interactions. However, the inclusion of 30% DDGS caused a reduction (P < 0.03)
in Hunter L*, a*, and b* values and increases in Japanese Color Scores (Table 2.10).
Simply, including 30% DDGS in the diet caused fat tissue to appear darker, more red,
and more yellow compared to diets without DDGS. Although differences were detected,
the range for all color values are similar to those previously reported (Widmer et al, 2008;
Xu et al., 2010) and there are no specific industry standards for pork fat color.
Lightness, or Hunter L* values, were reduced in belly and backfat depots with the
inclusion of 30% DDGS in the diets (P < 0.01). Values for L* range from 0 to 100 with
0 being black and 100 representing white. Therefore, lower L* values indicate a darker
color. Responses to changes in L* values of backfat and belly fat have been inconsistent,
but the inconsistency may relate to the source of DDGS, feeding duration, and amount
fed. Widmer et al. (2008) observed a trend for decreased L* in belly fat while increasing
DDGS from 0 to 20% in the diet. Xu et al., (2010b) reported that belly fat L* was not
affected by DDGS level, but backfat L* was reduced when pigs were fed 20 or 30%
DDGS. Conversely, Leick et al. (2010) and Xu et al. (2010a) showed no differences in
L* values of belly fat due to the addition of up to 30% DDGS in corn-soybean meal diets.
Pigs fed D and TD had lower Hunter a* in belly and backfat depots (P < 0.02)
compared to pigs fed CON and T, indicating that the fat color had lower red wavelengths.
Others have reported no difference in a* values while feeding DDGS (Widmer et al,
2008; Leick et al., 2010; Xu et al., 2010a; Xu et al., 2010b).

60
Also, in both belly and back fat depots, fat appeared less yellow according to the
Hunter b* values when D and TD were fed (P < 0.01). Xu et al. (2010b) reported no
difference in belly fat b*, whereas backfat b* was linearly increased with increasing
dietary DDGS level, which is in disagreement with the present findings. In addition b*
values remained unaffected by dietary DDGS inclusion (Widmer et al., 2008; Xu et al.,
2010a), and this response is different than the changes in b* values in the current study.
However, it is important to note that fat color is associated with the fatty acid
composition. An increase in the amount of C18:2 and C18:3 in the diet can increase the
yellow color of pork fat (Maw et al., 2003). Japanese color scores (1 = white, 4 =
yellow) were higher, or more yellow, when pigs were fed D or TD (P < 0.03) in both
belly and backfat. However, previous researchers have reported no change in subjective
color scores in backfat and belly fat from feeding diets containing up to 30% DDGS (Xu
et al., 2010a; Xu et al., 2010b). Maw et al. (2003) suggested that an increase in fat
yellowness is not due to the fatty acids themselves, because pure fatty acids remain
colorless, but, rather is more likely due to an increase in the concentration of pigments
such as carotenoids and xanthophylls which are associated with PUFA.
In summary, results from this study suggest that pigs fed a combination diet of
30% DDGS and 5% beef tallow had no difference in ADG, but tended to have reduced
ADFI, without changes in G:F compared to pigs fed a corn-soybean meal diet.
Furthermore, feeding diets containing 30% DDGS or 5% tallow resulted in no difference
in HCW, carcass yield, backfat depth, loin depth, but less carcass fat free lean than pigs
consuming a corn-soybean meal diet. Overall, pigs fed the combination of 30% DDGS
and 5% tallow diets exhibited an increase in iodine value in belly and backfat depots

61
compared to the control diet, indicating that the dietary addition of tallow is ineffective in
reducing pork fat IV in 30% DDGS diets. It is likely, the saturated fatty acid content of
tallow and the amount included in the diet, was not great enough to offset the unsaturated
fatty acids provided by DDGS.

62
Table 2.1. Composition of DDGS and tallow (as-is basis)
DDGS Tallow
Gross Energy, cal/g N/A1
9428.00
Crude Protein, % 26.33 N/A
Moisture, % 13.73 N/A
Crude Fat, % 11.12 99.96
Crude Fiber, % 5.82 N/A
Ash, % 4.25 N/A
Lysine, % 0.96 N/A
MIU2, % N/A 0.42
1N/A= Not analyzed
2MIU = moisture, impurities, unsaponifiables

63
Table 2.2. Fatty acid profile of DDGS and tallow, fatty
acids as a % of crude fat (as-is basis)
DDGS Tallow
Crude fat, % 11.12 99.96
C14:0, % 0.05 2.51
C16:0, % 14.00 23.23
C16:1, % 0.14 2.72
C18:0, % 1.89 20.17
C18:1, % 25.16 43.93
C18:2, % 55.76 3.91
C18:3, % 1.42 0.21
C20:0, % 0.41 0.16
C20:1, % 0.29 0.26
C20:2, % 0.04 0.07
C22:0, % 0.16 0.02
C22:1, % 0.25 0.00
C24:0, % 0.23 <0.01

64
Table 2.3. Composition of diets (as-fed basis)
Phase 1 (30 to 60 kg Phase 2 (60 to 90 kg) Phase 3 (90 to 120 kg)
Ingredient, % CON1
T1
D1
TD1
CON1
T1
D1
TD1
CON1
T1
D1
TD1
Corn 71.85 64.05 47.00 39.50 79.45 72.40 54.90 47.65 84.48 79.30 61.80 54.65
Soybean Meal 25.50 28.30 20.75 23.25 18.10 20.15 13.0 15.25 11.00 13.20 6.10 8.25
DDGS 0.00 0.00 30.00 30.00 0.00 0.00 30.00 30.00 0.00 0.00 30.00 30.00
Beef Tallow 0.00 5.00 0.00 5.00 0.00 5.00 0.00 5.00 0.00 5.00 0.00 5.00
Limestone 0.70 0.70 1.30 1.30 0.55 0.55 1.15 1.15 0.57 0.55 1.15 1.15
Dicalcium
Phosphate
1.00 1.00 0.00 0.00 0.95 0.95 0.00 0.00 1.00 1.00 0.00 0.00
Salt 0.30 0.30 0.30 0.30 0.30 0.30 0.30 0.30 0.30 0.30 0.30 0.30
L-lysine 0.15 0.15 0.15 0.15 0.15 0.15 0.15 0.15 0.15 0.15 0.15 0.15
VTM premix2
0.50 0.50 0.50 0.50 0.50 0.50 0.50 0.50 0.50 0.50 0.50 0.50
Total 100.00 100.00 100.00 100.00 100.00 100.00 100.00 100.00 100.00 100.00 100.00 100.00
1CON = corn-soybean meal control diet, T = CON and 5% tallow, D = CON plus 30% DDGS, TD = CON plus 5% tallow and 30% DDGS.
2Premix supplied the following per kg of diet: vitamin A, 11,000 IU; vitamin D3, 2,756 IU; vitamin E, 55 IU; vitamin B12, 55µg; riboflavin,
16,000 mg; pantothenic acid, 44.1 mg; niacin, 82.7 mg; Zn, 150 mg; Fe, 175 mg; Mn, 60 mg; Cu, 17.5 mg; I, 2 mg; and Se, 0.3 mg.

65
Table 2.4. Nutrient composition of diets (as-fed basis)
Phase 1 (30 to 60 kg Phase 2 (60 to 90 kg) Phase 3 (90 to 120 kg)
Calculated CON1 T
1 D
1 TD
1 CON
1 T
1 D
1 TD
1 CON
1 T
1 D
1 TD
1
ME, Mcal/kg 3.32 3.53 3.31 3.53 3.33 3.54 3.32 3.53 3.33 3.54 3.33 3.54
Crude Fat, % 3.57 3.35 5.79 5.57 3.64 3.43 5.87 5.65 3.70 3.49 5.93 5.71
C18:2, % 1.64 1.70 2.97 3.03
1.74 1.81 3.07 3.13
1.79 1.90 3.16 3.22
SID Lys, % 0.95 1.01 0.96 1.01 0.77 0.81 0.76 0.81 0.59 0.63 0.59 0.63
SID Lys:ME 2.86 2.86 2.90 2.86 2.31 2.29 2.29 2.30 1.77 1.78 1.77 1.783
Analyzed
Moisture, % 12.96 11.90 15.16 12.55 13.14 13.05 13.66 11.41 13.54 13.74 20.44 9.53
Crude Protein, % 17.2 17.25 21.57 21.00 14.02 13.90 18.01 18.16 11.06 12.05 15.53 15.89
Crude Fat, % 2.76 7.39 4.60 8.94 2.45 6.30 5.09 8.49 2.78 6.98 4.56 9.10
Crude Fiber, % 2.10 2.02 3.40 3.26 1.64 1.78 3.12 2.89 1.59 1.63 3.05 2.99
NDF, % 7.65 7.85 17.27 15.71 7.18 7.45 15.89 14.08 8.25 8.60 16.78 16.71
Ash, % 4.87 4.96 5.43 5.08 4.09 3.89 4.61 5.06 3.63 3.74 3.92 4.21
Linoleic Acid, % 1.72 1.58 3.06 3.25
1.62 1.87 2.90 3.14
2.09 2.22 3.53 3.45 1CON = corn-soybean meal control diet, T = CON and 5% tallow, D = CON plus 30% DDGS, TD = CON plus 5% tallow and 30%
DDGS.

66
1CON = corn-soybean meal control diet, T = CON and 5% tallow, D = CON plus 30% DDGS, TD = CON plus 5% tallow and 30% DDGS.
2NS = Non-signficiant (P > 0.10).
a,b,c Within a row, means without a common superscript differ (P < 0.05)
x,yWithin a row, means without a common superscript differ (0.05< P < 0.10)
Table 2.5. Effects of tallow and DDGS on pig growth performance
Trait CON1
T1
D1
TD1
PSE DDGS Tallow Gender DDGS×Tallow
Initial BW, kg 32.70 31.95 32.59 32.38 0.70 NS2
NS NS NS
Final BW, kg 112.69 114.55 112.59 113.27 1.158 NS NS
<0.01 NS
Phase 1
ADG, kg 0.99 1.01 0.96 1.01 0.02 NS <0.02 <0.09 NS
ADFI, kg 2.22ax
2.13a
2.29ay
2.02b
0.04 NS <0.01 <0.05 <0.04
G:F 0.45ax
0.47by
0.42a
0.50bx
0.01 NS <0.01 NS <0.01
Phase 2
ADG, kg 1.04 1.11x
1.07 1.02y
0.02 NS NS <0.01 <0.02
ADFI, kg 2.98 2.81 2.87 2.65 0.04 <0.01 <0.01 <0.01 NS
G:F 0.35a
0.39bc
0.37ac
0.39bc
0.01 NS <0.01 NS <0.10
Phase 3
ADG, kg 1.00 1.01 0.99 1.00 0.02 NS NS <0.01 NS
ADFI, kg 3.06 2.77 3.11 2.69 0.06 NS <0.01 <0.01 NS
G:F 0.33 0.37 0.32 0.37 0.01 NS <0.01 NS NS
Overall
ADG, kg 1.01
1.04
1.01
1.01
0.03 NS NS <0.01 NS
ADFI, kg 2.76a
2.59bc
2.76a
2.45bd
0.01 <0.04 <0.01 <0.01 <0.06
G:F 0.37
0.40
0.37
0.41
<0.01 NS <0.01 NS NS

67
1CON = corn-soybean meal control diet, T = CON and 5% tallow, D = CON plus 30% DDGS, TD = CON plus 5% tallow and 30% DDGS.
2NS = Non-significant (P > 0.10).
3Backfat depth measured at the 10
th rib
a,b,c Within a row, means without a common superscript differ (P < 0.05)
Table 2.6. Effects of tallow and DDGS on carcass characteristics
Trait CON1
T1
D1
TD1
PSE DDGS Tallow Gender DDGS×Tallow
Hot carcass weight, kg 88.58
91.62
88.35
89.37
1.05 <0.08 <0.01 <0.01 NS2
Carcass yield, % 78.77
79.55
78.34
79.35
0.19 NS <0.01 NS NS
Backfat depth3, cm 2.00
2.19
1.91
2.04
0.05 <0.02 <0.01 <0.01 NS
Loin depth, cm 6.99 6.71 6.71 6.74 0.11 NS NS NS NS
Carcass fat-free lean, % 54.99a
53.99bc
54.73a
54.50ac
0.19 NS <0.01 <0.02 <0.04

68
1CON = corn-soybean meal control diet, T = CON and 5% tallow, D = CON plus 30% DDGS, TD = CON plus 5% tallow and 30% DDGS.
2NS = Non-significant (P > 0.10).
a,b Within a row, means without a common superscript differ (P < 0.05)
x,yWithin a row, means without a common superscript differ (0.05< P < 0.10)
Table 2.7. Effects of tallow and DDGS on belly characteristics
Trait CON
1 T
1 D
1 TD
1 PSE DDGS Tallow Gender DDGS×
Tallow
Belly flop angle, ⁰ 133.96 113.42 71.75 57.73 9.56 <0.01 <0.09 NS NS
Belly thickness, cm 3.34
3.64 3.61
3.75 0.12 NS <0.07 <0.04 NS
Belly length, cm 58.28 57.34 58.23 56.46 0.63 NS <0.04 NS NS
Belly fat IV 59.01a
64.22x
71.22b,y
67.88b
1.87 <0.01 NS
<0.05 <0.03
Backfat IV 56.72
61.90
68.31
71.78
1.40 <0.01 <0.01 NS NS

69
1CON = corn-soybean meal control diet, T = CON and 5% tallow, D = CON plus 30% DDGS, TD = CON plus 5% tallow and 30% DDGS.
2NS = Non-significant (P > 0.10).
3SFA = Saturated fatty acids
4MUFA = Monosaturated fatty acids
Table 2.8. Effects of tallow and DDGS on belly and backfat fatty acid composition
Trait CON1
T1
D1
TD1
PSE DDGS Tallow Gender DDGS×Tallow
Belly fatty acid, %
C 16:0 23.29a
20.39b
22.13 20.15b
0.91 NS <0.01 NS NS
C 16:1 2.98 3.07 2.40 2.46 0.29 <0.04 NS NS NS
C 18:0 13.63a,x
12.20 11.61y
11.37b
0.56 <0.02 NS NS NS
C 18:1 45.23a
50.90b
43.36a
47.54 <0.08 <0.01 NS NS
C 18:2 8.49a
8.85a
16.41b
15.67b
1.12 <0.01 NS NS NS
SFA3
38.93a
34.05b
34.13b
32.40b
1.09 <0.01 <0.01 NS NS
MUFA4
51.08
57.47a
48.65b
56.24a
2.10 NS <0.01 NS NS
PUFA5
8.51a
9.19a
17.23b
16.08b
1.23 <0.01 NS NS NS
Backfat fatty acid, %
C 16:0 24.49a
21.99b
23.60c
20.32b,d
0.66 <0.07 <0.01 NS NS
C 16:1 1.60 1.59 1.88 1.09 0.27 NS NS NS NS
C 18:0 18.04a
14.15b
16.70 14.25b
0.88 NS <0.01 NS NS
C 18:1 43.90a,x
46.64a,y
39.86b
44.82a
0.78 <0.01 <0.01 NS NS
C 18:2 8.81a
9.65a
18.04b
18.40b
0.98 <0.01 NS NS NS
SFA3
42.79a
37.89 39.77a
33.11b
1.60 <0.01 <0.01 NS NS
MUFA4
48.39a,d
53.96b
42.66c
47.12d
1.01 <0.01 <0.01 NS NS
PUFA5
8.89a
9.92a
18.05b
18.45b
1.00 <0.01 NS NS NS

70
5PUFA = Polyunsaturated fatty acids
a,b,c,d Within a row, means without a common superscript differ (P < 0.05)
x,yWithin a row, means without a common superscript differ (0.05< P < 0.10)
Table 2.9. Correlation of belly fat and backfat IV to Phase 3 diet IV
Pearson
Correlation
Coefficient
P-value
Belly fat IV and diet IV 0.49 < 0.01
Backfat IV and diet IV 0.81 < 0.01
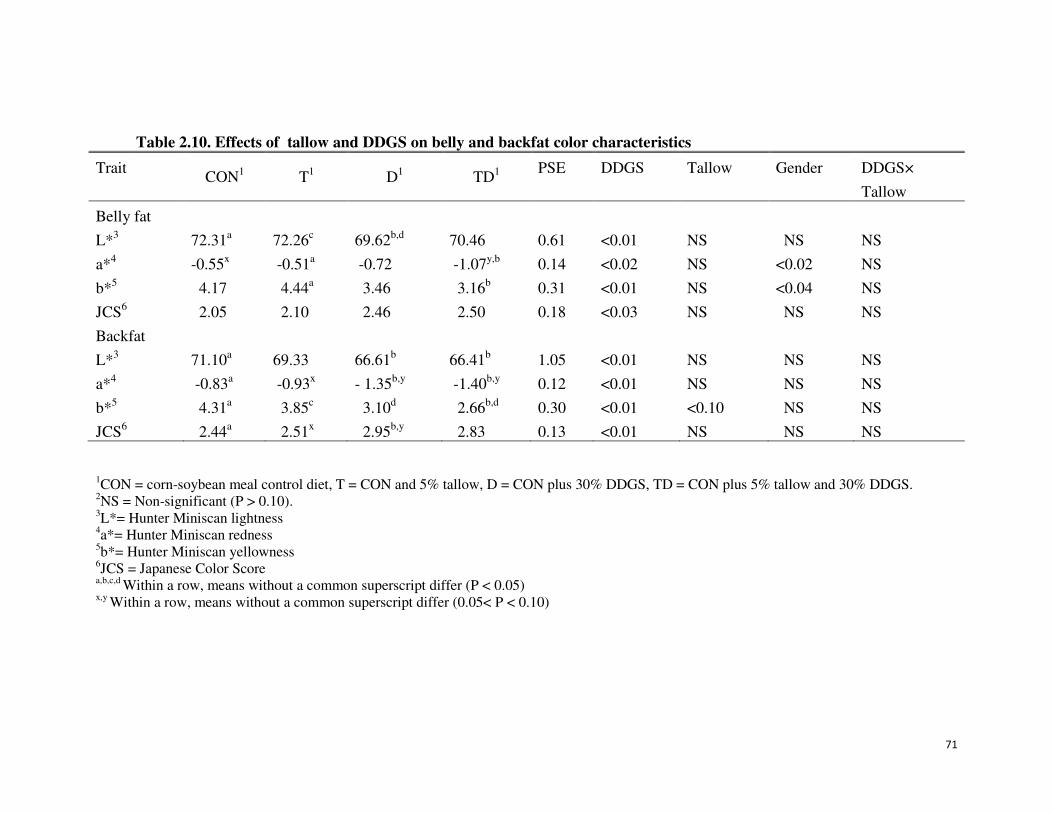
71
1CON = corn-soybean meal control diet, T = CON and 5% tallow, D = CON plus 30% DDGS, TD = CON plus 5% tallow and 30% DDGS.
2NS = Non-significant (P > 0.10).
3L*= Hunter Miniscan lightness
4a*= Hunter Miniscan redness
5b*= Hunter Miniscan yellowness
6JCS = Japanese Color Score
a,b,c,d Within a row, means without a common superscript differ (P < 0.05)
x,y Within a row, means without a common superscript differ (0.05< P < 0.10)
Table 2.10. Effects of tallow and DDGS on belly and backfat color characteristics
Trait CON
1 T
1 D
1 TD
1 PSE DDGS Tallow Gender DDGS×
Tallow
Belly fat
L*3
72.31a
72.26c
69.62b,d
70.46 0.61 <0.01 NS NS NS
a*4
-0.55x
-0.51a
-0.72 -1.07y,b
0.14 <0.02 NS <0.02 NS
b*5
4.17 4.44a
3.46 3.16b
0.31 <0.01 NS <0.04 NS
JCS6
2.05 2.10 2.46 2.50 0.18 <0.03 NS NS NS
Backfat
L*3
71.10a
69.33 66.61b
66.41b
1.05 <0.01 NS NS NS
a*4
-0.83a
-0.93x
- 1.35b,y
-1.40b,y
0.12 <0.01 NS NS NS
b*5
4.31a
3.85c
3.10d
2.66b,d
0.30 <0.01 <0.10 NS NS
JCS6
2.44a
2.51x
2.95b,y
2.83 0.13 <0.01 NS NS NS

72
CHAPTER 3
Effects of adding supplemental tallow to diets containing DDGS on fatty acid
digestibility in growing pigs

73
OVERVIEW:
An experiment was conducted to determine the ileal and fecal digestibility of fatty
acids in diets containing 2 levels of DDGS (0 or 30%) and 3 levels of tallow (0, 5, or
10%). A total of 24 barrows were surgically fitted with a T-cannula at the distal ileum.
Pigs were randomly assigned to one of six different dietary treatments. Diets were
formulated to contain a constant SID Lys to ME ratio. Celite was added to the diets at
0.3% as an indigestible marker. Dietary treatments consisted of the following: corn-
soybean meal control (CON), CON plus 5% tallow (5T0D), CON plus 10% tallow
(10T0D), CON plus 30% DDGS (0T30D), CON plus 30% DDGS and 5% tallow
(5T30D), and CON plus 30% DDGS and 10% tallow (10T30D). Eight replications per
treatment were achieved by randomizing diets among pigs for a second collection period.
Feed was supplied at a daily level equivalent to 3 times the maintenance ME requirement
and was divided into two equal meals per day. Each pig was fed their respective diet for a
5-d adaptation period, with 3-d fecal, and 2-day digesta collection periods. Collections
occurred from 0800 to 1200 h and from 1600 to 2000 h. All samples were immediately
frozen at -18⁰C. Digesta samples were pooled within pig and freeze-dried for analysis.
Digestibility was determined using the index method. Significant interactions between
DDGS and tallow were observed for all fatty acids (P < 0.05), except for fecal C18:2 and
fecal PUFA digestibility, which were not affected by dietary treatment. Fecal MUFA
digestibility ranged from 88.18 to 96.46%, and was highest for 5T0D (94.97%) and
10T0D (96.40%) and lowest for CON (88.18%) and 0T30D (89.18%; P < 0.05).
Conversely, fecal SFA digestibility was more variable among dietary treatments ranging
from 64.78 to 85.41%. It was lowest for 0T30D, 5T30D, and 10T30D (64.78, 66.29,

74
66.70%, respectively), and highest for 5T0D and 10T0D (80.70, 85.41%, respectively; P
< 0.05). Ileal digestibility of MUFA ranged from 74.42 to 85.95%, and was lowest for
CON (74.42%), but highest for 10T0D (85.95%; P < 0.05). Ileal PUFA digestibility
ranged from 57.37 to 77.28% and was lowest for 10T30D (57.37%) and highest for CON
(76.00%; P < 0.05), even though DDGS contains a high proportion of PUFA. The
amount of digestible fatty acids increased with the addition of DDGS and tallow
regardless of digestibility. Amounts of digestible MUFA and PUFA digested increased
when DDGS (P < 0.01) and tallow (P < 0.01) were included in the diet compared to when
either ingredient was excluded. These increases in digestible MUFA are a reflection of
the MUFA and PUFA concentration in the diet. For digestible SFA, an interaction (P <
0.01) between DDGS and tallow was observed. Diets containing 10% tallow, with or
without DDGS, contained the greatest concentration of digestible SFA (3.32 and 3.41%)
compared with all other diets (0.63 to 2.18%). Although combining 5 or 10% tallow and
30% DDGS generally reduced the digestibility of nearly all fatty acids compared to CON
and 0T30D, the amount of fatty acids digested mimics the fatty acid profile of the diet
indicating that the amount of fatty acids digested is a function of the amount of fatty acids
in the diet.
Key words: DDGS, fatty acid digestibility, tallow
INTRODUCTION
As U.S. ethanol production has increased in recent years, so has the production
and utilization of corn co-products, such as dried distillers grains with solubles (DDGS),
in swine diets. However, as the concentration of DDGS increases in growing-finishing

75
swine diets, pork fat quality is negatively affected (Widmer et al., 2008; Xu et al., 2010).
Specifically, when high levels of DDGS are included in the diet, polyunsaturated fatty
acids (PUFA), C18:2 content, and iodine value (IV) of pork fat are increased (Stein and
Shurson, 2009; Xu et al., 2010b). Consequently, Xu et al. (2010b) and Widmer et al.
(2008) have demonstrated that belly firmness is reduced when high levels of DDGS are
included in grower-finisher diets. However, because tallow is an economical and readily
available saturated animal fat source, it may override the negative consequences
associated with feeding high levels of DDGS and improve pork fat quality.
Because the composition of dietary fat directly affects the fatty acid composition
of pork fat (Koch et al., 1968; Brooks, 1971; Nurmberg et al., 1998), it is essential to
determine fatty acid digestibility in DDGS diets to more fully understand changes that
occur in pork fat quality when DDGS is fed to growing-finishing pigs. No data have
been published related to the digestibility of fatty acids in corn DDGS for swine.
However, Stein (2009) reported the digestibility coefficients of acid-hydrolyzed ether
extract and found that high protein DDGS and conventional DDGS had greater
digestibility of fat than high oil corn and corn germ, which suggests that the fermentation
process in ethanol production may increase fat digestibility. Stein and Shurson (2009)
reported that DDGS contains approximately 25.3% NDF. Urriola et al. (2010) reported
that apparent total tract digestibility (ATTD) of NDF among 8 corn DDGS sources
averaged 59.3%, but ranged from 51.6 to 65.8%, and ATTD of total dietary fiber ranged
from 39.4 to 56.4%. These results indicate that considerable variability in fiber
digestibility exists among DDGS sources, which is likely a significant contributing factor
to the variability in DE and ME content. Several researchers have shown that apparent fat

76
digestibility is significantly reduced when dietary fiber increases (Dierick et al., 1989;
Noblet and Shi, 1993; Shi and Noblet, 1993). Although several reports have been
published regarding the fatty acid digestibility of beef tallow in swine diets (Ozimeck et
al., 1984; Duran-Montge et al., 2007; Mitchaothai et al., 2008), the interactive effects
between DDGS and tallow on fatty acid digestibility are unknown. By understanding
these interactive effects, it may provide useful information to predict pork fat quality
effects when growing-finishing pigs are fed diets containing DDGS and tallow.
Therefore, the objective of this study was to determine the effects of increasing dietary
levels of DDGS and tallow on ileal and fecal fatty acid digestibility in growing pigs.
MATERIALS AND METHODS
Animals and Housing
The University of Minnesota Institutional Animal Care and Use Committee
approved all procedures for this experiment. A total of 28 barrows (initial BW = 25 kg)
from Landrace × Yorkshire sows (Topigs, Winnipeg, Manitoba, Canada) and Duroc
boars (Comparts Boar Store, Nicollet, MN) were surgically fitted with a T-cannula at the
distal ileum following procedures similar to Jendza et al. (2011) and Dilger et al. (2004).
Following surgery, pigs were housed in individual metabolism stalls for a minimum of 2
wk to allow for recuperation before initiating the experiment. Pigs were slowly
reintroduced to feed during the recuperation period, and had near ad libitum access by the
end of the 2-wk period. Four of the 28 pigs served as replacements to account for the
possibility of unretained cannulas, poor recovery, or death of cannulated pigs.
Cannulation procedure
Feed was withdrawn 18 to 24 h prior to surgery. Sedation was achieved by

77
injecting a cocktail mixture of Telazol (1.1 mg each of tiletamine and zolazepam/kg BW;
Pfizer, New York, NY), ketamine (1.1 mg/kg BW; Pfizer, New York, NY), and xylazine
(1.1 mg/kg BW; Lloyd Inc., Shenandoah, IA) administered at 0.044 mL/kg BW.
Induction of anesthesia was maintained with 2% isoflurane and oxygen at 1.0-1.2 L/min.
Surgery procedures were similar to Jendza et al. (2011) and Dilger et al. (2004), but
varied slightly. In the present experiment, an incision approximately 10 cm parallel and
caudal to the last lib was made on the right side of the pig. The ileocecal junction was
located, exteriorized, and a 4 cm incision was made approximately 5 cm cranial to the
ileocecal junction. A stainless steel T-cannula was inserted into the distal ileum and a
purse stitch was used to anchor the cannula and close the intestine. A small (2 cm)
incision was created between the last second and third ribs. The cannula was carefully
excised through the fistula. Once through the skin, the wings of the cannula were
checked so they followed the contours of the ribs. Two round washers were placed on
the cannula, and the cannula was capped. The main incision was closed in 3 layers
utilizing a continuous stitch, and the last layer was closed with a subcuticular stitch which
resulted in no external suture, thus minimizing the risk of bacterial infection.
Diets
The DDGS source used in this study was obtained from Absolute Energy, LLC (Lyle,
MN) and tallow was sourced from Origo (New Ulm, MN). Before diet formulation, proximate
analysis (moisture, NFTA 2.2.2.5; Ash, AOAC 923.03; crude fat, AOAC 920.39; crude fiber,
AOAC 962.09; crude protein, AOAC 990.03), mycotoxins (AOAC 991.31), and fatty acid profile
(AOCS 996.06) analysis were conducted for DDGS (Table 3.1) at Minnesota Valley Testing
Laboratories (New Ulm, MN), and amino acid levels (AOAC 982.30 E [a,b,c]) were assessed by
the University of Missouri Agricultural Experiment Station Chemical Laboratories (Columbia,

78
MO). The fatty acid profile of tallow was analyzed (AOCS 996.06) by Minnesota Valley Testing
Laboratories (New Ulm, MN). Analyzed nutrient values for DDGS (26.17% crude protein,
10.66% moisture, 11.14% crude fat, 6.93% crude fiber, 4.34% ash, 0.95% lysine) and
tallow were used in diet formulation, with the following assumptions for digestibilities of
nutrients: lysine, 63%; methonine, 82%; tryptophan, 69%; threonine, 71% (Urriola, 2007); and
available phosphorus 77% (NRC, 1998).
Six experimental diets (Table 3.2, Table 3.3) were formulated to contain two
levels of DDGS (0 or 30%) and three levels of tallow (0, 5, 10%). Diets consisted of the
following: corn-soybean meal control (CON), CON plus 5% tallow (5T0D), CON plus
10% tallow (10T0D), CON plus 30% DDGS (0T30D), CON plus 30% DDGS plus 5%
tallow (5T30D), and CON plus 30% DDGS plus 10% tallow (10T30D). All diets were
formulated to contain similar ME:standardized ileal digestible (SID) Lys and available
phosphorus content. All other nutrients met or exceeded NRC (1998) recommendations
for 40 kg pigs. Celite was added at a level of 0.3% to all diets as an indigestible marker
to increase the acid insoluble ash content of diet. Feed was supplied to pigs at a daily
level equivalent to 3 times the maintenance energy requirement (106 kcal ME/kg BW
0.75). This daily amount was divided into two equal meals supplied at 0800 and 1600 h.
Each pig was fed their corresponding diet for a 5-d adaptation period.
Sample Collection and Chemical Analysis
Fecal samples, using the grab sample technique, were collected on d 6, 7, and 8,
immediately after the morning and evening feedings. Rectal palpation was performed to
ensure a fresh fecal sample. Fecal samples were pooled by animal and immediately
frozen at -18⁰ C until analysis was conducted. Samples were dried at 55⁰ C in a forced
draft oven and ground to pass through a 1 mm screen for fatty acid analysis.

79
Ileal digesta samples were collected on d 9 and 10 for two- 4 h periods throughout
the collection days. Collections occurred from 0800 to 1200 h and from 1600 to 2000 h.
Immediately following a feeding, cannulas were opened and a 500 ml Whirl-pak bag
containing 10 ml of a 10% formic acid solution was attached to the cannula barrel with a
rubber band. Bags were removed when half-full or at 30 min intervals, whichever came
first. All samples were immediately frozen in -18⁰ C. Digesta samples were pooled
within pig and freeze-dried for analysis.
Feed, feces, and digesta samples were analyzed for acid insoluble ash and fatty
acid content. Acid insoluble ash was determined where a 5 g sample was digested in HCl,
filtered and washed with boiling distilled water, and ashed in a 600⁰ C oven (AOAC
942.05). Fatty acid analysis of diets, feces and ileal digesta was performed commercially
(Lipid Technologies, LLC, Austin, MN) using gas chromatography to separate fatty acid
methyl esters according to the AOCS (1998) method Ce 1-62. All fatty acids from C12:0
to C24:1 were measured.
Calculations and Statistical Analysis
Digestibility values were calculated based on the index method utilizing the
following equation where feces could be interchanged for digesta:
Digestibility, % = 100 − [100 × ([���� ���×[�������� �����
[���� �����×[�������� ���)
Amount of digestible fatty acids was determined by multiplying the amount of fatty acid
in the diet by apparent ileal digestibility coefficient for each individual fatty acid.
Each pig was used as the experimental unit for all data analysis. All analyses
were conducted utilizing the Mixed Procedure of SAS (SAS Inst. Inc., Cary, NC).

80
Dietary treatments were arranged in a 2 × 3 factorial arrangement with fixed effects of
DDGS, tallow, and DDGS × tallow interaction. The significance level was declared at P
< 0.05 and trends are described at 0.10 > P > 0.05. The pdiff option with Tukey
adjustment was used for comparison of treatment least squares means.
RESULTS AND DISCUSSION
Fecal Digestibility
Fecal fatty acid digestibility was generally greater than ileal digestibility (Table
3.4), which agrees with previous research results where fecal digestibility values were
greater compared to ileal digestibility values when tallow was included in the diet
(Duran-Montge et al., 2007; Ozimek et al., 1984). Fatty acids from C12:0 to 24:1 were
measured. Of primary interest were the four predominate fatty acids (C16:0, C18:0,
C18:1, and C18:2) found in swine diets, along with the collection of MUFA, PUFA, and
SFA. The remaining fatty acids were found in low quantities (< 2.5% of total lipid
profile) in the diet and are not discussed (C14:0, 16:1; C18:3; C18:4. C20:0, C20:1,
C20:4, C20:5, C22:0, C22:1;C24:0)
An interaction (P < 0.01) between DDGS and tallow was observed for fecal C16:0
digestibility, which suggests that feeding diets containing DDGS and tallow reduces
digestibility of C16:0 compared to pigs fed no DDGS and no tallow. Furthermore, pigs
fed 30% DDGS and 5% tallow had reduced concentrations of C16:0 in both belly and
backfat depots compared to pigs fed the control diet, which is likely due to the lower
digestibility of C16:0 (Pomerenke, 2012, unpublished). Furthermore, main effects of
DDGS and tallow were observed. The addition of 30% DDGS also caused a reduction in
C16:0 digestibility compared to pigs not receiving diets containing 30% DDGS. The

81
results from the present experiment agree with previous results (Ozimek et al., 1984;
Duran-Montge et al., 2007; Mitchaothai et al., 2007) suggesting that C16:0 fecal
digestibility is greater from tallow compared to other vegetable based sources including:
rapeseed oil, sunflower oil, or linseed oil. Fecal digestibility of C16:0 decreased (P <
0.01) when tallow was included in the diet, compared to when tallow was absent from the
diets.
Similar to C16:0 fecal digestibility, a significant interaction was detected between
DDGS and tallow (P < 0.01) for C18:0, where diets containing tallow had greater
digestibility compared to CON or 0T30D. Diets containing both DDGS and tallow had
lower fecal digestibility compared to tallow diets without DDGS. Pigs fed CON had
greater C18:0 deposited in their belly and backfat compared to all other treatments
(Pomerenke, 2012, unpublished), which is surprising because we observed a negative
digestibility value for C18:0 in the CON diet. The negative value is likely the result of a
low C18:0 concentration in the diet (Table 3.4) along with endogenous fat secretion from
mucosa cells in the colon, sloughing of endoepithelial cells, or de novo synthesis
(Overland et al., 1994). The inclusion of 30% DDGS in diets resulted in an increase (P <
0.01) in fecal C18:0 digestibility compared to pigs consuming diets with no DDGS.
Likewise, when tallow was included in the diet, digestibility of C18:0 increased (P <
0.01) compared to when tallow was not included in the diets. These results are in
agreement with previous results (Ozimek et al., 1984; Duran-Montge et al, 2007;
Mitchaothia et al., 2007; Mitchaothia et al., 2008) where fecal C18:0 digestibility was
greater when diets contained tallow compared to control or vegetable oil-supplemented
diets (sunflower, linseed, or rapeseed oil).

82
A significant interaction existed for fecal C18:1 (P < 0.01). The CON and 5T30D
had the lowest digestibility of C18:1 compared to diets containing only tallow or DDGS.
However, when tallow was included in the diets without DDGS, digestibility increased
compared to CON. Surprisingly, pigs fed the 30% DDGS diet exhibited a C18:1
digestibility similar to those fed the 5 and 10% tallow diets (97.7, 97.5, 98.0%,
respectively). It is possible that the fiber fraction in DDGS is responsible for the reduced
C18:1 digestibility. Stein (2009) found that acid-hydrolyzed ether extract of corn oil is
more digestible than intact forms of oils. However, of intact fat sources, high protein
DDG and DDGS had greater digestibility of fat compared to high oil corn and corn germ.
This suggests, that in DDGS, the fermentation process for ethanol production may have
liberated some oil or made fat slightly more digestible in DDGS compared to high oil
corn and corn germ. Intact fat sources, such as corn germ meal or DDGS, may have
lower digestibility values because digestive enzymes may not have access to the lipid
substrate because carbohydrate molecules, specifically fiber, may block access to the
digestive lipase (Stein, 2009). Oleic acid (C18:1) is one of the predominant fatty acids in
pork fat. Furthermore, it is the main fatty acid in beef tallow. In DDGS, C18:1 is
typically the second most abundant fatty acid following C18:2. Regardless, a significant
main effect of the addition of DDGS to the diet was not detected in the present study.
However, the main effect of adding tallow to the diet increased fecal C18:1 digestibility
(P < 0.01) compared with diets not containing tallow. The increased C18:1 fecal
digestibility response due to tallow addition to the diet is not in agreement with some
results, but in agreement with others in the published literature. When Duran-Montge et
al. (2007) fed diets containing 10% tallow, digestibility of C18:1 increased compared to

83
control and linseed oil containing diets. However, when Mitchaothia et al. (2007) fed 5%
tallow diets, digestibility decreased compared to a diet containing sunflower oil. The
discrepancy between previously reported fecal C18:1 digestibility responses may relate to
the basal ingredients of the diets, barley (Duran-Montge et al,. 2007) vs. cassava chips
and soybean meal (Mitchaothia et al,. 2007), or the concentration of tallow in the diets.
Furthermore, the differences in responses may be due to the differences in the type and
level of fiber due to an interaction between fat and fiber components.
MUFA represent over 50% of the fatty acids in pork fat depots (Xu et al., 2010),
and represents approximately one-third of the fatty acids in diets. An interaction between
DDGS and tallow existed for MUFA fecal digestibility (P < 0.01). Regardless of dietary
DDGS inclusion, adding 5 or 10% tallow to diets increased fecal MUFA digestibility
compared with CON or 30% DDGS diets. However, when increasing levels of tallow
were added to 30% DDGS diets, fecal digestibility was not as great (91.4 and 93.3%,
respectively) compared with when DDGS was absent from the diet (5T0D, 10T0D; 95.0,
96.4, respectively). Main effects of DDGS (P < 0.01) and tallow (P < 0.01) were
detected for MUFA. The dietary addition of DDGS decreased fecal MUFA digestibility,
whereas adding supplemental tallow increased MUFA digestibility. Contrary to the
present results, Mitchaothia et al. (2007) found a decrease in MUFA digestibility with the
addition of tallow compared to a cassava chip-soybean meal diet supplemented with
sunflower oil which suggests that the fatty acid profile of ingredients ultimately impact
digestibility.
For SFA, an interaction between DDGS and tallow was also observed (P < 0.01).
With increasing levels of tallow in diets without DDGS (5T0D, 10T0D), fecal SFA

84
digestibility increased (80.7, 85.4%, respectively) compared to the control diet (65.4%).
However, when DDGS and increasing levels of tallow were added to the diet (5T30D,
10T30D), fecal digestibility of SFA was not different compared to when DDGS was not
present in the diet. The addition of 30% DDGS resulted in a reduction in SFA
digestibility (P < 0.01), whereas diets lacking DDGS had an increase in SFA digestibility.
Furthermore, 5 or 10% dietary inclusion of tallow increased SFA digestibility (P < 0.01).
Mitchaothai et al. (2007) suggested that pigs fed diets supplemented with sunflower oil
compared to tallow had an increased digestibility of unsaturated fatty acids because
micelles are formed more easily. The position of the fatty acid on the triglyceride also
plays an important role because fatty acids at the 2-position are better digested than those
at the 1 and 3- positions (Bracco, 1994, Nelson and Innis, 1999). Thus, the resulting 2-
monoglycerol is efficiently incorporated into the micelle (Lien, 1994). Sunflower oil is
similar in composition to corn oil, with corn oil being higher in C18:2 and sunflower oil
being higher in C18:1, suggesting that the same relationship described by Mitchaothai
may also apply to DDGS.
Apparent Ileal Fatty Acid Digestibility and Amount of Digestible Fatty Acids in Diets
Ileal digestibilities are superior to fecal digestibility fatty acid values when fish
oil, rapeseed oil, or coconut oil are fed (Jorgensen et al., 2000), but fecal digestibilities
are greater than ileal digestibilites when tallow is included in the diet (Duran-Montge et
al., 2007; Ozimeck et al., 1984). These differences are likely due to the saturation of the
fatty acid, with unsaturated fatty acids having higher digestibility compared to saturated
fatty acids (Jorgensen et al., 1993; Overland et al., 1994). Furthermore, fecal digestibility
coefficients are greater compared to ileal digestibilites due to the contribution of

85
phospholipids to total lipid from microorganisms found in the large intestine (Cho and
Salton, 1966; Dowhan, 1997). Ileal digestibility values are better suited for use in
predicting the digestibility of dietary fatty acids because fatty acid absorption occurs
along the small intestine. The proximal jejunum is the main site of lipid absorption, and
all fatty acids are nearly absorbed by the time digesta reaches the ileum (Pond et al.,
1995; Yen, 2001). In the present study, ileal digestibility values were quite similar in
magnitude and direction to fecal digestibility values, and significant interactions between
DDGS and tallow (P < 0.04) were observed for ileal C16:0, C18:0, C18:2, PUFA, and
SFA digestibilities (Table 3.4).
A significant interaction was detected (P < 0.01) between DDGS and tallow for
C16:0 apparent ileal digestibility. When both DDGS and tallow are included in the diet,
digestibility of C16:0 was lower compared to all other dietary treatments. This
interaction of DDGS and tallow may explain why belly and backfat depots have a
reduced concentration of C16:0 when pigs are fed a combination diet compared to CON
(Pomerenke, 2012, unpublished). Main effects of DDGS (P < 0.01) and tallow (P < 0.01)
were also detected for apparent ileal digestibility of C16:0. Adding 30% DDGS lowered
C16:0 apparent ileal digestibility compared to diets not including DDGS. Furthermore,
the addition of tallow also decreased the apparent ileal digestibility of C16:0 compared
with diets not containing tallow. The results from the present study are in disagreement
with previous research results where the addition of tallow increased C16:0 ileal
digestibility compared to rapeseed oil (Ozimek et al., 1984) and sunflower oil (Duran-
Montge et al., 2007). It is well known that saturated fatty acids are less digestible
compared to unsaturated fatty acids (Jorgensen et al., 1993; Overland et al., 1994). The

86
reduction in digestibility of C16:0 may be related to the lipid structure because saturated
fatty acids are more stable and less chemically reactive compared to unsaturated fatty
acids (Food Fat and Oils, 2006). Furthermore, the reduction in C16:0 digestibility in
DDGS diets may be due to fiber surrounding the dietary triglycerides impeding the
digestion process and preventing lipase enzymes from accessing the lipid. Finally, an
interaction (P < 0.01) between DDGS and tallow was observed for the percentage of
digestible C16:0 (Table 3.4). As the level of DDGS and tallow increased in the diets, the
percentage of digestible C16:0 also increased (P < 0.01). Diets containing 10% tallow
(10T0D and 10T30D) had the greatest amount of C16:0 digested (1.83 and 1.89%,
respectively) compared to all other diets, but these diets also contained the greatest
concentration of C16:0 (2.24 and 2.76%, respectively). Furthermore, main effects of
DDGS and tallow were detected. The addition of 30% DDGS resulted in an increase (P
< 0.01) in the amount of digestible C16:0. Likewise, as the amount of tallow in the diet
increased (P < 0.01) the amounts of digestible C16:0 also increased.
There was a DDGS and tallow interaction for C18:0 digestibility indicating that
when 5 or 10% tallow was included in diets without DDGS, ileal digestibility of C18:0
increased compared CON, but when DDGS and tallow were both added to the diet, C18:0
digestibility decreased. However, unlike fecal digestibility, main effects of DDGS and
tallow were not different (P > 0.05) for apparent ileal digestibility of C18:0. In belly fat,
C18:0 was reduced with the addition of DDGS compared to CON, but was not altered by
dietary tallow inclusion (Pomerenke, 2012, unpublished). However, in backfat, DDGS
did not alter C18:0 composition, but the addition of tallow lowered C18:0 concentration
(Pomerenke, 2012, unpublished). Similar to C16:0, an interaction (P < 0.01) between

87
DDGS and tallow was observed for the percentage of digestible C18:0. As the level of
DDGS and tallow increased in the diets, the percentage of dietary C18:0 also increased.
Diets containing 10% tallow (10T0D and 10T30D) had the greatest concentration (1.22
and 1.08%, respectively) of digestible C18:0 compared to all other diets. Furthermore,
main effects of DDGS and tallow were detected. The addition of 30% DDGS tended to
increase (P < 0.08) the amounts of digestible C18:0 compared to diets not containing
DDGS. Likewise, the addition of tallow in the diet increased (P < 0.01) the amount of
C18:0 digested compared to diets not containing tallow..
There tended (P < 0.09) to be a significant interaction between DDGS and tallow
for C18:1 apparent ileal digestibility, which be explained that by adding DDGS to the
diet (0T30D, 5T30D, 10T30D; 74.8, 76.3, 79.3%, respectively), apparent ileal
digestibility of C18:1 was lower than when tallow but no DDGS was included in the diet
(5T0D and 10T0D; 78.6 and 85.4%, respectively). The addition of 30% DDGS lowered
(P < 0.05) C18:1 apparent ileal digestibility for 0T30D, 5T30D, 10T30D compared with
CON, 5T0D, 10T3D. The type or level of dietary fiber may be responsible for interfering
with fat digestion. Stein (2009) suggested the fermentation process in ethanol production
may liberate oil and make fat slightly more digestible. Tallow inclusion increased (P <
0.02) apparent ileal digestibility for 5T0D, 5T30D, 10T0D, 10T30D compared with CON
and 0T30D, which agrees with results reported from Duran-Montge et al. (2007) where
barley-based diets supplemented with tallow had greater ileal digestibility of C18:1
compared to the control diet. The tallow used in this study contained a relatively large
proportion of C18:1 (43.9%). Due to the high concentration of C18:1 in tallow, and,
thus, in the final diet (Table 3.4), the high dietary concentration of C18:1 may be another

88
reason why digestibility increased. Furthermore, the increased digestibility of diets
containing tallow may relate to the increased concentration of C18:1 in belly fat and
backfat when tallow is fed (Pomerenke, 2012 unpublished). However, the inclusion of
30% DDGS lowered C18:1 content in the backfat and tended to decrease it in belly fat
(Pomerenke, 2012 unpublished; Xu et al., 2010b). Finally, an interaction (P < 0.01)
between DDGS and tallow was observed for the percentage of digestible C18:1 (Table
3.4). As the level of DDGS and tallow increased in the diets, the amount of digestible
C18:1 also increased from 0.61 to 3.86% for CON and 10T30D, respectively.
Furthermore, main effects of DDGS and tallow were detected. The addition of 30%
DDGS resulted in an increase (P < 0.01) in the amount of C18:1 digested, and the
addition of tallow to the diet also increased (P < 0.01) the amounts of digestible C18:1
indicating that the amount of C18:1 digested is a function of the amount of C18:1 found
in the diet.
An interaction between DDGS and tallow was observed for apparent ileal
digestibility of C18:2 (P < 0.04). Digestibility was greatest for CON (76.55%) compared
to all other diets, but was lowest for 5T0D (56.60%) and 10T0D (60.13%). Apparent
ileal digestibility was reduced for 10T30D (56.6%) compared to CON and 0T30D (76.7,
66.2%, respectively). Although the DDGS used in this study contained 55.8% linoleic
acid as a percentage of total fat, no main effects of DDGS addition were detected for
C18:2 apparent ileal digestibility. No interactions between tallow and DDGS were
observed for amount C18:2 digested. However, the dietary addition of DDGS resulted in
a greater (P < 0.01) amount of C18:2 digested compared to diets not containing DDGS,
which is logical since DDGS contributed a high proportion of C18:2 to the diet.

89
Furthermore, the addition of 5 or 10% tallow tended to reduce (P < 0.07) the percentage
of C18:2 digested compared to when tallow was not present in the diet. Furthermore,
DDGS addition has been shown to increase the amount of C18:2 in pork fat depots
(Pomerenke, 2012, unpublished, Stein and Shurson, 2009). Therefore, the amount of
digestible C18:2 is reflected in the increased in C18:2 in backfat and belly fat
(Pomerenke, 2012, unpublished). The addition of dietary tallow (P < 0.01) decreased
C18:2 apparent ileal digestibility compared to diets not containing tallow, which agrees
with results from previous research (Duran-Montge et al., 2007). The apparent ileal
digestibility of C18:2 has been reported to range from 75% to 99% (Jorgensen et al.,
1993; Jorgensen et al., 2000). In the present study, C18:2 digestibility ranged from 56.6
to 96.2%.
There tended (P < 0.07) to be a significant interaction between DDGS and tallow
for MUFA apparent ileal digestibility. When DDGS was not present in diets but 10%
tallow was included, MUFA digestibility was greater compared with CON. When DDGS
was included with supplemental tallow (5T30D, 10T30D), MUFA digestibility was
similar to CON, 5T0D, 0T30D. Moreover, the addition of 30% DDGS tended (P < 0.06)
to lower MUFA apparent ileal digestibility in comparison with diets not including
DDGS. Tallow addition increased MUFA apparent ileal digestibility (P < 0.01)
compared to diets not containing tallow. When DDGS was included in the diet, MUFA
digestibility was greater (P < 0.01) compared to when it was not present. Likewise, the
inclusion of dietary tallow increased (P < 0.01) the amount of MUFA digested.
An interaction (P < 0.01) between DDGS and tallow was detected for apparent
ileal digestibility of PUFA. Apparent digestibility of PUFA was greatest for CON at

90
77.82%, but was reduced to 65.9 and 57.4%, respectively, for 5T30D and 10T30D, which
suggests a fiber and fat interaction with fiber possibly inhibiting digestive lipases from
accessing the lipid. Moreover, the addition of tallow (P < 0.01) caused a reduction in the
apparent digestibility of PUFA compared with diets containing no tallow. The addition
of DDGS to the diet increased (P < 0.01) the amount of PUFA digested compared to diets
not containing DDGS. Additionally, the inclusion of tallow resulted in increased (P <
0.01) concentrations of PUFA digested compared to diets containing no tallow.
An interaction for SFA between DDGS and tallow was observed (P < 0.01) where
apparent ileal digestibility was lowest for 5T30D and 10T30D (68.2, 66.3%, respectively)
compared to CON, 10T0D, and 0T30D (76.0, 80.0, and 79.9%, respectively). Diets
containing 30% DDGS had lower (P < 0.01) SFA apparent ileal digestibility compared to
diets not containing DDGS. Furthermore, the addition of tallow caused a reduction (P <
0.01) in SFA apparent ileal digestibility compared to diets not containing tallow. Finally,
there was an interaction (P < 0.01) between DDGS and tallow for the amount of
digestible SFA. Diets containing 10% tallow, with or without DDGS (10T0D, 10T30D),
contained the greatest amounts (3.32 and 3.41%, respectively) of digestible SFA
compared to all other diets. Furthermore, the addition of DDGS increased (P < 0.01) the
concentration of digestible SFA compared to diets not containing DDGS. Likewise, the
addition of tallow increased (P < 0.01) the concentration of SFA digested compared to
diets not containing tallow. Because tallow as an ingredient that contributes the majority
of SFA to the diet, it is reasonable to expect that pigs fed diets containing tallow would
digest more SFA since the diet contained a larger proportion of SFA than the other diets.
In the present experiment, many interactions between DDGS and tallow were

91
observed for fecal and ileal digestibility. The fiber component of DDGS may explain the
lower fatty acid digestibility values when high concentrations of DDGS were fed,
because Just (1982) showed that as crude fiber increased in the diet, apparent fat
digestibility decreased. In the present experiment, crude fiber and NDF levels of the diet
are presented in Table 3.4. Kil et al. (2010) indicated that extracted fat, such as corn oil,
has a greater digestibility than intact fat from corn germ meal at the ileum and over the
entire intestinal tract due to the physiochemical properties of the fat. Intact fat, as that
from corn germ meal, is encased with fat cell membranes and is more resistant to
formation of emulsions and enzymatic digestion than extracted fat (Adams and Jensen,
1984; Bach Knudsen et al., 1993; Kil et al., 2010). Similarly, Stein (2009) found the
acid-hydrolyzed ether extract of corn oil is more digestible than intact forms of oils.
However, of intact fat sources, high protein DDG and DDGS had greater digestibility of
fat compared to high oil corn and corn germ (Stein, 2009). This suggests, that in DDGS,
the fermentation process for ethanol production may have liberated some oil or made fat
slightly more digestible in comparison with high oil corn and corn germ. However, intact
fat sources, such as corn germ meal or DDGS, may have lower digestibility values
because digestive enzymes may not have access to the substrate lipid because
carbohydrate molecules, specifically fiber, may block access to the digestive lipase
(Stein, 2009).
Ileal digestibility values for C18:1 and C18:2 are lower in this study compared to
those reported by others (Ozimek et el., 1984; Jorgensen et al., 2000; Duran-Montge et al.
2007). The lower ileal digestibility values obtained in the present study may be due to
the types of ingredients utilized in this experiment. Many of the previously published

92
ileal digestibility values, utilized ingredients other than corn such as barley (Duran-
Montge et al., 2007), corn starch and soybean meal (Ozimek et al, 1984), wheat starch
(Jorgensen et al, 2000), and cassava chips and soybean meal (Mitchaothai et al., 2007) all
of which have various levels of fiber, amino acids, and fat. Another possible explanation
for reduced ileal digestibility values determined in the present study may be related to the
use of different inert markers used to calculate digestibility. In the present study, acid
insoluble ash was used as an inert marker; others have used dysprosium (Ozimek et al.,
1984), chromic oxide (Overland et al, 1994; Jorgensen et al., 2000), and titanium dioxide
(Duran-Montge et al., 2007). In a recent report by Kerr et al, (2010), no differences were
detected between chromic oxide, iron oxide, or titanium dioxide on nutrient digestibility,
but acid insoluble ash and dysprosium markers were not evaluated in this study.
In summary, these results suggest that C18:2 digestibility may not be related to
deposition of C18:2 in pork fat depots because dietary DDGS inclusion did not alter
C18:2 fecal or ileal digestibilities. However, the deposition of C18:2 is more closely
related to the concentration of C18:2 in the diet rather than digestibility since pigs fed
diets containing higher concentrations of C18:2 digested more C18:2 compared to diets
containing low levels of C18:2.
Furthermore, combining 5 or 10% tallow with 30% DDGS in grower-finisher pig
diets generally reduces the digestibility of nearly all fatty acids compared to CON and
0T30D. However, the addition of DDGS and tallow generally increases the amounts of
fatty acids digested, which is mainly a function of high concentration of fatty acids in the
diet. Because the total amount of C18:2 is high in DDGS and DDGS containing diets, the
deposition of C18:2 in adipose tissue is more closely related to the amount of C18:2 in the diet
rather than its digestibility because pigs fed diets containing higher concentrations of C18:2,

93
digested more C18:2 compared to diets containing lower levels of C18:2. These are the first
data reported in the literature that represent the digestibility of individual fatty acids in
DDGS. However, to effectively manage dietary effects on pork fat quality, producers and
nutritionists alike should consider implementing the use of iodine value product in
formulation strategies. The iodine value product can estimate the iodine value in the diet
based on the iodine value levels of specific ingredients containing fats or oils (Madsen et
al, 1992). The iodine value product may be utilized to minimize the risk of exceeding
desired pork fat quality standards.

94
Table 3.1. Fatty acid profile, calculated iodine value and iodine value
product of DDGS and tallow as a % of crude fat (as-fed basis)
Item, % DDGS Tallow
Dry Matter
Crude Fat
89.34 N/A1
11.14 99.96
14:0 0.05 2.51
16:0 14.07 23.23
16:1 0.14 2.72
18:0 1.89 20.17
18:1 25.16 43.93
18:2 55.76 3.91
18:3 0.00
0.21
20:0 0.41 0.16
20:1 0.29 0.26
20:2 0.004 0.07
22:0 0.16 0.02
22:1 0.25 0.00
24:0 0.23 <0.001
Calculated IV2
119
48
Calculated IVP3
132
479
1N/A: Not Analyzed
2IV = Iodine Value = [C16:1] × 0.95 + [C18:1] × 0.86 + [C18:2] × 1.732 + [C18:3] ×
2.616 + [C20:1] × 0.785+[C22:1] × 0.723, where the brackets indicate concentration
(percentage) of fatty acid (AOCS, 1998).; 3IVP = Iodine Value Product = (IV of the dietary lipids) × (percentage dietary lipid) ×
0.10 (Madsen et al., 1992).

95
Table 3.2. Ingredient composition of diets, as-fed basis
0% DDGS 30% DDGS
Tallow 0% 5% 10% 0% 5% 10%
Ingredient, % CON1
5T0D1
10T0D1
0T30D1
5T30D1
10T30D1
Corn 70.65 64.73 58.81 54.58 48.67 42.72
Soybean Meal, 44% 25.62 26.39 27.17 10.99 11.76 12.59
DDGS 0 0 0 30.00 30.00 30.00
Beef Tallow 0 5.00 10.00 0 5.00 10.00
Limestone 0.75 0.75 0.74 0.81 0.80 0.80
Dicalcium Phosphate 1.36 1.37 1.37 1.52 1.53 1.53
Salt 0.30 0.30 0.30 0.30 0.30 0.30
Celite 0.30 0.30 0.30 0.30 0.30 0.30
L-lysine 0.32 0.39 0.47 0.64 0.71 0.79
VTM premix2
0.50 0.50 0.50 0.50 0.50 0.50
L-threonine 0.11 0.17 0.23 0.18 0.23 0.26
L-tryptophan 0.03 0.03 0.03 0.12 0.13 0.13
DL-methionine 0.06 0.07 0.08 0.06 0.07 0.08
Total 100 100 100 100 100 100 1CON = corn-soybean meal control diet, 5T0D = CON and 5% tallow, 10T0D = CON and 10% tallow, 0T30D = CON plus 30%
DDGS, 5T30D = CON plus 30% DDGS and 5% tallow, 10T30D = CON plus 30% DDGS and 10% tallow. 2Premix supplied the following per kg of diet: vitamin A, 11,000 IU; vitamin D3, 2,756 IU; vitamin E, 55 IU; vitamin B12, 55µg;
riboflavin, 16,000 mg; pantothenic acid, 44.1 mg; niacin, 82.7 mg; Zn, 150 mg; Fe, 175 mg; Mn, 60 mg; Cu, 17.5 mg; I, 2 mg; and Se,
0.3 mg.

96
Table 3.3. Nutrient composition of diets (as-fed basis)
0% DDGS 30% DDGS
Tallow Level 0% 5% 10% 0% 5% 10%
Nutrient CON1
5T0D1
10T0D1
0T30D1
5T30D1
10T30D1
Dry Matter, % 86.86 87.21 87.91 88.53 89.15 89.71
Calculated ME, kcal/kg3
3845 3957 4170 3825 3885 4094
Crude Protein, % 19.09 17.79 17.08 19.07 17.70 18.02
Crude Fiber, % 2.10 1.96 1.71 3.04 3.13 3.10
NDF, % 9.19 8.00 7.33 14.41 14.36 14.36
Crude Fat, % 2.69 7.24 11.97 6.47 9.78 14.50
Linoleic Acid, % 1.69 1.70 1.71 2.78 2.88 3.09
Calculated SID Lys, % 1.09 1.16 1.23 1.09 1.16 1.23
Calculated SID Lys:ME
(g/kcal ME) 3.28 3.28 3.28 3.30 3.30 3.29
Calculated Iodine Value
Product2
39.00 55.00 69.20 68.70 81.20 102.90 1CON = corn-soybean meal control diet, 5T0D = CON and 5% tallow, 10T0D = CON and 10% tallow, 0T30D = CON plus 30%
DDGS, 5T30D = CON plus 30% DDGS and 5% tallow, 10T30D = CON plus 30% DDGS and 10% tallow. 2IVP = Iodine Value Product = (IV of the dietary lipids) × (percentage dietary lipid) × 0.10 (Madsen et al., 1992).
3ME calculated based on ME=DE x 1.012-(0.0019 x % CP)) NRC (1998)

97
Table 3.4. Analyzed fatty acid composition of the diet, fecal and apparent ileal digestibility as influenced by dietary level of
DDGS and tallow, expressed as a % of total dietary fat, and percentage of apparent ileal digestible dietary fatty acids
0% DDGS 30% DDGS
Tallow 0% 5% 10% 0% 5% 10% P-value
CON1
5T0D1
10T0D1
0T30D1
5T30D1
10T30D1
PSE DDGS Tallow DDGS×
Tallow
C16:0, %
FA content2
0.46 1.40 2.24 1.11 1.73 2.76
Fecal Digestibility3
88.00a
89.63a
90.75a
86.42a
82.16b
82.44b
0.73 <0.01 <0.01 <0.01
Ileal Digestibility4
78.61a
75.53b,c
81.43a,c
77.62a,d
69.66bd
68.43bd
1.22 <0.01 <0.01 <0.01
Amount digested5
0.36e
1.06c
1.83a
.86d
1.20b
1.89a
0.02 <0.01 <0.01 <0.01
C18:0, %
FA content2
0.09 0.85 1.58 0.43 0.95 1.76
Fecal Digestibility3
-36.79a
67.38bd
78.43bc
12.83a,y
40.15a
43.30a,x
9.04 <0.01 <0.01 <0.01
Ileal Digestibility4
66.87a
72.06a,b
76.81b,c
85.87 64.08 61.25 4.41 NS NS 0.01
Amount digested5
0.06d
0.61b
1.22a
0.37c
0.61b
1.08a
0.04 <0.08 <0.01 <0.01
C18:1, %
FA content2
0.82 2.54 4.05 2.00 3.12 5.03
Fecal Digestibility3
95.14a
97.47b,c
98.03b
97.65b
96.12a,c
97.48b,c
0.41 NS <0.01 <0.01
Ileal Digestibility4
74.41a
78.57c
85.44d
74.80b
76.30b
76.65b
2.05 <0.05 <0.02 <0.09
Amount digested5
0.61a
1.99b
3.46c
1.49d
2.38e
3.86f
0.07 <0.01 <0.01 <0.01

98
C 18:2, %
FA content2
1.69 1.70 1.71 2.78 2.88 3.09
Fecal Digestibility3
98.15 96.90 97.14 97.61 96.62 97.13 0.59 NS NS NS
Ileal Digestibility4
76.55a
56.60b,c
60.13b,c
65.93a,c,x
64.64a,c
50.98b,c,y
3.77 NS <0.01 <0.04
Amount digested5
1.29 0.96 1.03 1.84 1.86 1.57 0.10 <0.01 <0.07 NS
MUFA, %
FA content2
0.83 2.59 4.15 2.03 3.20 5.14
Fecal Digestibility3
88.18d
94.97a
96.40a
89.18d
91.36c
93.32b
0.44 <0.01 <0.01 <0.01
Ileal Digestibility4
74.42a
79.09a,c
85.95a,c
75.33b,c
77.01a
77.34a
1.98 <0.06 <0.01 <0.07
Amount digested5
1.33 1.43 1.59 2.18 2.32 2.53 0.05 <0.01 <0.01 NS
PUFA, %
FA content2
1.79 1.81 1.85 2.89 3.02 3.27
Fecal Digestibility3
97.86 96.64 96.88 97.16 96.06 96.57 0.60 NS NS NS
Ileal Digestibility4
77.17a,x
57.94a
61.86a,c,y
66.23a
65.20a,c
52.16b,c
3.63 NS <0.01 0.03
Amount digested5
0.43 1.38 2.52 1.07 1.85 2.51 0.15 <0.01 <0.01 NS
SFA, %
FA content2
0.55 2.38 4.08 1.62 2.85 4.82
Fecal Digestibility3
65.36a
80.70b
85.41b
64.78a
66.29a
66.70a
1.54 <0.01 <0.01 <0.01
Ileal Digestibility4
76.00a
74.56a,c
79.99a
79.88a
68.23bc
66.29b
1.77 <0.01 <0.01 <0.01
Amount digested5
0.63e
1.93c
3.32a
1.62d
2.18b
3.41a
0.06 <0.01 <0.01 <0.01

99
1CON = corn-soybean meal control diet, 5T0D = CON and 5% tallow, 10T0D = CON and 10% tallow, 0T30D = CON plus 30%
DDGS, 5T30D = CON plus 30% DDGS and 5% tallow, 10T30D = CON plus 30% DDGS and 10% tallow. 2 Analyzed fatty acid composition of diets, as-fed basis
3 Fecal fatty acid digestibility as influenced by dietary level of DDGS and tallow, expressed as a % of total dietary fat
4 Ileal fatty acid digestibility as influenced by dietary level of DDGS and tallow, expressed as a % of total dietary fat
5 Percentage of apparent ileal digestible dietary fatty acids; calculated: ileal digestibility × fatty acid concentration in diet
a,b,c,d Within a row, means without a common superscript differ (P < 0.05)
x,y Within a row, means without a common superscript differ (0.05<P < 0.10)
NS = Non-significant

100
SUMMARY
In summary, feeding a combination diet of containing 5% tallow and 30% corn
DDGS did not improve pork fat quality as we had hypothesized. In fact, in terms of pork
fat quality, the combination of DDGS and tallow, exacerbated the negative effects of
feeding DDGS on pork fat quality because iodine value in belly and backfat depots were
higher compared with the control diet. Furthermore, the concentration of C18:2 was
increased with the addition of 30% DDGS, but was not reduced with the addition of
tallow. This finding, along with other individual fatty acid data, indicates that the dietary
addition of tallow was ineffective in reducing the occurrence soft pork fat. However,
feeding the combination diet resulted in no difference in growth performance compared
to the control diet. In fact, no difference in ADG or G:F was observed when feeding 30%
DDGS and 5% tallow compared to the control. However, the combination diet tended to
reduce ADFI, which is the result of the increased caloric density of the diet due to the
addition of tallow. In terms of carcass composition, feeding diets containing the
combination of 30% DDGS and 5% tallow resulted in no change in HCW, carcass yield,
backfat depth, or loin depth compared with pigs fed corn-soybean meal diets. However,
pigs fed the combination diet were less lean compared to their contemporaries fed the
corn-soybean meal control diet.
In the second experiment, ileal and fecal digestibility of fatty acids were
investigated. Apparent ileal digestibility values of fatty acids are more meaningful for
understanding fatty acid digestion and absorption compared to fecal digestibility because
nearly all fatty acids are digested and absorbed by the time digesta reaches the distal
ileum. Combining 5 or 10% tallow with 30% DDGS generally reduced the digestibility

101
of fatty acids compared to the control diet. Most importantly, these results suggest that
C18:2 deposition in pork fat depots may not be necessarily related to the digestibility of
C18:2 because dietary DDGS inclusion did not alter C18:2 fecal or ileal digestibility.
Furthermore, because the total amount of C18:2 is high in DDGS and DDGS containing
diets, the deposition of C18:2 in pig adipose tissue is more closely related to the amount
of C18:2 in the diet rather than its digestibility since pigs fed diets containing higher
concentrations of C18:2, digested more C18:2 compared to diets containing lower levels
of C18:2. Overall, the interaction between fat and fiber needs to be further evaluated and
better understood in monogastric animals.
Overall, producers should not feed 30% DDGS and 5% tallow for the entire
growing-finishing period if they are concerned about pork fat quality. Instead, they
should focus on alternative strategies such as formulating diets based on an iodine value
product. Furthermore, other approaches for effectively managing the negative effects on
pork fat quality from feeding DDGS include withdrawing DDGS from the diet prior to
harvest or adding conjugated linoleic acid to the diet.

102
LITERATURE CITED
Adams, K. L, and A. J. Jensen. 1984. Comparative utilization of in-seed fats and the
respective extracted fats by the young pig. J. Anim. Sci. 59:1557-1566.
Allee, G. L, D. H. Baker, and G. A. Leveille. 1971. Influence of level of dietary fat on
adipose tissue lipogenesis and enzymatic activity in the pig. J. Anim. Sci.
33:1248-1254.
Anguita, M., N. Canibe, J. F. Pérez, and B. B. Jensen. 2006. Influence of the amount of
dietary fiber on the available energy from hindgut fermentation in growing pigs:
use of cannulated pigs an in vitro fermentation. J. Anim. Sci. 84:2766-2778.
Anugwa, F. O. I., V. H. Varel, J. S. Dickson, W. G. Pond, and L. P. Krook. 1989.
Effects of dietary fiber and protein concentration on growth, feed efficency,
visceral organ weights and large intestine microbial populations of swine. J. Nutr.
119:879-886.
AACC International. Approved Methods of Analysis, 11th Ed. Method 58-17.01. Fatty
Acid Profile in Oils and Fat by GC. AACC International, St. Paul, MN, U.S.A.
http://dx.doi.org/10.1094/AACCIntMethod-58-17.01.
AOAC. 1998. Official Methods of Analysis. 16th
ed. Assoc. Offic. Anal. Chem.
Arlington, VA.
AOCS. 1998. Official Methods and Recommended Practices of the AOCS. 5th
Ed. Am.
Oil Chem. Soc., Champaign, IL.
Apple, J. K., C. V. Maxwell, J. T. Sawyer, B. R. Kutz, L. K. Rakes, M. E. Davis, Z. B.
Johnson, S. N. Carr, and T. A. Armstrong. 2007. Interactive effect of ractopamine
and dietary fat source on quality characteristics of fresh pork bellies. J. Anim. Sci.
85:2682-2690.
Averette Gatlin, L., M. T. See, J. A. Hansen, D. Sutton, and J. Odle. 2002. The effects of
dietary fat sources, levels, and feeding intervals on pork fatty acid composition. J.
Anim. Sci. 80:1606-1615.
Azain, M. J. 2004. Role of fatty acids in adipocyte growth and development. J. Anim.
Sci. 82:916-924.
Azain, M. J. 2001. Fat in Swine Nutrition. In Swine Nutrition. Pages 95-105 in Swine
Nutrition. A.J. Lewis and L.L. Southern, eds. CRC Press, Boca Raton, FL.
Azain, M. J., R. W. Seerley, J. O. Reagan, and M. K. Anderson. 1991. Effect of a high-fat
diet on the performance response to porcine somatotropin (PST) in finishing pigs.
J. Anim. Sci. 69:153-161.

103
Babatunde, G. M., W. G. Pond, L. Krook, L. D. Van Vleck, E. F. Walker, Jr., and P.
Chapman. 1967. Effects of dietary safflower oil or hydrogenated coconut oil on
growth rate and on some blood and tissue components of pigs fed a fat-free diet.
J. Nutr. 92: 293-302.
Bach, A., and V. K. Babayan. 1982. Medium-chain triglycerides: an update. Am. J. Clin.
Nutr. 36:950-962.
Bach Knudsen, K. N, B. B. Jensen, and I. Hansen. 1993. Digestion of polysaccharides
and other major components in the small and large intestine of pigs fed on diets
consisting of oat fractions rich in ß-D-glucan. Br. J. Nutr. 70:537-556.
Bee, G., S. Gerber, and R. Messikomer. 2002. Effect of dietary energy supply and fat
source on the fatty acid pattern of adipose and lean tissues and lipogenesis in the
pig. J. Anim. Sci. 80:1564-1574.
Beltranena, E., M. Young, N. Campbell, J. Aalhus, M. Dugan, M. Oryschak, and R.
Zijlstra. 2009. Corn DDGS withdrawl rates for hogs. Agriculture and Agri-Food
Canada. Page 1-20.
Benz, J. M., S. K. Linneen, J. M. DeRouchey, M. D. Tokach, S. S. Dritz, J. L. Nelssen,
and R. D. Goodband. 2007. Effects of dried distillers grains with soluble on
growth performance and fat qualityof finishing pigs. Kansas State University,
Manhattan, KS. Swine Day 2007. Page 107-113.
Benz, J. M. 2008. Influence of dietary ingredients on pork fat quality. M.S. Thesis.
Kansas State Univ. Manhattan, KS.
Bligh, E. G., and W. J. Dyer. 1959. A rapid method of total lipid extraction and
purification. Can. J. Biochem. Physiol. 37:911-917.
Boyd, R. D., M. E. Johnston, K. Scheller, A. A. Sosnicki, and E. R. Wilson. 1997.
Relationship between dietary fatty acid profile and body fat composition in
growing pigs. PIC Technical Memo 153. PIC, Franklin, KY.
Bracco, U. 1994. Effect of triglyceride structure on fat absorption. Am. J. Clin. Nutr.
60:10002S-1009S.
Brooks, C. C. 1971. Fatty acid composition of pork lipids as affected by basal diet, fat
source and fat level. J. Anim. Sci. 33:1224-1231.
Cameron, N. D. and M. B. Esner. 1991. Fatty acid composition of lipid in longissimus
dorsi muscle of duroc and british landrace pigs and its relationship with eating
quality. Meat Sci. 29:295-307.

104
Cera, K. R., D. C. Mahan, and G. A. Reinhart. 1988. Weekly digestibilities of diets
supplemented with corn oil, lard, or tallow by weanling swine. J. Anim. Sci.
66:1430-1437.
Cera, K. R., D. C. Mahan, and G. A. Reinhart. 1989. Apparent fat digestibilities and
performance responses of postweaning swine fed diets supplemented with
coconut oil, corn oil, or tallow. J. Anim. Sci. 67:2040-2047.
Cho, K. Y. and M. R. J. Salton. 1966. Fatty acid composition of bacterial membrane and
wall lipids. Biochim. Biophys. Acta. 116:73-79.
Chen, H. Y., A. J. Lewis, P. S. Miller and J. T. Yen. 1999. The effect of excess protein on
growth performance and protein metabolism of finishing barrows and gilts. J.
Anim. Sci. 77:3238-3247.
Clarke, S. D. 2001. Polyunsaturated fatty acid regulation of gene transcription: a
molecular mechanism to improve the metabolic syndrome. J. Nut. 131:1129-
1132.
Cline, R. T., and B. T. Richert. 2001. Feeding growing-finishing pigs. Pages 717-723 in
Swine Nutrition. 2nd ed. A. J. Lewis and L. L. Southern, ed., CRC Press, Boca
Raton, FL.
Cook, D., N. Paton, and M. Gibson. 2005. Effect of dietary level of distillers dried grains
with solubles (DDGS) on growth performance, mortality, and carcass
characteristics of grow-finish barrows and gilts. J. Anim. Sci. 83(Suppl. 1): 335
(Abstr.)
Correa, J.A., C. Gariépy, M. Marcoux, L. Faucitano. 2008. Effects of growth rate, sex,
and slaughter weight on fat characteristics of pork bellies. Meat Sci. 80:550-554.
DeDecker , J. M., M. Ellis, B. F. Wolter, J. Spencer, D. M. Webel. C. R. Bertelsen, and
B. A. Peterson. 2005. Effects of dietary level of distiller’s dried grains with
soluble and fat on the growth performance of growing pigs. J. Anim. Sci.
83(Suppl. 2): 79 (Abstr.)
DeRouchey, J. M., J. D. Hancock, R. H. Hines, C. A. Maloney, D. J. Lee, H. Cao, D. W.
Dean, and J. S. Park. 2004. Effects of rancidity and free fatty acids in choice
white grease on growth performance and nutrient digestibility in weanling pigs. J.
Anim. Sci. 82:2937-2944.
Dierick, N. A., I. J. Vervaeke, D. I. Demeyer, and J. A. Decuypere. 1989. Approach to
the energetic importance of fibre digestion in pigs. I. Importance of fermentation
in the overall energy supply. Anim. Feed Sci. Technol. 23:141-167.
Dilger, R. N., J. S. Sands, D. Ragland, and O. Adeola. 2004. Digestibility of nitrogen and

105
amino acids in soybean meal with added soyhulls. J. Anim. Sci. 82:715-724.
Dowhan, W. 1997. Molecular basis for membrane phospholipid diversity: why are there
so many lipids. Ann. Rev. Biochem. 66:199-232.
Dugan, M. E. R., J. L. Aalhus, and J. K. G. Kramer. 2004. Conjugated linoleic acid pork
research. Am. J. Clin. Nutr. 79(suppl):1212S-1216S.
Duran-Montgé, P., P. K. Theil, C. Lauridsen, and E. Esteve-Garcia. 2009. Dietary fat
source affects metabolism of fatty acids in pigs as evaluated by altered expression
of lipogenic genes in liver and adipose tissues. Animal 3:535-542.
Duran-Montgé, P., R. Lizardo, D. Torrallardona, E. Esteve-Garcia. 2007. Fat and fatty
acid digestibility of different fat sources in growing pigs. Livstk. Sci. 109:66-69.
Eggert, J.M., M. A. Belury, A. Kempa-Steczko, S. E. Mills, and A. P. Schinckel. 2001.
Effects of conjugated linoleic acid on the belly firmness and fatty acid
composition of genetically lean pigs. J. Anim. Sci. 79:2866-2872.
Ellis, M., and F. McKeith. 1999. Nutritional influences on pork quality. National Pork
Producers Council. Des Moines, IA.
Engel, J. J., J. W. Smith II, J. A. Unruh, R. D. Goodband, P. R. O’Quinn, M. D. Tokach,
and J. L. Nelssen. 2010. Effects of choice white grease or poultry fat on growth
performance, carcass leanness, and meat quality characteristics of growing-
finishing pigs. J. Anim. Sci. 79:1491-1501.
Evans, H. L., R. B. Hinson, B. R. Wiegand, M. J. Ritter, S. N. Carr, K. S. Roberts, and G.
Allee. 2009 Fatty acid profiles of and iodine value correlations between four
carcass fat depots from pigs fed varied combinations of ractopamine. J. Anim.
Sci. 87 (e-suppl. 3):130 (abstr.)
Feoli, C., J. D. Hancock, D. H. Kropf, S. Issa, T. L. Gugle, and S. D. Carter. 2008.
Effects of adding saturated fat to diets with sorghum-based dried distillers grains
with solubles on growth performance and carcass characteristics in finishing pigs.
Report of Progress. Kansas State University, Manhattan, KS. 145-150.
Feoli, C., J. D. Hancock, S. Issa, T. L. Gugle, S.D. Carter, and N. A. Cole. 2007a. Effects
of adding beef tallow to diets with sorghum-based dried distillers grains with
solubles on growth performance and carcass characteristics in finishing pigs.
Report of Progress. Kansas State University, Manhattan, KS. 122-125.
Feoli, C., S. Issa, J. D. Hancock, T. L. Gugle, S. D. Carter, & N. A. Cole. 2007b. Effects
of adding saturated fat to diets with sorghum-based distillers dried grains with
solubles on growth performance and carcass characteristics in finishing pigs. J.
Anim. Sci. 85 (Suppl. 1):148. (Abstr.)
106
Folch, J., M. Less, and G. H. Sloane Stanley. 1957. A simple method for the isolation and
purification of total lipids from animal tissue. Biol. Chem. 226:497-509.
Food Fats and Oils. 2006. 9th
Ed. Institute of Shortening and Edible Oils, Washington,
DC.
Fu, S. X., M. Johnston, R. W. Fent, D. C. Kendall, J. L Usry, R. D. Boyd, and G. L.
Allee. 2004. Effect of corn distiller’s dried grains with soluble (DDGS) on
growth, carcass characteristics and fecal volume in growing-finishing pigs. J.
Anim. Sci. 82(Suppl. 2):80. (Abstr.)
Gabert, V. M., H. Jørgensen, C. M. Nyachoti. 2001. Bioavailability of amino acids in
feedstuffs for swine. Pages 151-186 in Swine Nutrition. A.J. Lewis and L.L.
Southern, eds. CRC Press, Boca Raton, FL.
Gaines, A. M. G. I. Petersen, J. D. Spencer, and N. R. Augspurger. 2007. Use of corn
distillers dried grains with soluble (DDGS) in finishing pigs. J. Anim. Sci.
85(Suppl. 1):96 (Abstr.)
Gerlemann, G. D., R. B. Hinson, D. Pompeu, S. N. Carr, M. J. Ritter, B. R. Wiegand, G.
L. Allee, and R. D. Boyd. 2010. Impact of CLA and ractopamine (Paylean) on
growth performance and carcass characteristics in finishing pigs fed either corn
distillers dried grains with solubles (DDGS) or corn-soy diets. J. Anim. Sci. 88(E-
suppl. 3): 92-93.
Gralapp, A. K., W. J. Powers, M. A. Faust, and D. S. Bundy. 2002. Effects of dietary
ingredients on manure characteristics and odorous emissions from swine. J. Anim.
Sci. 80:1512-1519.
Grieshop, C. M., D. E. Reese, and G. C. Fahey, Jr. 2000. Nonstarch polysaccharides and
oligosaccharides in swine nutrition. Pages 107-130 in Swine Nutrition. Lewis, A. J.,
and L. L. Southern, eds. CRC Press, Boca Raton, FL.
Hale, O. M., J. C. Johnson Jr., and E. P. Warren. 1968. Influence of season, sex and
dietary energy concentration on performance and carcass characteristics of swine.
J. Anim. Sci. 27:1577-1582.
Hansen, M. J., A. Chwalibog, A. Tauson, and E. Sawosz. 2006. Influence of different
fibre sources on digestibility and nitrogen and energy balances in growing pigs.
Arch. Anim. Nutr. 60:390-401.
Hastad, C. W., J. L. Nelssen, R. D. Goodband, M. D. Tokach, S. S. Dritz, J. M.
DeRouchey, and N. Z. Frantz. 2005a. Effect of dried distillers grains with solubles
on feed preference in growing pigs. J. Anim. Sci. 83(Suppl. 2):73. (Abstr.)

107
Hastad, C. W., M. D. Tokach, J. L. Nelssen, S. S. Dritz, R. D. Goodband, J. M.
DeRouchey, C. L. Jones, and N. Z. Frantz. 2005b. Effect of sorting and added fat
level performance on grow-finish pigs reared in a commercial facility. J. Anim.
Sci. 83(Suppl. 2):80 (Abstr.)
Hausman, G. J., M. V. Dodson, K. Ajuwon, M. Azain, K. M. Barnes, L. L. Guan. Z.
Jiang, S. P. Poulos, R. D. Sainz, S. Smith, M. Spurlock, J. Novakofski, M. E.
Fernyhough and W. G. Bergen. 2009. Board-invited review: the biology and
regulation of preadipocytes and adipocytes in meat animals. J. Anim. Sci. 87:1218-
1246.
He, G., 2004. Improving pig performance and nutrient utilization by manipulating dietary
protein level and using fermentable fiber ingredients. Ph.D Diss., Univ. of
Minnesota, St. Paul.
Healy, B. J., J. D. Hancock, G. A. Kennedy, P. J. Bramel-Cox, K. C. Behnke, and R. H.
Hines. 1994. Optimum particle size of corn and hard and soft sorghum for nursery
pigs. J. Anim. Sci. 72:2227–2236.
Herzberg, G.R., and M. Rogerson. 1988. Hepatic fatty acid synthesis and triglyceride
secretion in rats fed fructose- or glucose-based diets containing corn oil, tallow or
marine oil. J. Nutr. 118:1061-1067.
Hill, G. M., J. E. Link, D. O. Liptrap, M. A. Giesemann, M. J. Dawes, J. A. Snedegar, N.
M. Bello, R. J. Tempelman. 2008. Withdrawl of distillers dried grains with
soluble (DDGS) prior to slaughter in finishing pigs. J. Anim. Sci. 86 (Suppl. 3):
86 (Abstr.)
Htoo, J. K., X. Meng, J. F. Patience, M. E. R. Dugan, and R. T. Zijlstra. 2008. Effects of
coextrusion of flaxseed and field pea on the digestibility of energy, ether extract,
fatty acids, protein, and amino acids in grower-finisher pigs. J. Anim. Sci.
86:2942-2951.
Jackson, A. R., S. Powell, S. L. Johnston, J. O. Matthews, T. D. Binder, F. R. Valdez, and
L. L. Southern. 2009. The effect of chromium ans chromium propionate on
growth performance, carcass traits, meat quality, and the fatty acid profile of fat
from pigs fed no supplemented dietary fat, choice white grease, or tallow. J.
Anim. Sci. 87:4032-4041.
Jagger, S., J. Wiseman, D. J. A. Cole, and J. Craigon. 1992. Evaluation of inert markers
for the determination of ileal and faecal apparent digestibility values in the pig.
Brit. J. Nutr. 68:729-739.
Jendza, J. A., P. A. Garaert, D. Ragland, and O. Adeola. 2011. The site of intestinal
disappearance of DL-methionine and methionine hydroxyl analog differ in pigs. J.
Anim. Sci. 89:1385-1391.
108
Jimenez, J. J., J. L. Bernal, M. J. Nozal, L. Toribio, and J. Bernal. 2009. Profile and
relative concentrations of fatty acids in corn and soybean seeds from transgenic
and isogenic crops. J. Chromt. A. 43:7288-7295.
Jørgensen, H., and J. A. Fernández. 2000. Chemical composition and energy value of
different fat sources for growing pigs. Acta Agric. Scand. A. Animal Sci. 50:129-
136.
Jorgensen, H., K. Jakobsen, and B. O. Eggum. 1993. Determination of endogenous fat
and fatty acids at the terminal ileum and in faeces in growing pigs. Acta Agric.
Scand. Sect. A. Anim. Sci. 43: 101–106.
Jørgensen, H., V. M. Gabert, M. S. Hedemann, and S. K. Jensen. 2000. Digestion of fat
does not differ in growing pigs fed diets containing fish oil, rapeseed oil, or
coconut oil. J. Nutr. 130:852-857.
Just, A., 1982. The influence of crude fibre from cereals on the net energy value of diets
for growth in pigs. Lvstk. Prod. Sci. 9:569-580.
Juste, C., Y. Demarne, and T. Corring. 1983. Response of bile flow, bilary lipids, and bile
acid pool in the pig to quantitative variations in dietary fat. J. Nutr. 113:1691-
1701.
Kass, M. L. P. J. Van Soest, W. G. Pond, B.Lewis, and R. E. McDowell. 1980.
Utilization of dietary fiber from alfalfa by growing swine. I. Apparent
digestibility of diet components in specific segments of the gastrointestinal tract.
J. Anim. Sci. 50:175-191.
Kavanagh, S., P. B. Lynch, F. O’Mara, P. J. Caffrey. 2001. A comparison of total
collection and marker technique for the measurement of apparent digestibility of
diets for growing pigs. Anim. Feed Sci. Tech. 89:49-58.
Kerr, B. J., Weber, T. E., Ziemer, C. J. 2010. Impact of dietary markers on fecal
microbial ecology, fecal VFA, and nutrient digestibility coefficients in finishing
pigs. In: Proceedings of the 3rd International EAAP Symposium on Energy and
Protein Metabolism and Nutrition, September 6-10, 2010, Parma, Italy. p. 397-
398.
Kidder, D. E., and M. J. Manners, 1978. Digestion in the Pig. Scientechnica, Bristol,
U.K.
Kil, D. Y., T. E. Sauber, D. B. Jones, and H. H. Stein. 2010. Effect of the form of dietary
fat and the concentration of dietary neutral detergent fiber on ileal and total tract
endogenous losses and apparent and true digestibility of fat by growing pigs. J.
Anim. Sci. 88:2959-2967.

109
Kloareg, M., J. Noblet, and J. van Milgen. 2007. Deposition of dietary fatty acids, de
novo synthesis and anatomical partitioning of fatty acids in finishing pigs. Brit. J.
Nutr. 97:35-44.
Koch, D. F., A. M. Pearson, W. T. Magee, J. A. Hoefer, and B. S. Schweigert. 1968.
Effect of diet on the fatty acid composition of pork fat. J. Anim. Sci. 27:360-365.
LaBerge, R. J., K. M. McClelland, J. M. Pomerenke, G. C. Shurson, P. C. Nelson, T. J.
MacNamara, and R. B. Cox. 2011. Effects of feeding diets containing corn dried
distillers grains with soluble (DDGS) with and without tallow on bacon yield and
quality. J. Anim. Sci. 89(E-suppl 2):148 (Abstr.)
Latorre, M. A., R. Lázaro, D. G. Valencia, P. Mendel, and G. G. Mateos, 2004. The
effects of gender and slaughter weight on the growth performance, carcass traits,
and meat quality characteristics of heavy pigs. J. Anim. Sci. 82:526-533.
Leick, C. M., C. L. Puls, M. Ellis, J. Killefer, T. R. Carr, S. M. Scramlin, M. B. England,
A. M. Gaines, B. F. Wolter, S. N. Carr, and F. K. McKeith. 2010. Effect of
distillers dried grains with soluble and ractopamine (Paylean) on quality and
shelf-life of fresh pork and bacon. J. Anim. Sci. 88:2751-2766.
Leszczynski, D. E., J. Pikul, R. A. Easter, F. K. McKeith, D. G. McLaren, J. Novakofski,
P. J. Bechtel, and D. E. Jewell. 1992. Characterization of lipid in loin and bacon
from finishing pigs fed full-fat soybeans or tallow. J. Anim. Sci. 70:2175-2181.
Lien, E. L. 1994. The role of fatty acid composition and positional distributions in fat
absorption in infants. J. Pediatr. 125:S62-S68.
Linneen, S. K., J. M. DeRouchey, S. S. Dritz, R. D. Goodband, M. D. Tokach, and J. L.
Nelssen. 2008. Effects of dried distillers grains with soluble on growing and
finishing pig performance in a commercial environment. J. Anim. Sci. 86:1579-
1587.
Madsen, A., K. Jakobsen, and H. P. Mortensen. 1992. Influence of dietary fat on carcass
fat quality in pigs: a review. Acta Agric. Scand., Sect. A, Animal Sci. 42:220-225.
Maw, S. J., V. R., Fowler, M. Hamilton, and A. M. Petchey. 2003. Physical
characteristics of pig fat and their relation to fatty acid composition. Meat Sci.
63:185-190.
McCarthy, J. E., F. X., Aherne, and D. B. Okai, 1974. Use of HCl-insoluble ash as an
index for determining apparent digestibility with pigs. Can. J. Anim. Sci. 54:107-
109.
Mersmann, H. J., 1998. Overview of the effects of ß-adrenergic receptor agonists on

110
animal growth including mechanism of action. J. Anim. Sci. 76:160-172.
Metcalfe, L. D., and A. A. Schmitz. 1961. The rapid preparation of fatty acid esters for
gas chromatographic analysis. Anal, Chem. 33:363-364.
Miller, M. F., S. D. Shackelford, K. D. Hayden, J. O. Reagan. 1990. Determination of the
alteration in fatty acid profiles, sensory characteristics and carcass traits of swine
fed elevated levels of monounsaturated fats in the diet. J. Anim. Sci. 68:1624-
1631.
Mitchaothai, J., H. Everts, C. Yuangklang, S. Wittayakun, K. Vasupen, S. Wongsuthavas,
P. Srenanul, R. Hovenier, and A. C. Beynen. 2007. Meat quality, digestibility and
deposition of fatty acids in growing-finishing pigs fed restricted, iso-energetic
amounts of diets containing either beef tallow or sunflower oil. Asian-Aust. J.
Anim. Sci. 21:1015-1026.
Mitchaothai, J., H. Everts, C. Yuangklang, S. Wittayakun, K. Vasupen, S. Wongsuthavas,
P. Srenanul, R. Hovenier, and A.C. Beynen. 2008. Digestion and deposition of
individual fatty acids in growing-finishing pigs fed diets containing either beef
tallow or sunflower oil. J. Anim. Physiol. An. N. 92: 502-510.
Moeser, A. J., I. B. Kim, E. van Heugten, and T. A. T. G. Kempen. 2002. The nutritional
value of degermed, dehulled corn for pigs and its impact on the gastrointestinal
tract and nutrient excretion. J. Anim. Sci. 80:2629-2638.
Moore, J. H., 1957. Diurnal variations in the composition of the faeces of pigs on diets
containing chromium oxide. Brit. J. Nutr. 11:273-288.
National Swine Nutrition Guide. 2010. U.S. Pork Center of Excellence. D. J. Meisinger
Ed.
Nelson, C. M. and S. M. Innis. 1999. Plasma lipoprotein fatty and are altered by the
positional distribution of fatty acids in infant formula triacylglycerols and human
milk. Am. J. Clin. Nutr. 70: 62-69.
Noblet J., and X. S. Shi. 1993. Comparative digestive utilization of energy and nutrients
in growing pig fed ad lib and adult sows fed at maintenance. Livest. Prod. Sci.
34:137-152.
NPPC. 2002. Pork Composition and Quality Assessment Procedures. National Pork
Board. Des Moines, IA.
NRC. 1998. Nutrient Requirements of Swine (10th
Rev. Ed.). National Academy Press,
Washington DC.
Nurmberg, K., J. Wegner, K. Ender. 1998. Factors influencing fat composition in muscle

111
and adipose tissue of farm animals. Livest. Prod. Sci. 56:145-156.
Ostrowska, E., M. Muralitharan, R. F. Cross, D. E. Bauman, and F. R. Dunshea. 1999.
Dietary conjugated linoleic acids increase lean tissue and decrease fat deposition
in growing pigs. J. Nutr. 129:2037-2042.
Overland, M., Z. Mroz, and F. Sundstol. 1994. Effect of lecithin on the apparent ileal and
overall digestibility of crude fat and fatty acids in pigs. J. Anim. Sci. 72:2022-
2028.
Owsley, W. F., D. A. Knabe, and T. D. Tanksley, Jr. 1981. Effect of sorghum particle
size on digestibility of nutrients at the terminal ileum and over the total digestive
tract of growing-finishing pigs. J. Anim. Sci. 52:557–566.
Ozimek, L., W. C. Sauer, W. Kozikowski, and H. Jørgensen. 1984. The ileal and fecal
digestibility of fat and fatty acids in pigs fed semi-purified diets containing beef
tallow or rapeseed oil. 63rd
Annual Feeders’ Day Report. Agriculture and
Forestry Bulletin Special Issue.
Palmquist, D. L. and T. C. Jenkins. 2003. Challenges with fats and fatty acid methods. J.
Anim. Sci. 81:3250-32-54.
Patience, J. F. and P. A. Thacker. 1989. Swine Nutrition Guide. University of
Saskatchewan. Saskatoon, Saskatchewan, Canada
Pedersen, C., M. G. Boersma, H. H. Stein. 2007. Digestibility of energy and phosphorus
in ten samples of distillers dried grains with soluble fed to growing pigs. J. Anim.
Sci. 85:1168-1176.
Pettigrew, J. E. and R. L. Moser. 1991. Fat in Swine Nutrition. In: Swine Nutrition. E. R.
Miller, D. E. Ullrey, and A. J. Lewis, eds. Stoneham, U.K., Butterworth-
Heinemann. Pp. 133-146.
Pomerenke, J. M. 2012. Effects of adding supplemental tallow to diets containing 30%
DDGS on growth performance, carcass characteristics, and fat quality in growing-
finishing pigs. M.S. thesis, University of Minnesota.
Pond, W. G., D. C. Church, and K. R. Pond. 1995. Basic Animal Nutrition and Feeding.
4th
rev. ed. John Wiley & Sons, New York, NY.
Popowski, J., R. Cox, J. Pomerenke, G. Shruson, and R. Laberge. 2010. Effect of feeding
diets containing corn dried distillers grains with soluble (DDGS) and beef tallow
to growing-finishing pigs on fresh and processed pork shelf life characteristics. J.
Anim. Sci 88 (E-Suppl. 3): 107 (Abstr.)
Ramsay, T. G. 2003. Porcine leptin inhibits lipogenesis in porcine adipocytes. J. Anim.

112
Sci. 81:3008-3017.
Rentfrow, G., T. E. Sauber, G. L. Allee, and E. P. Berg. 2003. The influence of diets
containing either conventional corn, conventional corn with choice white grease,
high oil corn, or high oil high oleic corn on belly/bacon quality. Meat Sci. 64:459-
466.
RFA. 2011. Building bridges to a more sustainable future: 2011 Ethanol Industry
Outlook. Accessed June 1, 2011. http://www.ethanolrfa.org/page/-
/2011%20RFA%20Ethanol%20Industry%20Outlook.pdf?nocdn=1
Ridley, W. P., R. S. Sidhu, P. D. Pyla, M. A. Nemeth, M. L. Breeze, and J. D. Astwood.
2002. Comparison of the nutritional profile of glyphosate-tolerant corn event
NK603 with that of conventional corn (Zea mays L.) J. Agric. Food. Chem.
50:7235-7243.
Rosmini, M. R., F. Perlo, J. A. Pérez-Alvares, M. J. Pagán-Moreno, A. Gago-Gago, F.
López-Santoveña, and V. Aranda-Catalá. 1996. TBA test by and extractive
method applied to ‘Paté’. Meat Sci. 42:103-110.
Sanders, T. A. B. The role of fat in the diet- quantity, quality, and sustainability. 2010.
Nutrition Bulletin. 35:138-146.
Scramlin, S. M., S. N. Carr, C. W. Parks, D. M. Fernandez-Duenas, C. M. Leick, F. K.
McKeith, and J. Killefer. 2008. Effect of ractopamine level, gender, and duration
of ractopamine on belly and bacon quality traits. Meat Sci. 80:1218-1221.
Schinckel, A. P., S. E. Mills, T. E. Weber, and J. M. Eggert. 2002. A review of genetic
and nutritional factors affecting fat quality and belly firmness. Pages 89–113 in
Proc. Natl. Swine Improv. Fed. Annu. Mtg., Nashville, TN.
Schinckel, A., M. Latour, and B. Richert. 2010. Effects of dried distiller grains with
solubles (DDGS) and ractopamine on growth performance and carcass
characteristics of swine. J. Anim. Sci. 88(E-suppl. 3): 93. (Abstr.)
Schinckel, A. P., J. M. Eggert, B. T. Richert, and A. L. Carroll. 2000. Effects of
conjugated linolenic acid (CLA) supplementation on pig growth, pork quality, and
carcass composition in two genetic populations of gilts. Swine Day 2000. Purdue
Univ. West Layfette, IN.
Scramlin, S. M., S. N. Carr, C. W. Parks, D. M. Fernandes-Duenas, C. M. Leick, F. K.
McKeith, J. Killefer. 2008. Effect of ractopamine level, gender, and duration of
ractopamine on belly and bacon quality traits. Meat Sci. 80:1218-1221.
Seerley, R. W., J. P. Briscoe, and H. C. McCampbell. 1978. A comparision of poultry and
animal fat on performance, body composition, and tissue lipids of swine. J. Anim.

113
Sci. 46:1018-1023.
Sheppard, A. J. 1963. Suitability of lipid extraction procedures for gas-liquid
chromatography. J. Am. Oil Chem. Soc. 40:545-548.
Shi, X. S. and J. Noblet. 1993. Digestible and metabolizable energy values of ten feed
ingredients in growing pigs fed ad libitum and sows fed at maintenance level:
Comparative contribution of the hindgut. Anim. Feed Sci. Tech. 42:223-236.
Shurson, G.C. 2009. Analysis of current feeding practices of distiller’s grains with
soluble in livestock and poultry feed relative to land use credits associated with
determining the low carbon fuel standard for ethanol. www.ethanolrfa.org/page/-
/objects/documents/2290/shurson.pdf
Shurson, J. and A. S. Alghamdi. 2008. Quality and new technologies to produce corn co-
products from ethanol production. In: Using Distillers Grains in the U.S. and
International Livestock and Poultry Industries: The Current State of Knowledge.
CARD, ISU, Ames. IA 231-259.
Smith, D. R., D. A. Knabe, and S. B. Smith. 1996. Depression of lipogenesis in swine
adipose tissue by specific dietary fatty acids. J. Anim. Sci. 74:975-983.
Spiehs, M. J., M. H. Whitney, and G. C. Shurson. 2002. Nutrient database for distiller’s
dried grains with soluble produced from new ethanol plants in Minnesota and
South Dakota. J. Anim. Sci. 80:2639-2645.
Srichana, P., A. M. Gaines, B. W. Ratliff, G. L. Allee, and J. L. Usry. 2005. Evaluation of
an optimum fat level for early and late finishing pigs. J. Anim. Sci. 83 (Suppl
2):80 (Abstr.)
Stahly, T. S. 1984. Use of fats in diets for growing pigs. Page 313-331 in Fats in Animal
Nutrition. J. Wiseman, ed. Butterworths, London, UK.
Stein, H. H., and G. C. Shurson. 2009. Board-invited review: the use and application of
distillers dried grains with soluble in swine diets. J. Anim. Sci. 87: 1292-1303.
Stein, H.H. 2009. Ileal and total tract apparent and true digestibility of fat in distillers
dried grains with soluble and other corn oil products fed to growing pigs.
Accessed on May 3, 2012.
http://www.pork.org/FileLibrary/ResearchDocuments/08-115-STEIN-UofILL-
ABS.pdf
Ulery, M. C., G. L. Cromwell, G. K. Rentfrow, M. D. Lindemann, and M. J. Azain. 2010.
Attempts to improve belly firmness in finishing pigs fed a high level of DDGS. J.
Anim. Sci. Vol. 88(E-Suppl. 3):53 (Abstr.)

114
Urriola, P. E., 2007. Digestibility of dried distillers grains with solubles, In vivo
estimation and In Vitro prediction. M.S. Thesis. Univ. of Minnesota. St. Paul.
Urriola, P. E., G. C. Shurson, and H. H. Stein. 2010. Digestibility of dietary fiber in
distillers coproducts fed to growing pigs. J. Anim. Sci. 88:2373-2381.
Varel, V. H. 1987. Activity of fiber-degrading microorganisms in the pig large intestine.
J. Anim. Sci. 65:488-496.
Varel, V. H., and W. G. Pond. 1985. Enumeration and activity of cellulolytic bacteria
from gestating swine fed various levels of dietary fiber. Appl. Environ. Microbiol.
49:858-862.
Vernon, R. G, M. C. Barber, and M. T. Travers. 1999. Present and future studies on
lipogenesis in animals and human subjects. Proc. Nutr. Soc. 58:541-549.
Villegas, F. J., H. B. Hedric, T. L. Veum, K. L. McFate, and M. E. Bailey. 1973. Effect
of diet and breed on fatty acid composition of porcine adipose tissue. J. Anim.
Sci. 36:663-668.
Wang, J. F., Y. H. Zhu, D. F. Li, M. Wang, and B. B. Jensen. 2004. Effect of type and
level of dietary fibre and starch on ileal and faecal microbial activitiy and short-
chain fatty acid concentrations in growing pigs. J. Anim. Sci. 78:109-117.
Weber, T. E., B. T. Richert, M. A. Belury, Y. Gu, K. Enright, and A. P. Schinckel. 2006.
Evaluation of the effects of dietary fat, conjugated linoleic acid, and ractopamine
on growth performance, pork quality, and fatty acid profiles in genetically lean
gilts. J. Anim. Sci. 84:720-732.
Wenk, C. 2001. The role of dietary fibre in the digestive physiology of the pig. Anim.
Feed Sci. Technol. 90: 21-33.
White, H. M., B. T. Richert, A. P. Schinckel, J. R. Burgess, S. S. Donkin, and M. A.
Latour. 2008. Effects of temperature stress on growth performance and bacon
quality in grow-finish pig housed at two densities. J. Anim. Sci. 86:1789-1798.
Whitney, M. H., G. C. Shurson, L. J. Johnston, D. M. Wulf, and B. C. Shanks. 2006.
Growth performance and carcass characteristics of grower-finisher pigs fed high-
quality corn distillers dried grain with solubles originating from a modern
Midwestern ethanol plant. J. Anim. Sci. 84:3356-3363.
Widmer, M. R., L. M. McGinnis, D. M. Wulf, and H. H. Stein. 2008. Effects of feeding
distillers dried grains with soluble, high-protein distillers dried grains, and corn
germ to growing-finishing pigs on pig performance, carcass quality, and the
palatability of pork. J. Anim. Sci. 86:1819-1831.

115
Widyaratne, G. P. and R. T. Zijlstra. 2007. Nutritional value of wheat and corn distiller’s
dried grain with soluble: Digestibility and digestible contents of energy, amino
acids and phosphorus, nutrient excretion and growth performance of grower-
finisher pigs. Can. J. Anim. Sci. 87:103-114.
Wilfart, A., L. Montagne, P. H. Simmins, J. van Milgen, J. Noblet. 2007. Sites of nutrient
digestion in growing pigs: Effect of dietary fiber. J. Anim. Sci. 85: 976-983.
Wood, J. D., M. Enser, F. M. Whittington, C. B. Monchieff, and A. J. Kempster. 1989.
Backfat composition in pigs: differences between fat thickness groups and sexes.
Lvstk. Prod. Sci. 22:351-362.
Xu, G., S. K. Baidoo, L. J. Johnston, D. Bibus, J. E. Cannon and G. C. Shurson. 2010a.
The effects of feeding diets containing corn distillers dried grains with soluble,
and withdrawal period of distillers dried grains with soluble, on growth
performance and pork quality in grower-finisher pigs. J. Anim. Sci. 88:1388-
1397.
Xu, G., S. K. Baidoo, L. J. Johnston, D. Bibus, J. E. Cannon and G. C. Shurson. 2010b.
Effects of feeding dites containing increasing content of corn distillers dried
grains with soluble to grower-finisher pigs on growth performance, carcass
composition, and pork fat quality. J. Anim. Sci. 88:1398-1410.
Yen, J. 2001a. Anatomy of the digestive system and nutritional physiology. Pages 31-64
in Swine Nutrition. A. J. Lewis and L. L. Southern, ed. CRC Press, Boca Raton,
FL.
Yen, J. 2001b. Blood sampling and surgical techniques. Page 961-983 in Swine
Nutrition. A. J. Lewis and L. L. Southern, ed. CRC Press, Boca Raton, FL.
Yin, Y. L., J. D. McEvoy, H. Schulze, and K. J. McCracken. 2001. Effects of xylanase
and antibiotic addition on ileal and faecal apparent digestibilities of dietary
nutrients and evaluating HCl-insoluble ash as a dietary marker in growing pigs.
Animal Science 72:95-103.