Embed Size (px)
Citation preview
. . . . . . . . . .
. . . . . .. . . .
Assessment of the Effectiveness of Various Methods of Delivery of Public Awareness Information on Tropical Cyclones to the Queensland Coastal Communities
2
. . . . . . .. . .
Report prepared for Emergency Management Australia
by
Linda Anderson-Berry David King Centre for Disaster Studies James Cook University
Geoff Crane Bureau of Meteorology
3
ACKNOWLEDGEMENTS
We thank most sincerely the residents of Cairns and Townsville, who willingly
participated in the survey, for their time and thoughtful contributions.
Thanks also to our telephone survey team -Katy Morandin, Ruth Girling-King, Julia
Goulding, Shannon Weatherall, Jade Wood and Sarah Berry – for their careful attention
to detail.
4
Table of Contents
1 Introduction ...........................................................6
2 Aims .......................................................................8
3 Methodology..........................................................9
3.1 Survey technique ......................................................... 9
3.2 Population Sample..................................................... 10
3.2.1 Gender....................................................................... 10
3.2.2 Age distribution .......................................................... 10
3.2.3 Length of residence ................................................... 11
3.2.4 Home ownership – residency status .......................... 11
4 Results ...........................................................................12
4.1 Cyclone awareness information................................. 12
4.1.1 Pre-cyclone season cyclone awareness information . 12
4.1.2 Pre-cyclone season public meetings ......................... 13
4.1.3 Cyclone awareness information in households.......... 13
4.1.4 Cyclone tracking maps .............................................. 15
4.1.5 Weather forecasts and weather information .............. 16
4.2 Cyclone preparedness............................................... 18
4.2.1 Preparing properties for the cyclone season ............. 18
4.3 Cyclone awareness ................................................... 19
4.3.1 Cyclone categories .................................................... 19
4.3.2 Awareness of storm surge ......................................... 20
4.4 Cyclone warnings ...................................................... 21
4.4.1 Residents understanding of cyclone watch.............. 21
4.4.2 Residents understanding of cyclone warning .......... 22
4.4.3 Where residents access warnings during a cyclone .. 23
5
4.5 Previous cyclone experience ..................................... 24
5 Discussion......................................................................26
5.1 Awareness of Information ............................................26
5.2 Public meetings ...........................................................27
5.3 Plotting Cyclones .........................................................28
5.4 Tropical Cyclone awareness........................................29
5.5 Weather forecasts........................................................31
5.6 Cyclone preparation.....................................................31
6 Conclusion and Recommendations ............................33
7 References......................................................................36
8 Appendices.....................................................................39
8.1 Appendix 1 Survey Questionnaire .................... 39
8.2 Appendix 2 : When does a cyclone watch begin? –
Survey responses............................................................... 42
8.3 Appendix 3: What does a cyclone warning mean? –
Survey responses............................................................... 44
6
1 Introduction The northern coastal areas of Australia are vulnerable to the impact of tropical cyclones
and associated storm surges, particularly within the tropical wet season between the
beginning of November and the end of April. Most of the population of this coastal zone
is concentrated in Queensland, where all of the coastline from the Gold Coast to the
Gulf of Carpentaria may be impacted by cyclones. Every year at least one, but usually
several cyclones will cross this coastline. In Queensland alone, 409,000 people (ABS
1998a) live in Census Collection Districts that are within 1 kilometre of the coast, while
almost three million live within 30 kilometres of the coast. Over the past decade
Queensland coastal communities have experienced relatively rapid and sustained
population growth and economic development. Australian Bureau of Statistics (ABS)
census data confirms that during the early 1990’s these coastal regions experienced a
15% increase in population; a 17% increase in the proportion of over 65 year-olds in the
population; a 12% increase in those under 5 years old; a 26% increase in single parent
families; a 31% increase in population from a non-English-speaking background; and a
40% increase in the indigenous population. (ABS 1998b)Thus, not only is there a large
population in this cyclone prone region, it is a rapidly increasing population in which
specifically identified vulnerable communities are also increasing rapidly in numbers.
Every year the Bureau of Meteorology conducts cyclone awareness campaigns before
the cyclone season begins. The aim of these is to educate people, raise awareness of
the cyclone hazard and instil behaviour and attitudes that contribute towards
preparedness. The goal is to reduce the resident population’s vulnerability to cyclone
related losses through greater knowledge and awareness of both the hazard itself and
appropriate defensive and protective actions. The campaigns take place through public
meetings in coastal towns, local government briefings, and presentations to school
students, media briefings, press articles and supplementary literature such as brochures
and pamphlets. Post cyclone impact studies carried out throughout the North and Far
North Queensland region since the mid-1990’s, and general cyclone awareness and
preparedness studies conducted by researchers, including those at the Centre for
Disaster Studies, indicate however, that cyclone awareness within the resident

7
population remains less than ideal and that communities are generally not well prepared
for land-falling tropical cyclones.
8
2 Aims This study aims to evaluate the effectiveness of various components of the cyclone
awareness campaigns that are currently supported by the Bureau of Meteorology -
either individually or in cooperation with other agencies and organisations. The
evaluation will identify strengths and weaknesses of the campaigns, and any failures of
coverage within the community. The study further aims to explore community
preferences for cyclone awareness information and education in terms of format and
mode of delivery. It is anticipated that an understanding of any identified strengths and
weaknesses will enhance the development of future cyclone awareness campaigns.
The overall goal of the study is to provide the Bureau of Meteorology with information
that will enable it to improve the effectiveness of cyclone awareness campaigns. And
thus ultimately reduce vulnerability to the cyclone hazard.
9
3 Methodology The effectiveness of current cyclone awareness campaigns has been assessed using
household surveys carried out in two Queensland cyclone-prone communities.
Townsville and Cairns.
3.1 Survey technique The survey instrument, to be delivered by telephone, was developed and administered
to a population sample of 415 and 500 household residents in Townsville and Cairns
respectively. An example of the survey questionnaire may be found in Appendix 1.
Residents included in the survey were selected randomly from Telstra’s white pages
database of landline telephone numbers. Household residents in residential properties
were specifically targeted for the study. Therefore, telephone numbers identified as
belonging to business and commercial premises were excluded.
A team of interviewers and research assistants administered the questionnaire
concurrently in Cairns and Townsville. Each team was trained, supervised and under the
management and control of the Centre for Disaster Studies throughout the survey
period. To avoid the possibility of systematically excluding any one group in the total
population, telephone surveys were carried out between the hours of 0830 and 2100
seven days a week throughout December 2001 and January 2002. The purpose and
origins of the study was explained to adult (>18 years old) household residents that
answered the telephone calls. They were then invited to participate in the study.
Approximately 25% of the telephone calls that were answered resulted in the successful
completion of a questionnaire. Administration of the questionnaire took approximately 5
minutes. It explored residents, knowledge and experience of warnings, previous hazard
response and behaviour, and included knowledge questions that unobtrusively explored
people’s understanding of weather forecast terminology, the hazard dangers and
cyclone warnings. Questions relating to respondent demographics were included to
ensure population samples could be confirmed as being representative and to facilitate
comparison between data sets. Survey responses included both qualitative and
quantitative data. Qualitative data has been categorised, presented and discussed.
10
Simple statistical frequency and descriptive analyses of quantitative data has been
carried out using the computer based SPSS software.
Participation in surveys was voluntary. Respondents were assured that individual
responses would remain confidential and that only aggregate data would appear in the
final report. Ethical approval was obtained from appropriate institutional ethics
committees.
3.2 Population Sample
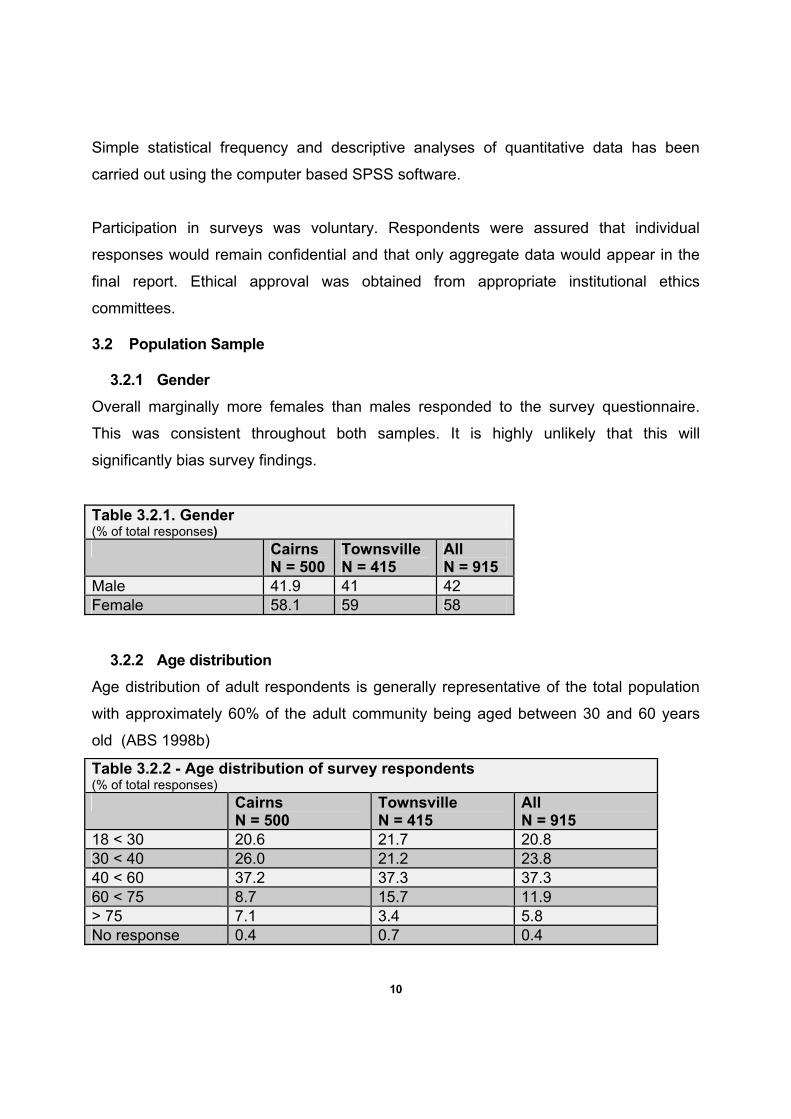
3.2.1 Gender Overall marginally more females than males responded to the survey questionnaire.
This was consistent throughout both samples. It is highly unlikely that this will
significantly bias survey findings.
Table 3.2.1. Gender (% of total responses) Cairns
N = 500 Townsville N = 415
All N = 915
Male 41.9 41 42 Female 58.1 59 58
3.2.2 Age distribution Age distribution of adult respondents is generally representative of the total population
with approximately 60% of the adult community being aged between 30 and 60 years
old (ABS 1998b)
Table 3.2.2 - Age distribution of survey respondents (% of total responses) Cairns
N = 500 Townsville N = 415
All N = 915
18 < 30 20.6 21.7 20.8 30 < 40 26.0 21.2 23.8 40 < 60 37.2 37.3 37.3 60 < 75 8.7 15.7 11.9 > 75 7.1 3.4 5.8 No response 0.4 0.7 0.4
11
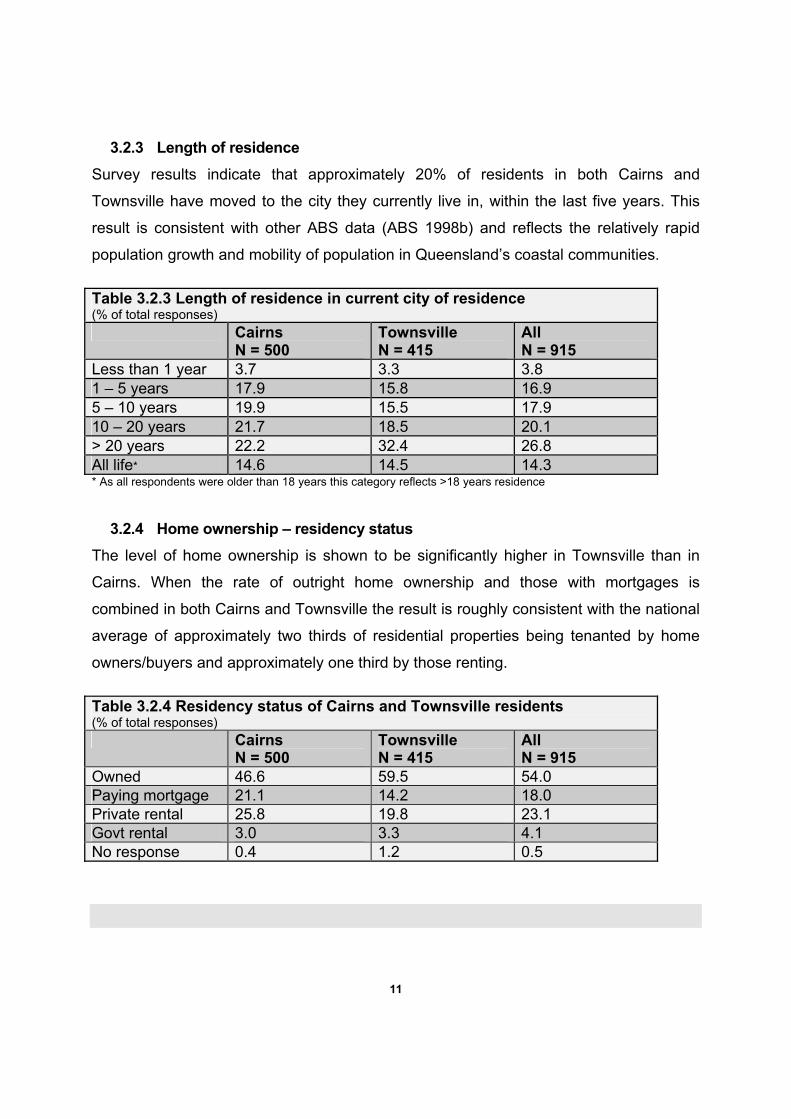
3.2.3 Length of residence Survey results indicate that approximately 20% of residents in both Cairns and
Townsville have moved to the city they currently live in, within the last five years. This
result is consistent with other ABS data (ABS 1998b) and reflects the relatively rapid
population growth and mobility of population in Queensland’s coastal communities.
Table 3.2.3 Length of residence in current city of residence (% of total responses) Cairns
N = 500 Townsville N = 415
All N = 915
Less than 1 year 3.7 3.3 3.8 1 – 5 years 17.9 15.8 16.9 5 – 10 years 19.9 15.5 17.9 10 – 20 years 21.7 18.5 20.1 > 20 years 22.2 32.4 26.8 All life* 14.6 14.5 14.3 * As all respondents were older than 18 years this category reflects >18 years residence
3.2.4 Home ownership – residency status The level of home ownership is shown to be significantly higher in Townsville than in
Cairns. When the rate of outright home ownership and those with mortgages is
combined in both Cairns and Townsville the result is roughly consistent with the national
average of approximately two thirds of residential properties being tenanted by home
owners/buyers and approximately one third by those renting.
Table 3.2.4 Residency status of Cairns and Townsville residents (% of total responses) Cairns
N = 500 Townsville N = 415
All N = 915
Owned 46.6 59.5 54.0 Paying mortgage 21.1 14.2 18.0 Private rental 25.8 19.8 23.1 Govt rental 3.0 3.3 4.1 No response 0.4 1.2 0.5
12
4 Results
4.1 Cyclone awareness information
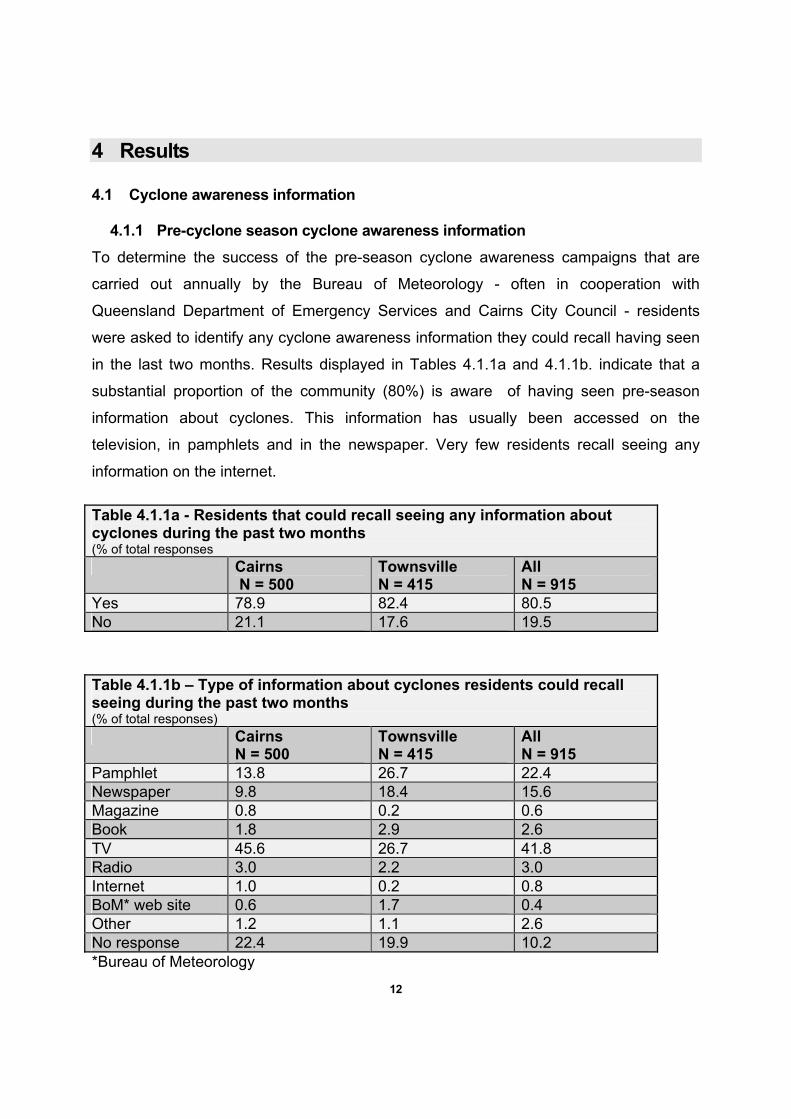
4.1.1 Pre-cyclone season cyclone awareness information To determine the success of the pre-season cyclone awareness campaigns that are
carried out annually by the Bureau of Meteorology - often in cooperation with
Queensland Department of Emergency Services and Cairns City Council - residents
were asked to identify any cyclone awareness information they could recall having seen
in the last two months. Results displayed in Tables 4.1.1a and 4.1.1b. indicate that a
substantial proportion of the community (80%) is aware of having seen pre-season
information about cyclones. This information has usually been accessed on the
television, in pamphlets and in the newspaper. Very few residents recall seeing any
information on the internet.
Table 4.1.1a - Residents that could recall seeing any information about cyclones during the past two months (% of total responses Cairns
N = 500 Townsville N = 415
All N = 915
Yes 78.9 82.4 80.5 No 21.1 17.6 19.5
Table 4.1.1b – Type of information about cyclones residents could recall seeing during the past two months (% of total responses) Cairns
N = 500 Townsville N = 415
All N = 915
Pamphlet 13.8 26.7 22.4 Newspaper 9.8 18.4 15.6 Magazine 0.8 0.2 0.6 Book 1.8 2.9 2.6 TV 45.6 26.7 41.8 Radio 3.0 2.2 3.0 Internet 1.0 0.2 0.8 BoM* web site 0.6 1.7 0.4 Other 1.2 1.1 2.6 No response 22.4 19.9 10.2 *Bureau of Meteorology
13
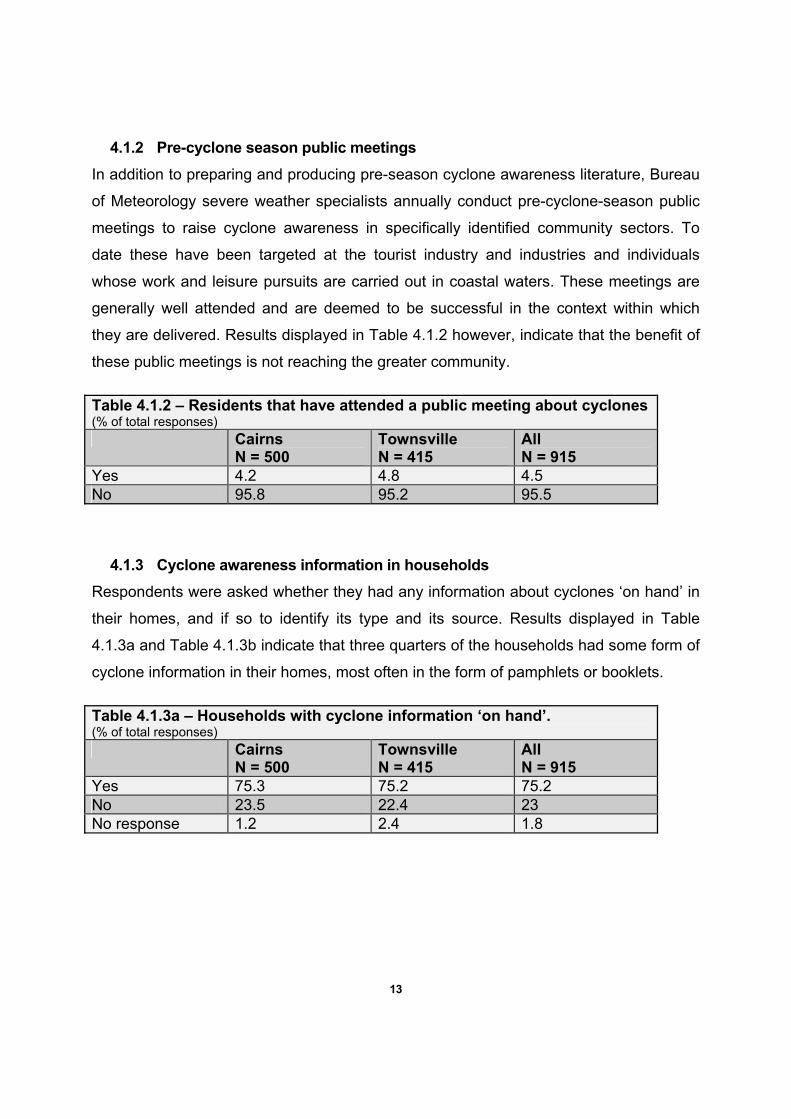
4.1.2 Pre-cyclone season public meetings In addition to preparing and producing pre-season cyclone awareness literature, Bureau
of Meteorology severe weather specialists annually conduct pre-cyclone-season public
meetings to raise cyclone awareness in specifically identified community sectors. To
date these have been targeted at the tourist industry and industries and individuals
whose work and leisure pursuits are carried out in coastal waters. These meetings are
generally well attended and are deemed to be successful in the context within which
they are delivered. Results displayed in Table 4.1.2 however, indicate that the benefit of
these public meetings is not reaching the greater community.
Table 4.1.2 – Residents that have attended a public meeting about cyclones (% of total responses) Cairns
N = 500 Townsville N = 415
All N = 915
Yes 4.2 4.8 4.5 No 95.8 95.2 95.5
4.1.3 Cyclone awareness information in households Respondents were asked whether they had any information about cyclones ‘on hand’ in
their homes, and if so to identify its type and its source. Results displayed in Table
4.1.3a and Table 4.1.3b indicate that three quarters of the households had some form of
cyclone information in their homes, most often in the form of pamphlets or booklets.
Table 4.1.3a – Households with cyclone information ‘on hand’. (% of total responses) Cairns
N = 500 Townsville N = 415
All N = 915
Yes 75.3 75.2 75.2 No 23.5 22.4 23 No response 1.2 2.4 1.8
14
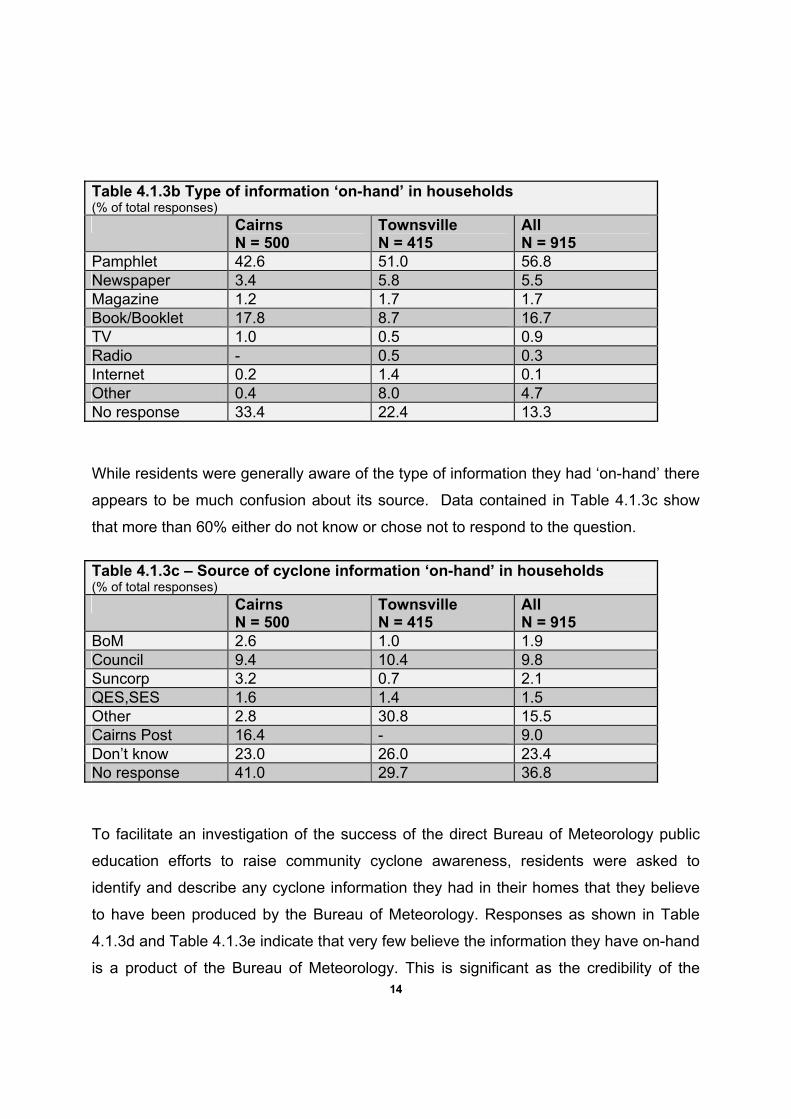
Table 4.1.3b Type of information ‘on-hand’ in households (% of total responses) Cairns
N = 500 Townsville N = 415
All N = 915
Pamphlet 42.6 51.0 56.8 Newspaper 3.4 5.8 5.5 Magazine 1.2 1.7 1.7 Book/Booklet 17.8 8.7 16.7 TV 1.0 0.5 0.9 Radio - 0.5 0.3 Internet 0.2 1.4 0.1 Other 0.4 8.0 4.7 No response 33.4 22.4 13.3
While residents were generally aware of the type of information they had ‘on-hand’ there
appears to be much confusion about its source. Data contained in Table 4.1.3c show
that more than 60% either do not know or chose not to respond to the question.
Table 4.1.3c – Source of cyclone information ‘on-hand’ in households (% of total responses) Cairns
N = 500 Townsville N = 415
All N = 915
BoM 2.6 1.0 1.9 Council 9.4 10.4 9.8 Suncorp 3.2 0.7 2.1 QES,SES 1.6 1.4 1.5 Other 2.8 30.8 15.5 Cairns Post 16.4 - 9.0 Don’t know 23.0 26.0 23.4 No response 41.0 29.7 36.8
To facilitate an investigation of the success of the direct Bureau of Meteorology public
education efforts to raise community cyclone awareness, residents were asked to
identify and describe any cyclone information they had in their homes that they believe
to have been produced by the Bureau of Meteorology. Responses as shown in Table
4.1.3d and Table 4.1.3e indicate that very few believe the information they have on-hand
is a product of the Bureau of Meteorology. This is significant as the credibility of the
15
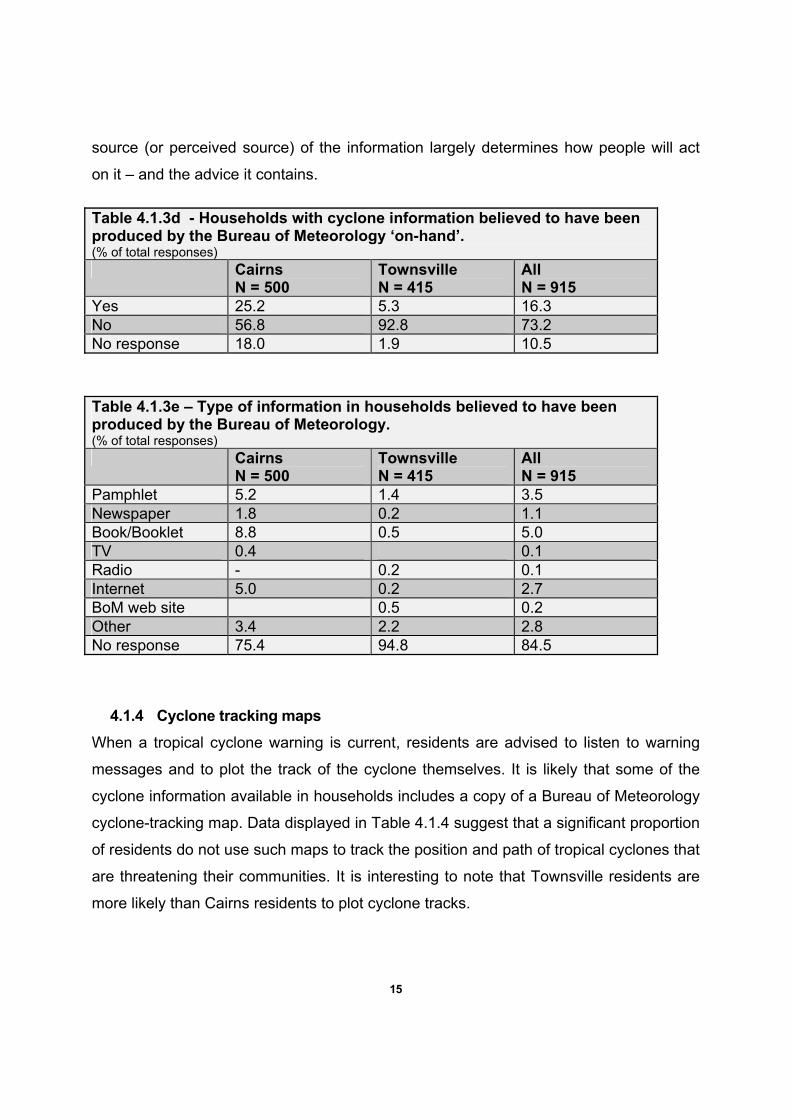
source (or perceived source) of the information largely determines how people will act
on it – and the advice it contains.
Table 4.1.3d - Households with cyclone information believed to have been produced by the Bureau of Meteorology ‘on-hand’. (% of total responses) Cairns
N = 500 Townsville N = 415
All N = 915
Yes 25.2 5.3 16.3 No 56.8 92.8 73.2 No response 18.0 1.9 10.5
Table 4.1.3e – Type of information in households believed to have been produced by the Bureau of Meteorology. (% of total responses) Cairns
N = 500 Townsville N = 415
All N = 915
Pamphlet 5.2 1.4 3.5 Newspaper 1.8 0.2 1.1 Book/Booklet 8.8 0.5 5.0 TV 0.4 0.1 Radio - 0.2 0.1 Internet 5.0 0.2 2.7 BoM web site 0.5 0.2 Other 3.4 2.2 2.8 No response 75.4 94.8 84.5
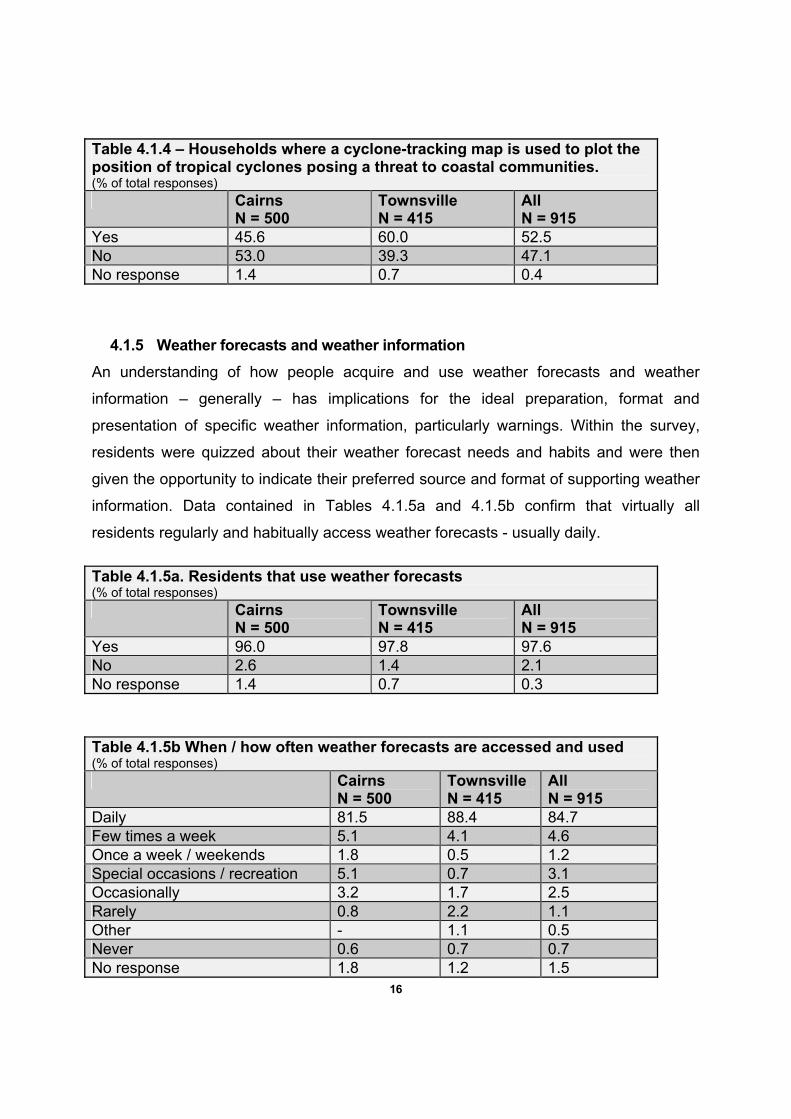
4.1.4 Cyclone tracking maps When a tropical cyclone warning is current, residents are advised to listen to warning
messages and to plot the track of the cyclone themselves. It is likely that some of the
cyclone information available in households includes a copy of a Bureau of Meteorology
cyclone-tracking map. Data displayed in Table 4.1.4 suggest that a significant proportion
of residents do not use such maps to track the position and path of tropical cyclones that
are threatening their communities. It is interesting to note that Townsville residents are
more likely than Cairns residents to plot cyclone tracks.
16
Table 4.1.4 – Households where a cyclone-tracking map is used to plot the position of tropical cyclones posing a threat to coastal communities. (% of total responses) Cairns
N = 500 Townsville N = 415
All N = 915
Yes 45.6 60.0 52.5 No 53.0 39.3 47.1 No response 1.4 0.7 0.4
4.1.5 Weather forecasts and weather information An understanding of how people acquire and use weather forecasts and weather
information – generally – has implications for the ideal preparation, format and
presentation of specific weather information, particularly warnings. Within the survey,
residents were quizzed about their weather forecast needs and habits and were then
given the opportunity to indicate their preferred source and format of supporting weather
information. Data contained in Tables 4.1.5a and 4.1.5b confirm that virtually all
residents regularly and habitually access weather forecasts - usually daily.
Table 4.1.5a. Residents that use weather forecasts (% of total responses) Cairns
N = 500 Townsville N = 415
All N = 915
Yes 96.0 97.8 97.6 No 2.6 1.4 2.1 No response 1.4 0.7 0.3
Table 4.1.5b When / how often weather forecasts are accessed and used (% of total responses) Cairns
N = 500 Townsville N = 415
All N = 915
Daily 81.5 88.4 84.7 Few times a week 5.1 4.1 4.6 Once a week / weekends 1.8 0.5 1.2 Special occasions / recreation 5.1 0.7 3.1 Occasionally 3.2 1.7 2.5 Rarely 0.8 2.2 1.1 Other - 1.1 0.5 Never 0.6 0.7 0.7 No response 1.8 1.2 1.5
17
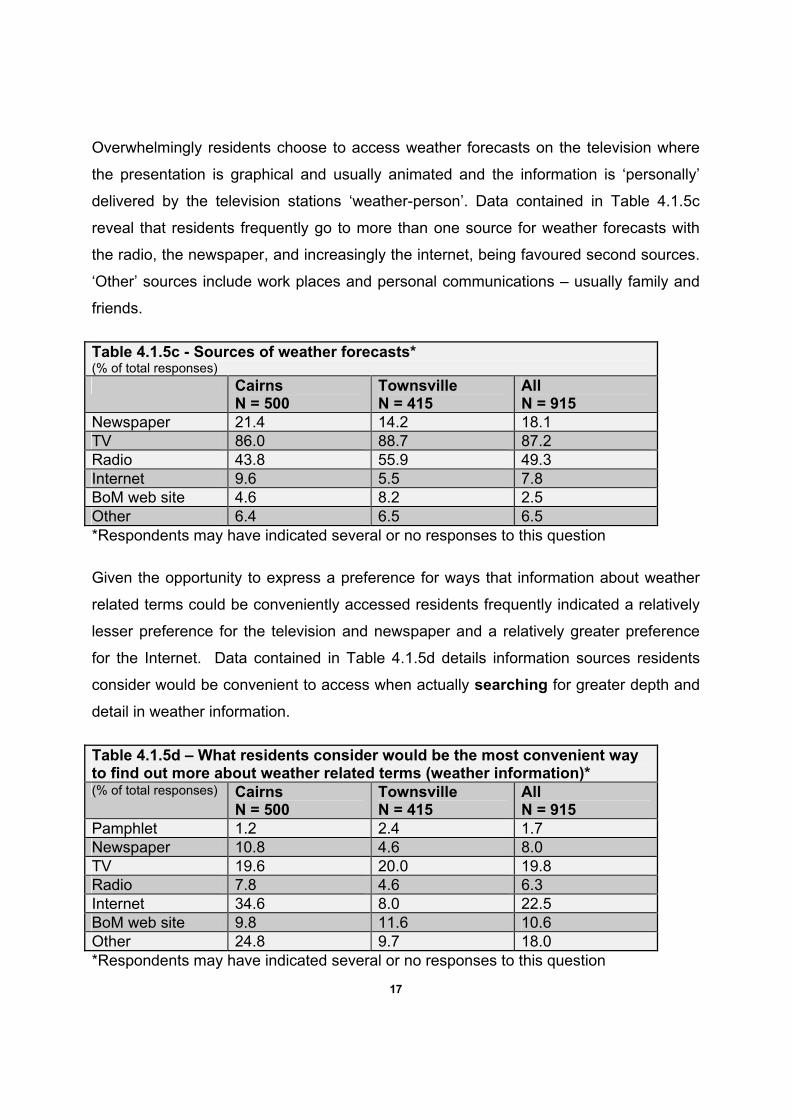
Overwhelmingly residents choose to access weather forecasts on the television where
the presentation is graphical and usually animated and the information is ‘personally’
delivered by the television stations ‘weather-person’. Data contained in Table 4.1.5c
reveal that residents frequently go to more than one source for weather forecasts with
the radio, the newspaper, and increasingly the internet, being favoured second sources.
‘Other’ sources include work places and personal communications – usually family and
friends.
Table 4.1.5c - Sources of weather forecasts* (% of total responses) Cairns
N = 500 Townsville N = 415
All N = 915
Newspaper 21.4 14.2 18.1 TV 86.0 88.7 87.2 Radio 43.8 55.9 49.3 Internet 9.6 5.5 7.8 BoM web site 4.6 8.2 2.5 Other 6.4 6.5 6.5 *Respondents may have indicated several or no responses to this question
Given the opportunity to express a preference for ways that information about weather
related terms could be conveniently accessed residents frequently indicated a relatively
lesser preference for the television and newspaper and a relatively greater preference
for the Internet. Data contained in Table 4.1.5d details information sources residents
consider would be convenient to access when actually searching for greater depth and
detail in weather information.
Table 4.1.5d – What residents consider would be the most convenient way to find out more about weather related terms (weather information)* (% of total responses) Cairns
N = 500 Townsville N = 415
All N = 915
Pamphlet 1.2 2.4 1.7 Newspaper 10.8 4.6 8.0 TV 19.6 20.0 19.8 Radio 7.8 4.6 6.3 Internet 34.6 8.0 22.5 BoM web site 9.8 11.6 10.6 Other 24.8 9.7 18.0 *Respondents may have indicated several or no responses to this question
18
4.2 Cyclone preparedness
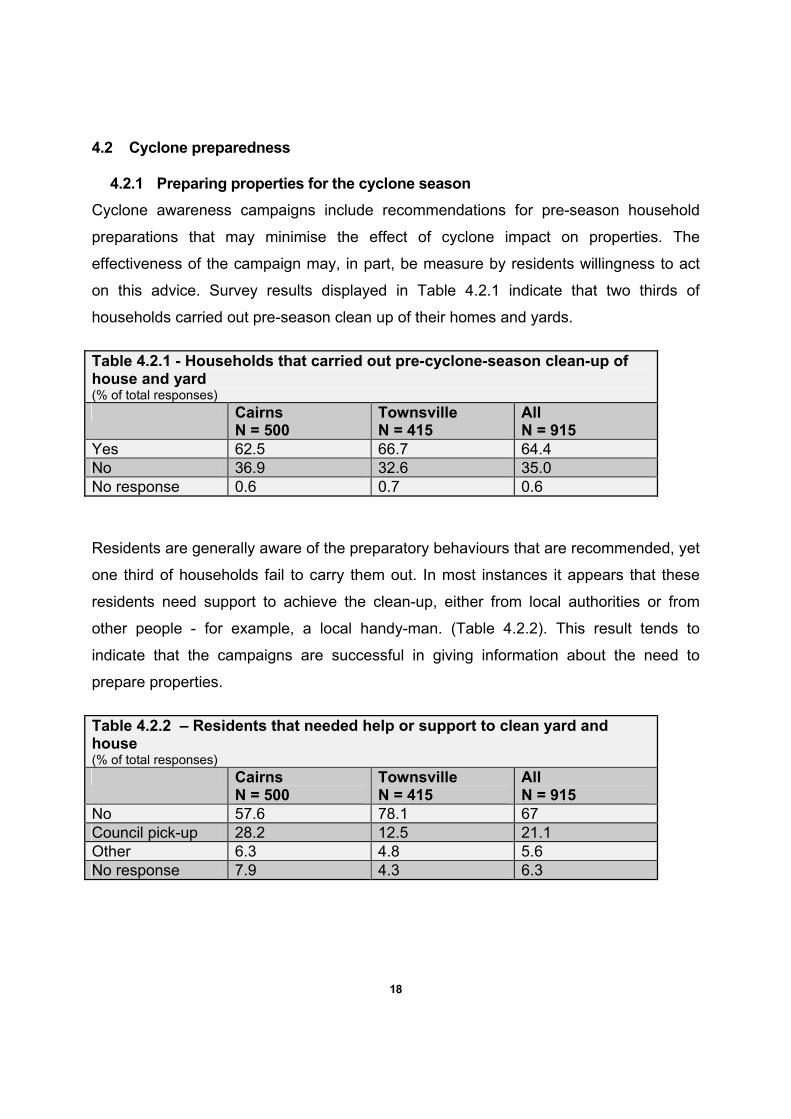
4.2.1 Preparing properties for the cyclone season Cyclone awareness campaigns include recommendations for pre-season household
preparations that may minimise the effect of cyclone impact on properties. The
effectiveness of the campaign may, in part, be measure by residents willingness to act
on this advice. Survey results displayed in Table 4.2.1 indicate that two thirds of
households carried out pre-season clean up of their homes and yards.
Table 4.2.1 - Households that carried out pre-cyclone-season clean-up of house and yard (% of total responses) Cairns
N = 500 Townsville N = 415
All N = 915
Yes 62.5 66.7 64.4 No 36.9 32.6 35.0 No response 0.6 0.7 0.6
Residents are generally aware of the preparatory behaviours that are recommended, yet
one third of households fail to carry them out. In most instances it appears that these
residents need support to achieve the clean-up, either from local authorities or from
other people - for example, a local handy-man. (Table 4.2.2). This result tends to
indicate that the campaigns are successful in giving information about the need to
prepare properties.
Table 4.2.2 – Residents that needed help or support to clean yard and house (% of total responses) Cairns
N = 500 Townsville N = 415
All N = 915
No 57.6 78.1 67 Council pick-up 28.2 12.5 21.1 Other 6.3 4.8 5.6 No response 7.9 4.3 6.3
19
4.3 Cyclone awareness
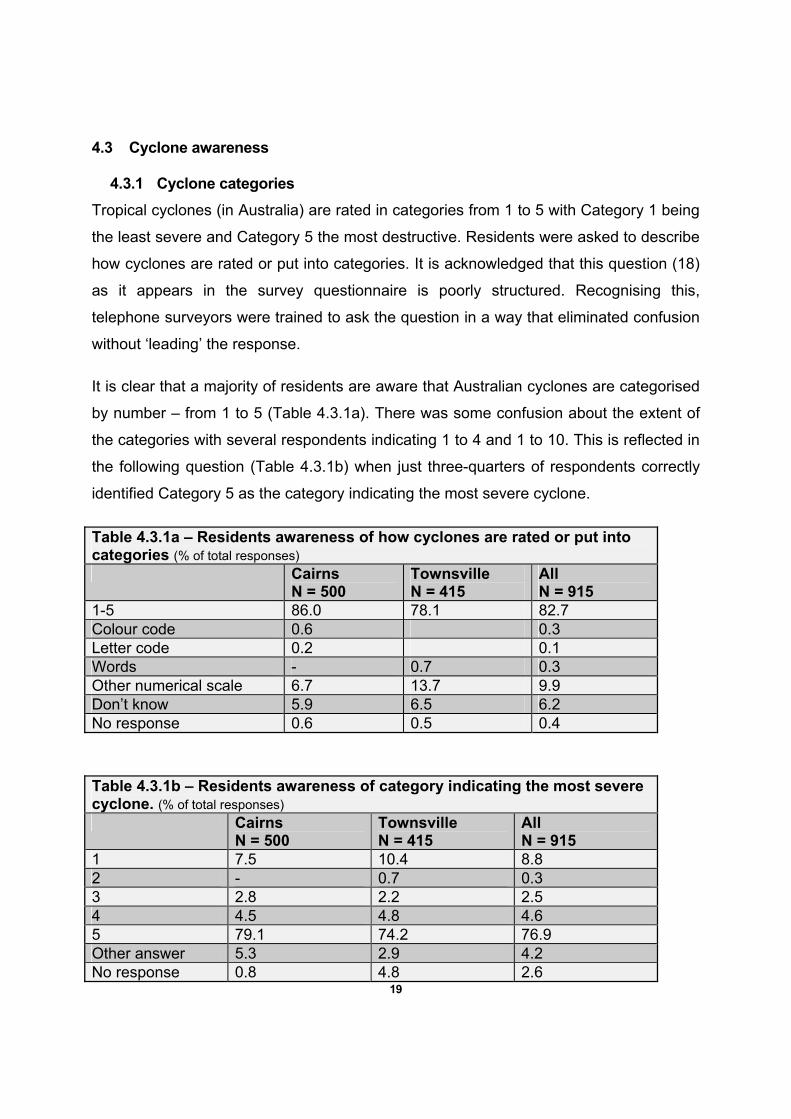
4.3.1 Cyclone categories Tropical cyclones (in Australia) are rated in categories from 1 to 5 with Category 1 being
the least severe and Category 5 the most destructive. Residents were asked to describe
how cyclones are rated or put into categories. It is acknowledged that this question (18)
as it appears in the survey questionnaire is poorly structured. Recognising this,
telephone surveyors were trained to ask the question in a way that eliminated confusion
without ‘leading’ the response.
It is clear that a majority of residents are aware that Australian cyclones are categorised
by number – from 1 to 5 (Table 4.3.1a). There was some confusion about the extent of
the categories with several respondents indicating 1 to 4 and 1 to 10. This is reflected in
the following question (Table 4.3.1b) when just three-quarters of respondents correctly
identified Category 5 as the category indicating the most severe cyclone.
Table 4.3.1a – Residents awareness of how cyclones are rated or put into categories (% of total responses) Cairns
N = 500 Townsville N = 415
All N = 915
1-5 86.0 78.1 82.7 Colour code 0.6 0.3 Letter code 0.2 0.1 Words - 0.7 0.3 Other numerical scale 6.7 13.7 9.9 Don’t know 5.9 6.5 6.2 No response 0.6 0.5 0.4
Table 4.3.1b – Residents awareness of category indicating the most severe cyclone. (% of total responses) Cairns
N = 500 Townsville N = 415
All N = 915
1 7.5 10.4 8.8 2 - 0.7 0.3 3 2.8 2.2 2.5 4 4.5 4.8 4.6 5 79.1 74.2 76.9 Other answer 5.3 2.9 4.2 No response 0.8 4.8 2.6
20
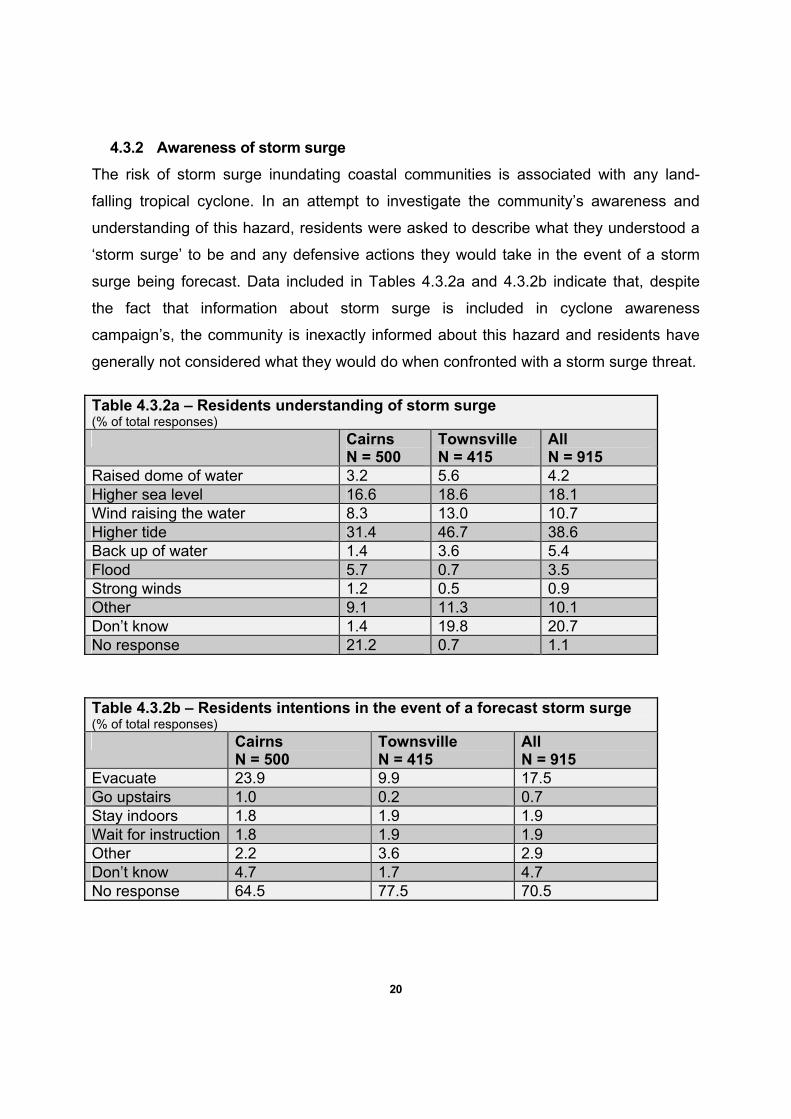
4.3.2 Awareness of storm surge The risk of storm surge inundating coastal communities is associated with any land-
falling tropical cyclone. In an attempt to investigate the community’s awareness and
understanding of this hazard, residents were asked to describe what they understood a
‘storm surge’ to be and any defensive actions they would take in the event of a storm
surge being forecast. Data included in Tables 4.3.2a and 4.3.2b indicate that, despite
the fact that information about storm surge is included in cyclone awareness
campaign’s, the community is inexactly informed about this hazard and residents have
generally not considered what they would do when confronted with a storm surge threat.
Table 4.3.2a – Residents understanding of storm surge (% of total responses) Cairns
N = 500 Townsville N = 415
All N = 915
Raised dome of water 3.2 5.6 4.2 Higher sea level 16.6 18.6 18.1 Wind raising the water 8.3 13.0 10.7 Higher tide 31.4 46.7 38.6 Back up of water 1.4 3.6 5.4 Flood 5.7 0.7 3.5 Strong winds 1.2 0.5 0.9 Other 9.1 11.3 10.1 Don’t know 1.4 19.8 20.7 No response 21.2 0.7 1.1
Table 4.3.2b – Residents intentions in the event of a forecast storm surge (% of total responses) Cairns
N = 500 Townsville N = 415
All N = 915
Evacuate 23.9 9.9 17.5 Go upstairs 1.0 0.2 0.7 Stay indoors 1.8 1.9 1.9 Wait for instruction 1.8 1.9 1.9 Other 2.2 3.6 2.9 Don’t know 4.7 1.7 4.7 No response 64.5 77.5 70.5
21
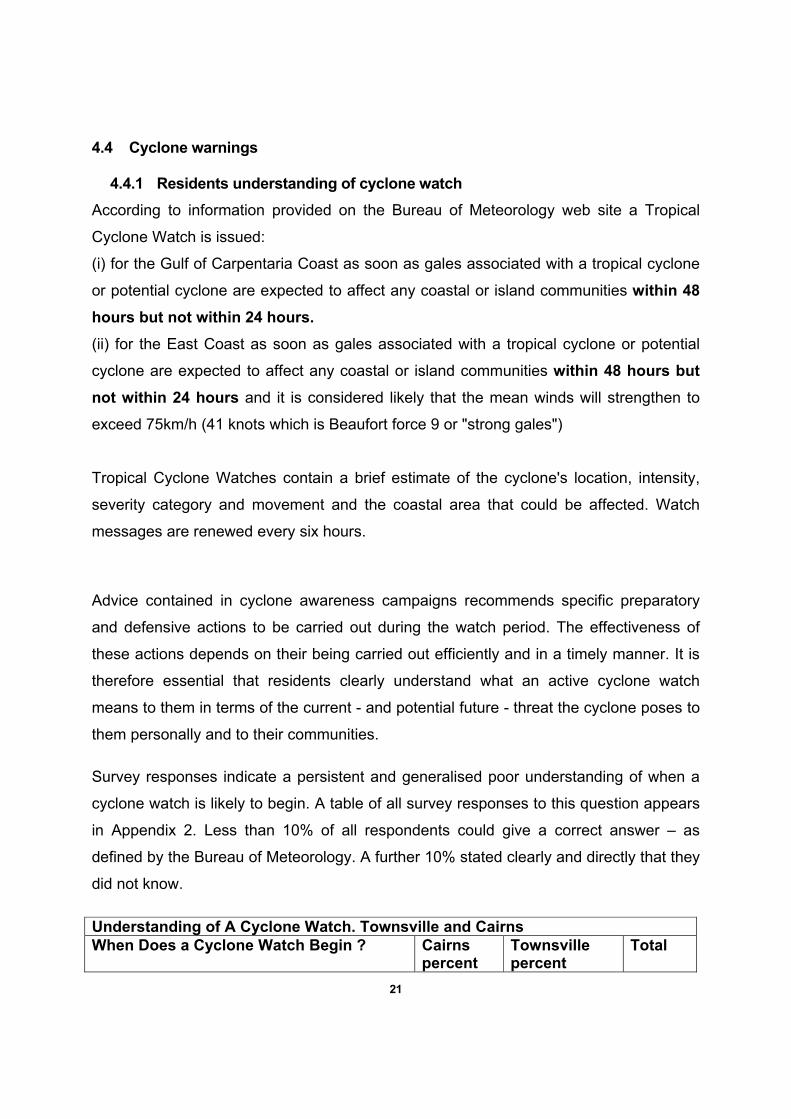
4.4 Cyclone warnings
4.4.1 Residents understanding of cyclone watch According to information provided on the Bureau of Meteorology web site a Tropical
Cyclone Watch is issued:
(i) for the Gulf of Carpentaria Coast as soon as gales associated with a tropical cyclone
or potential cyclone are expected to affect any coastal or island communities within 48 hours but not within 24 hours. (ii) for the East Coast as soon as gales associated with a tropical cyclone or potential
cyclone are expected to affect any coastal or island communities within 48 hours but not within 24 hours and it is considered likely that the mean winds will strengthen to
exceed 75km/h (41 knots which is Beaufort force 9 or "strong gales")
Tropical Cyclone Watches contain a brief estimate of the cyclone's location, intensity,
severity category and movement and the coastal area that could be affected. Watch
messages are renewed every six hours.
Advice contained in cyclone awareness campaigns recommends specific preparatory
and defensive actions to be carried out during the watch period. The effectiveness of
these actions depends on their being carried out efficiently and in a timely manner. It is
therefore essential that residents clearly understand what an active cyclone watch
means to them in terms of the current - and potential future - threat the cyclone poses to
them personally and to their communities.
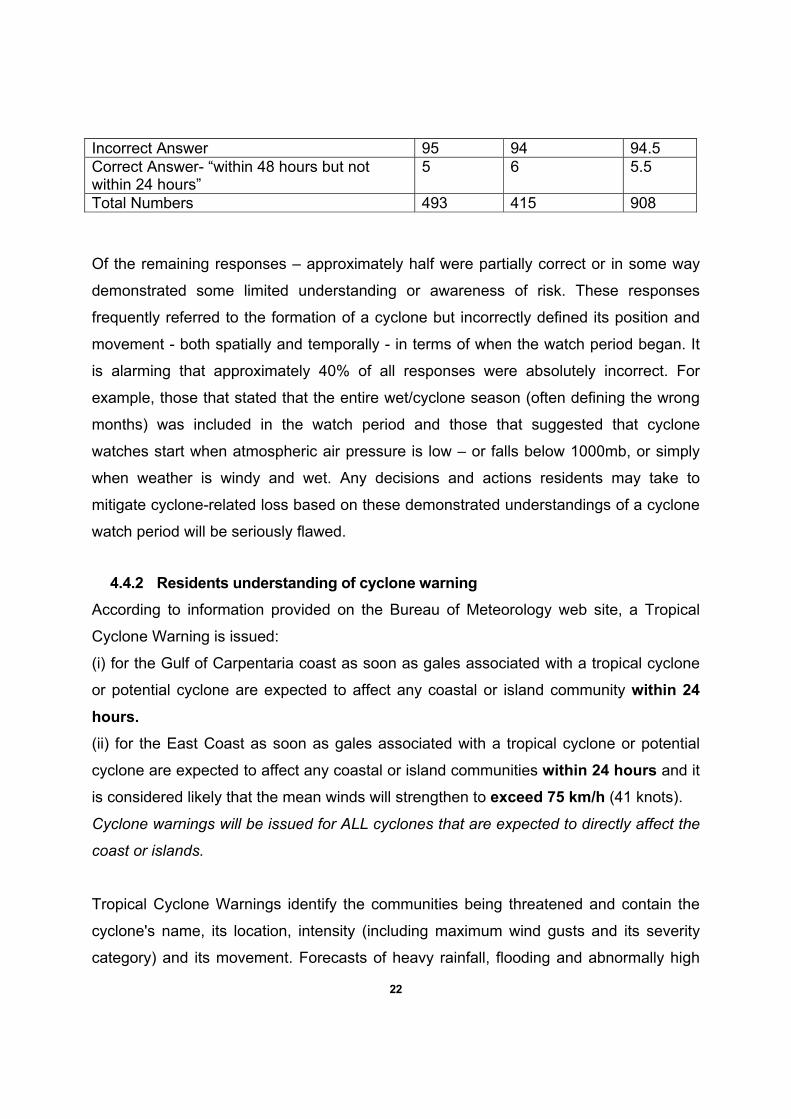
Survey responses indicate a persistent and generalised poor understanding of when a
cyclone watch is likely to begin. A table of all survey responses to this question appears
in Appendix 2. Less than 10% of all respondents could give a correct answer – as
defined by the Bureau of Meteorology. A further 10% stated clearly and directly that they
did not know.
Understanding of A Cyclone Watch. Townsville and Cairns When Does a Cyclone Watch Begin ? Cairns
percent Townsville percent
Total
22
Incorrect Answer 95 94 94.5 Correct Answer- “within 48 hours but not within 24 hours”
5 6 5.5
Total Numbers 493 415 908
Of the remaining responses – approximately half were partially correct or in some way
demonstrated some limited understanding or awareness of risk. These responses
frequently referred to the formation of a cyclone but incorrectly defined its position and
movement - both spatially and temporally - in terms of when the watch period began. It
is alarming that approximately 40% of all responses were absolutely incorrect. For
example, those that stated that the entire wet/cyclone season (often defining the wrong
months) was included in the watch period and those that suggested that cyclone
watches start when atmospheric air pressure is low – or falls below 1000mb, or simply
when weather is windy and wet. Any decisions and actions residents may take to
mitigate cyclone-related loss based on these demonstrated understandings of a cyclone
watch period will be seriously flawed.
4.4.2 Residents understanding of cyclone warning According to information provided on the Bureau of Meteorology web site, a Tropical
Cyclone Warning is issued:
(i) for the Gulf of Carpentaria coast as soon as gales associated with a tropical cyclone
or potential cyclone are expected to affect any coastal or island community within 24
hours. (ii) for the East Coast as soon as gales associated with a tropical cyclone or potential
cyclone are expected to affect any coastal or island communities within 24 hours and it
is considered likely that the mean winds will strengthen to exceed 75 km/h (41 knots).
Cyclone warnings will be issued for ALL cyclones that are expected to directly affect the
coast or islands.
Tropical Cyclone Warnings identify the communities being threatened and contain the
cyclone's name, its location, intensity (including maximum wind gusts and its severity
category) and its movement. Forecasts of heavy rainfall, flooding and abnormally high
23
tides are included when necessary. Communities under threat are also advised to take
precautions necessary to safeguard their lives and property.
Tropical Cyclone Warnings are issued every three hours. When a cyclone is under radar
surveillance close to the coast and poses a severe threat, hourly advices are issued
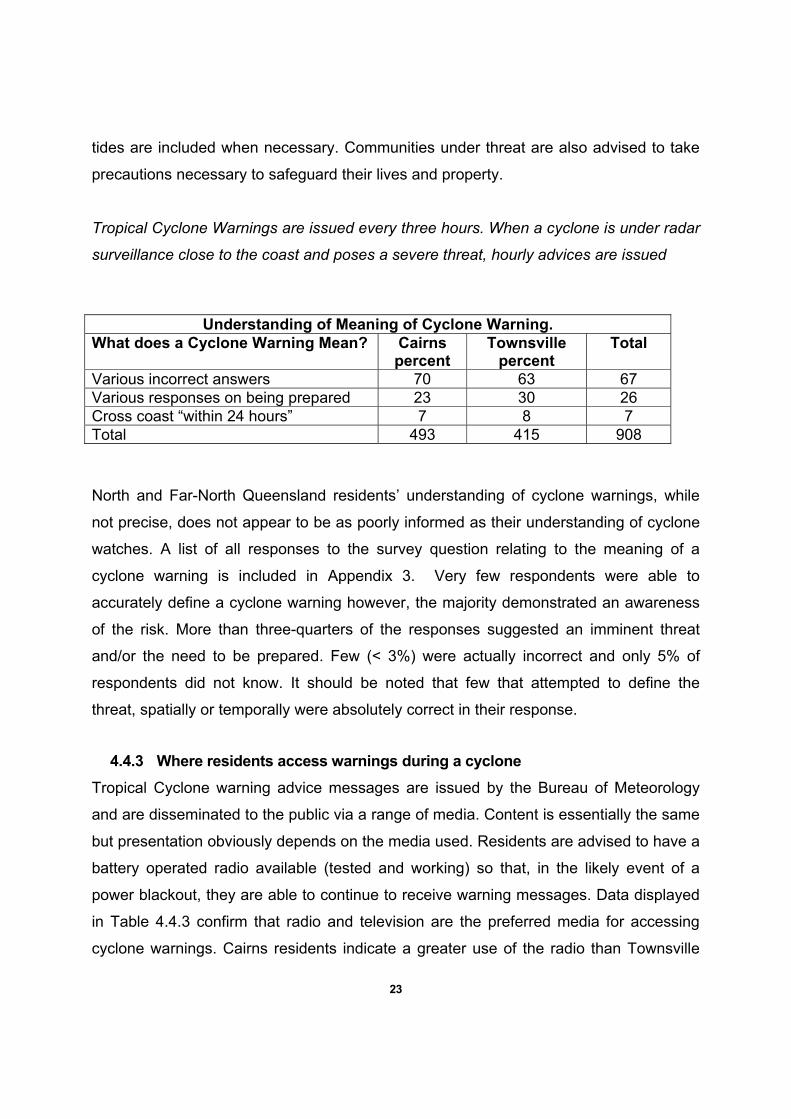
Understanding of Meaning of Cyclone Warning. What does a Cyclone Warning Mean? Cairns
percent Townsville
percent Total
Various incorrect answers 70 63 67 Various responses on being prepared 23 30 26 Cross coast “within 24 hours” 7 8 7 Total 493 415 908
North and Far-North Queensland residents’ understanding of cyclone warnings, while
not precise, does not appear to be as poorly informed as their understanding of cyclone
watches. A list of all responses to the survey question relating to the meaning of a
cyclone warning is included in Appendix 3. Very few respondents were able to
accurately define a cyclone warning however, the majority demonstrated an awareness
of the risk. More than three-quarters of the responses suggested an imminent threat
and/or the need to be prepared. Few (< 3%) were actually incorrect and only 5% of
respondents did not know. It should be noted that few that attempted to define the
threat, spatially or temporally were absolutely correct in their response.
4.4.3 Where residents access warnings during a cyclone Tropical Cyclone warning advice messages are issued by the Bureau of Meteorology
and are disseminated to the public via a range of media. Content is essentially the same
but presentation obviously depends on the media used. Residents are advised to have a
battery operated radio available (tested and working) so that, in the likely event of a
power blackout, they are able to continue to receive warning messages. Data displayed
in Table 4.4.3 confirm that radio and television are the preferred media for accessing
cyclone warnings. Cairns residents indicate a greater use of the radio than Townsville
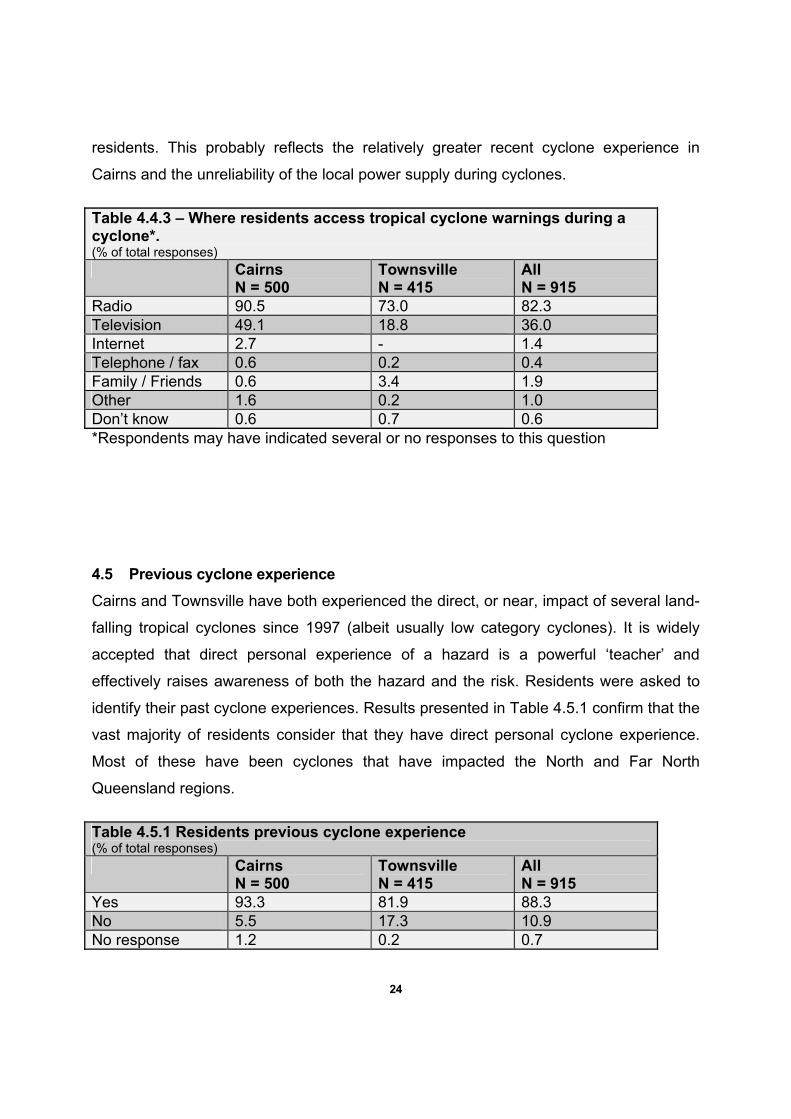
24
residents. This probably reflects the relatively greater recent cyclone experience in
Cairns and the unreliability of the local power supply during cyclones.
Table 4.4.3 – Where residents access tropical cyclone warnings during a cyclone*. (% of total responses) Cairns
N = 500 Townsville N = 415
All N = 915
Radio 90.5 73.0 82.3 Television 49.1 18.8 36.0 Internet 2.7 - 1.4 Telephone / fax 0.6 0.2 0.4 Family / Friends 0.6 3.4 1.9 Other 1.6 0.2 1.0 Don’t know 0.6 0.7 0.6 *Respondents may have indicated several or no responses to this question
4.5 Previous cyclone experience Cairns and Townsville have both experienced the direct, or near, impact of several land-
falling tropical cyclones since 1997 (albeit usually low category cyclones). It is widely
accepted that direct personal experience of a hazard is a powerful ‘teacher’ and
effectively raises awareness of both the hazard and the risk. Residents were asked to
identify their past cyclone experiences. Results presented in Table 4.5.1 confirm that the
vast majority of residents consider that they have direct personal cyclone experience.
Most of these have been cyclones that have impacted the North and Far North
Queensland regions.
Table 4.5.1 Residents previous cyclone experience (% of total responses) Cairns
N = 500 Townsville N = 415
All N = 915
Yes 93.3 81.9 88.3 No 5.5 17.3 10.9 No response 1.2 0.2 0.7

25
For most residents the experience is described as being relatively recent. Many could
not accurately identify cyclones by name and often responded in terms of “…..the one
that was about three or five years ago” Overall the most commonly noted cyclone
experiences were Althea (Townsville 24 December, 1971); Joy (24 December 1990 –
did not make landfall in region); Justin (Cairns 23 March 1997); Rona (Daintree 11
February 1999); Steve (Cairns 27 February 2000) Tessi; (Townsville 3 February 2000);
and Abigail (Cairns 24 February 2001).
26
5 Discussion
5.1 Awareness of Information A range of cyclone awareness information is made available throughout Queensland’s
cyclone prone communities prior to and during the tropical cyclone season. This is
produced by various agencies, including the Bureau of Meteorology, local Councils and
Emergency Services, and presented via a range of media. Information is disseminated
throughout the community electronically via the television, radio and internet; personally
via public meetings; and in printed formats via newspapers, brochures, leaflets etc that
are dropped in letterboxes, picked up from various offices, delivered to households and
inserted in local newspapers.
Survey findings show that in the middle of the cyclone season, around 80% of the
household residents could, in fact, recall having recently seen some information about
cyclones and that approximately two thirds had kept information pamphlets and booklets
in their households. A previous study in Cairns during the 1996 cyclone season found
that less than 50% of residents could recall having received any pre-season cyclone
information (Berry 1996). The current result indicates a level of success in agencies
actually getting the information materials out into the community and shows that they
have been successful in ‘capturing’ community attention. This reflects an increased
effort by the information providers. It is also possible that the direct personal cyclone
experience of many residents since 1996 has raised community awareness of a need
for the information contained in these materials. It is significant however, that while most
residents were aware of having seen information about cyclones, they often had
difficulty in explaining the content and identifying the agency responsible for producing it.
Sources of information that are readily available in many households, and that residents
are apparently not well aware of, include the front section of most local telephone
directories; the internet – on the Bureau of Meteorology web site and many others; and
via various telephone information services.

27
The availability of cyclone awareness materials does not necessarily mean that people
will effectively use the information it contains. Before a person will decide to act on
hazard awareness information it must be understood, believed and internalised so that
the individual personalises the risk. The information must also be consistent with their
personal experience and belief systems. It is also true that education campaigns are
more successful when individuals perceive a need to become more informed and
actively seeks information. (Mileti and Sorensen, 1990)
It is interesting that when residents were asked to identify convenient ways of finding out
more information about weather and weather related terms few identified the sources
that they had previously stated were readily available in their households. More than
80% of respondents said that they had information in pamphlets, newspapers,
magazines and booklets ‘on-hand’ in their households yet less than 10% said that they
would go to these sources if they were actually looking for information. It is significant
that overall almost one third of the residents surveyed considered that the internet would
be a convenient way to find information if they perceived a need to search for more. The
difference between the Cairns and Townsville responses to this question is difficult to
explain. Population samples were shown to be representative and surveyor bias is
unlikely.
5.2 Public meetings The Bureau of Meteorology participates in the organisation and delivery of cyclone
awareness information at public meetings annually, prior to the cyclone season. The
most popular of these is notably the ‘Weather on Water’ series that is presented in all
major coastal centres. The meetings are targeted at specific industry and interest groups
and are run co-jointly with various other agencies such as Queensland Department of
Emergency Services, Queensland Transport, local Councils etc. They are open to the
general public and are widely advertised. While well attended by the targeted population
they are not usually attended by the generally public. This is not unexpected, the
targeted groups have identified specific information needs which are directly addressed
28
in this forum, individuals within the general population may not perceive a need to be
informed on issues and topics discussed in the meetings. The Queensland Department
of Emergency Services is currently evaluating the effectiveness of these meetings in
disseminating cyclone awareness information and early indications are that the
presentations are both well received and well understood (pers coms QDES Feb 2002).
5.3 Plotting Cyclones Cyclone watch and warning advice messages that are graphically presented on the
television include an animated threat map and/or satellite imagery and/or radar imagery.
The message is both spoken and written on the screen. The SEWS (warning siren) may
accompany the warning. Residents are both alerted to the message and given a very
clear ‘picture’ of where they are in relation to the tropical cyclone.
Power blackouts frequently occur during cyclone warning periods, particularly as the
cyclone approaches the coast. When televised warnings are no longer available
residents must rely on an audio delivery of the message only. The position of the centre
of the cyclone is described geographically (latitude and longitude) and by the distance
(in kilometres and hours) from the coast – usually in relation to the direction and speed
in which it is travelling. With no graphical image, residents with poor geographical
knowledge of the coastal townships frequently have difficulty ‘visualising’ where the
cyclone is currently positioned and the extent of the ‘threat’ area. It is therefore essential
that residents plot the cyclone track themselves, preferably using a cyclone tracking
map. These maps are based on the Bureau of Meteorology maps and are generally
widely available throughout the community during the cyclone season. They are
included in many of the pre-season cyclone awareness publications, in the front of most
telephone books and may also be freely picked up at local Council offices, local
branches of the SES, insurance offices, many banks, and regional offices of the Bureau
of Meteorology. It is of some concern that in 40% of Townsville households and 53% of
Cairns households, residents do not use cyclone-tracking maps to plot the position of
tropical cyclones posing a threat to their communities.
29
5.4 Tropical Cyclone awareness Tropical Cyclone awareness campaigns contain recommended preparatory and
defensive actions that will enhance residents safety when tropical cyclones pose a
threat to their households and their communities. The effectiveness of these
recommended actions depends on them being carried out efficiently and in a timely
manner. For residents to achieve this it is essential that they understand the information
and the meaning of the weather terms being used. It is only then that they will accept the
relevance of the information to them personally and perceive the risk accurately.
Throughout the survey it was increasingly apparent that a significant proportion of
residents did not have a good understanding of some of the weather terms relating to
tropical cyclones.
Residents’ understanding of cyclone categories was generally shown to be sound. While
many had difficulty accurately defining the range of categories, 90% were aware that a
low numbered category indicated a lower intensity cyclone and higher numbers
indicated higher intensity cyclones. This result has been consistent throughout previous
community cyclone awareness and post-disaster studies (Berry 1998; 199a; 199b; King
1999; King and Goudie 1998; Anderson-Berry 2000). Confusion about cyclone
categories has previously been shown to be common, and while not directly addressed
in this study it is useful to mention here that earlier studies have found that residents are
frequently unable to accurately identify the categories that describe a ‘Severe Cyclone’
(Categories 3 – 5). This has been largely attributed to the way various television and
radio presenters have announced cyclone warnings – for example Cyclone Steve
(February 2000) was persistently referred to as a ‘severe’ Category 2 cyclone. This
underscores the need for accuracy and consistency in the use of weather terms as they
are presented to the public.
When a tropical cyclone poses a real or potential threat to coastal communities, the
Bureau of Meteorology issues staged tropical cyclone advice messages throughout two
phases. The first is the cyclone watch when residents are alerted, and the second is the
warning phase when the threat is more imminent. Each phase indicates a specific level
30
of threat and particular defensive actions are indicated. Throughout the survey it was
shown that residents generally have a poor understanding of what a cyclone watch
means and when a cyclone watch is likely to begin. This seriously compromises their
ability to prepare themselves and their properties adequately. The meaning of a cyclone
warning is generally better understood. While many residents cannot accurately define a
cyclone warning most are able to demonstrate an awareness of the seriousness of the
situation and the need for them to take action that will enhance the safety of their
households.
The need for residents to have a good understanding of what a cyclone watch and
warning means, and when each is issued has particular relevance for this community.
Various studies carried out over the past six years have clearly identified a trend
whereby residents are increasingly preparing their household less efficiently for the
cyclone season but more efficiently during the warning period (Anderson-Berry 2002)
The potential impact of a tropical cyclone is described throughout the cyclone
awareness campaigns. Residents are generally highly aware of wind and rain effects but
appear to be less aware of storm surge. This situation however, is gradually improving.
In 1996 only half of the community residents could define a storm surge (Berry 1996;
Anderson-Berry 2002). Since then successive cyclone awareness campaigns have
included additional information about storm surge. These campaigns have been
successful in raising community awareness of the phenomenon and its association with
land-falling tropical cyclones but not in accurately explaining the processes. Therefore,
residents perception of the risk is likely to be biased and decisions to take preparatory
and defensive actions are likely to be ill-informed. This interpretation of the survey
findings is supported by the fact that almost three quarters of the survey respondents
could define storm surge in terms of an impact on the level of the sea, but that
approximately the same proportion were unable to describe any actions they may take if
a storm surge was forecast.
31
5.5 Weather forecasts Almost everyone in the community pays some attention to daily weather forecasts.
Residents are often critical of the accuracy of these forecasts but regularly tune into
television and radio weather segments. Many seek more than one source and may
watch the evening weather segment on television and listen to the morning forecasts on
the radio or look in daily newspapers. What decisions people actually make that are
based on the weather forecast information in not known. What is known however, is that
for a short period of time each day almost every adult in the community seeks and
focuses on weather forecast information that is usually televised, presented by a
‘familiar’ weather presenter and supported with animated graphics. This presents an
excellent opportunity to introduce cyclone awareness information simply and concisely.
It was interesting that throughout the survey process respondents frequently mentioned
the local (regional) weather presenter and attributed some of their (correct) responses to
what they had recalled him talking about during the weather segment. The weather
presenter in question is a retired Bureau of Meteorology forecaster. He frequently ‘adds’
information and explains the weather charts that viewers are watching and various
weather terms. He also includes a daily photograph (sent in by viewers) depicting
interesting weather phenomena, and he quickly discusses the images. Judging on the
anecdotal evidence, it appears that his efforts to personalise and localise the weather
message are both popular and successful.
5.6 Cyclone preparation The effectiveness of cyclone awareness campaigns is often measured in terms of the
demonstrated level of community uptake of the recommendations. Throughout the
cyclone awareness literature the need to adequately prepare properties at the beginning
of the cyclone season – ahead of a realised cyclone threat – is emphasised. Survey
responses indicate that approximately two thirds of the community did in fact carry out
some level of seasonal preparation. Care must be taken when interpreting this result as
proof of the success of the awareness campaign however as other North and Far North
Queensland studies have shown that the level of seasonal preparation carried out is
often minimal and decreasing over time (Anderson-Berry 2002). It is likely that many

32
respondents in the current study may have answered the question directly asking if they
had carried out any pre-season clean up of their homes positively, because they
believed this was the answer expected of them. Respondents were not asked to
describe what type of clean-up they had carried out.
33
6 Conclusion and Recommendations Throughout the literature there is consensus that hazard experience together with
hazard education increases hazard awareness and contributes to a true perception of
the hazard risk. Participants in the current study have been exposed to both the
experience of land-falling tropical cyclones and intensified tropical cyclone awareness
campaigns over the past six years. It is difficult therefore, to attribute the relative overall
success of the cyclone awareness campaigns.
Based on the findings of the current study it is possible however, to attribute the relative
success and effectiveness of various methods of delivery of public awareness
information on tropical cyclones to North and Far North Queensland communities. This
study has found residents in both Cairns and Townsville have demonstrated a growing
awareness of some need to be informed about cyclones. They are generally taking
notice of pre-season cyclone awareness campaigns and most keep some level of
cyclone information in their homes, presumably to refer to when and if the need arises.
The most successful media for disseminating pre-cyclone season cyclone awareness
information is the television, followed by brochures and booklets that are short, concise
and attempt to convey a simple and direct message that is usually focussed heavily on
defensive and preparatory actions.
Residents express a need to be well informed about weather and weather events. Daily
weather forecasts are regularly and habitually accessed, primarily via television, radio
and newspapers, and tropical cyclone warnings are most often accessed via radio and
television. For more detailed weather information residents increasingly suggest that the
internet would provide a convenient a convenient source.
34
While residents demonstrate an awareness of the need to become informed and a
willingness to access various sources of weather information many remain poorly
informed and are often confused about the meaning of some of the information they
access. In order to improve this situation and based on the findings of this report the
following recommendations are included for consideration.
Brochures, leaflets and booklets are an effective mode of delivery for cyclone
awareness information. The agency/ies using this media to provide the general public
with focussed information should clearly identified. Where possible information should
be localised and based on identified community needs.
All cyclone awareness information should include an emphasis on identifying and
explaining risk - in addition to recommending preparatory and defensive actions.
Public meetings are successful in raising tropical cyclone awareness when prepared
and presented to targeted industry and community sectors - but they are not a
successful vehicle for educating the general public. They should therefore be supported
and expanded in terms of identified target audiences.
Cyclone awareness campaigns should include a more detailed explanation of the use
and relevance of cyclone tracking maps
Spoken tropical cyclone warning messages (both on radio and television) should aim to
include a more detailed description of the threatened area – this would require
enhancing at a local level and using local knowledge of the coast-line and familiar
landmarks.
The use and meaning of weather information, weather terms and warning advice
messages should be consistent across all media and modes of delivery.
Better use should be made of locally produced televised weather forecast sessions to
introduce and explain weather terms.
The amount and quality of weather information available on the internet should be
increased to meet community expectations.
35
Cyclone awareness brochures, that are likely to be kept ‘on-hand’ in community
households should include a short directory of sources of further information – including
the internet – for the benefit of residents who may be encouraged to search for further
detail and depth of information.
The widespread community confusion and misunderstanding about the tropical cyclone
watch and warning periods should be immediately addressed. This could be achieved
with an intensified cyclone awareness campaign. Given that residents are increasingly
leaving much of their cyclone preparation until the warning phase, it may be useful to
consider a change of warning terminology eliminating the ‘watch’ and extending the
warning period with various levels of warning.
All modes and methods of delivering tropical cyclone awareness information to the
Queensland public that were investigated throughout this study were shown to enjoy
some degree of success. Most usefully imparted information relating to the hazard itself
and a range of preventative and defensive actions that would mitigate loss. Few
however were successful in ‘delivering the message’ – that is – they did not usually
explain the risk well nor did they encourage residents to seek further information. Given
the range of information needs within the community and the diversity of the general
population the continued enhancement and support of a wide range of methods of
delivering cyclone awareness is indicated.
7 Recommendations
Residents remain poorly informed and are often confused about the meaning of some of
the information they access. In order to improve this situation the following
recommendations are made.
1) Brochures, leaflets and booklets are an effective mode of delivery for cyclone awareness information. Where possible information should be localised and based on identified community needs. 2) All cyclone awareness information should include an emphasis on identifying and explaining risk in addition to recommending preparatory and defensive actions.
36
3) Public meetings should therefore be supported and expanded in terms of identified target audiences. 4) Cyclone awareness campaigns should include a more detailed explanation of the use and relevance of cyclone tracking maps 5) Spoken tropical cyclone warning messages should aim to include a more detailed description of the threatened area using local knowledge of the coast-line and familiar landmarks. 6) The use and meaning of weather information, weather terms and warning advice messages should be consistent across all media and modes of delivery. 7) Better use should be made of locally produced televised weather forecast sessions to introduce and explain weather terms. 8) The amount and quality of weather information available on the internet should be increased to meet community expectations. 9) Cyclone awareness brochures, that are likely to be kept ‘on-hand’ in community households should include a short directory of sources of further information. 10) Widespread confusion and misunderstanding about the tropical cyclone watch and warning periods should be immediately addressed.
8 References
Anderson-Berry L. J. 2002 Community Vulnerability to Tropical Cyclones – Cairns 1996-
2000 In press Natural Hazards – Journal of the International Society for the Prevention
and Mitigation of Natural Hazards, Kluwer Academic Publications, Netherlands
Anderson-Berry L. J., 2000 Cyclone Rosita, April 20, 2000 Broome W.A. Post Disaster
Report, Centre for Disaster Studies, James Cook University, Cairns
37
Australian Bureau of Statistics (ABS), 1998a, CData 96 (Final Release), CD-ROM
databases from the 1996 national census, Australian Bureau of Statistics, Canberra.
Australian Bureau of Statistics (ABS), 1998b, 1996 Census of Population and Housing:
Socio-Economic Indexes for Areas, Information paper 2039.0, Australian Bureau of
Statistics, Canberra.
Berry L. J. 1996, Community Vulnerability to Tropical Cyclones and Associated Storm
Surges Annual report #1 to September 1996 James Cook University Centre for Disaster
Studies Tropical Cyclone Coastal Impacts Program, Cyclone and Storm Surge Impact in
Cairns 1995-6 Research Reports to Queensland Department of Emergency Services
November 1996
Berry L. J 1998. 1998 Gulf Rivers Flood - Report prepared for Emergency Management
Australia, JCU Centre for Disaster Studies April 1998
Berry L. J 1999a Cyclone Rona February 11, 1999 – Evacuation of Caravonica and
Lake Placid Report, James Cook University Centre for Disaster Studies, Cairns.
Berry L. J 1999b Cyclone Rona February 11, 1999 – Mossman / Port Douglas Warnings
Report, James Cook University Centre for Disaster Studies, Cairns. King, D., 1999, Townsville Floods 1999 – Report prepared for EMA Centre for Disaster
Studies James Cook University, Cairns.
King, D and Goudie, D., 1998, “Breaking through the disbelief: The March 1997 floods at
Cloncurry – Even the Duck Swam Away” The Australian Journal of Emergency
Management, Vol 12, No 4: Pp 29-33.
Mileti, D.S. and Sorensen, J.H. 1990. Communication of Emergency Public Warnings: A
Social Science Perspective and State-of-the-Art Assessment, Federal Emergency
Management Agency, New York.

38
39
9 Appendices
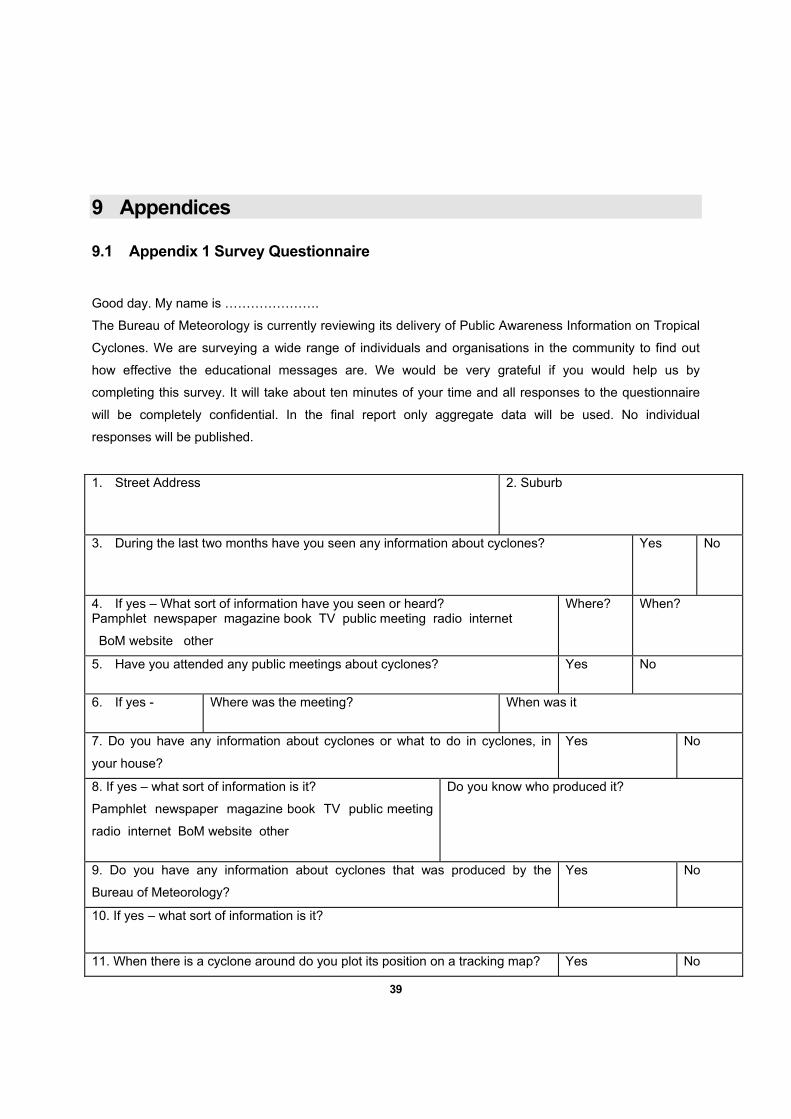
9.1 Appendix 1 Survey Questionnaire Good day. My name is ………………….
The Bureau of Meteorology is currently reviewing its delivery of Public Awareness Information on Tropical
Cyclones. We are surveying a wide range of individuals and organisations in the community to find out
how effective the educational messages are. We would be very grateful if you would help us by
completing this survey. It will take about ten minutes of your time and all responses to the questionnaire
will be completely confidential. In the final report only aggregate data will be used. No individual
responses will be published.
1. Street Address
2. Suburb
3. During the last two months have you seen any information about cyclones?
Yes No
4. If yes – What sort of information have you seen or heard? Pamphlet newspaper magazine book TV public meeting radio internet
BoM website other
Where? When?
5. Have you attended any public meetings about cyclones?
Yes No
6. If yes -
Where was the meeting? When was it
7. Do you have any information about cyclones or what to do in cyclones, in
your house?
Yes No
8. If yes – what sort of information is it?
Pamphlet newspaper magazine book TV public meeting
radio internet BoM website other
Do you know who produced it?
9. Do you have any information about cyclones that was produced by the
Bureau of Meteorology?
Yes No
10. If yes – what sort of information is it?
11. When there is a cyclone around do you plot its position on a tracking map? Yes No
40
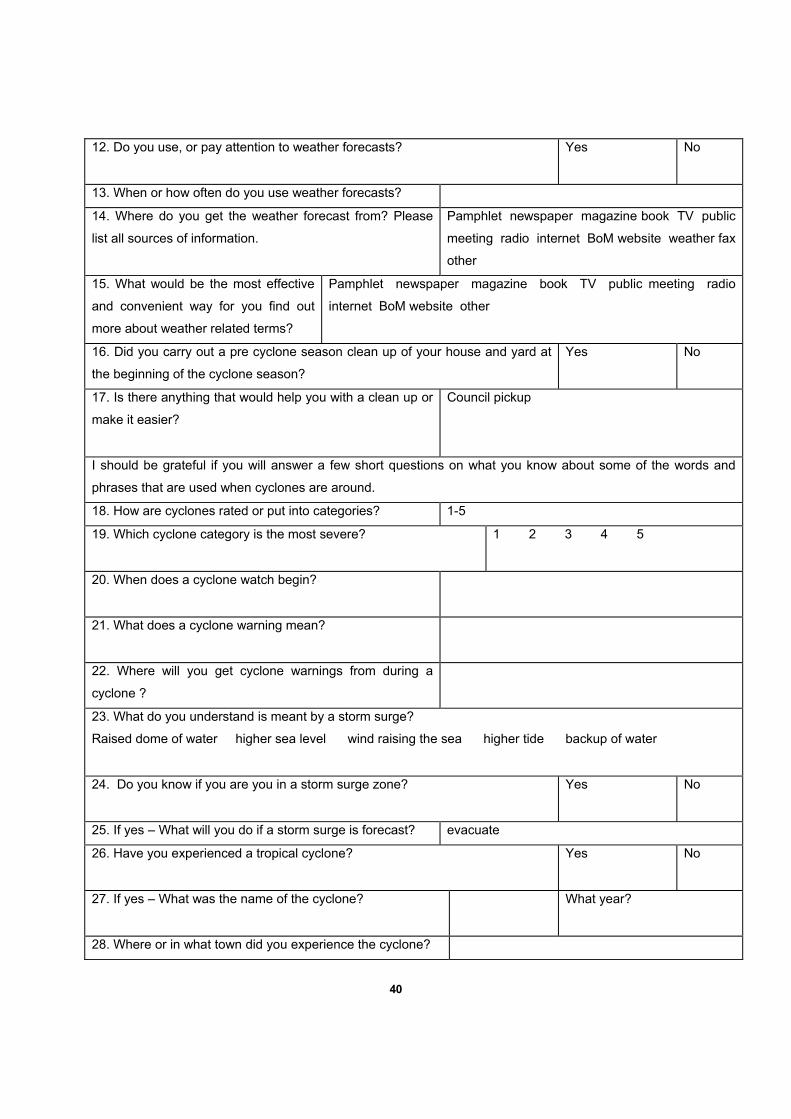
12. Do you use, or pay attention to weather forecasts?
Yes No
13. When or how often do you use weather forecasts?
14. Where do you get the weather forecast from? Please
list all sources of information.
Pamphlet newspaper magazine book TV public
meeting radio internet BoM website weather fax
other
15. What would be the most effective
and convenient way for you find out
more about weather related terms?
Pamphlet newspaper magazine book TV public meeting radio
internet BoM website other
16. Did you carry out a pre cyclone season clean up of your house and yard at
the beginning of the cyclone season?
Yes No
17. Is there anything that would help you with a clean up or
make it easier?
Council pickup
I should be grateful if you will answer a few short questions on what you know about some of the words and
phrases that are used when cyclones are around.
18. How are cyclones rated or put into categories? 1-5
19. Which cyclone category is the most severe?
1 2 3 4 5
20. When does a cyclone watch begin?
21. What does a cyclone warning mean?
22. Where will you get cyclone warnings from during a
cyclone ?
23. What do you understand is meant by a storm surge?
Raised dome of water higher sea level wind raising the sea higher tide backup of water
24. Do you know if you are you in a storm surge zone?
Yes No
25. If yes – What will you do if a storm surge is forecast? evacuate
26. Have you experienced a tropical cyclone?
Yes No
27. If yes – What was the name of the cyclone?
What year?
28. Where or in what town did you experience the cyclone?
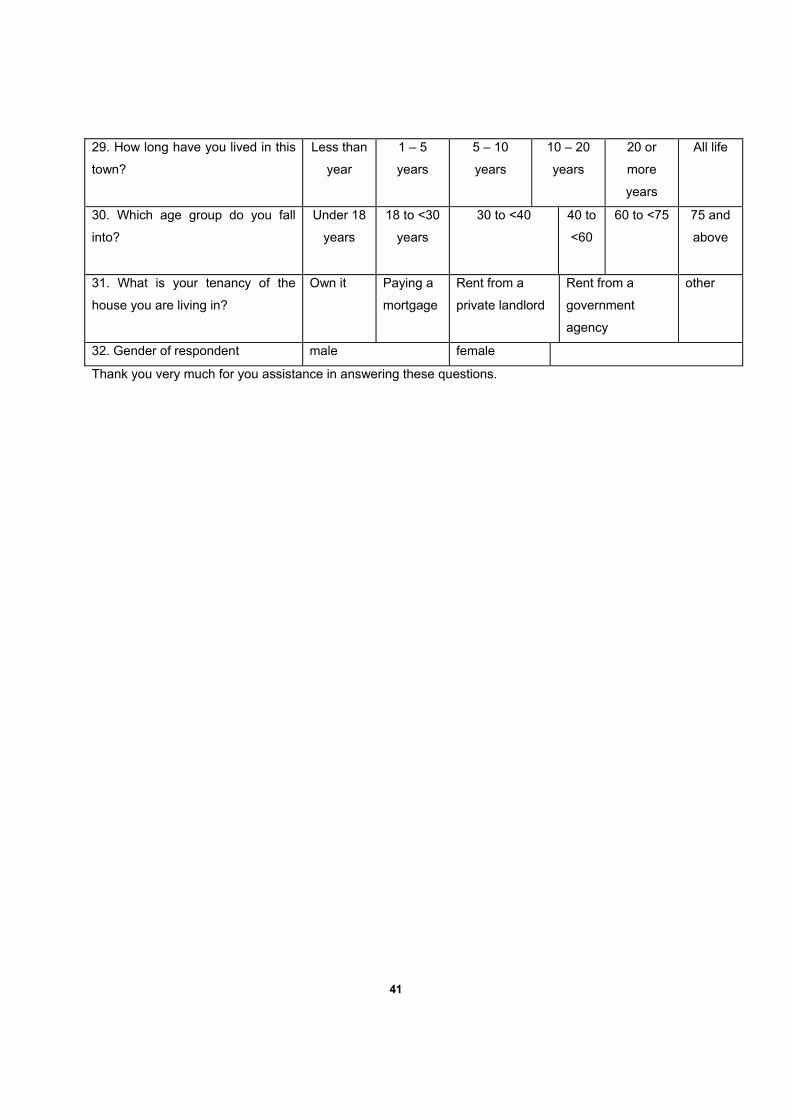
41
29. How long have you lived in this
town?
Less than
year
1 – 5
years
5 – 10
years
10 – 20
years
20 or
more
years
All life
30. Which age group do you fall
into?
Under 18
years
18 to <30
years
30 to <40 40 to
<60
60 to <75 75 and
above
31. What is your tenancy of the
house you are living in?
Own it Paying a
mortgage
Rent from a
private landlord
Rent from a
government
agency
other
32. Gender of respondent male female
Thank you very much for you assistance in answering these questions.
42
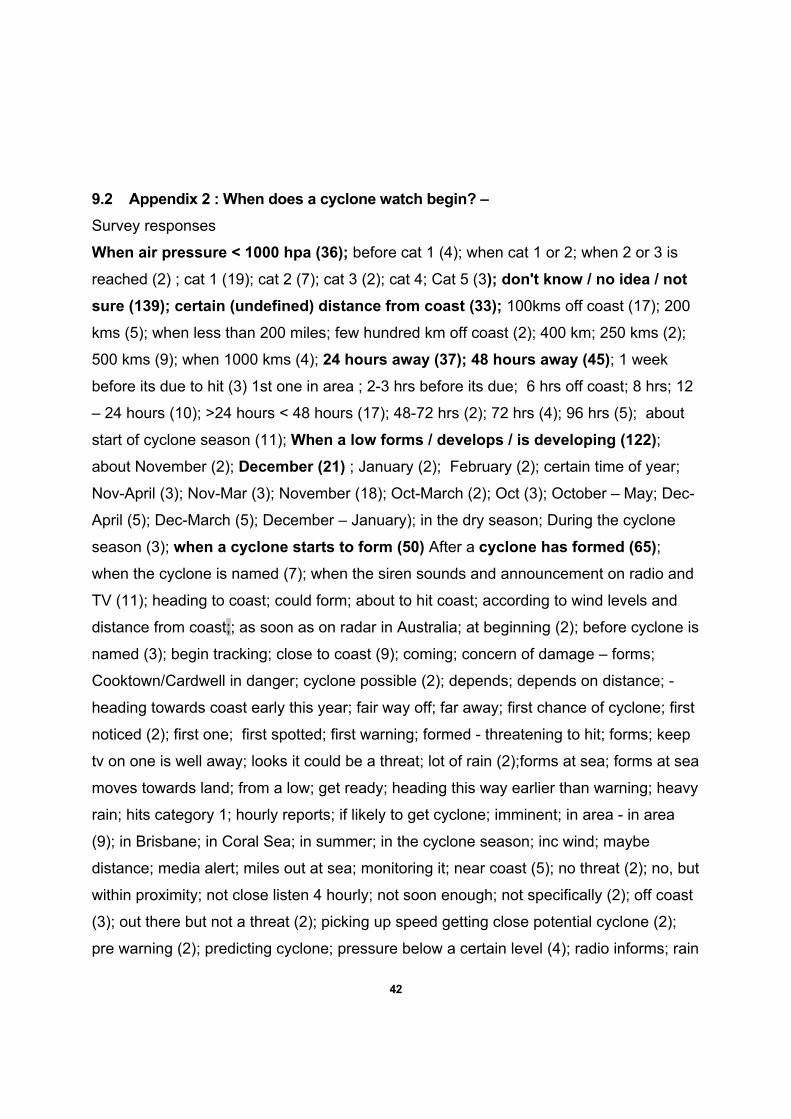
9.2 Appendix 2 : When does a cyclone watch begin? – Survey responses
When air pressure < 1000 hpa (36); before cat 1 (4); when cat 1 or 2; when 2 or 3 is
reached (2) ; cat 1 (19); cat 2 (7); cat 3 (2); cat 4; Cat 5 (3); don't know / no idea / not sure (139); certain (undefined) distance from coast (33); 100kms off coast (17); 200
kms (5); when less than 200 miles; few hundred km off coast (2); 400 km; 250 kms (2);
500 kms (9); when 1000 kms (4); 24 hours away (37); 48 hours away (45); 1 week
before its due to hit (3) 1st one in area ; 2-3 hrs before its due; 6 hrs off coast; 8 hrs; 12
– 24 hours (10); >24 hours < 48 hours (17); 48-72 hrs (2); 72 hrs (4); 96 hrs (5); about
start of cyclone season (11); When a low forms / develops / is developing (122); about November (2); December (21) ; January (2); February (2); certain time of year;
Nov-April (3); Nov-Mar (3); November (18); Oct-March (2); Oct (3); October – May; Dec-
April (5); Dec-March (5); December – January); in the dry season; During the cyclone
season (3); when a cyclone starts to form (50) After a cyclone has formed (65); when the cyclone is named (7); when the siren sounds and announcement on radio and
TV (11); heading to coast; could form; about to hit coast; according to wind levels and
distance from coast;; as soon as on radar in Australia; at beginning (2); before cyclone is
named (3); begin tracking; close to coast (9); coming; concern of damage – forms;
Cooktown/Cardwell in danger; cyclone possible (2); depends; depends on distance; -
heading towards coast early this year; fair way off; far away; first chance of cyclone; first
noticed (2); first one; first spotted; first warning; formed - threatening to hit; forms; keep
tv on one is well away; looks it could be a threat; lot of rain (2);forms at sea; forms at sea
moves towards land; from a low; get ready; heading this way earlier than warning; heavy
rain; hits category 1; hourly reports; if likely to get cyclone; imminent; in area - in area
(9); in Brisbane; in Coral Sea; in summer; in the cyclone season; inc wind; maybe
distance; media alert; miles out at sea; monitoring it; near coast (5); no threat (2); no, but
within proximity; not close listen 4 hourly; not soon enough; not specifically (2); off coast
(3); out there but not a threat (2); picking up speed getting close potential cyclone (2);
pre warning (2); predicting cyclone; pressure below a certain level (4); radio informs; rain
43
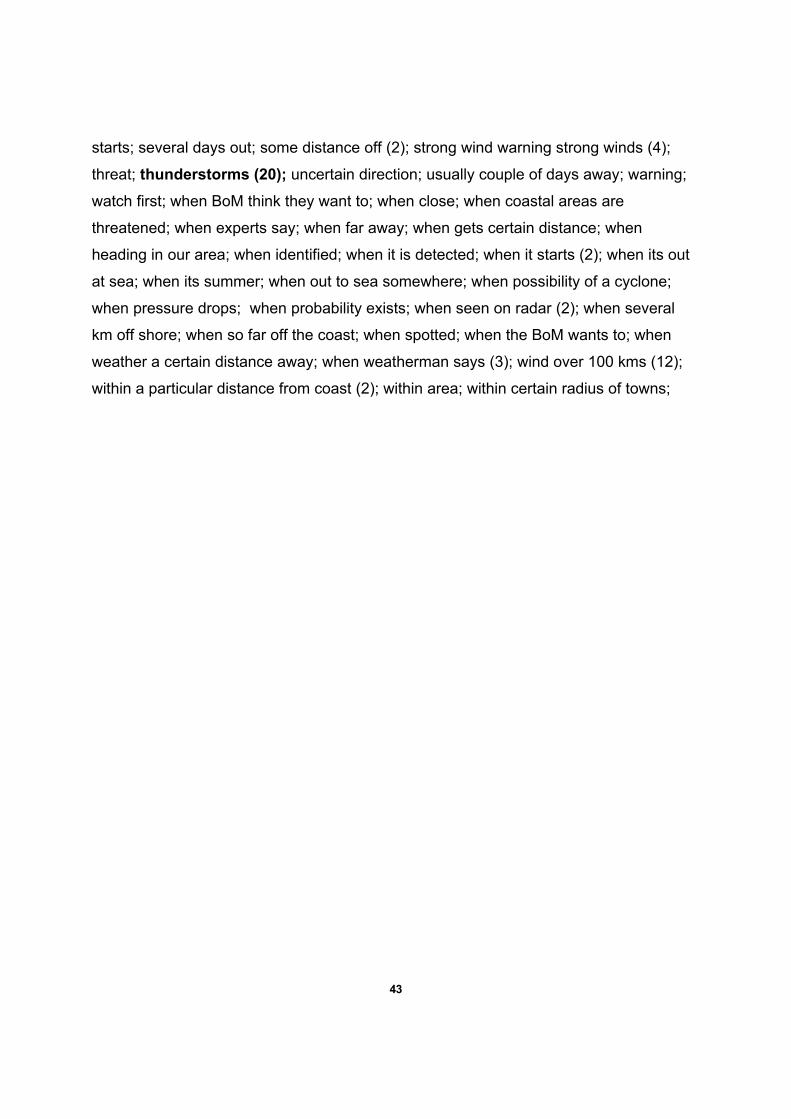
starts; several days out; some distance off (2); strong wind warning strong winds (4);
threat; thunderstorms (20); uncertain direction; usually couple of days away; warning;
watch first; when BoM think they want to; when close; when coastal areas are
threatened; when experts say; when far away; when gets certain distance; when
heading in our area; when identified; when it is detected; when it starts (2); when its out
at sea; when its summer; when out to sea somewhere; when possibility of a cyclone;
when pressure drops; when probability exists; when seen on radar (2); when several
km off shore; when so far off the coast; when spotted; when the BoM wants to; when
weather a certain distance away; when weatherman says (3); wind over 100 kms (12);
within a particular distance from coast (2); within area; within certain radius of towns;
44
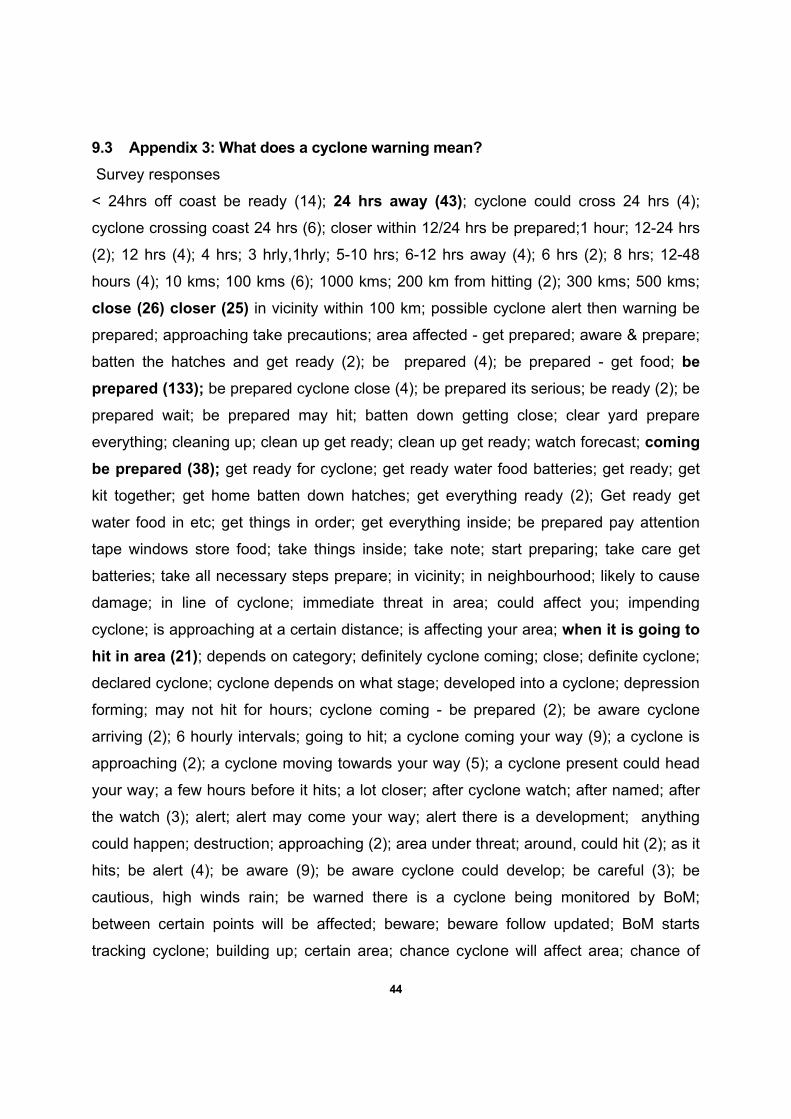
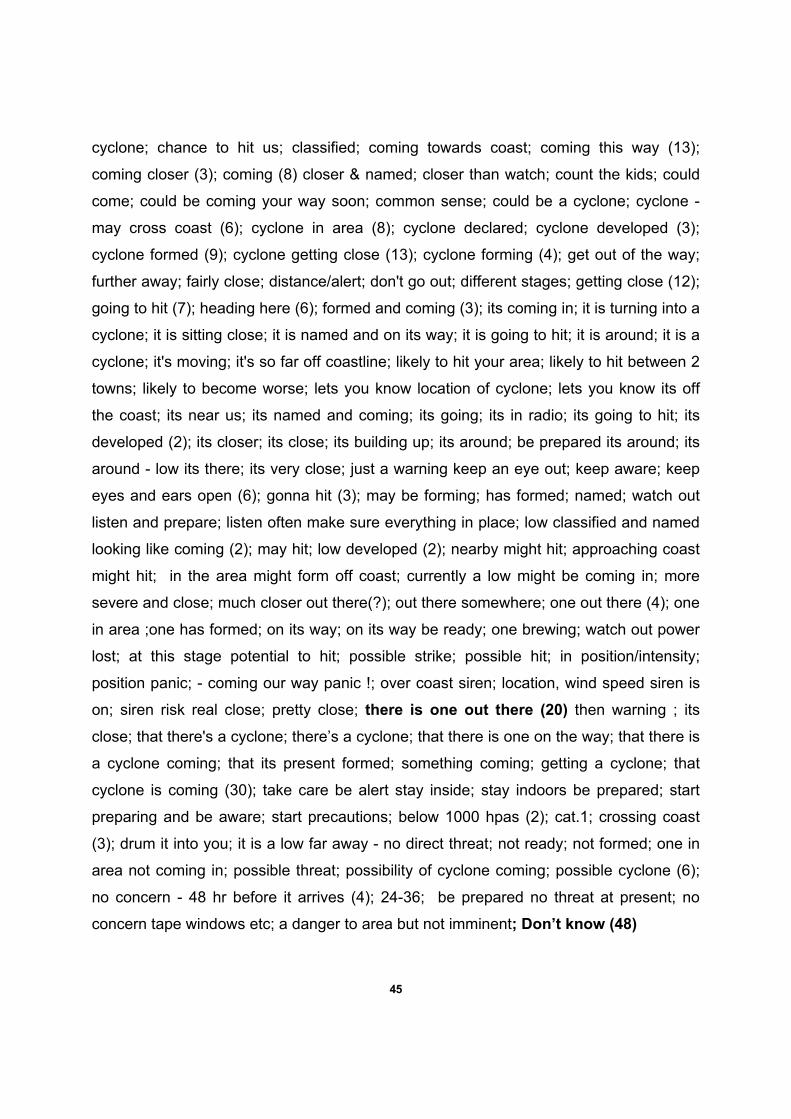
9.3 Appendix 3: What does a cyclone warning mean? Survey responses
< 24hrs off coast be ready (14); 24 hrs away (43); cyclone could cross 24 hrs (4);
cyclone crossing coast 24 hrs (6); closer within 12/24 hrs be prepared;1 hour; 12-24 hrs
(2); 12 hrs (4); 4 hrs; 3 hrly,1hrly; 5-10 hrs; 6-12 hrs away (4); 6 hrs (2); 8 hrs; 12-48
hours (4); 10 kms; 100 kms (6); 1000 kms; 200 km from hitting (2); 300 kms; 500 kms;
close (26) closer (25) in vicinity within 100 km; possible cyclone alert then warning be
prepared; approaching take precautions; area affected - get prepared; aware & prepare;
batten the hatches and get ready (2); be prepared (4); be prepared - get food; be prepared (133); be prepared cyclone close (4); be prepared its serious; be ready (2); be
prepared wait; be prepared may hit; batten down getting close; clear yard prepare
everything; cleaning up; clean up get ready; clean up get ready; watch forecast; coming be prepared (38); get ready for cyclone; get ready water food batteries; get ready; get
kit together; get home batten down hatches; get everything ready (2); Get ready get
water food in etc; get things in order; get everything inside; be prepared pay attention
tape windows store food; take things inside; take note; start preparing; take care get
batteries; take all necessary steps prepare; in vicinity; in neighbourhood; likely to cause
damage; in line of cyclone; immediate threat in area; could affect you; impending
cyclone; is approaching at a certain distance; is affecting your area; when it is going to hit in area (21); depends on category; definitely cyclone coming; close; definite cyclone;
declared cyclone; cyclone depends on what stage; developed into a cyclone; depression
forming; may not hit for hours; cyclone coming - be prepared (2); be aware cyclone
arriving (2); 6 hourly intervals; going to hit; a cyclone coming your way (9); a cyclone is
approaching (2); a cyclone moving towards your way (5); a cyclone present could head
your way; a few hours before it hits; a lot closer; after cyclone watch; after named; after
the watch (3); alert; alert may come your way; alert there is a development; anything
could happen; destruction; approaching (2); area under threat; around, could hit (2); as it
hits; be alert (4); be aware (9); be aware cyclone could develop; be careful (3); be
cautious, high winds rain; be warned there is a cyclone being monitored by BoM;
between certain points will be affected; beware; beware follow updated; BoM starts
tracking cyclone; building up; certain area; chance cyclone will affect area; chance of
45
cyclone; chance to hit us; classified; coming towards coast; coming this way (13);
coming closer (3); coming (8) closer & named; closer than watch; count the kids; could
come; could be coming your way soon; common sense; could be a cyclone; cyclone -
may cross coast (6); cyclone in area (8); cyclone declared; cyclone developed (3);
cyclone formed (9); cyclone getting close (13); cyclone forming (4); get out of the way;
further away; fairly close; distance/alert; don't go out; different stages; getting close (12);
going to hit (7); heading here (6); formed and coming (3); its coming in; it is turning into a
cyclone; it is sitting close; it is named and on its way; it is going to hit; it is around; it is a
cyclone; it's moving; it's so far off coastline; likely to hit your area; likely to hit between 2
towns; likely to become worse; lets you know location of cyclone; lets you know its off
the coast; its near us; its named and coming; its going; its in radio; its going to hit; its
developed (2); its closer; its close; its building up; its around; be prepared its around; its
around - low its there; its very close; just a warning keep an eye out; keep aware; keep
eyes and ears open (6); gonna hit (3); may be forming; has formed; named; watch out
listen and prepare; listen often make sure everything in place; low classified and named
looking like coming (2); may hit; low developed (2); nearby might hit; approaching coast
might hit; in the area might form off coast; currently a low might be coming in; more
severe and close; much closer out there(?); out there somewhere; one out there (4); one
in area ;one has formed; on its way; on its way be ready; one brewing; watch out power
lost; at this stage potential to hit; possible strike; possible hit; in position/intensity;
position panic; - coming our way panic !; over coast siren; location, wind speed siren is
on; siren risk real close; pretty close; there is one out there (20) then warning ; its
close; that there's a cyclone; there’s a cyclone; that there is one on the way; that there is
a cyclone coming; that its present formed; something coming; getting a cyclone; that
cyclone is coming (30); take care be alert stay inside; stay indoors be prepared; start
preparing and be aware; start precautions; below 1000 hpas (2); cat.1; crossing coast
(3); drum it into you; it is a low far away - no direct threat; not ready; not formed; one in
area not coming in; possible threat; possibility of cyclone coming; possible cyclone (6);
no concern - 48 hr before it arrives (4); 24-36; be prepared no threat at present; no
concern tape windows etc; a danger to area but not imminent; Don’t know (48)