Embed Size (px)
Citation preview
Assessment of Styrene Emission Controlsfor FRP/C and Boat Building Industries
FINAL REPORT
by:Emery J. Kong, Mark A. Bahner, and Sonji L. Turner
Research Triangle InstituteP.O. Box 12194
Research Triangle Park, NC 27709
EPA Contract 68-D1-0118, W.A. 156
EPA Project Officer: Norman KaplanAir Pollution Prevention and Control Division
National Risk Management Research LaboratoryU.S. Environmental Protection Agency
Research Triangle Park, NC 27711
Prepared for
U.S. Environmental Protection AgencyOffice of Research and Development
Washington, D.C. 20460
ii
Abstract
Styrene emissions from open molding processes in fiberglass-reinforcedplastics/composites (FRP/C) and fiberglass boat building facilities are typically diluted bygeneral ventilation to ensure that worker exposures do not exceed Occupational Safety andHealth Administration (OSHA) standards. This practice tends to increase the potential cost tothe facility of add-on controls. Furthermore, add-on styrene emission controls are currently notgenerally mandated by regulations. Therefore, emission controls are infrequently used in theseindustries at present.
To provide technical and cost information to companies that might choose emissioncontrols to reduce styrene emissions, several conventional and novel emission controltechnologies that have been used to treat styrene emissions in the United States and abroad and afew emerging technologies were examined. Control costs for these conventional and noveltechnologies were developed and compared for three hypothetical plant sizes.
The results of this cost analysis indicate that increasing styrene concentration (i.e.,lowering flow rate) of the exhaust streams can significantly reduce cost per ton of styreneremoved for all technologies examined, because capital and operating costs increase withincreasing flow rate. Therefore, a company should evaluate methods to increase concentrations(i.e., lower flow rates) of the exhaust stream before considering any add-on control devices. This report also presents air flow management practices and enclosure concepts that could beused to create a concentrated exhaust stream while maintaining a safe working environment.
iii
Contents
Abstract . . . . . . . . . . . . . . . . . . . . . . . . . . . . . . . . . . . . . . . . . . . . . . . . . . . . . . . . . . . . . . . . . . . . iiFigures . . . . . . . . . . . . . . . . . . . . . . . . . . . . . . . . . . . . . . . . . . . . . . . . . . . . . . . . . . . . . . . . . . . . . . vTables . . . . . . . . . . . . . . . . . . . . . . . . . . . . . . . . . . . . . . . . . . . . . . . . . . . . . . . . . . . . . . . . . . . . . . viAcronyms and Abbreviations .. . . . . . . . . . . . . . . . . . . . . . . . . . . . . . . . . . . . . . . . . . . . . . . . . . vii
Chapter 1 Introduction . . . . . . . . . . . . . . . . . . . . . . . . . . . . . . . . . . . . . . . . . . . . . . . . . . . . . . 1
Chapter 2 Background . . . . . . . . . . . . . . . . . . . . . . . . . . . . . . . . . . . . . . . . . . . . . . . . . . . . . . 2References . . . . . . . . . . . . . . . . . . . . . . . . . . . . . . . . . . . . . . . . . . . . . . . . . . . . . . . 3
Chapter 3 Conclusions and Recommendations . . . . . . . . . . . . . . . . . . . . . . . . . . . . . . . . . . . 4
Chapter 4 Pollution Control Technologies . . . . . . . . . . . . . . . . . . . . . . . . . . . . . . . . . . . . . . . 54.1 Conventional Technologies . . . . . . . . . . . . . . . . . . . . . . . . . . . . . . . . . . . . . . . . . . 5
4.1.1 Combustion Technology . . . . . . . . . . . . . . . . . . . . . . . . . . . . . . . . . . . . . . 54.1.1.1 Thermal Oxidation .. . . . . . . . . . . . . . . . . . . . . . . . . . . . . . . . . . . . 54.1.1.2 Catalytic Oxidation . . . . . . . . . . . . . . . . . . . . . . . . . . . . . . . . . . . 10
4.1.2 Adsorption Technology . . . . . . . . . . . . . . . . . . . . . . . . . . . . . . . . . . . . . . 124.1.2.1 Fixed-Bed Carbon Adsorption . . . . . . . . . . . . . . . . . . . . . . . . . . . 124.1.2.2 Fluidized-Bed Carbon Adsorption . . . . . . . . . . . . . . . . . . . . . . . . 134.1.2.3 Activated Carbon Filter Panels . . . . . . . . . . . . . . . . . . . . . . . . . . 14
4.1.3 Condensation . . . . . . . . . . . . . . . . . . . . . . . . . . . . . . . . . . . . . . . . . . . . . . 154.2 Novel Technologies . . . . . . . . . . . . . . . . . . . . . . . . . . . . . . . . . . . . . . . . . . . . . . . 17
4.2.1 Preconcentration/Recovery/Oxidation Hybrid Systems . . . . . . . . . . . . . 174.2.1.1 MIAB System .. . . . . . . . . . . . . . . . . . . . . . . . . . . . . . . . . . . . . . . 194.2.1.2 Thermatrix PADRE® System . . . . . . . . . . . . . . . . . . . . . . . . . . . 204.2.1.3 Polyad System . . . . . . . . . . . . . . . . . . . . . . . . . . . . . . . . . . . . . . 23™
4.2.1.4 Rotary Concentrator System . . . . . . . . . . . . . . . . . . . . . . . . . . . . 274.2.1.5 Fluidized-Bed Preconcentration System . . . . . . . . . . . . . . . . . . . 31
4.2.2 Biofiltration . . . . . . . . . . . . . . . . . . . . . . . . . . . . . . . . . . . . . . . . . . . . . . . 344.2.2.1 Biofiltration System . . . . . . . . . . . . . . . . . . . . . . . . . . . . . . . . . . . 344.2.2.2 Biotrickling Filter System . . . . . . . . . . . . . . . . . . . . . . . . . . . . . . 37
4.2.3 Ultraviolet/Oxidation Technology . . . . . . . . . . . . . . . . . . . . . . . . . . . . . . 394.3 Emerging Technologies . . . . . . . . . . . . . . . . . . . . . . . . . . . . . . . . . . . . . . . . . . . . 41
4.3.1 Membrane Technology . . . . . . . . . . . . . . . . . . . . . . . . . . . . . . . . . . . . . . 424.3.2 Photocatalytic Oxidation . . . . . . . . . . . . . . . . . . . . . . . . . . . . . . . . . . . . . 48References . . . . . . . . . . . . . . . . . . . . . . . . . . . . . . . . . . . . . . . . . . . . . . . . . . . . . . 50
Chapter 5 Control Cost Analyses . . . . . . . . . . . . . . . . . . . . . . . . . . . . . . . . . . . . . . . . . . . . . 55References . . . . . . . . . . . . . . . . . . . . . . . . . . . . . . . . . . . . . . . . . . . . . . . . . . . . . . 65
iv
Contents (continued)
Chapter 6 Ventilation and Emission Capture Systems in the FRP/C Facilities . . . . . . . . . . 676.1 Regulations Governing General Ventilation Practices . . . . . . . . . . . . . . . . . . . . 676.2 Local Air Flow Management . . . . . . . . . . . . . . . . . . . . . . . . . . . . . . . . . . . . . . . . 696.3 Spray Booth and Modifications . . . . . . . . . . . . . . . . . . . . . . . . . . . . . . . . . . . . . . 71
6.3.1 Recirculation . . . . . . . . . . . . . . . . . . . . . . . . . . . . . . . . . . . . . . . . . . . . . . 726.3.2 Split-Flow Spray Booths . . . . . . . . . . . . . . . . . . . . . . . . . . . . . . . . . . . . . 766.3.3 Other Spray Booth Design Modifications . . . . . . . . . . . . . . . . . . . . . . . . 78
6.4 Enclosures and Total Enclosures . . . . . . . . . . . . . . . . . . . . . . . . . . . . . . . . . . . . . 82References . . . . . . . . . . . . . . . . . . . . . . . . . . . . . . . . . . . . . . . . . . . . . . . . . . . . . . 87
Appendix A Development of Cost Functions for Styrene Emission Control Technologies . A-1References . . . . . . . . . . . . . . . . . . . . . . . . . . . . . . . . . . . . . . . . . . . . . . . . . . . . A-2
Appendix B Cost Model for Styrene Emission Control Technologies . . . . . . . . . . . . . . . . . B-1References . . . . . . . . . . . . . . . . . . . . . . . . . . . . . . . . . . . . . . . . . . . . . . . . . . . . . B-7
v
Figures
No. Page
4-1 Calculated styrene inlet concentrations required to achieve autothermal operation . . . . . 74-2 Low-temperature saturation concentration of styrene in air . . . . . . . . . . . . . . . . . . . . . . 164-3 Styrene removal efficiency for VOC condensers . . . . . . . . . . . . . . . . . . . . . . . . . . . . . . . 184-4 Diagrams of the MIAB F-D (fixed-bed) and MIAB C-D (continuous fluidized-bed) carbon
adsorption systems . . . . . . . . . . . . . . . . . . . . . . . . . . . . . . . . . . . . . . . . . . . . . . . . . . . . . . 214-5 Diagram of the Thermatrix A2000 adsorption system . . . . . . . . . . . . . . . . . . . . . . . . . . . 224-6 Diagram of the Polyad FB concentrator system . . . . . . . . . . . . . . . . . . . . . . . . . . . . . . . . 254-7 Diagram of a rotating-wheel rotary concentrator system . . . . . . . . . . . . . . . . . . . . . . . . 284-8 Diagram of the Durr cylinder-type rotary concentrator system . . . . . . . . . . . . . . . . . . . 294-9 Process diagram of the Durr combined rotary concentrator and oxidation system . . . . . 304-10 Flow diagram of the REECO/Environmental C&C fluidized-bed preconcentrator
system with an oxidizer . . . . . . . . . . . . . . . . . . . . . . . . . . . . . . . . . . . . . . . . . . . . . . . . . . . 324-11 Schematic of an open single-bed biofilter system .. . . . . . . . . . . . . . . . . . . . . . . . . . . . . . 354-12 Schematic of a biotrickling filter . . . . . . . . . . . . . . . . . . . . . . . . . . . . . . . . . . . . . . . . . . . 384-13 Schematic of the Terr-Aqua’s ultraviolet/oxidation system . . . . . . . . . . . . . . . . . . . . . . . 404-14 Diagram of a simple membrane module . . . . . . . . . . . . . . . . . . . . . . . . . . . . . . . . . . . . . . 434-15 Membrane modules: (a) spiral-wound module, (b) plate-and-frame module,
(c) hollow-fiber contactor . . . . . . . . . . . . . . . . . . . . . . . . . . . . . . . . . . . . . . . . . . . . . . . . 444-16 Basic recycle system design using one membrane stage, preceded by a compressor
and condenser . . . . . . . . . . . . . . . . . . . . . . . . . . . . . . . . . . . . . . . . . . . . . . . . . . . . . . . . . . 454-17 Experimental heterogeneous photocatalysis system . . . . . . . . . . . . . . . . . . . . . . . . . . . . 49
5-1 Equipment cost calculations for various control technologies . . . . . . . . . . . . . . . . . . . . 595-2 Cost curves for a catalytic oxidizer with 70% heat recovery (H.R.) . . . . . . . . . . . . . . . . 615-3 Cost curves for a small plant (20 tons per year inlet) . . . . . . . . . . . . . . . . . . . . . . . . . . . 625-4 Cost curves for a medium-size plant (100 tons per year inlet) . . . . . . . . . . . . . . . . . . . . 635-5 Cost curves for a large plant (400 tons per year inlet) . . . . . . . . . . . . . . . . . . . . . . . . . . 64
6-1 Three methods of local extraction ventilation . . . . . . . . . . . . . . . . . . . . . . . . . . . . . . . . 706-2 Styrene emission profile for a typical spray booth . . . . . . . . . . . . . . . . . . . . . . . . . . . . . 736-3 Schematic diagram of a paint spray booth recirculating ventilation system . . . . . . . . . 746-4 Mobile zone spray booth . . . . . . . . . . . . . . . . . . . . . . . . . . . . . . . . . . . . . . . . . . . . . . . . . 756-5 Schematic diagram of a paint spray booth combining split-flow and recirculating
ventilation . . . . . . . . . . . . . . . . . . . . . . . . . . . . . . . . . . . . . . . . . . . . . . . . . . . . . . . . . . . . . 776-6 VOC emission distribution for a paint spray booth at Tyndall Air Force Base . . . . . . . . 796-7 Schematic diagram of a process using a small, centrally located capture device .. . . . . . 816-8 Conceptual design of an enclosure for a sink/vanity gel coating operation .. . . . . . . . . 86
vi
A-1 Equipment cost assumption for catalytic oxidizer with 95% heat recovery . . . . . . . . . . A-6A-2 Equipment cost assumption for MIAB systems . . . . . . . . . . . . . . . . . . . . . . . . . . . . . . . A-8A-3 Equipment cost calculation for rotary concentrator system . . . . . . . . . . . . . . . . . . . . . A-20A-4 Equipment cost calculation for biofiltration . . . . . . . . . . . . . . . . . . . . . . . . . . . . . . . . . A-26
Tables
No. Page
2-1 Manufacturing Processes Employed by FRP/C Industry .. . . . . . . . . . . . . . . . . . . . . . . . . . 2
4-1 Thermal and Catalytic Oxidizer Applications on Gel Coating, Resin Spray-up, Pultrusion,Continuous Lamination, and SMC Production Processes .. . . . . . . . . . . . . . . . . . . . . . . . 8
4-2 MIAB Fixed-Bed Carbon Adsorption Applications in Sweden for Styrene Removal . . 194-3 Processes Treated by the Polyad Control System at the American Standard Facility
in Salem, Ohio .. . . . . . . . . . . . . . . . . . . . . . . . . . . . . . . . . . . . . . . . . . . . . . . . . . . . . . . . . 264-4 Polyad Applications in Europe for Styrene Removal . . . . . . . . . . . . . . . . . . . . . . . . . . . 264-5 Selected Commercial Applications for Membrane Separation .. . . . . . . . . . . . . . . . . . . . 42
5-1 Equations for Equipment Cost . . . . . . . . . . . . . . . . . . . . . . . . . . . . . . . . . . . . . . . . . . . . . 565-2 Other Cost Analysis Inputs and Significant Assumptions . . . . . . . . . . . . . . . . . . . . . . . . 58
B-1 Capital Cost Factors for Emission Control Devices . . . . . . . . . . . . . . . . . . . . . . . . . . . . B-3
vii
Acronyms and Abbreviations
BACT Best Available Control TechnologyBCA beaded carbonaceous adsorbentBtu British thermal unitCE capital equipment (cost)CEFIC Unsaturated Polyesters Sector Group of European Chemical Industry CouncilCFC chlorofluorocarboncfm cubic feet per minuteEC equipment costEC&C Environmental C&C, Inc.EPA Environmental Protection AgencyFID flame ionization detectorFRP/C fiber-reinforced plastics/compositesft feetft/min feet per minuteGPRMC European Organization of Reinforced Plastics/Composite MaterialsHAPs Hazardous air pollutantsH.R. heat recoverykW kilowattkWh kilowatt-hourlb poundlb/h pounds per hourLEL Lower Explosive LimitMACT Maximum Achievable Control TechnologyMEK methyl ethyl ketoneMIAB Molnbacka Industri, ABMTR Membrane Technology and Research, Inc.NFPA National Fire Protection AssociationOAQPS Office of Air Quality Planning and StandardsOMC Outboard Marine Corp.OSHA Occupational Safety and Health AdministrationPADRE Polymer Adsorption and RemovalPCE perchloroethylenePEC purchased equipment costPEL permissible exposure limitsPIC Pultrusion Industry Councilppm parts per million (by volume)psig pounds per square inch, gagePVC polyvinyl chlorideRBWAE resin-bath-and-wet-out-area enclosureREECO Regenerative Environmental Equipment Co., Inc.RPC reinforced plastic composites
viii
RTI Research Triangle Institutescfm standard cubic feet per minuteSIC Standard Industrial ClassificationSMC Sheet Molding CompoundSP site preparationSPI Society of the Plastics Industry TCE trichloroethyleneTCI total capital investmentTCP 1,1,3-trichloropropeneTDC Total Direct Costtpy tons per yearTRI Toxics Release InventoryTWA time-weighted allowableUV/AO ultraviolet light/activated oxygenVLA vapor-laden airstreamVOC volatile organic compoundyr yearC degrees CelsiusF degrees Fahrenheit
1
Chapter 1
Introduction
The fiberglass-reinforced plastics/composites (FRP/C) and fiberglass boat buildingindustries have many alternatives for reducing styrene emissions. Styrene emissions can bereduced by (1) using resin materials and application equipment that generate less styreneemissions, (2) improving operator techniques to reduce overspray, (3) changing open-moldingprocesses to closed-molding processes, and (4) using add-on emission control devices. Theamount of reduction achieved by these alternatives, taken separately or in various combinations,can vary widely.
Lacking the regulatory mandates, add-on pollution control systems are not often used toreduce styrene emissions in the FRP/C and boat building industries. Low concentrations andhigh air flow rates also have made conventional emission controls very expensive and, in somecases, less efficient in destroying the emissions. The FRP/C and boat building industries needinformation on the applicabilities and costs of conventional and emerging add-on pollutioncontrol technologies so they can make informed decisions about the use of controls to reducetheir emissions. To meet this need, the cost and performance of several conventional andemerging add-on pollution control technologies and air flow management practices potentiallyapplicable to these industries have been evaluated.
This report summarizes the results of literature reviews and control cost analyses. Background information about the industries and the characteristics of their emissions isprovided in Chapter 2. Conclusions and recommendations of this study are presented inChapter 3. Various pollution control technologies are described in Chapter 4, and their costs arecompared in Chapter 5. Air flow management practices that may reduce worker exposure andcontrol costs are described and evaluated in Chapter 6. Costing procedures for various pollutioncontrol technologies are presented in Appendix A, and instructions for using a computerspreadsheet cost model for add-on emission controls are presented in Appendix B.
This report provides preliminary technical and cost information to FRP/C and boatbuilding companies for their use in selecting emission control technologies. Companies shouldidentify those technologies that fit their production processes and contact the vendors of thosetechnologies for more accurate information on equipment costs.
2
Chapter 2
Background
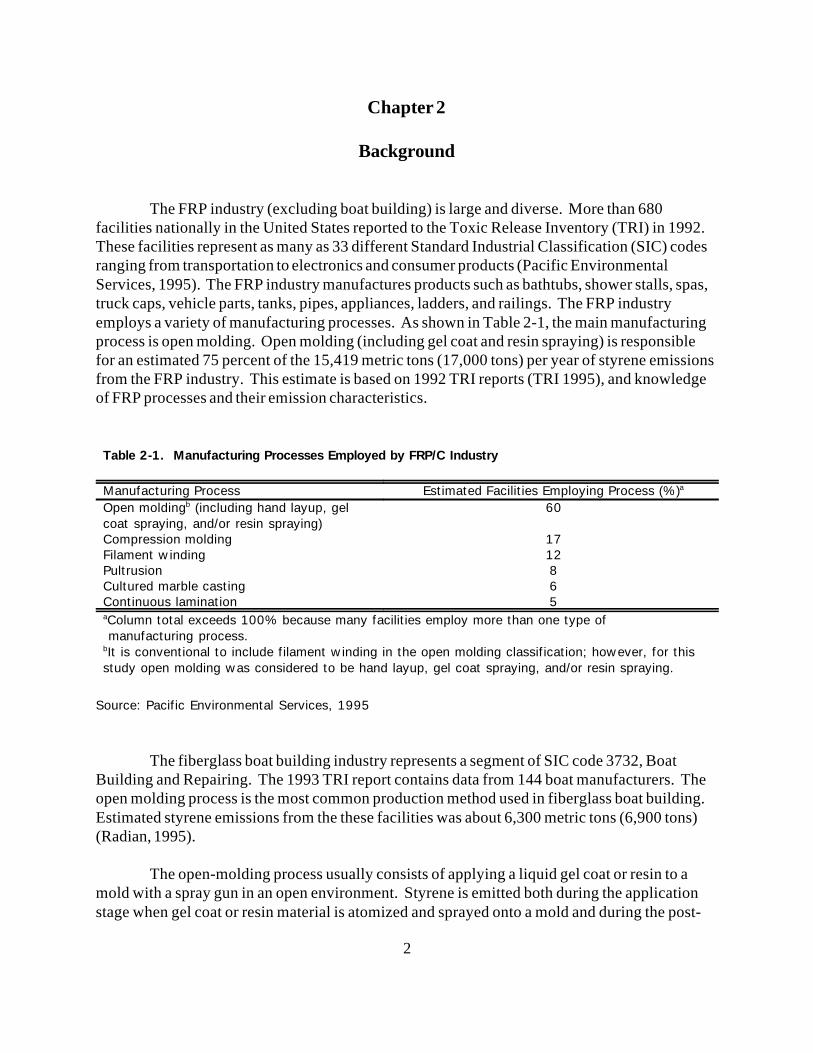
The FRP industry (excluding boat building) is large and diverse. More than 680facilities nationally in the United States reported to the Toxic Release Inventory (TRI) in 1992. These facilities represent as many as 33 different Standard Industrial Classification (SIC) codesranging from transportation to electronics and consumer products (Pacific EnvironmentalServices, 1995). The FRP industry manufactures products such as bathtubs, shower stalls, spas,truck caps, vehicle parts, tanks, pipes, appliances, ladders, and railings. The FRP industryemploys a variety of manufacturing processes. As shown in Table 2-1, the main manufacturingprocess is open molding. Open molding (including gel coat and resin spraying) is responsiblefor an estimated 75 percent of the 15,419 metric tons (17,000 tons) per year of styrene emissionsfrom the FRP industry. This estimate is based on 1992 TRI reports (TRI 1995), and knowledgeof FRP processes and their emission characteristics.
Table 2-1. Manufacturing Processes Employed by FRP/C Industry
Manufacturing Process Estimated Facilities Employing Process (%)a
Open molding (including hand layup, gel 60b
coat spraying, and/or resin spraying)Compression molding 17Filament winding 12Pultrusion 8Cultured marble casting 6Continuous lamination 5Column total exceeds 100% because many facilities employ more than one type of a
manufacturing process.It is conventional to include filament winding in the open molding classification; however, for thisb
study open molding was considered to be hand layup, gel coat spraying, and/or resin spraying.
Source: Pacific Environmental Services, 1995
The fiberglass boat building industry represents a segment of SIC code 3732, BoatBuilding and Repairing. The 1993 TRI report contains data from 144 boat manufacturers. Theopen molding process is the most common production method used in fiberglass boat building. Estimated styrene emissions from the these facilities was about 6,300 metric tons (6,900 tons)(Radian, 1995).
The open-molding process usually consists of applying a liquid gel coat or resin to amold with a spray gun in an open environment. Styrene is emitted both during the applicationstage when gel coat or resin material is atomized and sprayed onto a mold and during the post-
3
application period when the material cures. Most FRP/C production and boat building facilitiesuse high ventilation rates to ensure that styrene levels are below the 100-ppm worker exposurelimit established by the Occupational Safety and Health Administration (OSHA). Dilutionincreases the volume of contaminated air and, because the cost of an add-on emission controlsystem is a strong function of the total air flow, these diluted air streams are more costly tocontrol. Some facilities designate certain areas for gel coat or resin spraying to reduce thecontamination of plant air. In these cases, a spray booth equipped with a dry filter medium maybe used to reduce particulate emissions, but diluted styrene emissions are typically venteddirectly to the atmosphere.
Some FRP/C processes, such as pultrusion, continuous lamination, sheet moldingcompound (SMC) production, and resin mixing, have localized and concentrated emissions thatcan be enclosed and vented to a control device. Emissions from these processes can be capturedwith lower exhaust flow rates (i.e., at higher concentrations) than emissions from the open-molding process; therefore, it is more feasible or less costly to treat these streams. Most of theexisting emission control devices installed in the FRP/C facilities are used to treat emissionsfrom these processes.
References
Pacific Environmental Services, Inc; Industry Description. Memorandum from Greg LaFlamand Melanie Proctor, Pacific Environmental Services, Inc., to Madeleine Strum, EPA-OAQPS,October 17, 1995.
Radian Corporation; Minutes of the Boat Manufacturing P-MACT Teleconference on October31, 1995. Memorandum from Brian Palmer, Radian Corporation, to Madeleine Strum, EPA-OAQPS, November 28, 1995.
1987-1993 Toxics Release Inventory; EPA-749/C-95-004 (NTIS PB95-503793); U.S.Environmental Protection Agency, Office of Pollution Prevention and Toxics, Washington, DC;August 1995.
4
Chapter 3
Conclusions and Recommendations
Exhaust streams from open-molding processes in the FRP/C and boat building facilitiesare generally at low styrene concentrations and high air flow rates. General (dilution) ventilationis usually used to ensure that worker exposure is lower than that allowed by OSHA standards. Treating this low-concentration, high-air-flow stream is more expensive than treating a low-flowrate at higher concentration. Due to the general practice of dilution ventilation and the currentlack of specific regulations, add-on control devices are not commonly used in the FRP/C andboat building industries.
Of the limited number of add-on control devices used in the FRP/C facilities in theUnited States, thermal and catalytic oxidation are the most common. The costs of noveltechnologies, including biofiltration and preconcentration followed by recovery or oxidation, bythermal or catalytic oxidation were compared. Preconcentration techniques appear to reduce thecost of styrene control, particularly at the lower styrene concentrations (less than 100 ppm)typically found at FRP/C and boat building facilities. However, this apparent reduction in cost issignificantly affected by the equipment cost assumptions used in this analysis. Therefore, FRP/Ccompanies should compare the costs of competing technologies on a case-by-case basis.
The capital and operating costs of all emission control devices are strongly related to theflow rate of the incoming stream. Cost analyses indicate, for all control devices examined, thatcost per unit of styrene removed decreases as styrene inlet concentration increases (i.e., as the airflow rate decreases). Therefore, it is probably economical to concentrate the exhaust air stream,using improved air flow management practices or enclosures, before application of add-onemission control devices.
Improved air flow management techniques, which capture emissions at the source, orenclosures, which prevent styrene emissions from contaminating the plant air, can reduce theexhaust air flow rate and increase styrene concentrations in the exhaust streams from FRP/Cfacilities. These approaches can maintain a safe working environment and produce a high-concentration exhaust stream, which can be controlled with less expensive add-on controldevices.

5
Chapter 4
Pollution Control Technologies
This chapter presents process description and discussions of conventional, novel, andemerging technologies that are or may be used to reduce styrene emissions from FRP/C and boatbuilding facilities. Section 4.1 presents conventional technologies that are proven or have beentraditionally used for VOC emission control. Section 4.2 presents novel technologies that havebeen applied in the last decade to treat low-concentration emissions and Section 4.3 presentsemerging technologies that are still under investigation in laboratory or pilot plants, or arecurrently used to control VOC emissions from other industry sources.
4. 1 Conventional Technologies
Conventional technologies include combustion (i.e., thermal and catalytic oxidation),adsorption, and condensation, which have traditionally been used to treat VOC emissions. Theprocess description, applicability to FRP/C processes, typical operating conditions and controlefficiencies, and the advantage/disadvantage of its application are presented for eachconventional technology. 4.1.1 Combustion Technology
Combustion is a process by which an exhaust stream containing VOCs is brought toadequate temperature and held for a sufficient residence time to allow for oxidation of the VOCsinto the combustion byproducts of carbon dioxide (CO ) and water vapor (H O). Theoretically,2 2
any hydrocarbon would be oxidized according to the following equation:
C H + (a + 0.25b) O a CO + 0.5 b H O. (4-1)a b 2 2 2
Combustion devices are classified according to how oxidation of the VOC occurs andhow heat energy from the exhaust stream is recovered. The first classification differentiatesbetween two oxidation methods -- thermal or catalytic -- and the second category classifies themethod of heat recovery according to whether it is recuperative or regenerative (Haberlein andBoyd, 1995).
4.1.1.1 Thermal Oxidation
Thermal oxidizers, also called incinerators or afterburners, use high temperatures(typically between 538 and 1,093 C [1,000 and 2,000 F]) to destroy VOC vapors.
Process Description. A typical thermal oxidizer includes a burner, an insulatedexpansion zone (to allow sufficient high-temperature residence time for complete combustion),
6
and an induced-draft exhaust fan (to pull VOC-laden gases through the afterburner). The burner
typically uses auxiliary fuel such as natural gas if inlet pollutant concentrations are not highenough to self-sustain the oxidation reaction, once operating temperature is reached.
Thermal Recovery. Thermal recovery is frequently employed to lower the operatingfuel costs of thermal oxidizers. One method to recover heat from the exhaust of a thermaloxidizer is to install a heat exchanger. The heat exchanger may be used to preheat incomingcombustion air. In this case, the heat exchanger is called a recuperator. In recuperators, energyrecoveries of 40 to 60 percent are common, and recoveries of 80 percent are often practical(Cooper and Alley, 1986).
Regenerative thermal oxidizers cycle heat energy between an exhaust and an intakestream using an arrangement of thermal masses. The thermal oxidizer’s hot exhaust gas heats astorage mass, usually a heat-resistant ceramic material. Once this storage mass has reached apreset temperature, the exhaust gas is redirected and the VOC-laden inlet gas flows through thenow-heated mass. In this manner, the thermal energy of the incinerator’s exhaust is recovered. Regenerative heat exchangers typically achieve higher heat recoveries than recuperative heatexchangers; heat recoveries of up to 95 percent are practical.
One effect of thermal recovery is to lower the inlet pollutant concentration required toachieve autothermal operation (i.e., using the inlet pollutant as the sole fuel source to sustain theoxidation reaction). Figure 4-1 depicts calculated styrene inlet concentrations required toachieve autothermal operation, for thermal and catalytic oxidizers, with varying levels of heatrecovery. The calculated values are based on a thermal oxidizer temperature of 788 C (1,450F), a catalytic oxidizer temperature of 329 C (625 F), and an assumed heating value of
40,900 kJ/kg (17,600 Btu/lb) for styrene.
Applicability to FRP/C Processes. Applications of thermal and catalytic oxidizers toFRP/C processes in the United States are listed in Table 4-1. As of October 1995, thermal orcatalytic oxidizers were being employed to control emissions from five facilities performing gelcoating and/or resin sprayup processes, three facilities performing pultrusion, two facilitiesperforming continuous lamination, and one facility performing SMC production (LaFlam,1995b).
Standard operating conditions. The performance of an incinerator is commonlycharacterized by three important parameters known as the "Three T's:"
Temperature - The oxidation reaction rate is accelerated at elevated temperatures. Higher temperatures cause faster oxidation rates and higher destructionefficiencies.

7
Figure 4-1
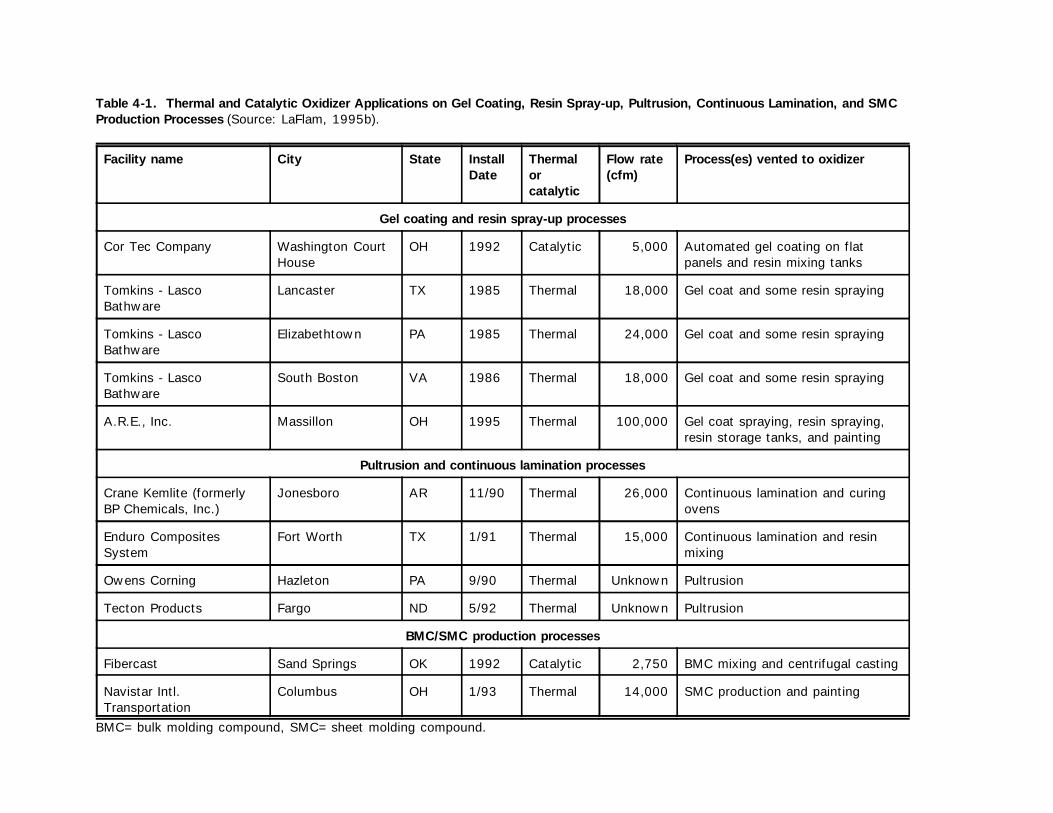
Table 4-1. Thermal and Catalytic Oxidizer Applications on Gel Coating, Resin Spray-up, Pultrusion, Continuous Lamination, and SMCProduction Processes (Source: LaFlam, 1995b).
Facility name City State Install Thermal Flow rate Process(es) vented to oxidizerDate or (cfm)
catalytic
Gel coating and resin spray-up processes
Cor Tec Company Washington Court OH 1992 Catalytic 5,000 Automated gel coating on flatHouse panels and resin mixing tanks
Tomkins - Lasco Lancaster TX 1985 Thermal 18,000 Gel coat and some resin sprayingBathware
Tomkins - Lasco Elizabethtown PA 1985 Thermal 24,000 Gel coat and some resin sprayingBathware
Tomkins - Lasco South Boston VA 1986 Thermal 18,000 Gel coat and some resin sprayingBathware
A.R.E., Inc. Massillon OH 1995 Thermal 100,000 Gel coat spraying, resin spraying, resin storage tanks, and painting
Pultrusion and continuous lamination processes
Crane Kemlite (formerly Jonesboro AR 11/90 Thermal 26,000 Continuous lamination and curingBP Chemicals, Inc.) ovens
Enduro Composites Fort Worth TX 1/91 Thermal 15,000 Continuous lamination and resinSystem mixing
Owens Corning Hazleton PA 9/90 Thermal Unknown Pultrusion
Tecton Products Fargo ND 5/92 Thermal Unknown Pultrusion
BMC/SMC production processes
Fibercast Sand Springs OK 1992 Catalytic 2,750 BMC mixing and centrifugal casting
Navistar Intl. Columbus OH 1/93 Thermal 14,000 SMC production and paintingTransportation
BMC=bulk molding compound, SMC=sheet molding compound.
9
Time - For the oxidation reaction to occur, the exhaust must remain at thereaction temperature for a minimum amount of time, called the "residence" or"retention" time. Greater destruction efficiencies result from longer residencetimes. Note that the temperature and time are inversely proportional (althoughnonlinear) to each other in determining destruction efficiency.
Turbulence - Turbulence is required to ensure that the exhaust is well-mixedthroughout the incineration chamber. Otherwise, a packet of exhaust could passthrough the chamber without adequate oxidation. Note that turbulence is notdirectly related to either temperature or time but is a necessary condition for highdestruction efficiency.
A review of the literature indicates a range of recommended temperature and residencetimes for thermal oxidizers. Thermal oxidizers generally operate at a temperature ranging from650 to 870 C (1,200 to 1,600 F) and require a minimum residence time of 0.3 second in thecombustion zone (Bethea, 1978). The thermal oxidizer at the Lasco-South Boston facilityoperates at approximately 788 C (1,450 F). Most thermal oxidizers are designed to provideno more than 1 second of residence time to the flue gas in the combustion chambers (NationalAcademy Press, 1983).
The VOC concentration of waste streams controlled by thermal oxidation can vary fromthe parts-per-million (ppm) range to 25 percent of the lower explosive limit (LEL). For styrene,this corresponds to a concentration of approximately 2,500 ppm. VOC concentrations typicallycannot exceed 25 percent of the LEL for safety and insurance reasons. Thermal incinerators canbe designed to control flow rates in excess of 2,832 m /min (100,000 cfm).3
Control Efficiency. Studies indicate that a well-designed and -operated thermal oxidizercan achieve at least a 98 percent destruction efficiency. This corresponds to thermal oxidizersthat are operated at 871 C (1,600 F), with a nominal residence time of 0.75 second (Farmer,1980).
Advantages/Disadvantages. The principal advantages of thermal oxidizers purchased asair pollution control devices are their demonstrated use within the FRP/C source category andtheir potential for very high destruction efficiency. The principal disadvantages of thermaloxidizers purchased as air pollution control devices are their high energy requirements (fordilute VOC streams, particularly if heat recovery is below 70 percent) and the formation ofadditional air pollutants (carbon dioxide and nitrogen oxides) from the combustion of auxiliaryfuel. Energy requirements and formation of carbon dioxide and nitrogen oxides are inverselyrelated to the level of heat recovery employed (i.e., increasing heat recovery decreases energyrequirements and formation of other air pollutants). A regenerative thermal oxidizer operatingat 816 C (1,500 F) produces 2 to 12 ppm of nitrogen oxides (Gribbon, 1996). An EPA study(Sanderford, 1993) indicates that NO formation is dependent on such factors as O content,x 2
10
residence time, and combustion temperature, and even a two-second residence time at 1,065 C(1,950 F) will result in formation of less than 10 ppm of NO .x
Costs. Capital and operating cost data are presented in Appendix A and the spreadsheetcost model is presented in Appendix B.
In-plant Boilers and Heaters as Thermal Oxidizers. Theoretically, any in-plant natural-gas or oil-fired boiler or heater could also be used to destroy styrene. However, in-plant boilershave limited air flow rates, and their seasonal usage limits the amount of emission reduction thatcould be achieved. Also, temperatures and residence times for in-plant boilers are lower than forthermal oxidizers designed for air pollution control and would therefore result in lowerdestruction efficiency. The principal advantages of in-plant boilers as thermal oxidizers are thatno additional combustion equipment is required and energy costs are reduced. The principaldisadvantages of in-plant boilers as thermal oxidizers are their uncertain destruction efficienciesand their limited combustion air needs (boilers only require approximately 5 m /min (180 cfm)3
of combustion air per million Btu/hour).
4.1.1.2 Catalytic Oxidation
Catalytic oxidation systems pass VOC-laden exhaust through special catalytic beds tofacilitate the oxidation of styrene at lower temperatures. These beds usually consist of preciousmetals. Catalytic oxidizers can reduce the required temperature for a given destructionefficiency by several hundred degrees Fahrenheit compared to thermal oxidizers.
Process Description. In most cases, inlet gases to the oxidizer are heated by a smallnatural-gas-fired burner (as with a thermal oxidizer, but to a much lower temperature). Theheated gases are then passed directly through the catalyst bed, which is in the same unit as theburner. The catalyst is usually a noble metal such as palladium and platinum (other metals areused, including chromium, manganese, copper, cobalt, and nickel) deposited on an aluminasupport configuration. The support configuration is frequently a honeycomb arrangement tominimize pressure drop (relative to a packed bed of pellets) (Cooper and Alley, 1986).
Thermal Recovery. As with thermal oxidizers, thermal recovery can be used to lowerthe fuel costs of catalytic oxidizers. Thermal recovery can be performed in a recuperator (energyrecoveries are typically 40 to 60 percent, with 80 percent often practical) or in a regenerator(energy recoveries up to 95 percent are practical).
Catalytic oxidizers have inherently lower fuel costs than thermal oxidizers (due to thelower combustion temperature in catalytic oxidizers). Therefore, catalytic oxidizers require asmaller amount of heat recovery to achieve autothermal operation (operation in which the inletpollutant is the sole fuel source). Calculated styrene inlet concentrations required to achieveautothermal operation for catalytic and thermal oxidizers are depicted in Figure 4-1. Therequired inlet concentrations were calculated by RTI, based on a thermal oxidizer temperature of
11
788 C (1,450 F), a catalytic oxidizer temperature of 329 C (625 F), and a styrene heatingvalue of 40,900 J/g (17,600 Btu/lb).
Applicability to FRP/C Processes. The Cor Tec facility (Washington Court House,Ohio) employs a catalytic oxidizer (see Table 4-1) designed to operate at 316 to 371 C (600 to 700 F), with a recuperative heat exchanger that recovers heat from the exhaust and uses it topreheat inlet air. The design flow rate is 142 m /min (5,000 cfm). The oxidizer treats exhaust3
gas streams from an automated gel coat spraying on flat panels at a rate of 102 m /min (3,6003
cfm) and a resin mixing operations at a rate of 40 m /min (1,400 cfm). Testing of the oxidizer in3
1994 indicated an average inlet styrene concentration (i.e., from both processes) of 240 ppm andan average destruction efficiency of approximately 98 percent (Patkar et al., 1994).
The Cor Tec facility and Fibercast (Sand Springs, Oklahoma) are the only two FRP/Cfacilities in the United States known to have a catalytic oxidizer.
Standard Operating Conditions. The catalyst bed in catalytic oxidizers generallyoperates at temperatures ranging between 149 and 482 C (300 and 900 F), with temperaturesrarely exceeding 538 C (1,000 F). The required contact time between the contaminant and thecatalyst for complete oxidation to occur is normally 0.3 second (Radian Corporation, 1985).
Control Efficiency. A well-operated and maintained catalytic oxidation unit canachieve destruction efficiencies of 98 percent, comparable to thermal oxidation units. Destruction efficiency would decrease in the presence of catalyst poisons and particulate matter(U.S. EPA, 1995).
Advantages/Disadvantages. Catalytic oxidizers have lower energy usage and resultantoperating costs than thermal oxidizers (with equal levels of heat recovery). This operating costadvantage may be offset by the increased capital cost of catalytic oxidizers. The smaller size ofcatalytic oxidizers also typically results in lower installation costs than thermal oxidizers with anequivalent flow rate. The generation of nitrogen oxides is virtually eliminated with catalyticoxidizers (due to the low combustion temperatures). Testing of a regenerative catalytic oxidizerdemonstrated nitrogen oxide production of less than 1 ppm (Gribbon, 1996).
Catalytic oxidizers may suffer from catalyst fouling or poisoning. Some materials thatare considered catalyst poisons include heavy metals (mercury, lead, iron, etc.), silicon, sulfur,and halogens. Organic solids or inert particulate matter may also poison or foul catalyst beds(Farmer, 1980).
Costs. Capital and operating cost data are presented in Appendix A and the spreadsheetcost model is presented in Appendix B.
12
4.1.2 Adsorption Technology
Adsorption technology utilizes a mass transfer process involving interactions betweengaseous and solid-phase components. The gas phase is captured on the solid phase by physicalor chemical adsorption mechanisms. Most VOC adsorption systems use activated carbon as thesolid phase, although a few systems use silica gels, diatomaceous earth, alumina, syntheticzeolites, special polymer materials, or other proprietary substances.
In carbon adsorption, gaseous VOC molecules are captured on the extensive surfacearea present in the gross and molecular pore spaces in the activated carbon adsorbent. The usedcarbon adsorbent is then either discarded or regenerated. Carbon adsorption units arecommercially available as packaged units up to 1,700 m /min (60,000 scfm) (Purcell and3
Shareef, 1986).
Activated carbon is best for adsorbing high-molecular weight and nonpolar chemicalsubstances. Compounds with a molecular weight of 40 or less do not adsorb well on activatedcarbon. Compounds with a boiling point greater than 150° C (300° F) do not desorb well. Ahigh relative humidity may interfere with the adsorption efficiency (Haberlein and Boyd, 1995).
The following sections discuss three carbon adsorption systems: (1) fixed-bed carbonadsorption (steam regeneration), (2) fluidized-bed carbon adsorption (hot air regeneration), and(3) activated-carbon filter panels (disposal, no regeneration). Hybrid systems using carbon orpolymeric adsorption and subsequent desorption for recovery or oxidation are presented in thenovel technologies section (Section 4.2).
4.1.2.1 Fixed-Bed Carbon Adsorption
Process Description. A typical fixed-bed carbon adsorption system consists of two largechambers, called "beds," that contain a large quantity of activated carbon. The VOC-ladenexhaust is first passed through one of the chambers, which slowly adsorbs the VOC vapor ontothe carbon in the bed. When the bed approaches either saturation (full capacity) or breakthrough(rapid reduction in capture efficiency), the exhaust is switched to the second chamber. Steam isthen used to regenerate the first carbon bed. The VOC-laden steam is allowed to condense andthe VOC is either decanted from the condensate or chemically treated. The two chambersalternate between adsorption and regeneration, maintaining a fairly constant emission controlrate.
Applicability to FRP/C Processes. There are no known fixed-bed carbon adsorptionsystems installed on FRP/C processes in the United States.
Standard Operating Conditions. Cameron-Yakima, an activated carbon vendor, reportsan average adsorption capacity of 20 percent to 50 percent, with an average of 33 percent forcompounds such as styrene (Haberlein and Boyd, 1995). In other words, 680 kg (1,500 lb) of
13
activated carbon could adsorb 227 kg (500 lb) of styrene before requiring regeneration. Typicalsuperficial gas velocities through a fixed-bed system are 18 to 49 m/min (60 to140 ft/min), andresulting pressure drops are from 1,244 to 3,732 N/m (5 to 15 inches of water) (Cooper and2
Alley, 1986).
Control Efficiency. Control efficiency for an activated carbon system is largelydependent on the degree to which the VOC is allowed to “break through” the carbon bed (i.e.,the carbon is completely or nearly completely deactivated). If the outlet of the carbon bed(s) ismonitored continuously, breakthrough can be avoided by switching beds or replacing carbon. Inthis case, adsorption efficiencies above 95 percent can be maintained.
Advantages/Disadvantages. For high-volume low-concentration VOC streams, carbonadsorption has lower energy costs than incineration. Carbon adsorption can be used topreconcentrate styrene prior to incineration or recovery (see Section 4.2.1). Reclamation ofstyrene from carbon adsorption may not be feasible or cost-effective, depending on chemicalpurity requirements for the reclaimed styrene. If reclaimed styrene cannot be used, it mightrequire disposal as a hazardous liquid waste. The most likely disposal method would bedestruction in a thermal incinerator designed for liquid waste or in a permited industrial kilnoperation. The additional cost of transportation and destruction of a hazardous liquid wastewould need to be considered in any economic analysis of carbon adsorption and recovery.
4.1.2.2 Fluidized-Bed Carbon Adsorption
Process Description. A fluidized-bed carbon adsorption system uses styrene-containingexhaust gases to entrain or “fluidize” activated-carbon particles. The activated carbon particlesare fluidized by a recirculation fan. The rate of recirculation of the activated carbon particlescan be adjusted to handle a wide variation in VOC inlet loadings.
MIAB (Molnbacka Industri, AB, of Sweden) has developed a continuous duty fluidized-bed carbon adsorption system, the MIAB C-D, in which VOCs are adsorbed then desorbed to athermal oxidizer. The desorbed VOCs are concentrated, therefore the thermal oxidizer has alower flow rate than would otherwise be necessary. The MIAB system is presented in the noveltechnologies section (Section 4.2.1.1) of this report.
Applicability to FRP/C Processes. No facilities in the United States currently usefluidized-bed carbon adsorption to control emissions from FRP/C processes. MIAB built a28-m /min (1,000 cfm) fluidized-bed carbon adsorption pilot unit, which was operated for 33
months in 1994 at an OMC boat manufacturing plant in Ryd, Sweden, in 1994. The inlet andoutlet styrene concentrations of the pilot study were 70 and 1.4 ppm, respectively, and a controlefficiency of 98 percent was achieved.
14
4.1.2.3 Activated Carbon Filter Panels
Process Description. A carbon filter panel system uses an activated carbon filter panelconsisting of a standard pleated-fabric dust filter that contains an inner layer of activated carbongranules. Normally, an activated carbon filter panel is placed within the return duct of a comfortair conditioning system, where it gradually adsorbs odors from the recirculating conditioned air.In this application, the conditioned air makes several passes through the filter each hour. Thisexplains why the carbon filter panels are fashioned in the shape and size of standard airconditioning dust filters (Haberlein and Boyd, 1995).
The Glastic Corporation (South Euclid, Ohio) installed a system consisting of 20 passivefilter housings mounted on the roof of a building where compression molding, pultrusion,laminate production, resin mixing, and bulk molding compound production were conducted. Five of the housings (in place since February 1993) each contain 48 panels, 0.30 m x 0.61 m (1 ftx 2 ft) in area, and 0.15 m (6 inches) deep. Each panel contains approximately 14 kg (30 lb) ofactivated carbon. The filters are weighed weekly and, upon a 3-kg (7-lb) weight gain, are sentout for regeneration. The rest of the housings, which have been in place for a longer time, aresituated directly above the several 567 m /min (20,000 cfm) plant exhaust fans. Each of these3
housings contains 48 panels that are either 5 or 10 cm (2 or 4 inches) deep. These filters aredisposed of after use. Glastic estimated that the cost is about $110/kg ($50/lb or $100,000/ton)of VOC controlled. The company emphasized that the system is still under development, andthat they would not configure the system this way if they were to begin again (plans are tochange out the throwaway filters and collect from specific point source operations)(LaFlam, 1993).
Applicability to FRP/C Processes. The Glastic facility (Euclid, Ohio) and the U.S.Fiberglass Product, Inc. (Middlebranch, Ohio) are the only two FRP/C facility in the UnitedStates using activated carbon filter panels to control plant emissions. Carbon filters could beapplied for low-concentration, low-mass-flow applications.
Standard Operating Conditions. Carbon filter panels are typically used only for low-mass-emission-rate processes, because the capacity of the filters does not allow prolongedoperation at high-mass-emission rates. Glastic Corporation uses panels containing 14 kg (30 lb)of activated carbon, and the panels are replaced after weekly weighing indicates a weight gain ofmore than 3 kg (7 lb).
Control Efficiency. The VOC control efficiency of an activated carbon filter panelsystem depends primarily on: (1) the degree to which breakthrough of styrene through the filterpanels is allowed to occur, and (2) the amount of “sneakage,” or air that does not go through thefilter panels.
Advantages/Disadvantages. Carbon filter panels can be used in low-concentrationapplications, with emissions spread over a wide area. Similar to the fixed-bed carbon adsorption
15
system, carbon filter panels have disadvantages, such as potential for styrene polymerization andunlikelihood of styrene recovery. Additionally, carbon filter panels, because of their limitedadsorption capacity before replacement, are not applicable to high-emission-rate processes. Costs per unit of styrene removed can be very high.
Costs. Glastic Corporation reports a cost per unit of styrene removed of approximately$110/kg ($50/lb or $100,000/ton) for throwaway carbon filter panels and approximately $20/kg($9/lb or $18,000/ton) for regenerable filters. These cost estimates do not include capital andlabor costs. Annual filter costs for the facility are on the order of $250,000 (LaFlam, 1993).
4.1.3 Condensation
Condensation (refrigeration) involves lowering the temperature of a VOC-laden exhauststream below the dewpoint (saturation temperature) of the VOC to be condensed. Figure 4-2shows RTI-calculated low-temperature saturation concentrations for styrene in air atatmospheric pressure. The values in the figure are based on styrene saturation data from twosources (CRC Press, 1972, and Cooper and Alley, 1986). This figure indicates that thesaturation concentration for styrene is 357 ppm at -23 C (-10 F), and 84 ppm at -40 C (-40F).
Process Description. There are two types of refrigeration units: single-stage and multi-stage units. Both types typically consist of a skid-mounted unit on steel beams, including awalk-in weatherproof enclosure, air-cooled low-temperature-refrigeration machinery with dualpump design, storage reservoir, control panel and instrumentation, vapor condenser, and piping.Each unit has a system pump, plus a bypass pump to short-circuit the vapor condenser during no-load conditions.
Applicability to FRP/C Processes. Condensation is not commonly used to treat styreneemissions. However, an FRP/C facility (Premix, Inc., Ashtabula, Ohio) recently installed aliquid-nitrogen condenser to recover styrene. Premix has several pultrusion lines and resinstorage and mixing tanks. The facility originally applied enclosure and nitrogen blanketing ontheir resin tanks and process openings to confine styrene emissions. Recently, they decided tovent the styrene-laden nitrogen to a condenser, which uses liquid nitrogen to remove styrene. This FRP/C facility is currently conducting a study to examine the styrene reuse issue. Since thefacility already has a nitrogen source on site, the additional cost for the condenser is less thanthat for other emission control systems (Bonner, 1995).
For condensation to be a viable control technology for open molding processes,concentrations in exhaust streams at FRP/C facilities would need to be raised considerably fromtheir current typical values of below 100 ppm.
16
Standard Operating Conditions. Single-stage refrigeration units typically achievetemperatures between 4 and -29 C (40 and -20 F), although some of them can reach -51 C(-60 F). Multistage units typically operate between -23 and -73 C (-10 and -100 F)

17
Figure 4-2
18
(Vatavuk, 1995). For the purposes of this evaluation, it will be assumed that single-stage unitsoperate at -23 C (-10 F) and multistage units operate at -40 C (-40 F).
Control Efficiency. Condensation control efficiency is dependent on the operatingtemperature of the condensation system, the vapor-saturation curve for styrene, and the inletstyrene concentration to the refrigeration system.
Figure 4-3 depicts RTI-calculated styrene-removal efficiencies for various styrene inletconcentrations, for a single-stage unit operating at -23 C (-10 F) (saturation concentration of357 ppm) and a multistage unit operating at -40 C (-40 F) (saturation concentration of84 ppm). Styrene removal efficiencies are calculated relative to the saturation concentrations at-23 C (-10 F) and -40 C (-40 F), respectively. For example, the calculated removalefficiency for a single-stage condenser operating with an inlet concentration of 500 ppm wouldbe [(500-357)/500]x100 = 28.6 percent.
Advantages/Disadvantages. Condensation has an advantage relative to oxidation in thatno additional air pollutants (e.g., carbon dioxide and nitrogen oxides) are generated. The styrenerecovered from a styrene condenser may not be reusable. Condensation is not an economicallyfeasible alternative at styrene exhaust concentrations currently found at most FRP/C facilities(i.e., below approximately 100 ppm).
Costs. Capital and operating cost data are presented in Appendix A and the spreadsheetcost model is presented in Appendix B.
4.2 Novel Technologies
Novel technologies are technologies that have been applied in the last decade to treatlow-concentration emissions. These technologies have been installed in European and JapaneseFRP/C or boat building facilities to treat styrene emissions or in the United States to treat paintbooth emissions or organic vapor from soil remediation. One of the novel technologiesincorporates adsorption and desorption for subsequent recovery or oxidation in a hybrid design. In this case, the adsorption unit acts as a preconcentration stage, which creates a smaller exhaustflow at a higher concentration for subsequent recovery or oxidation. This hybrid technology isdescribed in Section 4.2.1. Section 4.2.2 addresses biofiltration technology, and Section 4.2.3presents an ultraviolet light/activated oxygen (UV/AO) technology.
4.2.1 Preconcentration/Recovery/Oxidation Hybrid Systems
Technical information collected from various vendors for four hybrid systems ispresented in this section. These systems are MIAB, Thermatrix PADRE, Polyad, rotaryconcentrator, and fluidized-bed preconcentration systems.

19
Figure 4-3
20
4.2.1.1 MIAB System
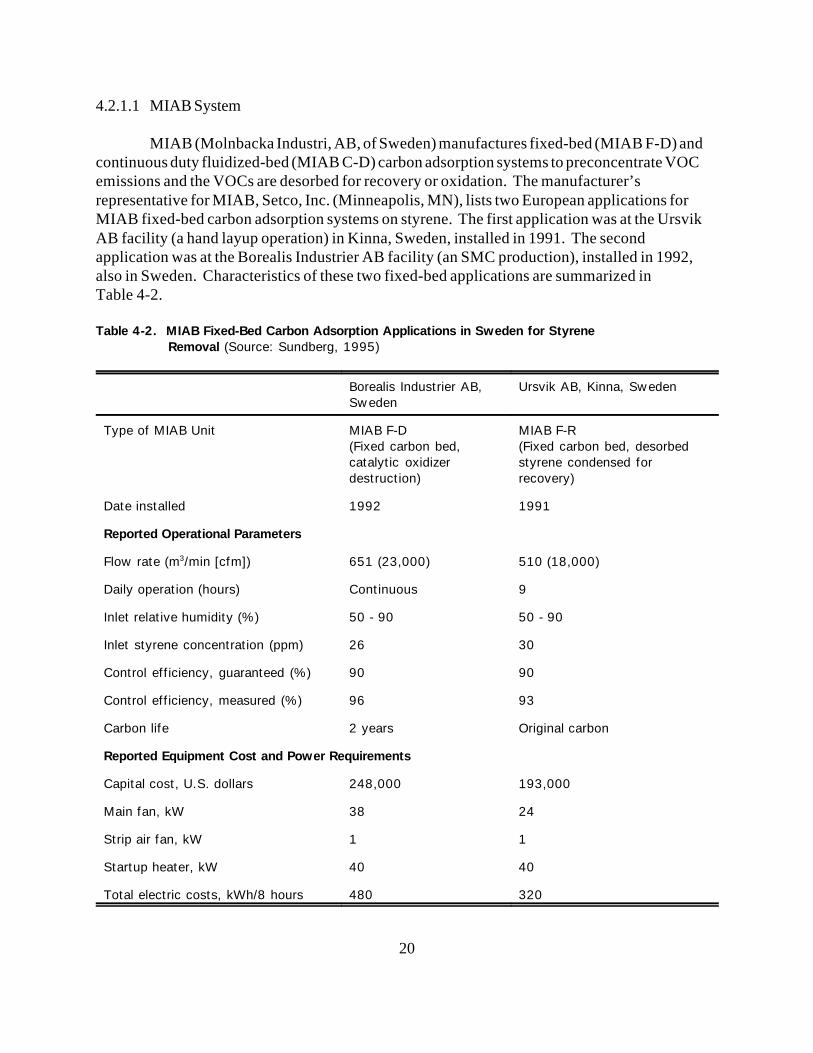
MIAB (Molnbacka Industri, AB, of Sweden) manufactures fixed-bed (MIAB F-D) andcontinuous duty fluidized-bed (MIAB C-D) carbon adsorption systems to preconcentrate VOCemissions and the VOCs are desorbed for recovery or oxidation. The manufacturer’srepresentative for MIAB, Setco, Inc. (Minneapolis, MN), lists two European applications forMIAB fixed-bed carbon adsorption systems on styrene. The first application was at the UrsvikAB facility (a hand layup operation) in Kinna, Sweden, installed in 1991. The secondapplication was at the Borealis Industrier AB facility (an SMC production), installed in 1992,also in Sweden. Characteristics of these two fixed-bed applications are summarized inTable 4-2.
Table 4-2. MIAB Fixed-Bed Carbon Adsorption Applications in Sweden for Styrene Removal (Source: Sundberg, 1995)
Borealis Industrier AB, Ursvik AB, Kinna, SwedenSweden
Type of MIAB Unit MIAB F-D MIAB F-R(Fixed carbon bed, (Fixed carbon bed, desorbedcatalytic oxidizer styrene condensed fordestruction) recovery)
Date installed 1992 1991
Reported Operational Parameters
Flow rate (m /min [cfm]) 651 (23,000) 510 (18,000)3
Daily operation (hours) Continuous 9
Inlet relative humidity (%) 50 - 90 50 - 90
Inlet styrene concentration (ppm) 26 30
Control efficiency, guaranteed (%) 90 90
Control efficiency, measured (%) 96 93
Carbon life 2 years Original carbon
Reported Equipment Cost and Power Requirements
Capital cost, U.S. dollars 248,000 193,000
Main fan, kW 38 24
Strip air fan, kW 1 1
Startup heater, kW 40 40
Total electric costs, kWh/8 hours 480 320
21
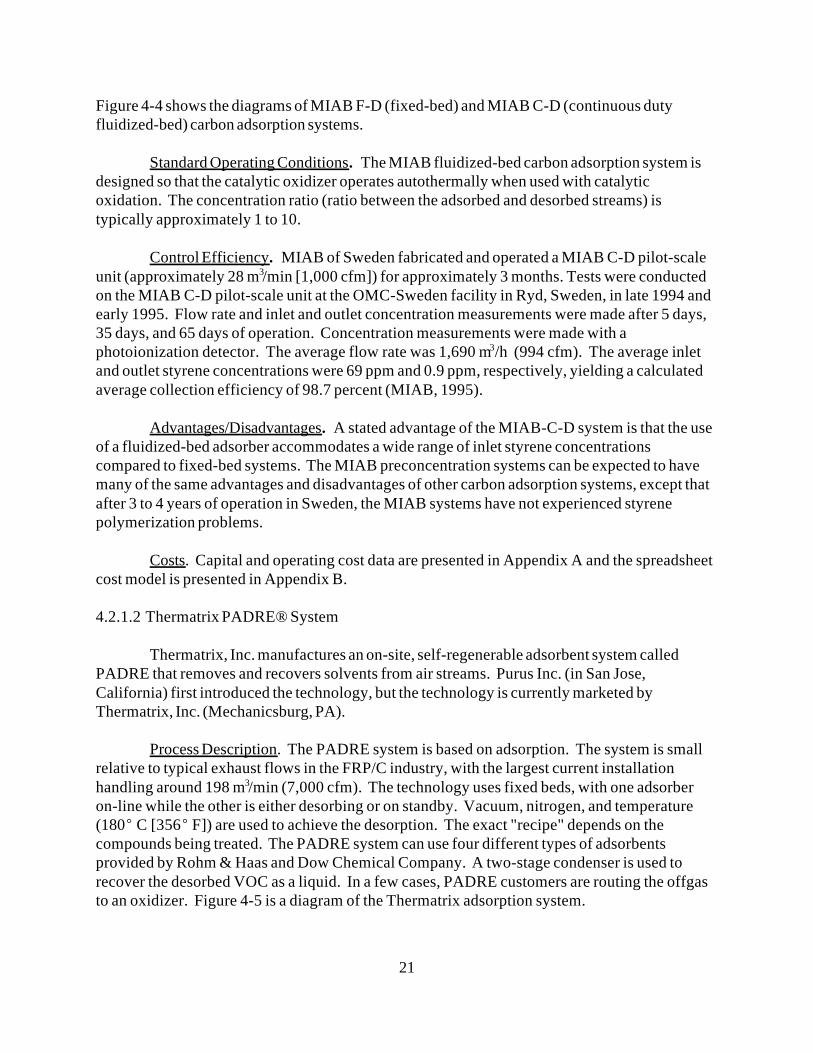
Figure 4-4 shows the diagrams of MIAB F-D (fixed-bed) and MIAB C-D (continuous dutyfluidized-bed) carbon adsorption systems.
Standard Operating Conditions. The MIAB fluidized-bed carbon adsorption system isdesigned so that the catalytic oxidizer operates autothermally when used with catalyticoxidation. The concentration ratio (ratio between the adsorbed and desorbed streams) istypically approximately 1 to 10.
Control Efficiency. MIAB of Sweden fabricated and operated a MIAB C-D pilot-scaleunit (approximately 28 m /min [1,000 cfm]) for approximately 3 months. Tests were conducted3
on the MIAB C-D pilot-scale unit at the OMC-Sweden facility in Ryd, Sweden, in late 1994 andearly 1995. Flow rate and inlet and outlet concentration measurements were made after 5 days,35 days, and 65 days of operation. Concentration measurements were made with aphotoionization detector. The average flow rate was 1,690 m /h (994 cfm). The average inlet3
and outlet styrene concentrations were 69 ppm and 0.9 ppm, respectively, yielding a calculatedaverage collection efficiency of 98.7 percent (MIAB, 1995).
Advantages/Disadvantages. A stated advantage of the MIAB-C-D system is that the useof a fluidized-bed adsorber accommodates a wide range of inlet styrene concentrationscompared to fixed-bed systems. The MIAB preconcentration systems can be expected to havemany of the same advantages and disadvantages of other carbon adsorption systems, except thatafter 3 to 4 years of operation in Sweden, the MIAB systems have not experienced styrenepolymerization problems.
Costs. Capital and operating cost data are presented in Appendix A and the spreadsheetcost model is presented in Appendix B.
4.2.1.2 Thermatrix PADRE® System
Thermatrix, Inc. manufactures an on-site, self-regenerable adsorbent system calledPADRE that removes and recovers solvents from air streams. Purus Inc. (in San Jose,California) first introduced the technology, but the technology is currently marketed byThermatrix, Inc. (Mechanicsburg, PA).
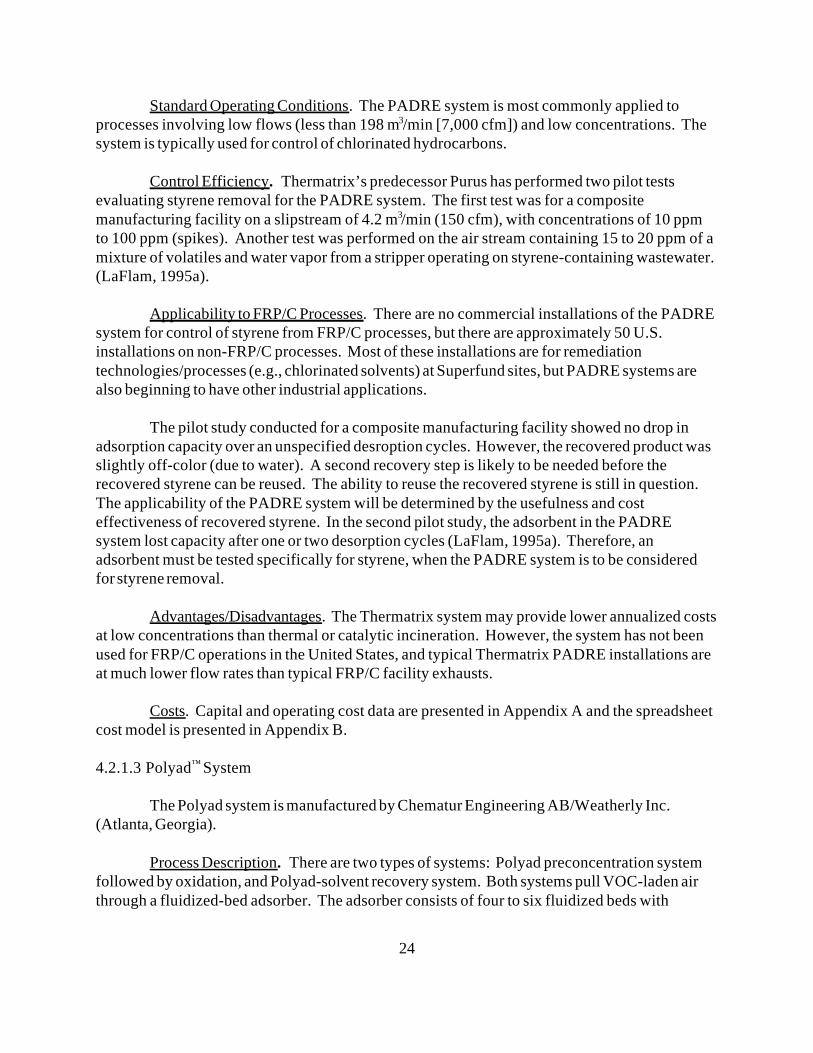
Process Description. The PADRE system is based on adsorption. The system is smallrelative to typical exhaust flows in the FRP/C industry, with the largest current installationhandling around 198 m /min (7,000 cfm). The technology uses fixed beds, with one adsorber3
on-line while the other is either desorbing or on standby. Vacuum, nitrogen, and temperature(180 C [356 F]) are used to achieve the desorption. The exact "recipe" depends on thecompounds being treated. The PADRE system can use four different types of adsorbentsprovided by Rohm & Haas and Dow Chemical Company. A two-stage condenser is used torecover the desorbed VOC as a liquid. In a few cases, PADRE customers are routing the offgasto an oxidizer. Figure 4-5 is a diagram of the Thermatrix adsorption system.

22
Figure 4-4

23
Figure 4-5
24
Standard Operating Conditions. The PADRE system is most commonly applied toprocesses involving low flows (less than 198 m /min [7,000 cfm]) and low concentrations. The3
system is typically used for control of chlorinated hydrocarbons.
Control Efficiency. Thermatrix’s predecessor Purus has performed two pilot testsevaluating styrene removal for the PADRE system. The first test was for a compositemanufacturing facility on a slipstream of 4.2 m /min (150 cfm), with concentrations of 10 ppm3
to 100 ppm (spikes). Another test was performed on the air stream containing 15 to 20 ppm of amixture of volatiles and water vapor from a stripper operating on styrene-containing wastewater.(LaFlam, 1995a).
Applicability to FRP/C Processes. There are no commercial installations of the PADRE
system for control of styrene from FRP/C processes, but there are approximately 50 U.S.installations on non-FRP/C processes. Most of these installations are for remediationtechnologies/processes (e.g., chlorinated solvents) at Superfund sites, but PADRE systems arealso beginning to have other industrial applications.
The pilot study conducted for a composite manufacturing facility showed no drop inadsorption capacity over an unspecified desroption cycles. However, the recovered product wasslightly off-color (due to water). A second recovery step is likely to be needed before therecovered styrene can be reused. The ability to reuse the recovered styrene is still in question. The applicability of the PADRE system will be determined by the usefulness and costeffectiveness of recovered styrene. In the second pilot study, the adsorbent in the PADREsystem lost capacity after one or two desorption cycles (LaFlam, 1995a). Therefore, anadsorbent must be tested specifically for styrene, when the PADRE system is to be consideredfor styrene removal.
Advantages/Disadvantages. The Thermatrix system may provide lower annualized costsat low concentrations than thermal or catalytic incineration. However, the system has not beenused for FRP/C operations in the United States, and typical Thermatrix PADRE installations areat much lower flow rates than typical FRP/C facility exhausts.
Costs. Capital and operating cost data are presented in Appendix A and the spreadsheetcost model is presented in Appendix B.
4.2.1.3 Polyad System™
The Polyad system is manufactured by Chematur Engineering AB/Weatherly Inc.(Atlanta, Georgia).
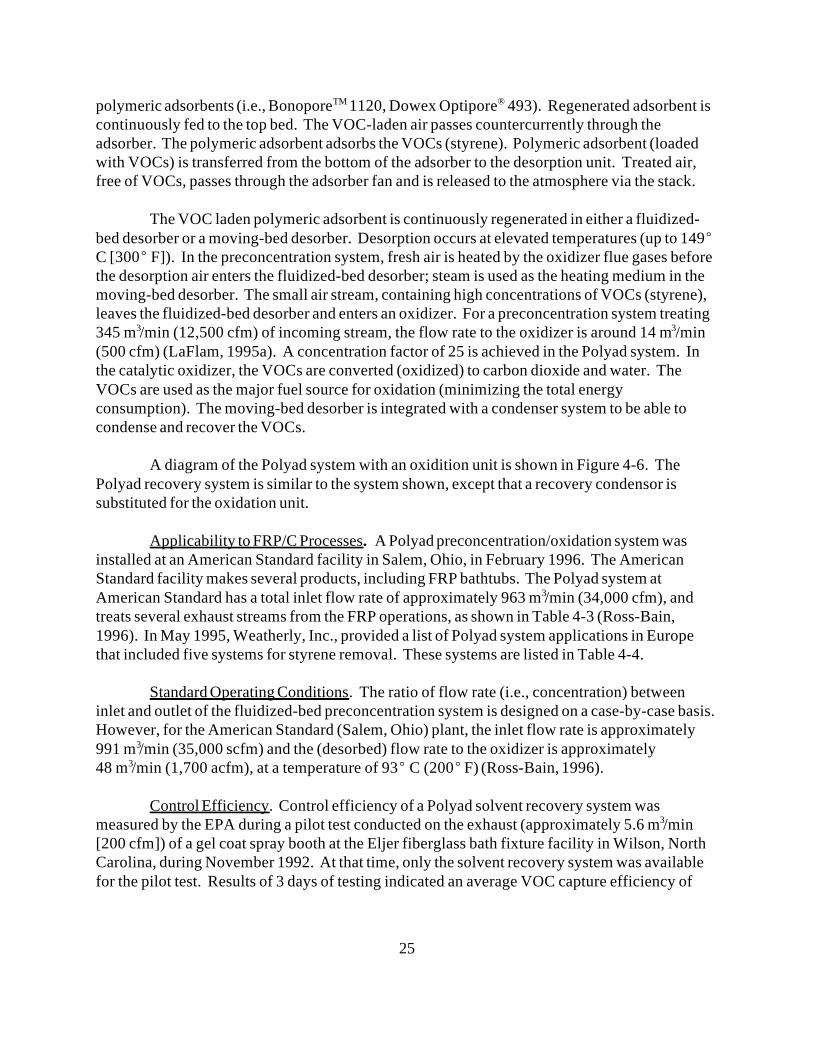
Process Description. There are two types of systems: Polyad preconcentration systemfollowed by oxidation, and Polyad-solvent recovery system. Both systems pull VOC-laden airthrough a fluidized-bed adsorber. The adsorber consists of four to six fluidized beds with
25
polymeric adsorbents (i.e., Bonopore 1120, Dowex Optipore 493). Regenerated adsorbent isTM ®
continuously fed to the top bed. The VOC-laden air passes countercurrently through theadsorber. The polymeric adsorbent adsorbs the VOCs (styrene). Polymeric adsorbent (loadedwith VOCs) is transferred from the bottom of the adsorber to the desorption unit. Treated air,free of VOCs, passes through the adsorber fan and is released to the atmosphere via the stack.
The VOC laden polymeric adsorbent is continuously regenerated in either a fluidized-bed desorber or a moving-bed desorber. Desorption occurs at elevated temperatures (up to 149C [300 F]). In the preconcentration system, fresh air is heated by the oxidizer flue gases beforethe desorption air enters the fluidized-bed desorber; steam is used as the heating medium in themoving-bed desorber. The small air stream, containing high concentrations of VOCs (styrene), leaves the fluidized-bed desorber and enters an oxidizer. For a preconcentration system treating345 m /min (12,500 cfm) of incoming stream, the flow rate to the oxidizer is around 14 m /min3 3
(500 cfm) (LaFlam, 1995a). A concentration factor of 25 is achieved in the Polyad system. Inthe catalytic oxidizer, the VOCs are converted (oxidized) to carbon dioxide and water. TheVOCs are used as the major fuel source for oxidation (minimizing the total energyconsumption). The moving-bed desorber is integrated with a condenser system to be able tocondense and recover the VOCs.
A diagram of the Polyad system with an oxidition unit is shown in Figure 4-6. ThePolyad recovery system is similar to the system shown, except that a recovery condensor issubstituted for the oxidation unit.
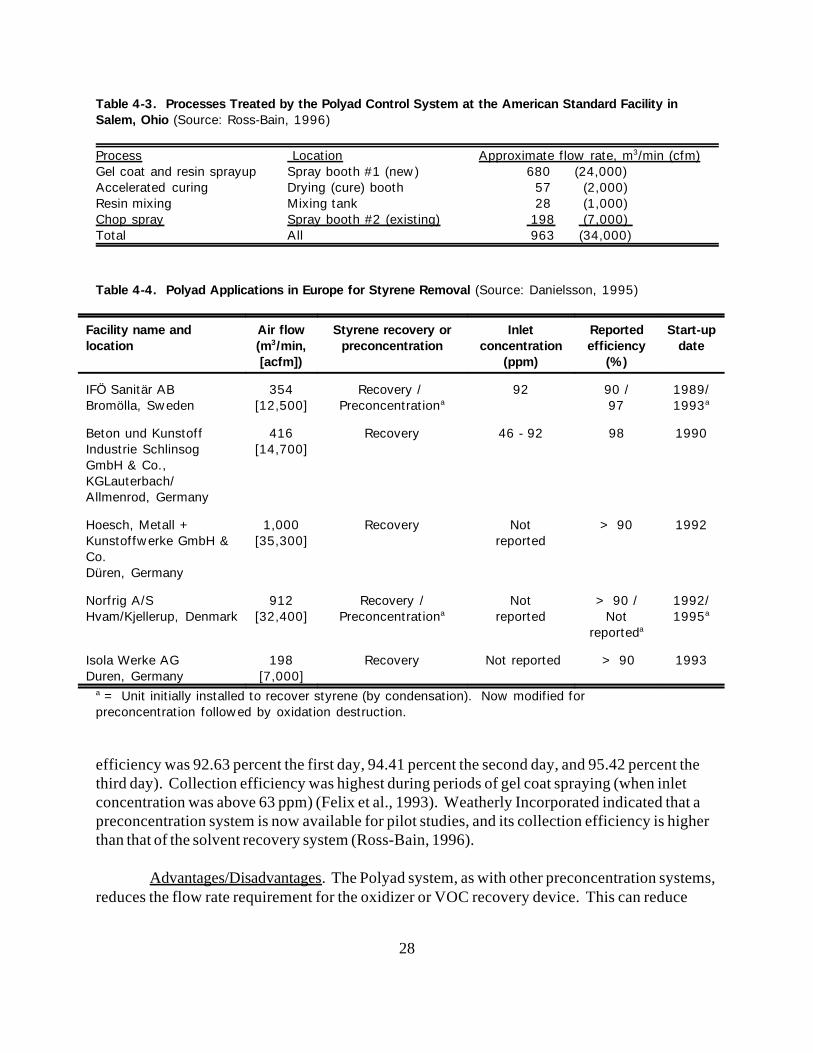
Applicability to FRP/C Processes. A Polyad preconcentration/oxidation system wasinstalled at an American Standard facility in Salem, Ohio, in February 1996. The AmericanStandard facility makes several products, including FRP bathtubs. The Polyad system atAmerican Standard has a total inlet flow rate of approximately 963 m /min (34,000 cfm), and3
treats several exhaust streams from the FRP operations, as shown in Table 4-3 (Ross-Bain,1996). In May 1995, Weatherly, Inc., provided a list of Polyad system applications in Europethat included five systems for styrene removal. These systems are listed in Table 4-4.
Standard Operating Conditions. The ratio of flow rate (i.e., concentration) betweeninlet and outlet of the fluidized-bed preconcentration system is designed on a case-by-case basis. However, for the American Standard (Salem, Ohio) plant, the inlet flow rate is approximately991 m /min (35,000 scfm) and the (desorbed) flow rate to the oxidizer is approximately3
48 m /min (1,700 acfm), at a temperature of 93 C (200 F) (Ross-Bain, 1996).3
Control Efficiency. Control efficiency of a Polyad solvent recovery system wasmeasured by the EPA during a pilot test conducted on the exhaust (approximately 5.6 m /min3
[200 cfm]) of a gel coat spray booth at the Eljer fiberglass bath fixture facility in Wilson, NorthCarolina, during November 1992. At that time, only the solvent recovery system was availablefor the pilot test. Results of 3 days of testing indicated an average VOC capture efficiency of

26
94.18 percent, with collection efficiency increasing during each day of testing (averagecollection

27
Figure 4-6
28
Table 4-3. Processes Treated by the Polyad Control System at the American Standard Facility inSalem, Ohio (Source: Ross-Bain, 1996)
Process Location Approximate flow rate, m /min (cfm)3
Gel coat and resin sprayup Spray booth #1 (new) 680 (24,000) Accelerated curing Drying (cure) booth 57 (2,000) Resin mixing Mixing tank 28 (1,000) Chop spray Spray booth #2 (existing) 198 (7,000) Total All 963 (34,000)
Table 4-4. Polyad Applications in Europe for Styrene Removal (Source: Danielsson, 1995)
Facility name and Air flow Styrene recovery or Inlet Reported Start-uplocation (m /min, preconcentration concentration efficiency date3
[acfm]) (ppm) (%)
IFÖ Sanitär AB 354 Recovery / 92 90 / 1989/Bromölla, Sweden [12,500] Preconcentration 97 1993a a
Beton und Kunstoff 416 Recovery 46 - 92 98 1990Industrie Schlinsog [14,700]GmbH & Co.,KGLauterbach/Allmenrod, Germany
Hoesch, Metall + 1,000 Recovery Not > 90 1992Kunstoffwerke GmbH & [35,300] reportedCo.Düren, Germany
Norfrig A/S 912 Recovery / Not > 90 / 1992/Hvam/Kjellerup, Denmark [32,400] Preconcentration reported Not 1995a
reporteda
a
Isola Werke AG 198 Recovery Not reported > 90 1993Duren, Germany [7,000]
= Unit initially installed to recover styrene (by condensation). Now modified for a
preconcentration followed by oxidation destruction.
efficiency was 92.63 percent the first day, 94.41 percent the second day, and 95.42 percent thethird day). Collection efficiency was highest during periods of gel coat spraying (when inletconcentration was above 63 ppm) (Felix et al., 1993). Weatherly Incorporated indicated that apreconcentration system is now available for pilot studies, and its collection efficiency is higherthan that of the solvent recovery system (Ross-Bain, 1996).
Advantages/Disadvantages. The Polyad system, as with other preconcentration systems,reduces the flow rate requirement for the oxidizer or VOC recovery device. This can reduce
29
total annualized costs per unit of styrene removed, as compared to straight thermal or catalyticoxidation. The Polyad system is most economically attractive for flow rates above 283 to 340m /min (10,000 to 12,000 cfm) (Ross-Bain, 1996). Weatherly Incorporated recommends3
preconcentration system over solvent recovery system for styrene removal.
Costs. Capital and operating cost data are presented in Appendix A and the spreadsheetcost model is presented in Appendix B.
4.2.1.4 Rotary Concentrator System
Process Description. In a rotary concentrator system, styrene-containing exhaust gasesare filtered first to remove particulate matter (for long-term protection of adsorbent), then pulledthrough a large, rotating honeycomb wheel. The honeycomb is impregnated with eitheractivated carbon or a specialized zeolite adsorbent. The wheel turns slowly while styrene in theexhaust gas is adsorbed. A small sector of the wheel is isolated from the exhaust stream, then alow volume of hot air is passed through this sector, desorbing the styrene to a higherconcentration. This small, concentrated stream is normally conducted to an incinerator fordestruction. Figure 4-7 shows a rotating-wheel design and Figure 4-8 shows a cylinder-typedesign of the rotary concentrator systems. Figure 4-9 shows the process diagram of a combinedrotary concentrator and oxidation system.
Applicability to FRP/C Processes. There are no known applications of rotaryconcentrator systems on FRP/C processes in the United States. However, Daikin of Japansupplies carbon-based honeycomb rotary concentrators, which are used to control emissionsfrom plants manufacturing hot tubs, shower stalls, etc. in Japan. There are nine applicationsinstalled in Japan. The first installation was in 1984. The concentrated vapor streams fromthese rotary concentrators are sent to catalytic oxidizers for on-site destruction (Sekiguchi,1996). There are at least two zeolite concentrating rotor installations for styrene emissionscontrol at styrene-butadiene synthetic rubber plants in Europe (Haberlein and Boyd, 1995).
Standard Operating Conditions. Styrene-laden air at ambient temperature first passesthrough a filter to remove particulate matter then enters the honeycomb rotary concentrator. Thehoneycomb rotor travels 2 to 6 revolutions per hour. Styrene adsorbed on the rotary concentratoris desorbed by heated air at 5 to 25 percent of the original flow rate. The temperature of thedesorbing gas ranges from 66 to 120 C (150 to 250 F) for activated carbon and could be ashigh as 177 C (350 F) for zeolite. The styrene-concentrated gas stream is then subject tothermal or catalytic oxidation. The Durr pilot study at Navistar International Transportation didnot observe progressive polymerization of styrene on the surface of either carbon or zeoliteadsorbents over the month-long studies (Gupta, 1996).
Control Efficiency. The styrene removal efficiencies for three Daikin rotaryconcentrators in Japan range from 96.9 to 99.4 percent. For example, the inlet and outlet styreneconcentrations of a rotary concentrator were 238 and 2.1 ppm, respectively. The styrene

30
Figure 4-7

31
Figure 4-8

32
Figure 4-9
33
concentration in the desorbed stream to the catalytic oxidizer was 1,160 ppm. At thatconcentration, the catalytic oxidizer was self-sustaining. This implies that the concentrationincreased or the exhaust flow rate was reduced by a factor of 5 (Sekiguchi, 1996).
Durr Industries, Inc. (Plymouth, Michigan) conducted two 1-month pilot studies atNavistar International Transportation (Columbus, Ohio) in October 1995 to determine thefeasibility of activated carbon and zeolite rotary concentrators for reducing styrene emissionsfrom SMC production. A split stream of 5.7 m /min (200 cfm) was taken from the SMC exhaust3
for the pilot study. The Durr pilot study showed that the styrene removal efficiency for thezeolite rotor was 97 percent over a month-long study. The average inlet and outlet styreneconcentrations of the zeolite rotor were 137 and 4.3 ppm, respectively. The styrene removalefficiency for the activated carbon rotary concentrator was 98 percent with an average inletstyrene concentration of 136 ppm and outlet concentration of 2.4 ppm (Gupta, 1996). Aconcentration factor of 10 was used in the Durr pilot study, which implies that the desorbingflow rate is 10 percent of the incoming flow rate.
Advantages/Disadvantages. Rotary concentrators can reduce the exhaust stream andincrease its concentration for subsequent destruction. The concentration factor is determinedfrom the inlet and desorbing concentrations. For safety reason, the desorbing concentration islimited to 25 percent of the LEL, that is, 2,500 ppm. Typically, a rotary concentrator can reducethe exhaust flow rate to 5 to 25 percent of the original exhaust flow (i.e., a concentration factorof 4 to 20). Consequently, capital and operating costs for an add-on emission control device canbe reduced significantly. A concentrated stream reduces or eliminates the auxiliary fuel requiredto operate an incinerator, resulting in a decrease in operating cost and related emissions ofcarbon and nitrogen oxides. Regenerative and recuperative thermal oxidation and catalyticoxidation units are typically used for final destruction. Selection of a destruction unit is basedon the expected life of operation, required destruction efficiency, and operating cost.
Costs. Capital and operating cost data are presented in Appendix A and the spreadsheetcost model is presented in Appendix B.
4.2.1.5 Fluidized-Bed Preconcentration System
Process Description. The fluidized-bed preconcentration system applies newlydeveloped spherical adsorption materials in a fluidized-bed adsorption unit and followed byeither a fluidized-bed or moving-bed desorption unit. This system is particularly useful in largeair flow and low VOC concentration applications. Theoretically, a high concentration factor orvolume reduction ratio, as high as 800-1,000 to 1, can be achieved for odor control applicationwhen the inlet loading is in the few-ppm range.
The basic fluidized-bed preconcentration system consists of the following generalsections: adsorber, desorber, condenser or oxidizer, process fan, media transfer blower, andplumbing for VOCs recovered from condenser. Figure 4-10 shows a flow diagram of the

34
Figure 4-10
35
REECO/EC&C fluidized-bed preconcentrator system with an oxidizer (Biedell and Cowles,1996). The adsorber vessel consists of a series of perforated trays. Process gas enters the vesselin the bottom section and is directed upward through the trays. The VOCs in the process gas areadsorbed by a beaded carbonaceous adsorbent (BCA) medium. The regenerated BCA mediumconstantly enters the top of the adsorber, providing countercurrent VOC removal. The spentBCA medium is transferred to the desorber by an airlift blower.
The desorber section could be a smaller fluidized-bed similar to the adsorber. The ratioof adsorber and desorber sizes can be designed to achieve the desired concentration factor of thedesorbate. The flow diagram incorporates a small oxidizer for final treatment. The flue gasprovides the energy for desorption. As the BCA medium is heated, a very small volume of inertcarrier gas flows through the desorber and carries the desorbate out of the desorber. Auxiliaryair is added in sufficient quantity to oxidize the VOC in inert gas stream. The design allows forvery small desorbate volume and makes the subsequent oxidation very economical.
The system has both condensation and oxidation options. The high-concentratio/low-volume offgas can be directed to either posttreatment device. For the condensation option, theunit has a separater/decanter to separate VOCs and water. The VOC is then pumped to thestorage vessel. If an oxidation unit is used, the size of the oxidizer can be determined from theconcentration and flow rate of the offgas.
Applicability to FRP/C Processes. There are no known applications of a fluidized-bedpreconcentration system on FRP/C processes in the United States. The system can be used forany application that would normally use standard fixed-bed carbon adsorbers. The system hasbeen used for odor control and demonstrated for halogenated solvents, methyl ethyl ketone(MEK), and other similar compounds.
Standard Operating Conditions. The system is suitable for treating diluted VOCemissions at ambient temperature and at 35 to 50 percent relative humidity. For the oxidationoption, the desorbing gas, air, is heated to 177 C (350 F) to strip VOCs from the BCA mediumo o
in the desorber. For the condensation option, an electric heater is used to raise the temperatureof the BCA medium in the desorber, then nitrogen is blown to remove VOCs from the BCAmedium for subsequent condensation. According to the vendor, there is very little pressure dropin the adsorber and the BCA medium has good resistance to attrition (less than 2 percent peryear). The vendor also claims that simplicity of design and few moving parts provide easy, lowmaintenance and high reliable operation.
Control Efficiency. EC&C’s experience has shown that general efficiencies in the rangeof 90 to 95 percent can be expected for most VOCs (Merboth, 1996). However, controlefficiency for styrene emissions has not been demonstrated.
Advantages/Disadvantages. The fluidized-bed preconcentration system offers a highconcentration factor for diluted VOC emissions (e.g., odor control). The fluidized-bed adsorber
36
design has a lower pressure drop and results in lower energy consumption than a fixed-bedadsorber. The fluidized-bed system uses less adsorbent than a fixed bed adsorber; therefore, itminimizes equipment size and weight. The concentration factor is determined by the inletconcentration and desorbing concentration. For safety reasons, the allowable concentration inthe desorbing stream should not exceed 25 percent of the LEL. In the case of styrene emissions,25 percent of the LEL is 2,500 ppm styrene. Therefore, the concentration factor will be 250when a 10-ppm stream is concentrated to 2,500 ppm. However, the concentrator factor will be10 when a 250-ppm stream is concentrated to 2,500 ppm. The concentration factor may behigher when the condensation option is used and the VOC is recovered as liquid.
Costs. Capital and operating cost data are presented in Appendix A and the spreadsheetcost model is presented in Appendix B. 4.2.2 Biofiltration
Biofiltration is a biologically based treatment technology. It uses microorganisms in afilter medium to control organic compound emissions in an air stream. Air emissions containingbiodegradable constituents pass through a biologically active medium. The microorganismsdegrade the organic constituents in the air stream to essentially carbon dioxide and water. Biofiltration has been used for many years in Europe, Japan, and the United States for odorcontrol, but the use of biofiltration to degrade more complex air emissions from chemical plantshas occurred only within the past few years. Descriptions for two types of biofilter systems arepresented here.
4.2.2.1 Biofiltration System
Process Description. First, contaminated air enters a preconditioning unit, where thetemperature, moisture level, and particulate matter of the gas are adjusted as needed. The air isthen evenly distributed and passed once through a packed bed. The biofilter contains packingthat houses microorganisms (Figure 4-11). A moist film of microorganisms is attached to astationary synthetic or natural packing material such as peat, compost, leaves, wood bark, and/orsoil. The biofilter can be optimized for moisture and nutrient levels, pH control, pressure drop,and adsorptivity. Within the packed bed, contaminates pass from the air into the biomass, wherethey are biologically destroyed. Instrumentation and process controls are provided as needed.
Standard Operating Conditions. Biofilter systems for VOC control are strongly affectedby the choice of the attachment medium for microorganisms. Ideal attachment media arecharacterized by a high specific surface area, minimal backpressure, and a suitable surface forthe attachment of microorganisms. Biofilter media are mainly of two types: (1) a natural organic medium composed of peat, compost leaves, wood bark, and/or soil, or (2) an inert syntheticmedium. However, a combination of both types is sometimes used.

37
Figure 4-11
38
Flow rate, humidity, pH, pressure drop, temperature, growth of biomass, and bacteriacount are critical operating parameters for biofiltration systems. Depending on designspecifications, units may be equipped to continuously measure some of these parameters. Forexample, the AMT biofiltration system at Fiberform AB maintains a pH range of 5 to 7, and thepressure drop ranges from 1,000 to 2,000 Pa (0.145 to 0.29 psia).
Control Efficiency. Mr. Munters of AMT (Munters, 1995) describes biofiltration as“nature’s own way of cleaning VOCs and odors” with obtainable control efficiency as high as 99percent. According to Mr. Munters, some facilities do not measure removal efficiency;however, a Swedish company, Fiberform AB, has an integrated biofilter/heat exchange systemdesigned to achieve 80 to 85 percent styrene reduction in a 284 m /min (10,000 cfm) stream. 3
The system was installed in 1991, and the company has not experienced any problems with thesystem.
In facilities that do not measure removal efficiency, Mr. Munters said “one can smellthe emitted VOC when the biofilter is not working properly”. He also added that often flameionization detectors (FID) are used to measure emissions, and, when moisture content, pH, andtotal microorganisms are monitored, additional monitoring is not necessary. He stated thatcontrolling the humidity is important for preventing channeling. AMT’s systems come equippedwith a computer-operated moisture controller. Although styrene has low solubility in water,according to Mr. Munters, the biomass is porous and acts as a molecular sieve.
Applicability to FRP/C Processes. A Swedish company, Fiberform AB, thatmanufactures fiberglass hard tops for trucks and other parts, uses an AMT biofiltration systemthat was installed in 1991 to treat styrene emissions. The biofiltration system is an integratedprefabricated concrete structure with a filter bed area of 139 m (1,500 ft ). It treats an air flow2 2
of 283 m /min (10,000 cfm). Fiberform AB operates 8 hours per day and is closed for a 2-week3
vacation annually. The system is designed to achieve 80 to 85 percent styrene reductions. Moisture content and total microorganisums are monitored periodically. Fiberform AB has notexperienced any problems with this system.
Dr. P. Togna with Envirogen told RTI (Togna, 1995) that information on the Europeanbiofiltration systems for styrene treatment has been shared mainly through conversation and notthrough published information. Although biofiltration is a proven technology that is widely usedin Europe, Dr. Togna said that he had not read or seen many published papers or articlesdiscussing styrene treatment. By personal communication, he has learned that several Europeanbiofiltration systems have observed decreased removal efficiency after 4 to 5 months whentreating styrene. Researchers hypothesize that the decreased efficiency is attributed to buildupof an acid byproduct (Togna, 1995).
A Dutch research group, TNO, has developed a biofilter system to alleviate thisproblem. TNO is investigating the longevity of the system through a long-term bench- and pilot-scale styrene study. Envirogen and a Dutch company have a joint venture called CVT America.
39
CVT America has potential access to license TNO’s technology through a sister company calledCVT Bioway. (CVT Bioway is a separate company from CVT America.) TNO is performingtheir field-pilot styrene project with CVT Bioway in the Netherlands. The TNO system has beenin operation for about 9 to 12 months, and styrene removal of 90 percent and greater has beenmaintained (Togna, 1995).
4.2.2.2 Biotrickling Filter System
Process Description. Contaminated air enters the biotrickling filter (Figure 4-12) andflows concurrently with recirculating water downward through a column filled with packingmaterial. Microorganisms grow as a biofilm on the packing material and destroy thecontaminants as they pass through the system. Biotrickling filters that employ synthetic,inorganic media (e.g., a monolithic channelized medium and a pelletized ceramic medium) yieldmore uniform gas distribution and biological contact than those that do not. Thesecharacteristics result in more consistent operation due to better overall pressure drop control andbetter nutrient and pH control. Superior performance was obtained with effluent recycle, which controlled pHand provided microbe reseeding. The recirculation water allows for optimal control of pH,nutrient levels, and biofilm thickness. Biotrickling filter systems can be supplied in standard orsemi-custom sizes, with instrumentation and control packages provided as needed.
Control Efficiency. Envirogen has developed a biotrickling system for treatment ofstyrene to overcome the acid buildup problem. Envirogen’s biotrickling filter system has notbeen proven in the field. However, a system has been designed to treat an air stream at achemical manufacturing facility that emits styrene. The styrene-contaminated air comes fromsequencing batch reactors at the facility’s wastewater treatment system. The flow rate of the airstream is approximately 40 m /min (1,400 cfm) with a styrene concentration of about 150 ppmv. 3
Because of customer constraints, Envirogen was not required to guarantee the removalefficiency of the system. However, the operating conditions of the system, such as pH andbiomass growth control, are guaranteed. A removal efficiency of 50 percent is sufficient tomeet the goals of the customer, but a removal efficiency of 90 percent is expected (Togna,1995).
Advantages/Disadvantages. Biofiltration and biotrickling systems have severaldifferences. Biotrickling systems typically contain packing that is a structured or randomlypacked synthetic material designed not to plug. Liquid is constantly recirculated over packing material in a biotrickling filter system, and fresh makeup water and nutrients are added asneeded. Acid intermediates are washed away continuously. Packing in a biofiltration system istypically organic matter, such as compost and/or wood chips, that may swell and/or compactover time. Biofiltration systems typically operate at a moisture content of 50 percent (slightlymore or less depending upon the application), without a liquid recirculation loop. Overall,biotrickling filter systems can handle higher concentration loadings than biofilter systems(Togna, 1992).

40
Although styrene has low solubility in water, Dr. Togna said that a driving force forstyrene transfer into the water/biofilm phase is always present due to microbial degradation ofstyrene. The biological matter on the packing material adsorbs and degrades the styrene.

41
Figure 4-12
42
Polymerization should not be a problem, even if some carbon is added to the packing material asa load buffer. Styrene concentration should be low enough, and microbial activity fast enough,for degradation effects to take place before polymerization is likely to begin. However, Dr.Togna has not seen any reports confirming his hypothesis (Togna, 1995).
When asked to explain why biofiltration was popular in Europe, Dr. Togna stated thatpeople live closer together in Europe and that odor control is an issue. Biofiltration was firstdesigned to eliminate that problem. Because energy -- natural gas and oil -- is more expensive inEurope compared to the United States, biofiltration was accepted over incineration as the mostviable odor treatment option. Europeans then found that biofiltration could also be used forVOC applications in response to Europe’s strict environmental laws. Dr. Togna and others inthe biofiltration community believe that biofiltration systems that were not initially designed tohandle VOC applications are now experiencing decreased removal efficiency when used forVOC applications. No studies were done initially to evaluate the longevity of these systems forVOC applications. Envirogen and its partner have since done research to address these issues(Togna, 1995).
4.2.3 Ultraviolet/Oxidation Technology
VM Technologies, Inc. (Lake Forest, CA) and Terr-Aqua Enviro Systems, Inc.,(Fontana, CA) both provide integrated ultraviolet/oxidation technologies to destroy VOCemissions. The VM system has been used for air, water, and wastewater treatment. Its modulardesign allows the system to handle exhaust flow rates from 1,400 to 6,400 m /min (50,000 to3
225,000 cfm). The Terr-Aqua system has been installed in several metal parts surface coatingoperations to treat a variety of VOCs. It was designed to handle exhaust stream flow ratesranging from 57 to 3,400 m /min (2,000 to 120,000 cfm). 3
Process Description. A basic schematic of the ultraviolet/oxidation system is shown inFigure 4-13. The system treats VOC emissions from exhaust streams from paint spray booths,curing ovens, paint mixing rooms, solvent cleaning, paint stripping facilities. The air treatmentprocess follows these steps:
1. Contaminated air is filtered to remove any particulate matter. 2. Once particulate matter are removed, the VOCs are exposed to ultraviolet light and
ozone. This preoxidation step breaks down the VOCs. 3. The air stream is sprayed with a mist in a contact chamber or through a packed-bed
scrubber, and the VOCs are absorbed into the water. This contaminated water issubjected to more ozone in an aqua reactor and is filtered to remove particulate matter.
4. The exhaust air passes through carbon beds to remove any remaining VOCs.5. The carbon is regenerated with ozone to destroy any VOCs adsorbed.
Standard Operating Conditions. Acceptable operating conditions for exhaust air streamstreated with the ultraviolet/oxidation system are as follows (Shugarman, 1996):
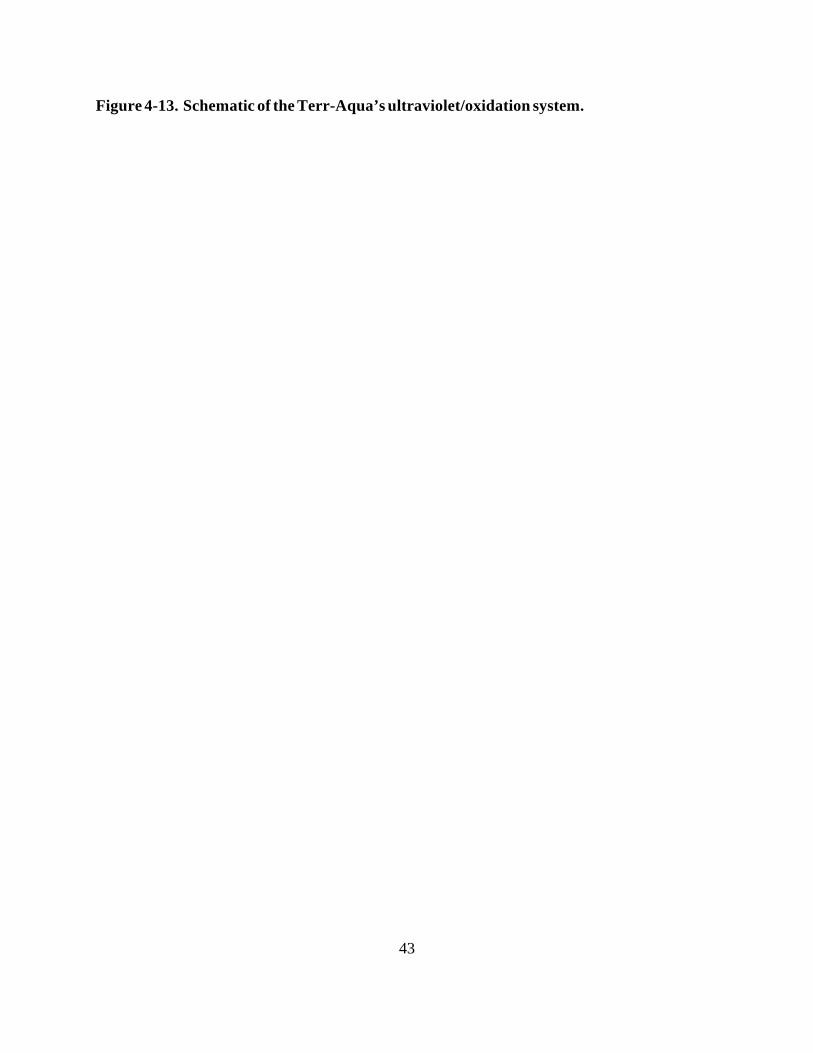
43
Figure 4-13. Schematic of the Terr-Aqua’s ultraviolet/oxidation system.
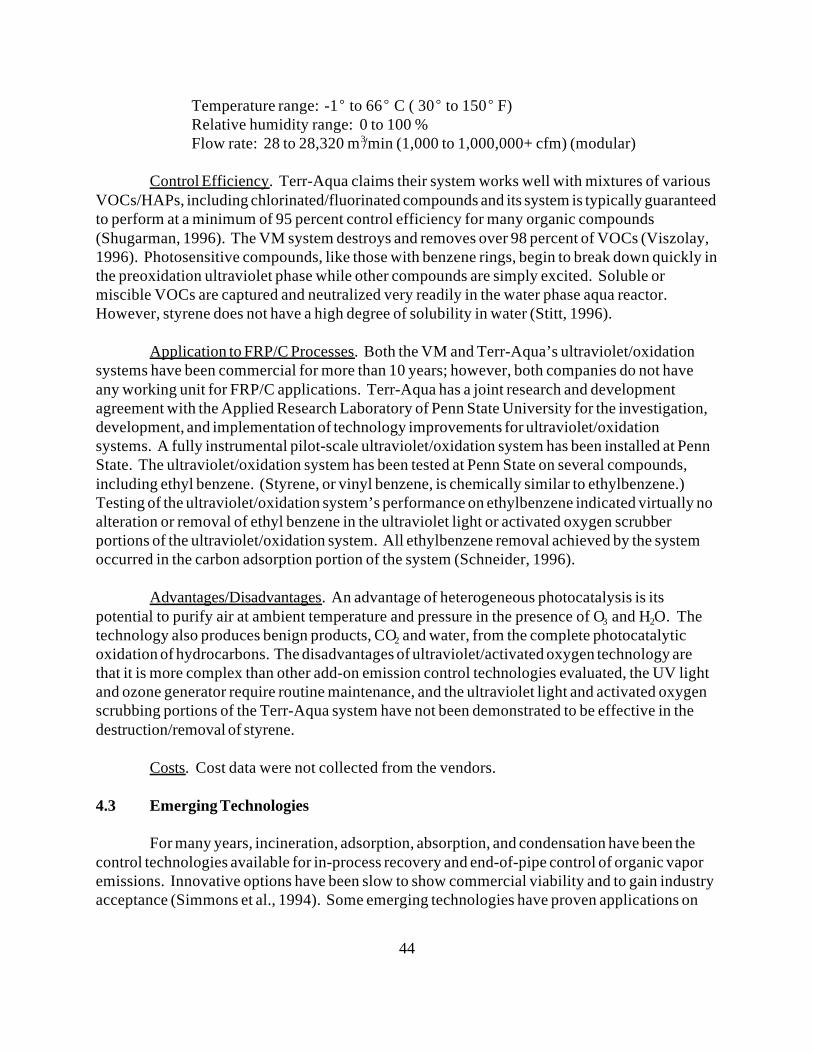
44
Temperature range: -1 to 66 C ( 30 to 150 F)Relative humidity range: 0 to 100 % Flow rate: 28 to 28,320 m /min (1,000 to 1,000,000+ cfm) (modular)3
Control Efficiency. Terr-Aqua claims their system works well with mixtures of variousVOCs/HAPs, including chlorinated/fluorinated compounds and its system is typically guaranteedto perform at a minimum of 95 percent control efficiency for many organic compounds(Shugarman, 1996). The VM system destroys and removes over 98 percent of VOCs (Viszolay,1996). Photosensitive compounds, like those with benzene rings, begin to break down quickly inthe preoxidation ultraviolet phase while other compounds are simply excited. Soluble ormiscible VOCs are captured and neutralized very readily in the water phase aqua reactor. However, styrene does not have a high degree of solubility in water (Stitt, 1996).
Application to FRP/C Processes. Both the VM and Terr-Aqua’s ultraviolet/oxidationsystems have been commercial for more than 10 years; however, both companies do not haveany working unit for FRP/C applications. Terr-Aqua has a joint research and developmentagreement with the Applied Research Laboratory of Penn State University for the investigation,development, and implementation of technology improvements for ultraviolet/oxidationsystems. A fully instrumental pilot-scale ultraviolet/oxidation system has been installed at PennState. The ultraviolet/oxidation system has been tested at Penn State on several compounds,including ethyl benzene. (Styrene, or vinyl benzene, is chemically similar to ethylbenzene.) Testing of the ultraviolet/oxidation system’s performance on ethylbenzene indicated virtually noalteration or removal of ethyl benzene in the ultraviolet light or activated oxygen scrubberportions of the ultraviolet/oxidation system. All ethylbenzene removal achieved by the systemoccurred in the carbon adsorption portion of the system (Schneider, 1996).
Advantages/Disadvantages. An advantage of heterogeneous photocatalysis is itspotential to purify air at ambient temperature and pressure in the presence of O and H O. The3 2
technology also produces benign products, CO and water, from the complete photocatalytic2
oxidation of hydrocarbons. The disadvantages of ultraviolet/activated oxygen technology arethat it is more complex than other add-on emission control technologies evaluated, the UV lightand ozone generator require routine maintenance, and the ultraviolet light and activated oxygenscrubbing portions of the Terr-Aqua system have not been demonstrated to be effective in thedestruction/removal of styrene.
Costs. Cost data were not collected from the vendors.
4.3 Emerging Technologies
For many years, incineration, adsorption, absorption, and condensation have been thecontrol technologies available for in-process recovery and end-of-pipe control of organic vaporemissions. Innovative options have been slow to show commercial viability and to gain industryacceptance (Simmons et al., 1994). Some emerging technologies have proven applications on
45
air streams of specific manufacturing processes. Other emerging technologies are just beginningto be explored via field applications and pilot testing, after undergoing several years oflaboratory evaluations. Information on several of the available emerging technologies isprovided here. One of these new technologies is based on membranes that selectively allowpermeation of organic compounds in preference to air. Another is photocatalytic oxidation,which takes place at ambient temperatures in the presence of ultraviolet light.
4.3.1 Membrane Technology
Membrane vapor recovery technology is based on membranes that selectively permeateorganic compounds in preference to air. The transformation of membrane separation from alaboratory study to an industrial process was the development, in the early 1960s, of the Loeb-Sourirajan process for making defect-free, high-flux, ultrathin membranes for reverse osmosis(Baker and Wijmans, 1994). Membrane separation, developed over the past 10 years, isbeginning to prove its commercial viability and is emerging as an alternative or complementaryrecovery technology for several industrial applications (see Table 4-5), such as vent gas controland recovery, gasoline vapor recovery, and other applications under development (Baker andWijmans, 1994). Membrane separation systems are proving effective at recovering organicvapors from concentrated gas streams before the final vent. In addition, they can be combinedwith other air pollution control technologies to offer compelling advantages (Simmons et al.,1994).
Table 4-5. Selected Commercial Applications for Membrane Separation (Source: Baker and Wijmans,1994).
CFCs from storage tank filling Sterilizer vent gas recovery
Industrial chiller refrigerant recovery Vinyl chloride from PVC manufacture
HCFC-123 from coating operation Solvents from pharmaceutical process
Aerosol inhaler propellant process Perfluorocarbon recovery
CFC = Chlorofluorocarbon, PVC = Polyvinyl chloride.
Process Description. Many types of modules are used for membrane separations. Thediagram shown in Figure 4-14 represents a simplistic arrangement of only one of these options. A selective barrier layer, the membrane, separates a feed and a retentate stream from adownstream permeate stream (Koros, 1995).
Three membrane separation modules have been developed by several companies. Membrane Technology and Research, Inc. (MTR), in Menlo Park, California, and Nitto Denki inJapan use spiral-wound modules; GKSS Forshungszentrum Geesthacht GmbH (GKSS) inGeesthacht-Terperhude, Germany, and its licensees use plate-and-frame modules (Baker andWijmans, 1994); Hoechst-Celanese Corporation has developed a hollow-fiber membranecontactor (Freeman, 1995; Prasad, 1995). Schematics of a spiral-wound, a plate-and-frame,
46
Figure 4-14. Diagram of a simple membrane module.
and a hollow-fiber contactor are illustrated in Figure 4-15. Spiral-wound modules are compact. Plate-and-frame systems are thought to offer advantages in flow distribution and reducepermeate-side pressure drops. The hollow-fiber contactor design has a high-membrane surfacearea (Prasad, 1995).
A basic membrane system for organic emissions control consists of two steps: acompression-condensation step followed by a membrane separation step. The compression-condensation step is conventional. The membrane separation step is based on high-performancecomposite membranes that are 10 to 100 times more permeable to organic compounds than toair (Jacobs et al., 1993).
A vapor-air mixture is compressed to 3.1 × 10 to 1.4 × 10 N/m (45 to 200 psig). The5 6 2
compressed mixture is sent to a condenser where it is cooled. Part of the organic vaporcondenses and is then directed to a solvent storage tank for recycling or reuse. Thenoncondensed portion of the organic mixture enters the membrane modules and passes acrossthe surface of an organophilic membrane. The organophilic membrane separates the gas intotwo streams, consisting of a permeate stream and a solvent-depleted stream. The permeatestream contains most of the remaining solvent vapor for the condenser. The solvent-depletedstream, or vent, is essentially stripped of the organic vapor. Permeate is drawn back into theinlet of the compressor, and the solvent-depleted air stream is vented from the system. This two-step process is illustrated in Figure 4-16 (Jacobs et al., 1993).
Transport through the membranes is induced by maintaining the proper pressuredifference. Vapor pressure on the permeate side of the membrane must be lower than on thefeed side to provide the driving force for permeation. The pressure difference is obtained bycompressing the feed stream of the membrane modules, as in Figure 4-16, or by using a vacuum

47
Figure 4-15

48
Figure 4-16
49
on the permeate side. Occasionally, a combination of both techniques is used (Jacobs et al.,1993).
The key element in the process is a composite membrane that selectively allowspermeation of organic compounds over air. Air and organic vapors permeate the membrane atrates dependent upon their relative permeabilities and the pressure difference across themembrane. To achieve effective and economical separation, the described membrane systemillustrated in Figure 4-16 must meet three requirements:
1. The membrane materials must have adequate selectivity to remove organic vapors fromair.
2. These materials must be formed into high-flux, defect-free membranes. 3. These membranes must be formed into space-efficient, low-cost membrane modules
(Jacobs et al., 1993).
Standard Operating Conditions. A key consideration in achieving separation with amembrane system is the selectivity of the membrane used. The composite membrane mustselectively allow permeation of organic compounds over air. However, operating conditionsalso affect system performance. One of the most important operating parameters is the pressureratio across the membrane. The pressure ratio is the feed pressure divided by the permeatepressure. To provide the driving force for permeation, partial vapor pressure on the permeateside of the membrane must be lower than on the feed side.
The second operating condition that affects membrane system design is the degree ofseparation required. The usual goal is to produce a residue stream essentially stripped of organicvapor, while simultaneously producing a small, concentrated permeate stream from whichorganic recovery is straightforward. These two requirements cannot be fully metsimultaneously; therefore, a tradeoff must be made between vapor removal from the feed gasand permeate enrichment for the membrane system. The design term used to deal with thistradeoff is stage cut. Stage cut is the fraction of the total flow that permeates the membrane. Itis equal to the permeate flow rate divided by the feed flow rate, expressed as a percentage.
Because of limitations of membrane selectivity and achievable pressure ratio, it is oftenimpossible to separate two components adequately in one pass through a membrane system. However, better separation can be achieved using a multistage system, a multistep system, or asingle membrane unit with a recycle system. In a multistage system, the permeate travels fromthe first membrane separation unit to one or more additional membrane separation steps. In amultistep system, the residue from the first membrane separation unit travels to one or moreadditional membrane separation steps. In a single membrane unit with a recycle system, thepermeate is combined with the feed stream.
Control Efficiency. Air and organic vapors permeate the membrane at rates determinedby their relative permeabilities and the pressure difference across the membrane. Because the
50
membrane is 10 to 100 times more permeable to organic vapor than air, a significant enrichmentof organic vapor on the permeate side of the membrane is achieved. Depending on the systemdesign, between 90 and 99.99 percent of the organic vapor is removed from the feed stream bythe MTR process (Jacobs et al., 1993).
Using a vacuum and blower system instead of the compressor-condenser system, thehollow-tube modular system used in the Hoechst-Celanese process can achieve 50 to 90 percentrecovery for organic streams containing 1.5 to 3 percent organic by volume. The outlet streamfrom the modules continues to another polishing step. This entire process may produce a 99+percent recovery dependent upon the membrane surface area, the flow rate of the inlet stream,the pressure drop across the membrane, and the polishing steps (Prasad, 1995).
Applicability to FRP/C Processes. Based on current information, direct application ofmembrane technology as a viable emission control approach is best suited for treatingconcentrated streams (greater than 1,000 ppm) (Simmons et al., 1994; McInnes, 1995). ForFRP/C processes, membrane technology could possibly be used following a preconcentrationstage where the VOC concentration is maximized and the total air flow is minimized. Theusefulness of membrane technology as a control technology will be judged by its cost,effectiveness, operations, and reuse of recovered styrene. Applications for membrane vaporrecovery technology for FRP/C processes have not been identified.
Advantages/Disadvantages. The membrane separation process requires no desorptionstep, unlike carbon adsorption, and produces no secondary waste stream that needs furthertreatment or disposal. The membrane vapor recovery process, which combines compression-condensation with a membrane separation step, allows for recovery at higher temperatures andprovides a constant recovery efficiency despite fluctuation in the feed stream conditions. Thiscombination of two individual recovery methods exploits the advantage of each method,resulting in an optimized process that achieves better results, at higher efficiency, than can beobtained from either method alone. However, the membrane vapor recovery process is notefficient at high air flow rates and low inlet concentrations typically found in the FRP/Cprocesses. Even when styrene emissions from the FRP/C process are preconcentrated, theprocess may not be cost-effective to recover styrene. Also, the quality of recovered styrene hasnot been evaluated for reuse in resin formulation.
Costs. Membrane system costs increase in proportion to the flow rate of the inlet streamto be treated but are relatively independent of the organic vapor concentration in the stream(Simmons et al., 1994; Baker and Wijmans, 1994). In addition, costs vary from system tosystem and are primarily determined by compression, vacuum, and piping requirements (Pinnau,1995). Because of the current stage of development, cost data were not requested from thevendors.
51
4.3.2 Photocatalytic Oxidation
Heterogeneous photocatalysis is an emerging technology that can be used to treat VOCsin air. It is an ambient temperature process in which the surface of an illuminatedsemiconductor acts as a chemical reaction catalyst. Peral and Ollis at North CarolinaState University presented research on the use of near-ultraviolet light to decompose VOC on acontinuously activated semiconductor oxide, TiO (Peral and Ollis, 1991, 1992). Their studies2
suggest that gas-solid photocatalysis may have broad potential for the destruction of a range ofair contaminants at room temperature. They present a brief overview of previous work and morerecent experimental results for the heterogeneous photocatalytic oxidation of trace levelcontaminant oxygenates: acetone, 1-butanol, butyraldehyde, and formaldehyde in humidifiedair. Styrene was not analyzed in this study. However, their studies show that the degradation ofthose organics takes place over illuminated TiO , presumably to CO . A schematic of the2 2
heterogeneous photocatalysis system is shown in Figure 4-17.
Process Description. The oxidation reaction takes place at ambient temperature in thepresence of ultraviolet light on the illuminated surface of some metal oxides, such as TiO , or2
sulfides that have semiconductive properties. Upon total oxidation in the presence of ultravioletlight, the reaction converts VOCs into carbon dioxide and water. The semiconductor surfaceacts as a catalyst for the oxidation of VOC in air (Peral and Ollis, 1991, 1992).
Standard Operating Conditions. Heterogeneous photocatalytic oxidation offers thepossibility of operation at ambient temperature. Using photocatalytic oxidation to treat dilutemixtures of toluene, Sauer et al. (1995) observed an increase of toluene conversion to 100percent with the addition of chlorinated compounds, 1,1,3-trichloropropene (TCP) orperchloroethylene (PCE). Enhanced photocatalytic reaction rates have also been observed whentrichloroethylene (TCE) was added to air lightly contaminated with iso-octane, methylenechloride, or chloroform (Berman and Dong, 1993).
Apparent quantum yields exceeding 100 percent have often been measured forphotocatalytic oxidation of TCE. (Quantum yield is the measurement of the number ofmolecules converted per photon adsorbed on a reactive surface.) These high photon efficienciesindicate that chain reactions occur on the TiO surface (Sauer et al., 1995). Moisture also has2
varying effects on the conversion rates of organic compounds. For example, trace water additionenhanced the conversion of m-xylene, but conversion was inhibited when higher water levelswere added (Peral and Ollis, 1992).
Control Efficiency. The possibility of using photocatalytic purification to treat VOC-laden air streams depends primarily on identifying conditions in which the apparent quantumyield for contaminant disappearance is near or above 100 percent. With feed stream levels of 10to 20 percent toluene, Sauer et al. (1995) observed increased photocatalytic reaction rates fortreatment of dilute (10 to 750 mg·m ) mixtures of toluene and TCP.-3

52
Figure 4-17
53
Applicability to FRP/C Processes. Documented information on the use ofheterogeneous catalysis technology for styrene control has not been published. However severalstudies have been demonstrated to prove photocatalytic conversion of aromatic compoundsincluding toluene, m-xylene, and ethyl benzene (Ibusuki and Takeuchi, 1986; Peral and Ollis,1992; Sauer et al., 1995; d’Hennezel and Ollis, 1995).
Advantages/Disadvantages. According to process cost estimates by Miller and Fox(1993), photocatalytic treatment of lightly contaminated air is commercially viable only forconversions of high-quantum-yield reactants such as trichloroethylene or methanol/ethanol. Inaddition, gas-solid photocatalytic oxidation of air contaminants has been proven for a broadrange of contaminant classes -- aromatics, ketones, aldehydes, alcohols, etc. However, quantumyields for such conversion are often mediocre and may require the addition of chlorinatedcompounds to improve quantum efficiency. All branched aromatic photocatalyzed degradationrates are enhanced by TCE addition (d’Hennezel and Ollis, 1995). The final products observedduring photocatalytic oxidation of TCE were CO and HCl. However, no gas phase2
intermediates were detected after photochemical degradation of aromatic compounds mixedwith TCE in the study done by d’Hennezel and Ollis (1995).
Costs. Miller and Fox discussed the commercialization prospects for photocatalytic airtreatment of several contaminated air streams (Miller and Fox, 1993; Sauer et al., 1995). Theoperating and capital costs for treatment of four contaminated air streams were estimated. Thefour contaminated air streams were: (1) soil vapor extract (100 ppm TCE), (2) air stripper vent(50 ppm benzene, 250 ppm other VOC), (3) product dryer vent (including 25 ppm methanol, 25ppm ethanol), and (4) a paint drying vent (10 ppm xylene, odors, plasticizers, surfactants). Economic estimates of these processes suggest that photocatalytic treatment of TCE ormethanol/ethanol is cost-competitive for these two high-quantum-yield reactants (d’Hennezeland Ollis, 1995; Sauer et al, 1995; Miller and Fox, 1993). However, cost estimates for treatmentfor styrene-contaminated air streams were not included.
References
Baker, R.W., and Wijmans, J.G. Membrane Separation of Organic Vapors from Gas Streams. In:Paul, D.R. and Yampoliskii, Y.P. (eds.), Polymeric Gas Separation Membranes. CRC Press,Inc., Boca Raton, FL, 1994. pp. 353-397.
Berman, E., and Dong, J., in “The Third International Symposium on Chemical Oxidation:Technology for the Nineties” (W.W. Eckenfelder, A.R. Bowers, and J.A. Roth, Eds.) TechnomicPublishers, Chicago, IL, 1993. p. 183.
Bethea, R.M. Air Pollution Control Technology. New York, NY, Van Nostrand ReinholdCompany. 1978. p. 395.
54
Biedell E.L. (REECO) and Cowles, H. (Environmental C&C, Inc.), A Novel Pre-ConcentrationTechnology for VOC and Air Toxics Control. Presented at the Air and Waste ManagementAssociation’s Specialty Conference on “Emerging Solutions to VOC and Air Toxics Controls”,February 28-March 1, 1996, Clearwater, FL.
Bonner, D., Premix Inc., Personal communication with Emery Kong, Research TriangleInstitute, November 7, 1995.
Cooper, C.D. and Alley, F.C. 1986. Air Pollution Control: A Design Approach, pp. 305-335,and Appendix B.
CRC Press, Handbook of Chemistry and Physics, 53 Edition, 1972.rd
Danielsson, M., Weatherly, Inc. Facsimile to Greg LaFlam, Pacific Environmental Services,April 26, 1995.
d’Hennezel, O., and Ollis, D.F., Trichloroethylene-Promoted Photocatalytic Oxidation of AirContaminants. Unpublished paper. Department of Chemical Engineering, North Carolina StateUniversity. November 28, 1995.
Farmer, J.R., EPA, Office of Air Quality Planning and Standards. Memorandum andattachments, to Distribution. Thermal Incinerator Performance for NSPS. August 22, 1980.
Felix, L., et al., Southern Research Institute, Evaluation of the Polyad FB Air Purification andSolvent Recovery Process for Styrene Removal, EPA-600/R-93-212 (NTIS PB94-130317),November 1993.
Freeman, B., North Carolina State University, Personal communication with Sonji Turner,Research Triangle Institute, September 14, 1995.
Gribbon, S.T., Englehard Corporation. Regenerative Catalytic Oxidation, Presented at the Air &Waste Management Association’s Specialty Conference: “Emerging Solutions to VOC and AirToxics Control”, Clearwater, FL, February 27, 1996.
Gupta, A., Durr Industries, Inc., Facsimiles to Emery Kong, Research Triangle Institute,February 23 and 27, 1996.
Haberlein, R.A. and Boyd, D.P.; Maximum Achievable Control Technology for a HypotheticalFiberglass Boat Manufacturing Facility, prepared for J. McKnight, National MarineManufacturers Association, Washington, DC; August 1, 1995.
55
Ibusuki, T., and Takeuchi, K., Toluene Oxidation on U.V.-Irradiated Titanium Dioxide with andwithout O , NO , or H O at Ambient Temperature. Atmospheric Environment 20:9, 1986. 2 2 2
pp. 1711-1715.
Jacobs, M.L., Baker, R.W., Kaschemekat, J., and Simmons, V.L., Industrial Applications forMembrane Vapor Recovery Systems. Presented at the 86th Annual Meeting and Exhibition. Airand Waste Management Association, Denver, Colorado, June 13-18, 1993.
Koros, W.J. Membranes: Learning a Lesson from Nature. Chemical Engineering Progress. 91:10, 1995.
LaFlam, G., Pacific Environmental Services, Memorandum to Madeleine Strum, U.S. EPA,“Site Visit -- Glastic Corporation”, November 18, 1993.
LaFlam, G., Pacific Environmental Services, Memorandum to Plastic Composites NESHAPPre-MACT Team and Work Group Members, Summary of Vendor Teleconference, June 28,1995a.
LaFlam, G., Pacific Environmental Services, Personal communication with Emery Kong,Research Triangle Institute, Research Triangle Park, NC, October 3, 1995b.
McInnes, R.G., Explore New Options for Hazardous Air Pollutant Control. ChemicalEngineering Progress. 91:11, 1995.
Merboth, J., Environmental C&C, Inc., Letter to Emery Kong, Research Triangle Institute,March 28, 1996.
MIAB, Test Results for MIAB Fluidized Bed System, 1995.
Miller, R., and Fox, R., in “Photocatalytic Purification and Treatment of Water and Air” (D.F.Ollis and H. Al-Ekabi, Eds.) Elsevier, London, 1993. p. 573.
Munters, A., Ahlqvist and Munters Technologies, Inc., personal communication, November 1,1995.
National Academy Press. Prudent Practices for Disposal of Chemicals from Laboratories. National Academy Press. Washington, DC. 1983.
Patkar, A.N., Reinhold, J.M., and Henderson, G.; “Demonstration of Capture and ControlEfficiency for a Styrene Emission Source,” AWMA paper number 94-RA111.03, in Proceedingsfor the Air and Waste Management Association 87th Annual Meeting & Exhibition,Cincinnati, OH, June 19-24, 1994.
56
Peral, J. and Ollis, D.F., Heterogeneous Photocatalysis for Air Purification. Presented at the1991 Summer National Meeting of the American Institute of Chemical Engineering, August 20,1991.
Peral, J., and Ollis, D.F., Heterogeneous Photocatalytic Oxidation of Gas-phase Organics for AirPurification: Acetone, 1-Butanol, Butyraldehyde, Formaldehyde, and M-Xylene Oxidation. Journal of Catalysis. 136, 1992. pp. 554-565.
Pinnau, I., Membrane Technology and Research, Personal communication with Sonji Turner,Research Triangle Institute, September 19, 1995.
Prasad, R., Hoechst-Celanese Corporation, Personal communication with Sonji Turner, ResearchTriangle Institute, September 20, 1995.
Purcell, R., and Shareef, G.S. Control Technologies for Hazardous Air Pollutants, EPA-625/6-86-014 (NTIS PB91-228809), September 1986.
Radian Corporation. Catalytic Incineration for Control of VOC Emissions. Park Ridge, NJ,Noyes Publications, 1985. pp. 4-5.
Ross-Bain, J., Weatherly, Inc., Personal communication with Mark Bahner, Research TriangleInstitute, March 5, 1996.
Sanderford, B., U.S. Environmental Protection Agency, Office of Air Quality Planning andStandards, Alternative Control Techniques Document -- NO Emissions from Process Heater,x
EPA-453/R-93-015 (NTIS PB93-186211), February 1993.
Sauer, M.L., Hale, M.A., and Ollis, D.F., Heterogeneous Photocatalytic Oxidation of DiluteToluene-Chlorocarbon Mixtures in Air. Journal of Photochemistry and Photobiology. A:Chemistry. 88, 1995. pp. 167-178.
Schneider, J., Applied Research Laboratory, Penn State University. Presentation at Air andWaste Management Specialty Conference: Emerging Solutions to VOC and Air Toxics Control”,Clearwater, FL, February 27, 1996.
Sekiguchi, I., Sumitomo Corporation, Letter to Emery Kong, Research Triangle Institute,February 1, 1996.
Shugarman, L., Terr-Aqua Enviro Systems, Inc., Letter and facsimile to Emery Kong, ResearchTriangle Institute, January 29 and February 2, 1996.
Simmons, V.L., Kaschemekat, J., Jacobs, M.L., and Dortmundt, D.D., Membrane Systems Offera New Way to Recover Volatile Organic Air Pollutants. Chemical Engineering. 101:9, 1994.
57
Stitt, E.H., ICI Katalco, Birmingham, UK. Personal communication with Mark Bahner,Research Triangle Institute, February 27, 1996.
Sundberg, R., Setco, Incorporated (MIAB’s representative in the U.S.), Facsimile to GregLaFlam, Pacific Environmental Services, Inc., May 15, 1995. Togna, A.P. and Folsom, B.R.; “Removal of Styrene from Air Using Bench-Scale Biofilter andBiotrickling Filter Reactors,” in Proceedings of the Air and Waste Management Association 85thAnnual Meeting & Exhibition, Kansas City, MO, June 21-26, 1992.
Togna, P., Envirogen, Personal communication with Sonji Turner, Research Triangle Institute,October 31, 1995.
U.S. Environmental Protection Agency, Office of Air Quality Planning and Standards, Controlof Volatile Organic Compound Emissions from Wood Furniture Manufacturing Operations,EPA-453/D-95-002 (NTIS PB95-272720), August 1995.
Vatavuk, W.M.; “A Potpourri of Equipment Prices,” Chemical Engineering, August 1995;pp 68-73.
Viszolay, A.; VM Technology, Inc., Facsimile to Emery Kong, Research Triangle Institute, July10, 1996.
58
Chapter 5
Control Cost Analyses
The costs per unit of styrene removed were calculated for various control technologiesdescribed in this report. Calculating the cost per unit of styrene removed is a two-step process:
1. Calculate total annualized cost of a control technology2. Calculate amount of styrene removed by the control technology.
The amount of styrene removed by a control device is simply the product of the amountof styrene entering the control device and the control device removal efficiency. For the costanalyses described in this report, the control efficiency of thermal oxidation was assumed to be98 percent, the control efficiency of VOC condensers was calculated as described in Section4.1.3, and the control efficiencies of all other control devices were assumed to be 95 percent.
Total annualized costs of all control technologies were calculated using the generalprocedures outlined in the EPA Office of Air Quality Planning and Standards (OAQPS) ControlCost Manual (Vatavuk, 1990). Specific equations and values used in the calculations are listedin Tables 5-1 and 5-2. Equipment costs acquired from various sources were used to develop costfunctions for the control technologies evaluated in this study. The original cost information isincluded in Appendix A. A computer spreadsheet cost model (STY_COST.XLS for Excel andSTY_COST.WK3 for Lotus 1-2-3) and general instructions for using the cost model arepresented in Appendix B.
Control cost calculations were performed in the order listed below:
1. Equipment cost (EC), in dollars at the date of the quote or literature source2. Equipment cost, escalated or deescalated to July 1995 dollars.3. Total direct cost (TDC)4. Total capital investment (TCI)5. Direct operating costs (excluding fuel and electricity costs)6. Fuel cost (natural gas cost, if appropriate to the control technology)7. Electricity cost8. Indirect operating costs (overhead, property tax, insurance, administration)9. Capital recovery cost (assuming 7.5 percent interest, with 10-year depreciation)10. Styrene recovery cost (styrene recovery credit [i.e., negative cost], if appropriate
to the control technology)11. Total annualized cost (July 1995 dollars)12. Cost per unit of pollutant removed (July 1995 dollars per U.S. ton removed).
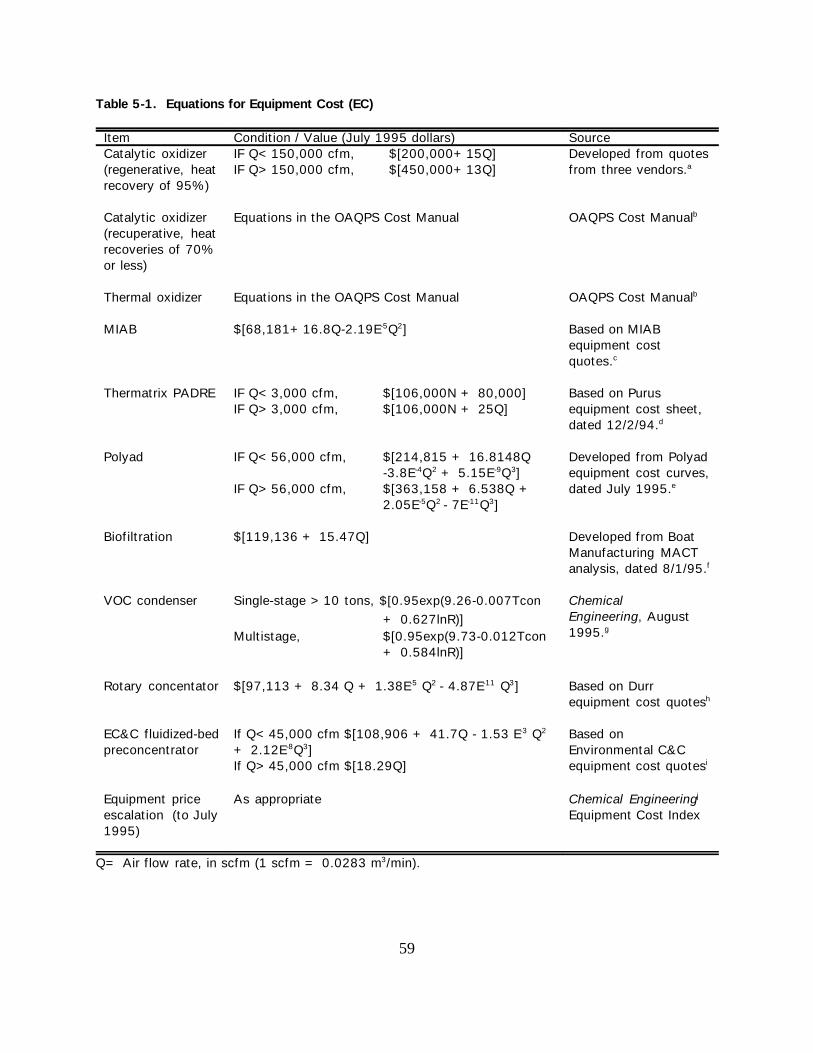
59
Table 5-1. Equations for Equipment Cost (EC)
Item Condition / Value (July 1995 dollars) SourceCatalytic oxidizer IF Q<150,000 cfm, $[200,000+15Q] Developed from quotes(regenerative, heat IF Q>150,000 cfm, $[450,000+13Q] from three vendors.recovery of 95%)
a
Catalytic oxidizer Equations in the OAQPS Cost Manual OAQPS Cost Manual(recuperative, heatrecoveries of 70%or less)
b
Thermal oxidizer Equations in the OAQPS Cost Manual OAQPS Cost Manualb
MIAB $[68,181+16.8Q-2.19E Q ] Based on MIAB-5 2
equipment costquotes.c
Thermatrix PADRE IF Q<3,000 cfm, $[106,000N + 80,000] Based on PurusIF Q>3,000 cfm, $[106,000N + 25Q] equipment cost sheet,
dated 12/2/94.d
Polyad IF Q<56,000 cfm, $[214,815 + 16.8148Q Developed from Polyad
-3.8E Q + 5.15E Q ] equipment cost curves,-4 2 -9 3
IF Q>56,000 cfm, $[363,158 + 6.538Q + dated July 1995. 2.05E Q - 7E Q ]-5 2 -11 3
e
Biofiltration $[119,136 + 15.47Q] Developed from Boat
Manufacturing MACTanalysis, dated 8/1/95.f
VOC condenser Single-stage >10 tons, $[0.95exp(9.26-0.007Tcon Chemical + 0.627lnR)]Multistage, $[0.95exp(9.73-0.012Tcon
+ 0.584lnR)]
Engineering, August1995.g
Rotary concentator $[97,113 + 8.34 Q + 1.38E Q - 4.87E Q ] Based on Durr-5 2 -11 3
equipment cost quotesh
EC&C fluidized-bed If Q<45,000 cfm $[108,906 + 41.7Q - 1.53 E Q Based onpreconcentrator + 2.12E Q ] Environmental C&C
-3 2
-8 3
If Q>45,000 cfm $[18.29Q] equipment cost quotesi
Equipment price As appropriate Chemical Engineeringescalation (to July Equipment Cost Index1995)
j
Q= Air flow rate, in scfm (1 scfm = 0.0283 m /min). 3
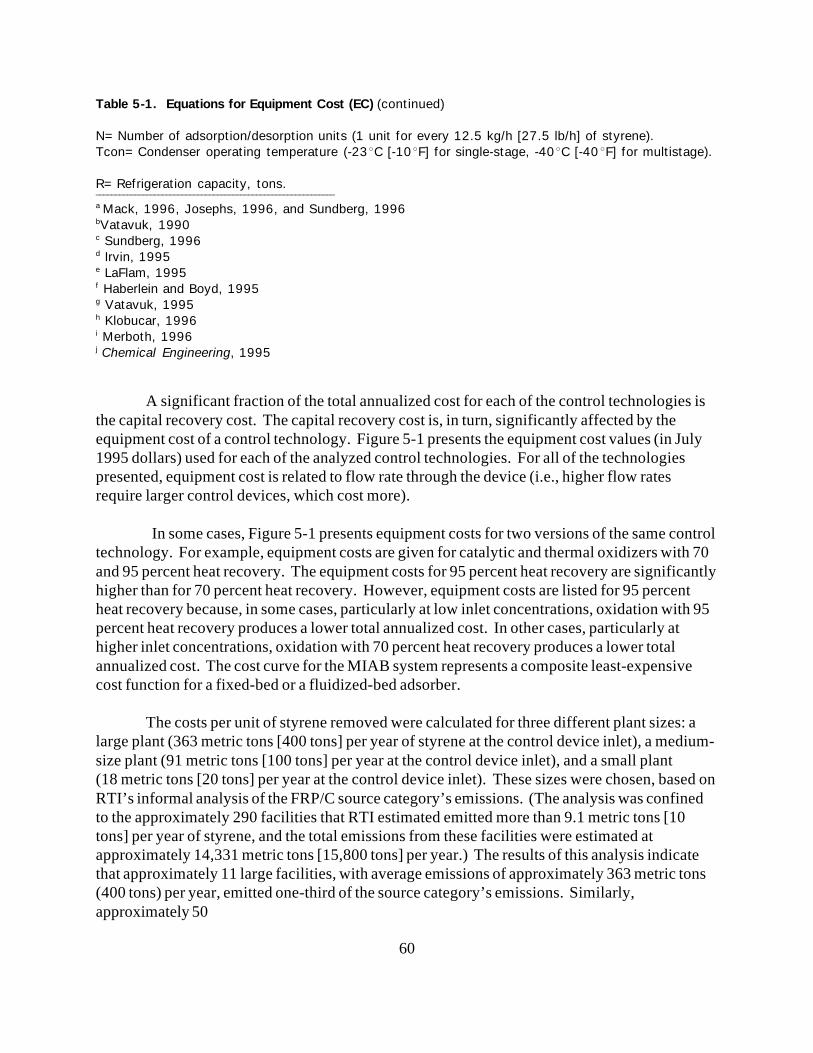
60
Table 5-1. Equations for Equipment Cost (EC) (continued)
N=Number of adsorption/desorption units (1 unit for every 12.5 kg/h [27.5 lb/h] of styrene). Tcon=Condenser operating temperature (-23 C [-10 F] for single-stage, -40 C [-40 F] for multistage). R=Refrigeration capacity, tons._____________________________________________________________
Mack, 1996, Josephs, 1996, and Sundberg, 1996a
Vatavuk, 1990b
Sundberg, 1996c
Irvin, 1995d
LaFlam, 1995e
Haberlein and Boyd, 1995f
Vatavuk, 1995g
Klobucar, 1996h
Merboth, 1996i
Chemical Engineering, 1995j
A significant fraction of the total annualized cost for each of the control technologies isthe capital recovery cost. The capital recovery cost is, in turn, significantly affected by theequipment cost of a control technology. Figure 5-1 presents the equipment cost values (in July1995 dollars) used for each of the analyzed control technologies. For all of the technologiespresented, equipment cost is related to flow rate through the device (i.e., higher flow ratesrequire larger control devices, which cost more).
In some cases, Figure 5-1 presents equipment costs for two versions of the same controltechnology. For example, equipment costs are given for catalytic and thermal oxidizers with 70and 95 percent heat recovery. The equipment costs for 95 percent heat recovery are significantlyhigher than for 70 percent heat recovery. However, equipment costs are listed for 95 percentheat recovery because, in some cases, particularly at low inlet concentrations, oxidation with 95percent heat recovery produces a lower total annualized cost. In other cases, particularly athigher inlet concentrations, oxidation with 70 percent heat recovery produces a lower totalannualized cost. The cost curve for the MIAB system represents a composite least-expensivecost function for a fixed-bed or a fluidized-bed adsorber.
The costs per unit of styrene removed were calculated for three different plant sizes: alarge plant (363 metric tons [400 tons] per year of styrene at the control device inlet), a medium-size plant (91 metric tons [100 tons] per year at the control device inlet), and a small plant(18 metric tons [20 tons] per year at the control device inlet). These sizes were chosen, based onRTI’s informal analysis of the FRP/C source category’s emissions. (The analysis was confinedto the approximately 290 facilities that RTI estimated emitted more than 9.1 metric tons [10tons] per year of styrene, and the total emissions from these facilities were estimated atapproximately 14,331 metric tons [15,800 tons] per year.) The results of this analysis indicatethat approximately 11 large facilities, with average emissions of approximately 363 metric tons(400 tons) per year, emitted one-third of the source category’s emissions. Similarly,approximately 50
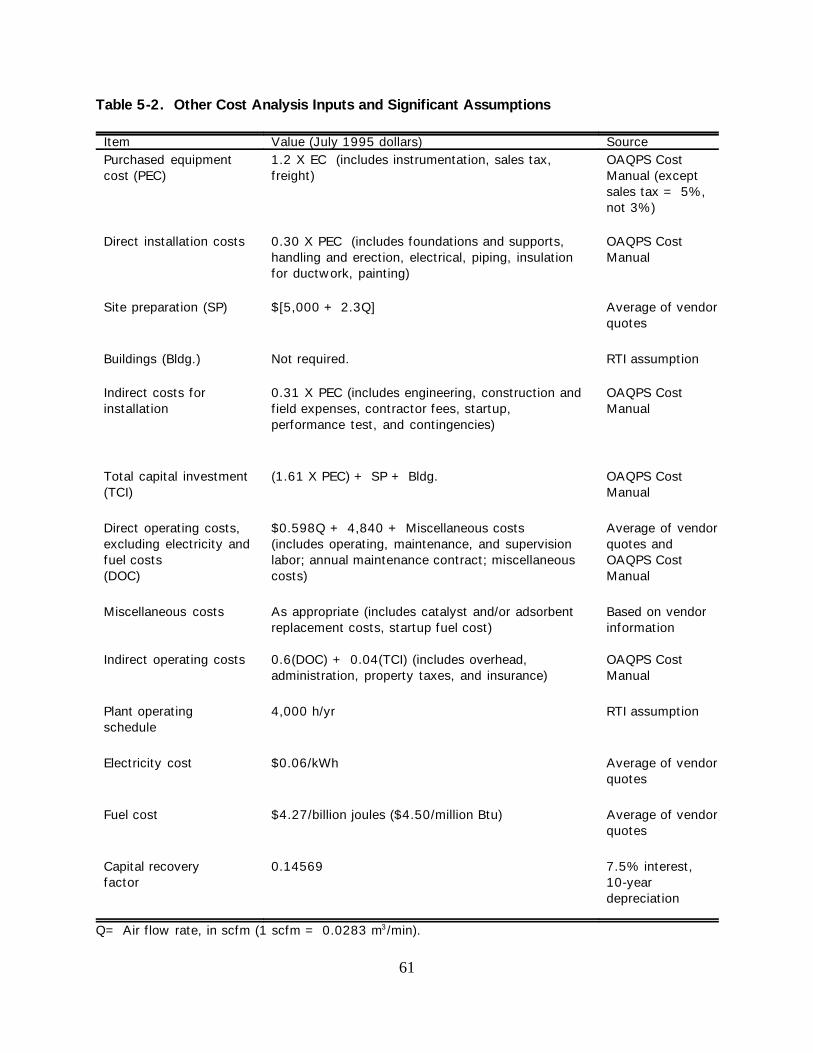
61
Table 5-2. Other Cost Analysis Inputs and Significant Assumptions
Item Value (July 1995 dollars) SourcePurchased equipment 1.2 X EC (includes instrumentation, sales tax, OAQPS Costcost (PEC) freight) Manual (except
sales tax = 5%,not 3%)
Direct installation costs 0.30 X PEC (includes foundations and supports, OAQPS Costhandling and erection, electrical, piping, insulation Manualfor ductwork, painting)
Site preparation (SP) $[5,000 + 2.3Q] Average of vendorquotes
Buildings (Bldg.) Not required. RTI assumption
Indirect costs for 0.31 X PEC (includes engineering, construction and OAQPS Costinstallation field expenses, contractor fees, startup, Manual
performance test, and contingencies)
Total capital investment (1.61 X PEC) + SP + Bldg. OAQPS Cost(TCI) Manual
Direct operating costs, $0.598Q + 4,840 + Miscellaneous costs Average of vendorexcluding electricity and (includes operating, maintenance, and supervision quotes andfuel costs labor; annual maintenance contract; miscellaneous OAQPS Cost(DOC) costs) Manual
Miscellaneous costs As appropriate (includes catalyst and/or adsorbent Based on vendorreplacement costs, startup fuel cost) information
Indirect operating costs 0.6(DOC) + 0.04(TCI) (includes overhead, OAQPS Costadministration, property taxes, and insurance) Manual
Plant operating 4,000 h/yr RTI assumptionschedule
Electricity cost $0.06/kWh Average of vendorquotes
Fuel cost $4.27/billion joules ($4.50/million Btu) Average of vendorquotes
Capital recovery 0.14569 7.5% interest,factor 10-year
depreciation
Q= Air flow rate, in scfm (1 scfm = 0.0283 m /min).3

62
Figure 5-1
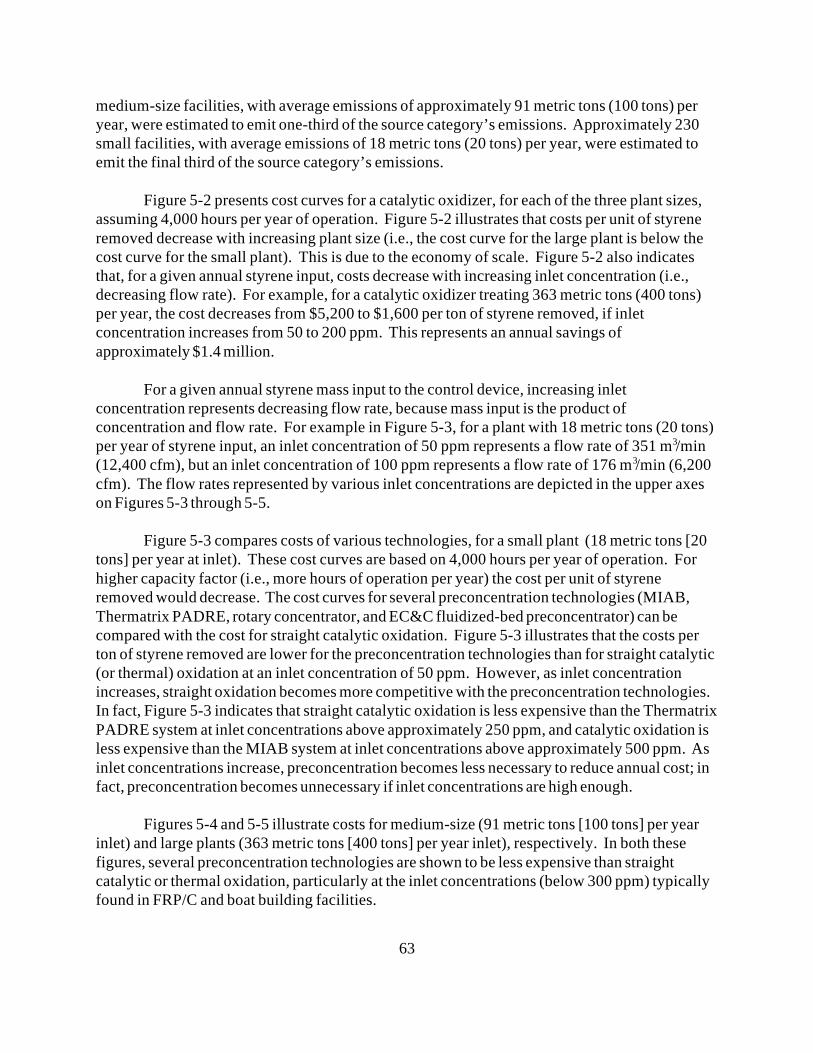
63
medium-size facilities, with average emissions of approximately 91 metric tons (100 tons) peryear, were estimated to emit one-third of the source category’s emissions. Approximately 230small facilities, with average emissions of 18 metric tons (20 tons) per year, were estimated toemit the final third of the source category’s emissions.
Figure 5-2 presents cost curves for a catalytic oxidizer, for each of the three plant sizes,assuming 4,000 hours per year of operation. Figure 5-2 illustrates that costs per unit of styreneremoved decrease with increasing plant size (i.e., the cost curve for the large plant is below thecost curve for the small plant). This is due to the economy of scale. Figure 5-2 also indicatesthat, for a given annual styrene input, costs decrease with increasing inlet concentration (i.e.,decreasing flow rate). For example, for a catalytic oxidizer treating 363 metric tons (400 tons)per year, the cost decreases from $5,200 to $1,600 per ton of styrene removed, if inletconcentration increases from 50 to 200 ppm. This represents an annual savings ofapproximately $1.4 million.
For a given annual styrene mass input to the control device, increasing inletconcentration represents decreasing flow rate, because mass input is the product ofconcentration and flow rate. For example in Figure 5-3, for a plant with 18 metric tons (20 tons)per year of styrene input, an inlet concentration of 50 ppm represents a flow rate of 351 m /min3
(12,400 cfm), but an inlet concentration of 100 ppm represents a flow rate of 176 m /min (6,2003
cfm). The flow rates represented by various inlet concentrations are depicted in the upper axeson Figures 5-3 through 5-5.
Figure 5-3 compares costs of various technologies, for a small plant (18 metric tons [20tons] per year at inlet). These cost curves are based on 4,000 hours per year of operation. Forhigher capacity factor (i.e., more hours of operation per year) the cost per unit of styreneremoved would decrease. The cost curves for several preconcentration technologies (MIAB,Thermatrix PADRE, rotary concentrator, and EC&C fluidized-bed preconcentrator) can becompared with the cost for straight catalytic oxidation. Figure 5-3 illustrates that the costs perton of styrene removed are lower for the preconcentration technologies than for straight catalytic(or thermal) oxidation at an inlet concentration of 50 ppm. However, as inlet concentrationincreases, straight oxidation becomes more competitive with the preconcentration technologies. In fact, Figure 5-3 indicates that straight catalytic oxidation is less expensive than the ThermatrixPADRE system at inlet concentrations above approximately 250 ppm, and catalytic oxidation isless expensive than the MIAB system at inlet concentrations above approximately 500 ppm. Asinlet concentrations increase, preconcentration becomes less necessary to reduce annual cost; infact, preconcentration becomes unnecessary if inlet concentrations are high enough.
Figures 5-4 and 5-5 illustrate costs for medium-size (91 metric tons [100 tons] per yearinlet) and large plants (363 metric tons [400 tons] per year inlet), respectively. In both thesefigures, several preconcentration technologies are shown to be less expensive than straightcatalytic or thermal oxidation, particularly at the inlet concentrations (below 300 ppm) typicallyfound in FRP/C and boat building facilities.

64
Figure 5-2

65
Figure 5-3

66
Figure 5-4

67
Figure 5-5
68
Figures 5-4 and 5-5 show that as inlet concentration increases, the differences in cost perunit of styrene removed among various control technologies converge. It is because thedifferences in equipment costs for various control technologies are smaller at low flow rate andlarger at high flow rate (as shown in Figure 5-1). This cost analysis also shows thatcondensation is not a cost-effective control technology due to the low styrene removal efficiencyat low inlet concentration (as shown in Figure 4-3).
Figures 5-3 through 5-5 show that, for all plant sizes and all control technologies, the costof an add-on control system can be reduced, if flow rate can be reduced (i.e., for a given plantsize, inlet concentrations can be increased). Therefore, a company should evaluate methods ofreducing flow rates to control devices before considering any add-on emission controls.
References
Chemical Engineering Plant Cost Index (Equipment), Chemical Engineering, August 1995;p 148.
Haberlein, R.A. and Boyd, D.P.; Maximum Achievable Control Technology for a HypotheticalFiberglass Boat Manufacturing Facility, prepared for J. McKnight, National MarineManufacturers Association, Washington, DC; August 1, 1995.
Irvin, C.L., Purus, San Jose, CA, Personal communication with Emery Kong, Research TriangleInstitute, November 8, 1995.
Josephs, T.E., Anguil Environmental, Milwaukee, WI, Personal communication with MarkBahner, Research Triangle Institute, January 31, 1996.
Klobucar, J., Durr Industries, Inc., Facimile to Emery Kong, Research Triangle Institute, March15, 1996.
LaFlam. G., Pacific Environmental Services, Inc., Personal communication with Emery Kong,Research Triangle Institute, October 3, 1995.
Mack, S., Englehard Corporation, Iselin, NJ, Personal communication with Mark Bahner,Research Triangle Institute, February 8, 1996.
Merboth, J., Environmental C&C, Inc. Letter to Emery Kong, Research Triangle Institute,March 28, 1996.
Sundberg, R., Setco, Incorporated (MIAB’s representative in the U.S.), Minneapolis, MN,Personal communication with Mark Bahner, Research Triangle Institute, January 26, 1996.
69
Vatavuk, W.M.; OAQPS Control Cost Manual, 4th Ed. EPA-450/3-90-006 (NTIS PB90-169954); U.S. Environmental Protection Agency, Office of Air Quality Planning and Standards,Research Triangle Park, NC, January 1990.
Vatavuk, W.M.; “A Potpourri of Equipment Prices,” Chemical Engineering, August 1995;pp 68-73.
70
Chapter 6
Ventilation and Emission Capture Systems in the FRP/C Facilities
One of the most important considerations in determining the cost of any emission controlsystem is the volumetric flow rate of the exhaust stream to be treated. Ventilation systems inFRP/C facilities are currently solely designed to provide an environment that is safe for workersand that produces good product quality. General ventilation, also called dilution ventilation, is acommon practice. This practice supplies an ample amount of makeup air to dilute thecontaminants to an acceptable air quality level in the workplace. However, this dilutionventilation practice produces high-volume, low-concentration exhaust streams. Flow rates of566 to 2,382 m /min (20,000 to 100,000 cfm) are common, and exhaust concentrations are rarely3
above 100 ppm. These high-volume, low-concentration exhaust streams make emission controlsystems very expensive. Proper air flow management would prevent mixing contaminated airwith clean air and capture emissions at the point of generation. Thus, proper air flowmanagement can maintain a safe environment for the operators, while significantly decreasingexhaust flow rates. These reduced exhaust flow rates (increased concentrations) cansignificantly reduce control costs.
The following sections present the regulations governing ventilation practices (Section 6.1)and several air flow management practices and concepts that could be applied to minimize airflow volumes. These practices and concepts include: local air flow management (Section 6.2),spray booth modifications (Section 6.3), and enclosures (Section 6.4). Each of the sectionsincludes a process description and discussion of process applicability, performance, and costs.
6.1 Regulations Governing General Ventilation Practices
There are several OSHA regulations that govern the ventilation system design in the FRP/Cindustry:
1. 29 CFR 1910.1000 (OSHA, 1993a): This regulation establishes permissible exposure limits(PELs) for breathable occupational exposure. In areas that would result in unprotectedworker exposures exceeding these levels, workers must wear sufficient respiratoryprotection (such as respirators) to bring worker breathable exposures within the allowablelevels.
The current OSHA 8-hour Time-Weighted-Average (TWA) for employee exposure tostyrene is 100 ppm. A 50-ppm allowable was proposed by OSHA, but withdrawn later. However, many facilities are voluntarily conforming to the 50-ppm limit. In “dilutionventilation,” enough makeup air is supplied to lower the average exhaust concentration tothe OSHA allowable limit. For the same amount of styrene emission to be removed, theexhaust flow rate will be inversely related to the desired concentration in the workplace.
71
For example, the volumetric flow rate for an exhaust concentration of 50 ppm is twice aslarge as for 100 ppm.
2. 29 CFR 1910.134 (OSHA, 1993b): This regulation concerns the conditions under whichrespiratory protection (respirators) should be used. Part (a) of this regulation states that: “In the control of those occupational diseases caused by breathing air contaminated withharmful...gases...the primary objective shall be to prevent atmospheric contamination. Thisshall be accomplished as far as feasible by accepted engineering control measures (forexample, enclosure or confinement of the operation, general and local ventilation, andsubstitution of less toxic materials). When effective engineering controls are not feasible,or while they are being instituted, appropriate respirators shall be used...”
3. Regulation 29 CFR 1910.94, Table G-10 (OSHA, 1993c): This table lists minimum airflowvelocities that must be designed or maintained at the entrance to spray booths under variousoperating conditions in order to meet health and safety requirements.
Operating conditions Airflow velocity Manual spray gun, up to 15 m/min (50 fpm) crossdraft 30.5 m/min (100 fpm)Manual spray gun, up to 30.5 m/min (100 fpm) crossdraft 45.7 m/min (150 fpm)Small spray booth 61 m/min (200 fpm)
4. Regulation 29 CFR 1910.107 (d) (9) (OSHA, 1993d): This regulation prohibits therecirculation of exhaust air from spray finishing operations from the standpoint ofpreventing fire and explosion hazards.
The regulation was adopted by OSHA from National Fire Protection Association (NFPA) 33(NFPA, 1995), “Standard for Spray Application Using Flammable and Combustible Materials.” The purpose of NFPA 33 was to prevent fire and explosion hazards during spray finishingoperations. A letter regarding the issue of recirculation was sent by OSHA to EPA on January19, 1990 (Hughes et. al., 1994). The letter stated that: “Employers who fully comply with thespecifications and requirements of NFPA 33, concerning recirculation of exhaust air to anoccupied spray booth, would not be cited under 29 CFR 1910.107 (d) (9), under the policy for deminimis violations.” The letter further stated: “However, the quality of the respirable air in thebooth must comply, at a minimum, with the requirements set forth by 29 CFR 1910.1000, whichestablishes permissible exposure limits (PELs).”
A review of the above OSHA regulations indicates that the design of an air flowmanagement system should provide respirable air to the operators that meets permissibleexposure limits and prevents fire and explosion hazards. When a spray booth is used, it shouldmeet the minimum airflow velocity. Any modifications to the spray booth should not violate theabove requirements.
72
6.2 Local Air Flow Management
Process Description. General ventilation usually involves moving a lot of air through theworkplace; however, it is not effective when there are many emission points (e.g., open moldingproductions) in an open space. It is also expensive to move air and to heat the makeup air. Local air flow management involves moving air pollutants from the emission source directly;therefore, the amount of air to be ventilated or heated is minimized. In an open space, this canbe done by directing makeup air toward the emission source and capturing the emission with anexhaust hood in the other end (a push-pull ventilation system). If a push-pull system is not used,the exhaust hood just picks up the emissions and the surrounding air. The capture efficiency isgenerally better for a push-pull system than for an exhaust hood by itself. This section presentsseveral schematics of local exhaust ventilation that originally appeared in the UP-ResinHandling Guide (GPRMC/CEFIC, 1994). This section also discusses “displacementventilation.” Modifications to spray booths are another category of local air flow management;these modifications are discussed in Section 6.3.
The European Organization of Reinforced Plastic/Composite Materials (GPRMC) and theUnsaturated Polyesters Sector Group of European Chemical Industry Council (CEFIC) jointlyproduced UP-Resin Handling Guide (GPRMC/CEFIC, 1994). This guide describes manymethods for improving local air flow management, including use of local extraction, in-moldpush-(movable) pull ventilation, and out-of-mold (induction) push-pull ventilation. Figure 6-1shows these three methods of local air flow management. Local extraction is effective whenstyrene emissions are extracted as close to the mold as possible, because the effectiveness of theextractor decreases by a factor of four when the distance from the mold is doubled(GPRMC/CEFIC, 1994). In-mold push-(movable) pull ventilation is best-suited for use withlarge, female molds (such as in boat manufacturing). The vertical induction push-pullventilation requires a downdraft to pull emissions away from the workplace. Out-of-mold(induction) push-pull ventilation can be arranged horizontally, in the form of a (push) supply airand a local (pull) capture device (e.g., a spray booth).
In Europe, “displacement ventilation” has gained acceptance as a method of reducingworker exposure to contaminants. Displacement ventilation relies on the concept that there is atemperature gradient between air near the ceiling and air near the floor, at a typical industrialfacility. Cool, “fresh” air is supplied, at a low velocity, to the work zone. If the source of thework zone emissions is at a higher temperature than the supply air, the supply air is heated andpicks up contaminants as it rises out of the work zone. The important concepts/assumptionsbehind displacement ventilation are:
Air is supplied at below-ambient temperature (so the “fresh” air arrives at breathing-zonelevel).Air is supplied at low velocity (so turbulent mixing of “fresh” and contaminated air doesnot occur).

73
Figure 6-1
74
The source of the contaminants is at higher-than-ambient temperatures (so contaminatedair rises out of the breathing zone).
Applicability to FRP/C Processes. RTI has no knowledge of in-mold push-(movable) pullventilation systems in the United States. However, such systems may exist. Vertical out-of-mold (induction) push-pull ventilation systems are used to a limited extent in the U.S. Horizontal push-pull ventilation systems are being used in FRP/C and other industries.
There are no known applications of displacement ventilation to FRP/C processes in theUnited States. AirSon AB (Sweden) provides Air Shower air supply systems to industrialfacilities in Europe, including FRP/C facilities. A study of the displacement ventilation forFRP/C fabrication was performed by AirSon and the Swedish National Institute of OccupationalHealth (Andersson, et al., 1993). The intent of the study was to determine whether the AirSonAir Shower device was able to protect workers from exposure when they roll out a wet laminatein a spray booth. Four air supply outlets, each supplying approximately 10 m /min (375 cfm) of3
“fresh” (styrene-free) air, were placed in a spray booth, approximately 36 cm (14 inches) abovethe workers’ heads. Personnel exposure to styrene was monitored with charcoal tubes and witha photoionization detector (providing real-time measurements of styrene concentrations). Thestudy indicated that Air Shower air supply systems could reduce worker exposures by a factor ofapproximately 5 to 9 (i.e., from approximately 28 ppm to between 6 and 3 ppm, respectively). However, this exposure reduction occurred only when the supply air was approximately1.8 to 2.5 C (3.2 to 4.5 F) cooler than the ambient air within the booth and when theoperators remained in the protection zone created by the air supply system. Low-speedventilation is required to evacuate styrene emissions in the work area so that the protection zonewill not be disturbed.
The previous discussion indicates that use of displacement ventilation has been applied toFRP/C manufacturing situations to reduce worker exposure. However, the worker has to stay inthe protection zone created by the air supply system. Another important concept in the use ofdisplacement ventilation is that the process producing the contamination is at a highertemperature than the ambient air or the displacement air has to be cooler than the ambient air. However, emissions from open-mold FRP/C processes occur at nearly ambient temperature,because a vast majority of the emissions from sprayup occur during spraying and prior to thebeginning of exotherm.
6.3 Spray Booth and Modifications
Spray booths are commonly used in the FRP/C industry, especially for gel coat and resinsprayup operations, and when part sizes are small enough to fit into a spray booth. Use of aspray booth prevents the cross-contamination created by general ventilation, because styreneemissions are captured and exhausted directly. Open-faced spray booths are typically used whenmolds are manually transferred in and out of the spray booth on wheels. Spray booths withopenings on the side walls are typically used when molds are mechanically transferred in and out
75
of the spray booth on a conveyor. The latter type of spray booth is common in high-productionfacilities.
In a typical spray booth, a mold is placed in the center of the booth. Air is drawn into thefront opening of the booth, travels past the mold, and exits through a filter bank at the rear of thebooth. A dry filter medium is used to capture overspray, and the medium is replaced frequentlyto protect the duct work and exhaust system. The captured emissions are vented to theatmosphere or to an emission control device.
A typical styrene concentration-versus-time profile for a sprayup operation in a constant-flow rate spray booth is shown in Figure 6-2. The profile includes three peaks, with averageconcentrations over 200 ppm. These peaks correspond to the spraying of three parts. Theprofile also includes four “valleys,” with concentrations of approximately 50 ppm. Thesevalleys correspond to the time required to remove sprayed parts and to position a new mold forspraying. This profile shows that high styrene emissions result from the period of spraying. Previous RTI testing (Kong et al., 1995) indicated that approximately 39 percent of total gelcoating emissions and approximately 50 percent of total resin application emissions occurduring spraying and the remainder is emitted during the post application stage during rolling andcuring. When the part is removed from the spray booth, curing emissions are not captured by thespray booth and have to be removed by the general ventilation system.
The following sections present the modifications to a spray booth design that could increasethe pollutant concentration and decrease the exhaust flow, thus making the downstreamemission controls more cost-effective.
6.3.1 Recirculation
Process Description. The concept of recirculation had its origin in the spray paintingindustry, as a means of lowering the flow rates (and therefore treatment costs) in paint spraybooths. Recirculation involves redirecting a portion of the spray booth exhaust stream back intothe spray booth. This concept is shown in Figure 6-3. The recirculation stream may be re-introduced at any location in the spray booth (e.g, near the inlet face or at the center of thebooth).
Mobile Zone Associates (Knoxville, Tennessee) developed a recirculating spray booth inwhich a portion of the exhaust stream was recirculated back to the center of the spray booth.Another feature of the Mobile Zone Associates design is that the majority of the spray booth faceis closed off, and the operator stands in a mobile cab that traverses across the face of the booth. The design is illustrated in Figure 6-4.
A spray booth developed by EPA and Acurex Environmental Corporation (Darvin and Ayer,1993) incorporates recirculation of a portion of the spray booth exhaust stream to the vicinity

76
Figure 6-2

77
Figure 6-3.

78
Figure 6-4.
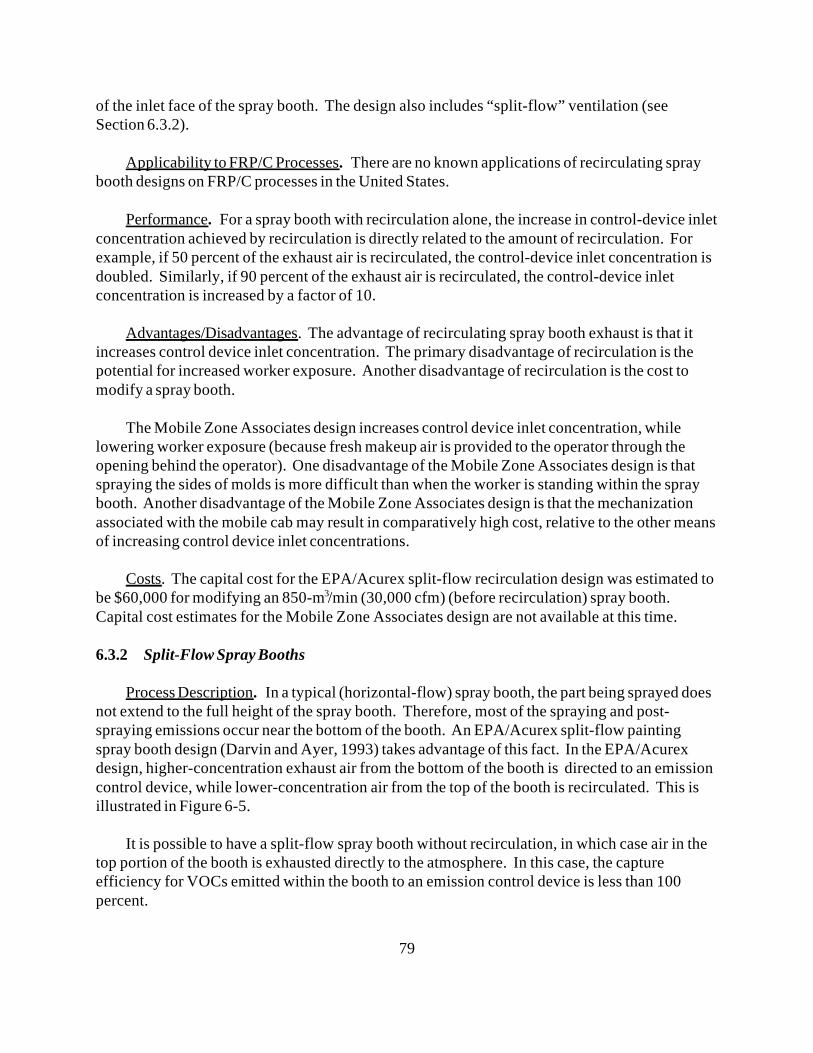
79
of the inlet face of the spray booth. The design also includes “split-flow” ventilation (seeSection 6.3.2).
Applicability to FRP/C Processes. There are no known applications of recirculating spraybooth designs on FRP/C processes in the United States.
Performance. For a spray booth with recirculation alone, the increase in control-device inletconcentration achieved by recirculation is directly related to the amount of recirculation. Forexample, if 50 percent of the exhaust air is recirculated, the control-device inlet concentration isdoubled. Similarly, if 90 percent of the exhaust air is recirculated, the control-device inletconcentration is increased by a factor of 10.
Advantages/Disadvantages. The advantage of recirculating spray booth exhaust is that itincreases control device inlet concentration. The primary disadvantage of recirculation is thepotential for increased worker exposure. Another disadvantage of recirculation is the cost tomodify a spray booth.
The Mobile Zone Associates design increases control device inlet concentration, whilelowering worker exposure (because fresh makeup air is provided to the operator through theopening behind the operator). One disadvantage of the Mobile Zone Associates design is thatspraying the sides of molds is more difficult than when the worker is standing within the spraybooth. Another disadvantage of the Mobile Zone Associates design is that the mechanizationassociated with the mobile cab may result in comparatively high cost, relative to the other meansof increasing control device inlet concentrations.
Costs. The capital cost for the EPA/Acurex split-flow recirculation design was estimated tobe $60,000 for modifying an 850-m /min (30,000 cfm) (before recirculation) spray booth. 3
Capital cost estimates for the Mobile Zone Associates design are not available at this time.
6.3.2 Split-Flow Spray Booths
Process Description. In a typical (horizontal-flow) spray booth, the part being sprayed doesnot extend to the full height of the spray booth. Therefore, most of the spraying and post-spraying emissions occur near the bottom of the booth. An EPA/Acurex split-flow paintingspray booth design (Darvin and Ayer, 1993) takes advantage of this fact. In the EPA/Acurexdesign, higher-concentration exhaust air from the bottom of the booth is directed to an emissioncontrol device, while lower-concentration air from the top of the booth is recirculated. This isillustrated in Figure 6-5.
It is possible to have a split-flow spray booth without recirculation, in which case air in thetop portion of the booth is exhausted directly to the atmosphere. In this case, the captureefficiency for VOCs emitted within the booth to an emission control device is less than 100percent.

80
Figure 6-5.
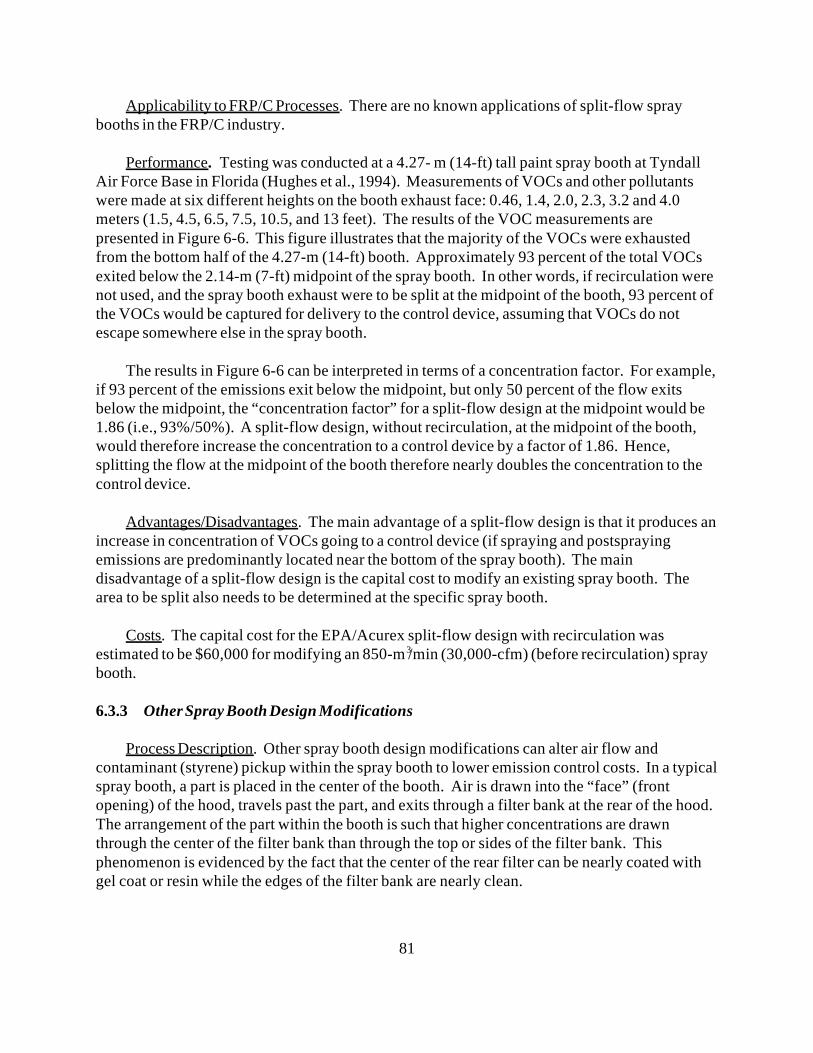
81
Applicability to FRP/C Processes. There are no known applications of split-flow spraybooths in the FRP/C industry.
Performance. Testing was conducted at a 4.27- m (14-ft) tall paint spray booth at TyndallAir Force Base in Florida (Hughes et al., 1994). Measurements of VOCs and other pollutantswere made at six different heights on the booth exhaust face: 0.46, 1.4, 2.0, 2.3, 3.2 and 4.0meters (1.5, 4.5, 6.5, 7.5, 10.5, and 13 feet). The results of the VOC measurements arepresented in Figure 6-6. This figure illustrates that the majority of the VOCs were exhaustedfrom the bottom half of the 4.27-m (14-ft) booth. Approximately 93 percent of the total VOCsexited below the 2.14-m (7-ft) midpoint of the spray booth. In other words, if recirculation werenot used, and the spray booth exhaust were to be split at the midpoint of the booth, 93 percent ofthe VOCs would be captured for delivery to the control device, assuming that VOCs do notescape somewhere else in the spray booth.
The results in Figure 6-6 can be interpreted in terms of a concentration factor. For example,if 93 percent of the emissions exit below the midpoint, but only 50 percent of the flow exitsbelow the midpoint, the “concentration factor” for a split-flow design at the midpoint would be1.86 (i.e., 93%/50%). A split-flow design, without recirculation, at the midpoint of the booth,would therefore increase the concentration to a control device by a factor of 1.86. Hence,splitting the flow at the midpoint of the booth therefore nearly doubles the concentration to thecontrol device.
Advantages/Disadvantages. The main advantage of a split-flow design is that it produces anincrease in concentration of VOCs going to a control device (if spraying and postspraying emissions are predominantly located near the bottom of the spray booth). The maindisadvantage of a split-flow design is the capital cost to modify an existing spray booth. Thearea to be split also needs to be determined at the specific spray booth.
Costs. The capital cost for the EPA/Acurex split-flow design with recirculation wasestimated to be $60,000 for modifying an 850-m /min (30,000-cfm) (before recirculation) spray3
booth.
6.3.3 Other Spray Booth Design Modifications
Process Description. Other spray booth design modifications can alter air flow andcontaminant (styrene) pickup within the spray booth to lower emission control costs. In a typicalspray booth, a part is placed in the center of the booth. Air is drawn into the “face” (frontopening) of the hood, travels past the part, and exits through a filter bank at the rear of the hood. The arrangement of the part within the booth is such that higher concentrations are drawnthrough the center of the filter bank than through the top or sides of the filter bank. Thisphenomenon is evidenced by the fact that the center of the rear filter can be nearly coated withgel coat or resin while the edges of the filter bank are nearly clean.

82
Figure 6-6.
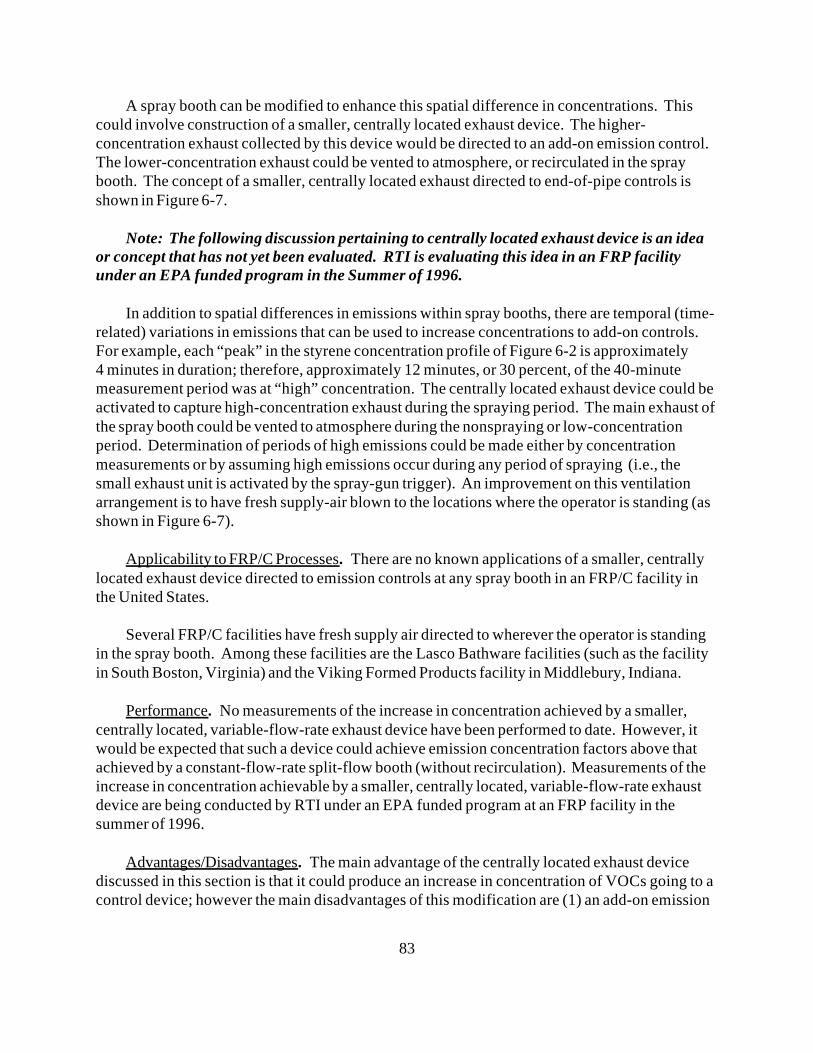
83
A spray booth can be modified to enhance this spatial difference in concentrations. Thiscould involve construction of a smaller, centrally located exhaust device. The higher-concentration exhaust collected by this device would be directed to an add-on emission control. The lower-concentration exhaust could be vented to atmosphere, or recirculated in the spraybooth. The concept of a smaller, centrally located exhaust directed to end-of-pipe controls isshown in Figure 6-7.
Note: The following discussion pertaining to centrally located exhaust device is an ideaor concept that has not yet been evaluated. RTI is evaluating this idea in an FRP facilityunder an EPA funded program in the Summer of 1996.
In addition to spatial differences in emissions within spray booths, there are temporal (time-related) variations in emissions that can be used to increase concentrations to add-on controls. For example, each “peak” in the styrene concentration profile of Figure 6-2 is approximately4 minutes in duration; therefore, approximately 12 minutes, or 30 percent, of the 40-minutemeasurement period was at “high” concentration. The centrally located exhaust device could beactivated to capture high-concentration exhaust during the spraying period. The main exhaust ofthe spray booth could be vented to atmosphere during the nonspraying or low-concentrationperiod. Determination of periods of high emissions could be made either by concentrationmeasurements or by assuming high emissions occur during any period of spraying (i.e., thesmall exhaust unit is activated by the spray-gun trigger). An improvement on this ventilationarrangement is to have fresh supply-air blown to the locations where the operator is standing (asshown in Figure 6-7).
Applicability to FRP/C Processes. There are no known applications of a smaller, centrallylocated exhaust device directed to emission controls at any spray booth in an FRP/C facility inthe United States.
Several FRP/C facilities have fresh supply air directed to wherever the operator is standingin the spray booth. Among these facilities are the Lasco Bathware facilities (such as the facilityin South Boston, Virginia) and the Viking Formed Products facility in Middlebury, Indiana.
Performance. No measurements of the increase in concentration achieved by a smaller,centrally located, variable-flow-rate exhaust device have been performed to date. However, itwould be expected that such a device could achieve emission concentration factors above thatachieved by a constant-flow-rate split-flow booth (without recirculation). Measurements of theincrease in concentration achievable by a smaller, centrally located, variable-flow-rate exhaustdevice are being conducted by RTI under an EPA funded program at an FRP facility in thesummer of 1996.
Advantages/Disadvantages. The main advantage of the centrally located exhaust devicediscussed in this section is that it could produce an increase in concentration of VOCs going to acontrol device; however the main disadvantages of this modification are (1) an add-on emission

84
Figure 6-7
85
control device capable of handling surge of emissions has to be installed and (2) the feasibilityand cost of this modification has not been evaluated.
Costs. It would be expected that the cost to modify a spray booth to include a centrallylocated variable-flow-rate exhaust and a directed fresh-air supply would be under $20,000 perbooth (for a 425-m /min [15,000-cfm] booth). 3
6.4 Enclosures and Total Enclosures
Process Description. Enclosures provide a physical barrier between the emissions and thesurrounding environment and can be used to reduce or eliminate the dispersion of styrene vaporsfrom an FRP/C process. Enclosures are currently being applied to certain emission sources inFRP/C facilities, such as covers on resin mixing tanks and enclosed resin baths. If an enclosureis not ventilated, the styrene concentration in the enclosure builds up to a point of equilibrium,after which further emissions are suppressed. If an enclosure is ventilated, the exhaustconcentration is inversely related to the exhaust flow rate. Therefore, an enclosure can preventemissions or can be used to create a low-flow-rate, high-concentration exhaust. This sectiondescribes how the enclosure concept can be applied to the FRP/C processes.
If an enclosure is designed to meet certain guidelines (described in EPA Method 204 [U.S.EPA, 1995]), it is considered by EPA to be a “total enclosure,” and capture efficiency isassumed to be 100 percent (i.e., it is assumed that no fugitive emissions escape from theenclosure). There are several criteria that must be met before an enclosure is considered to be atotal enclosure:
The total area of all natural draft openings into the enclosure must be less than 5 percentof the total surface area of the enclosure.The air flow for all of the natural draft openings must be into the enclosure.The air velocity through the openings must be at least 61 m/min (200 ft/min).Exhaust points must be at least four equivalent exhaust-duct diameters from natural draftopenings.
Applicability to FRP/C Processes. Although many buildings within the FRP/C industry canbe considered total enclosure, there is limited use of enclosures within buildings in the FRP/Cindustry. Two examples of the use of enclosures within buildings in the FRP/C industry aredescribed below. These examples show that total enclosures would be feasible whenconcentrated emission sources can be isolated and enclosed without interferring the productionoperation.
The first example is the Cor Tec facility (Washington Court House, Ohio) whichmanufactures side-wall panels for trailers and recreational vehicles. Automated gel coatspraying operations are conducted within a total enclosure. The enclosure is 3.6 m (12 feet)wide and 18.3 m (60 feet) long and consists of a spraying enclosure and three curing enclosures.
86
Mylar film is fed along a table that forms the bottom of the enclosure, and the gel coat is appliedby automated spray guns located within the spraying enclosure. The only natural draft openingis a 7.6-cm (3-inch) -high by 3.6-m (12-foot) -long gap at the entrance to the spraying enclosure. This represents less than 5 percent of the total surface area of the enclosure, and the air velocitythrough the opening is greater than 61 m/min (200 ft) per minute, so a total enclosure is formed.
The spraying enclosure and each of the three curing enclosures are ventilated at a rate of25.5 m /min (900 cfm), for a total flow rate of 102 m /min (3,600 cfm). The styrene mass flow3 3
rate (to a catalytic oxidizer) from the automated gel coat spraying operation is 8.2 kg/h (18.1lb/h) (i.e., 32.8 metric ton/yr [36.2 tpy], operating 4,000 hours per year). This means that theaverage concentration in the gel coating enclosure exhaust is approximately 310 ppm (Patkar etal., 1994).
To avoid limiting production, the gel-coated panels are removed from the enclosure beforecuring emissions have completely stopped. Testing indicated that approximately 7 percent ofthe total emissions from the gel coating operation occur outside the enclosure (Patkar et al.,1994).
A second example is an emission study conducted by the Society for the Plastics Industry(SPI)/Composites Institute, in cooperation with the Pultrusion Industry Council (PIC) and theEPA Office of Research and Development. In that study enclosures were evaluated for apultrusion process to determine their effects on styrene emissions in September 1995. Severalconditions were evaluated, including partial and complete enclosure of the resin bath and wet-out area, with a combined wet-out area and resin bath exhaust. The exhaust from the resin bathand wet-out area was at a very low flow rate (58 cfm compared to 198 cfm from the overalltemporary enclosure).
Performance. The SPI/PIC/EPA testing of enclosures for the pultrusion process yielded thefollowing results (Schweitzer, 1996):
Without an enclosure on the resin bath or wet-out area (Run A1) , the concentration andflow rate in the 8-inch duct from the temporary total enclosure constructed for testingwere 293 ppm and 5.6 m /min (198 cfm), respectively. This represents an emission rate3
of 0.42 kg/h (0.93 lb/h).
With ventilated enclosures on the resin bath and wet-out area (Run G1), theconcentration and flow rate in the 8-inch duct from the temporary total enclosure were12 ppm and 5.6 m /min (198 cfm), respectively, representing a styrene emission rate of3
0.02 kg/h (0.04 lb/h). The concentration and velocity in the 6-inch duct from the resinbath and wet out area were 719 ppm and 1.6 m /min (58 cfm), respectively, representing3
a styrene emission rate of 0.30 kg/h (0.67 lb/h). This represents a total emission rate of0.32 kg/h (0.71 lb/h).
87
Based on these results, the following performance for a ventilated resin-bath-and-wet-out-area enclosure (RBWAE) is calculated:
The ventilated RBWAE produced an approximately 24 percent (from 0.93 lb/h to0.71 lb/h) reduction in total emissions.
Without the RBWAE, the concentration in the total temporary enclosure exhaust was293 ppm, which is well above the OSHA allowable level of 100 ppm. If dilutionventilation was used to bring the total temporary enclosure exhaust down to 100 ppm, theflow rate would have to be increased from 5.6 to 16.3 m /min (198 cfm to 576 cfm). But3
if the ventilation system were redesigned with pick up points in the right places, it islikely that concentrations in the exhaust from the TTE would be lower. If dilutionventilation was used to bring the total temporary enclosure exhaust down to the 12 ppmachieved with the RBWAE in place, the total temporary enclosure exhaust would have tobe increased from 5.6 to 136 m /min (198 cfm to 4,801 cfm).3
With the ventilated RBWAE, 94 percent of the total emissions (i.e., 0.67 lb/h out of 0.71lb/h) are captured and prevented from entering the work area.
The enclosure was used to capture emissions from the major emission points of thepultrusion process (resin bath and wet-out area), and to create a small exhaust flow(1.6 m /min [58 cfm]) at high concentration (719 ppm) that is suitable for emission3
controls.
Advantages/Disadvantages. There are potential advantages of the enclosure concept forFRP/C processes:
Enclosures can dramatically reduce average operator breathing-zone styrene exposuresby providing a physical barrier between the operator and the styrene emission source.
Enclosures can significantly reduce flow rates to emission controls and thereforesignificantly reduce control costs.
The potential disadvantages of the enclosure concept are:
Use of enclosures may slow production.
While enclosures can dramatically reduce average operator breathing-zone styreneexposures, there is a potential for higher peak exposures (if the operator is exposed toconcentrations within the enclosure or when the enclosure is opened for changing setupor for any other reasons).
88
The higher concentrations within an enclosure may increase fire hazards within thefacility, if the concentration in the enclosure exceeds LEL.
Costs. Costs are examined here for the pultrusion wet-out-area and resin-bath enclosureinvestigated by SPI in September 1995, based on a hypothetical plant having 10 pultrusionmachines and operating 4,000 hours per year.
Without the RBWAEs, the flow rate and concentration for each pultrusion machine wouldeither be 16.3 m /min (576 cfm) at 100 ppm (if worker exposure is at the OSHA limit), or3
136 m /min (4,801 cfm) at 12 ppm (if worker exposure is equal to what is achieved with the3
RBWAE). Therefore, for 10 machines, the total flow rate would either be 163 m /min3
(5,760 cfm) at 100 ppm, or 1,360 m /min (48,010 cfm) at 12 ppm. Both these scenarios represent3
total uncontrolled emissions of 16.7 metric tons per year (18.4 tpy). The calculated control costsper unit of styrene removed for a catalytic oxidizer under these two scenarios would be$6,371/ton and $27,515/ton, respectively. It should be noted that these figures cited are frompilot test conditions, and not optimized.
The ventilated RBWAEs alone produce a 23 percent, or 3.8-metric-ton/yr (4.2-tpy),reduction in emissions. If the total capital investment to install the 10 RBWAEs (withventilation system) is assumed to be $100,000, and a capital recovery factor of 0.1459 is used,the total annual cost of the enclosures is $14,590. The cost per unit of emissions reduced(avoided) is $3,474/ton ($14,590 / 4.2 tons). The total exhaust flow for the 10 RBWAEs wouldbe 580 cfm, with a concentration of 719 ppm. The calculated control cost for a catalyticoxidizer under this scenario is $2,226/ton of styrene. Assuming a 95 percent control efficiency,the catalytic oxidizer will remove 13.5 tpy of styrene. The average annual cost per ton of styreneavoided using the enclosures and removed using a 95 percent efficiency catalytic oxidizer is$2,522/ton ($3,474/ton x 4.2 ton +$2,226/ton x 13.5 ton)/(4.2 ton +13.5 ton). Note: The costper unit of styrene emissions eleminated by this analysis is directly proportional to theassumed capital investment.
This cost analysis indicates that enclosures have the ability to significantly reduce controlcosts per unit of pollution removed (or avoided) in the pultrusion process or similar processes,such as SMC production and continuous lamination, when concentrated emission sources can beisolated and enclosed without interfering with the operation.
Note: The following discussion pertaining to enclosures for open molding processes is anidea or concept that has not yet been evaluated. RTI is evaluating this concept in an FRPfacility under an EPA funded program in the Summer of 1996.
It may be possible to use enclosures to contain spraying emissions in open moldingprocesses. Enclosures may be particularly suited to facilities that spray parts of nearly uniformsize and shape and conduct spraying in well-defined locations, for example, the gel coating ofsinks and vanities in the cultured marble industry and gel coating and chop sprayup in the tub

89
and shower industry. The concept of an enclosure for a sink/vanity gel coating operation isillustrated in Figure 6-8.

90
Figure 6-8.
91
The enclosure would be a “box,” with a limited natural-draft opening for inserting the spraygun and viewing the spraying operation. If possible, the area of the opening would be less than 5percent of the total enclosure surface area. The operator would stand outside the enclosure,extending only his hand or arm inside the enclosure. The enclosure would have an exhaust flowrate sufficient only to maintain flow into the enclosure. If possible, the flow would be sufficientto maintain a velocity of 61 m/min (200 ft/min) through any natural draft opening in theenclosure. The enclosure would have no structural function (i.e., the enclosure would only needto support itself). Therefore, the enclosure could consist of nonrigid sides on a rigid frame,which would lower its cost. The most important aspects of the enclosure concept are:
The operator stands outside the enclosure, placing only the spray gun inside theenclosure.Openings to the enclosure are as limited as possible, with a goal of less than 5 percent ofthe total enclosure surface area. Exhaust from the enclosure is as low as possible, maintaining only enough flow to keepemissions from escaping from the opening (s).
One important consideration in the design of an enclosure are the physical considerations ofmoving the part into and out of the enclosure, and the timing for removal of the part from theenclosure. The enclosure design needs to incorporate a method by which the part can be movedinto the enclosure and removed from the enclosure. As the enclosure is opened to remove thepart, styrene emissions in the enclosure may escape. RTI testing (Kong et al., 1995) hasindicated that approximately 39 percent of total gel coating emissions occur during the sprayingprocess, and approximately 50 percent of resin application emissions occur during spraying. Therefore, even though capture may be 100 percent while the part is within the enclosure,uncaptured emissions may occur when the part is outside the enclosure. The feasibility of theenclosure concept for open molding process is being evaluated in an EPA funded program in thesummer of 1996.
References
Andersson, I.M., Rosen G., and Kristensson J., Evaluation of a Ceiling-Mounted Low-ImpulseAir Inlet Unit for Local Control of Air Pollution, National Institute of Occupational Health,Sweden, 1993.
Darvin, C.H. and Ayer, J., U.S. Patent 5,221,230, “Paint Spraying Booth with Split FlowVentilation,” June 22, 1993.
Felix, L., Merritt, R., and Williamson, A. Evaluation of the Polyad FB Air Purification and®
Solvent Recovery Process for Styrene Removal, EPA/600/R-93-212 (NTIS PB94-130317). Research Triangle Park, NC: U.S. Environmental Protection Agency, November 1993.
92
GPRMC/CEFIC. UP-Resin Handling Guide, Jointly published by the European Organization ofReinforced Plastic/Composite Materials (GPRMC) and the Unsaturated Polyesters Sector Groupof European Chemical Industry Council (CEFIC), available from the British Plastics Federation,Bath Place 6, Rivington St., GB-London, England, EC2A 3JE, 1994.
Hughes, S., Ayer, J., and Sutay, R, Demonstration of Split-Flow Ventilation and Recirculation asFlow-Reduction Methods in an Air Force Paint Spray Booth, AL/EQ-TR-1993-0002, ArmstrongLaboratory, Environics Directorate, Tyndall AFB, Florida, July 1994.
Kong, E.J., Bahner, M.A., Wright, R.S., and Clayton, A.C., Evaluation of Pollution PreventionTechniques to Reduce Styrene Emissions from Open Contact Molding Processes, a draft reportprepared for the U.S. EPA, Air Pollution Prevention and Control Division, September 1995.
National Fire Protection Association (NFPA). Standard for Spray Application Using Flammableand Combustible Materials, NFPA 33. Quincy, MA, 1995.
Occupational Safety and Health Administration (OSHA). Occupational Safety and HealthStandards. 29CFR 1910.1000. Code of Federal Regulations. Washington, DC: Office of theFederal Register, pp. 6-18, July 1, 1993a.
Occupational Safety and Health Administration (OSHA). Respiratory Protection. 29 CFR1910.134. Code of Federal Regulations, Washington, DC: Office of the Federal Register, pp.421-425, July 1, 1993b.
Occupational Safety and Health Administration (OSHA). Minimum Maintained Velocities intoSpray Booths. 29 CFR 1910.94. Table G-10. Code of Federal Regulations, Washington, DC:Office of the Federal Register, pp. 193-194, July 1, 1993c.
Occupational Safety and Health Administration (OSHA). Spraying Finishing Using Flammableand Combustible Materials. 29 CFR 1910.107. Code of Federal Regulations, Washington, DC:Office of the Federal Register, pp. 274-284, July 1, 1993d.
Patkar, A.N., Reinhold, J.M., and Henderson G., “Demonstration of Capture and ControlEfficiency for a Styrene Emission Source,” in Proceedings for the Air and Waste ManagementAssociation 87th Annual Meeting & Exhibition, Cincinnati, OH, June 19-24, 1994.
Schweitzer, J., Pultrusion Industry Council Phase II Emission Study, SPI Composites Institute,February 5, 1996.
U.S. Environmental Protection Agency, Office of Air Quality Planning and Standards, Method204 Criteria for and Verification of a Permanent or Temporary Total Enclosures, Proposed inFederal Register, August 1995.
A-1
APPENDIX A
Development of Cost Functions for Styrene Emission Control Technologies
This Appendix presents the original cost data collected from various vendors. Otherreferences, including the OAQPS Control Cost Manual (Vatavuk, 1990), a report, and a paper inthe Chemical Engineering magazine are listed. The original equipment cost data were fittedwith linear regression to develop cost functions for equipment costs. The equipment costfunctions for various styrene emission control technologies are presented in Table 5-1.
Equipment cost curves for thermal oxidizers (at all heat recovery levels) were taken fromequipment cost equations 3.24 through 3.27 in the OAQPS Control Cost Manual. Fuelrequirements were calculated based on the principles of thermodynamics, and an assumed 10percent insulation losses. Electricity requirements were based on equations presented in theOAQPS Control Cost Manual, except that the electricity requirement for thermal oxidation with95 percent heat recovery was based on quotations by an equipment vendor.
Equipment cost curves for catalytic oxidizers with recuperative heat recovery (i.e., with heatrecoveries of 0, 35, 50 and 70 percent) were taken from equipment cost equations 3.29 through3.32 in the OAQPS Control Cost Manual. Fuel requirements were calculated based on theprinciples of thermodynamics, and 10 percent insulation losses. Electricity requirements werebased on equations in the OAQPS Control Cost Manual.
The equipment cost curve for catalytic oxidizers with regenerative heat recovery (i.e., withheat recovery of 95 percent) was based on equipment cost quotations from three vendors (Anguil Environmental Systems, Engelhard Corporation, and Setco, Inc.). The equipment costcurve and the cost quotations are depicted in Figure A-1.
The equipment cost curves for VOC condensers were based on equations presented in apaper by Vatavuk (Vatavuk, 1995).
The equipment cost curve for the MIAB system was based on quotations from the MIAB’sU.S. representative, Setco, Incorporated (Sundberg, Facsimiles dated December 22, 1995 andJanuary 26, 1996). The equipment cost curve and cost quotations are depicted in Figure A-2.
The equipment cost curve for the Thermatrix PADRE system was based on budgetaryquotation from Purus (Irvin, Facsimile dated November 8, 1995).
The equipment cost curve for the Polyad system were based on the midpoint (center) ofupper and lower cost curves provided by Polyad’s representative, Weatherly Inc. (Danielsson,Facsimile dated April 26, 1995).
A-2
The equipment cost curve for the rotary concentrator system was based on equipment costquotations from Durr, Industries (Klobucar, Facsimile dated March 14, 1996). The equipmentcost curve and cost quotations from Durr are depicted in Figure A-3. Quotes of rotaryconcentrator equipment cost from Munters Corporation (Drohan, Facsimile dated January 3,1996) are also shown in Figure A-3. However, Munters Corporation does not have industrialsystems in place, while Durr Industries has several operating systems in Japan; therefore, theDurr estimates, only, were used to develop cost functions.
The equipment cost curve for the fluidized-bed preconcentrator system was based on costdata provided by Environmental C&C, Inc. (Merboth, Letter dated March 28, 1996).
The equipment cost curve for biofiltration was developed based on budgetary quotes for anexhaust flow rate of 52,000 scfm by several vendors in a report (Haberlein and Boyd, 1995). The equipment cost curve and cost quotations are depicted in Figure A-4.
References
Haberlein, R.A., and Boyd, D., Maximum Achievable Control Technology for a HypotheticalFiberglass Boat Manufacturing Facility, prepared for National Marine ManufacturersAssociation, August 1, 1995.
Vatavuk, W.M.; OAQPS Control Cost Manual, 4th Ed. EPA-450/3-90-006 (NTIS PB90-169954); U.S. Environmental Protection Agency, Office of Air Quality Planning and Standards,Research Triangle Park, NC, January 1990.
Vatavuk, W.M.; “A Potpourri of Equipment Prices,” Chemical Engineering, August 1995;pp 68-73.
B-1
APPENDIX B
Cost Model for Styrene Emission Control Technologies
A discussion of the computer spreadsheet cost model (STY_COST.XLS for Excel andSTY_COST.WK3 for Lotus 1-2-3) developed for this project is included in this Appendix. Thiscost model includes a separate spreadsheet for each of the control technologies evaluated. Thesespreadsheets are listed by the order of appearance in the cost model:
A) EC&C - EC&C fluidized-bed preconcentrator systemB) Rotary - rotary concentrator systemC) Catalytic - catalytic oxidation processD) Condenser - condensation processE) MIAB - MIAB systemF) Polyad - Polyad systemG) Thermal - thermal oxidation processH) PADRE - Thermatrix PADRE systemI) Biofiltration - biofiltration process
General instructions for using the spreadsheets in the cost model:
1) Under “Inputs” in Column B, enter two of the following three items:a) Flow rate (cfm),b) Control device input mass (tons per year), or c) Concentration (at control device inlet) (ppm).
Do not enter values for all three items; the program will calculate (in Column C) the valuefor the item that you left blank.
2) Enter input values in Column B for items such as Facility Operating Schedule (hours peryear), electricity cost ($/kilowatt-hour), and fuel cost ($/million Btu). All inputs must be inthe correct units.
3) If you have received a plant-specific quote for the cost of a particular control device, enterthat cost in the first row having the title “Equipment Cost (EC)”. Note that the costs forother control devices in these spreadsheets are in July 1995 dollars. Therefore, you mustde-escalate the cost in the second row titled “Equipment Cost (EC)” into July 1995 dollars,if you will be comparing your site-specific equipment cost with other non-site-specific costslisted in these spreadsheets.
B-2
4) Read about how the calculations were developed for items such as:
a) “Total Direct Costs (TDC)” - based on capital cost factors shown in Table B-1, b) “Total Capital Investment (TCI)” - based on capital cost factors shown in Table B-1,c) “Direct Operating Costs, excluding fuel and electricity costs”, d) “Overhead, Property Taxes, Insurance, Administration”, and e) “Capital Recovery Cost”.
Adjust these calculations as needed. For example:
a) The lines titled “Total Direct Costs (TDC)” contain an assumed site preparation cost of$(5,000 + 2.3[flow rate]). This non-site-specific site preparation cost is the average ofvendor quotes and it is assumed for every control technology. If you have site-specificsite preparation costs, insert these in place of the calculated site-preparation costs.
b) The lines titled “Total Direct Costs (TDC)” contain an assumed building cost of zero(i.e., it is assumed that the control device is not located inside a building. If a buildingmust be built to house the control device at your plant, add this cost to the “Total DirectCosts”.
c) The “Capital Recovery Cost” calculation assumes a capital recovery factor of 0.14569,which represents a 10-year depreciation at a 7.5% annual interest rate. This capitalrecovery factor can be changed to represent a specific situation (for example, the capitalrecovery factor for 10-year depreciation at 10 percent interest is 0.16275).
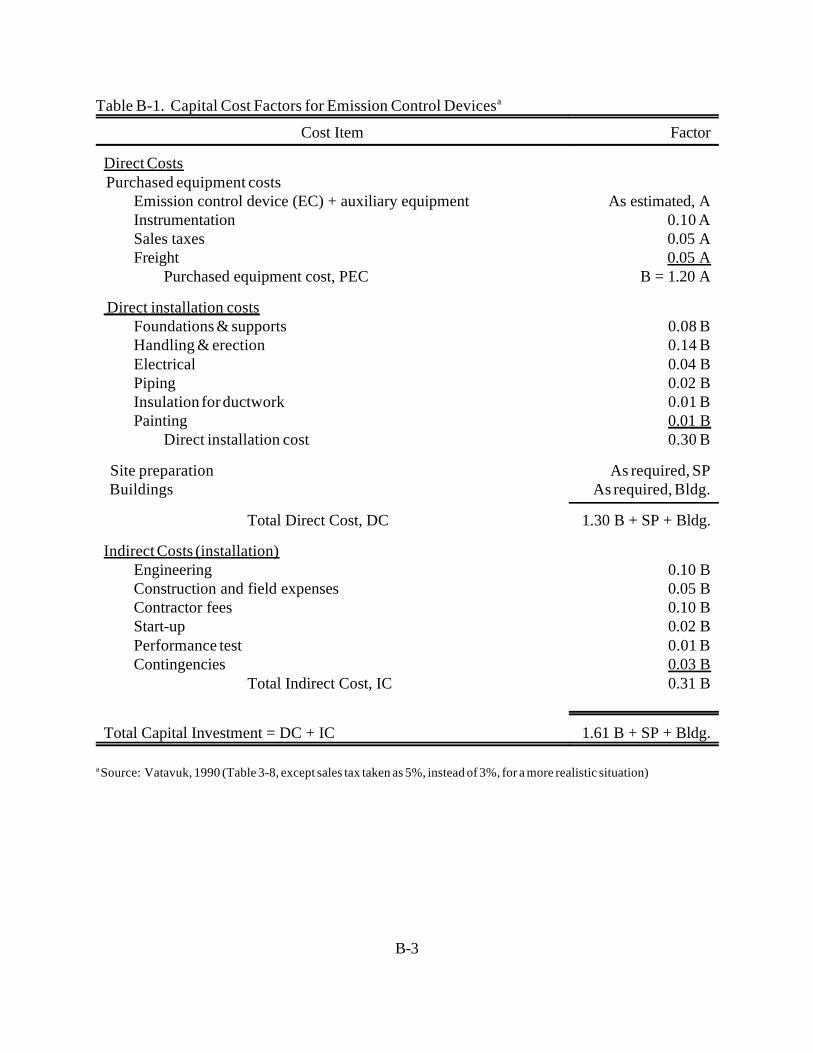
B-3
Table B-1. Capital Cost Factors for Emission Control Devicesa
Cost Item Factor
Direct Costs Purchased equipment costs
Emission control device (EC) + auxiliary equipment As estimated, AInstrumentation 0.10 ASales taxes 0.05 AFreight 0.05 A
Purchased equipment cost, PEC B = 1.20 A
Direct installation costsFoundations & supports 0.08 BHandling & erection 0.14 BElectrical 0.04 BPiping 0.02 BInsulation for ductwork 0.01 BPainting 0.01 B
Direct installation cost 0.30 B
Site preparation As required, SP Buildings As required, Bldg.
Total Direct Cost, DC 1.30 B + SP + Bldg.
Indirect Costs (installation)Engineering 0.10 BConstruction and field expenses 0.05 BContractor fees 0.10 BStart-up 0.02 BPerformance test 0.01 BContingencies 0.03 B
Total Indirect Cost, IC 0.31 B
Total Capital Investment = DC + IC 1.61 B + SP + Bldg.
Source: Vatavuk, 1990 (Table 3-8, except sales tax taken as 5%, instead of 3%, for a more realistic situation)a
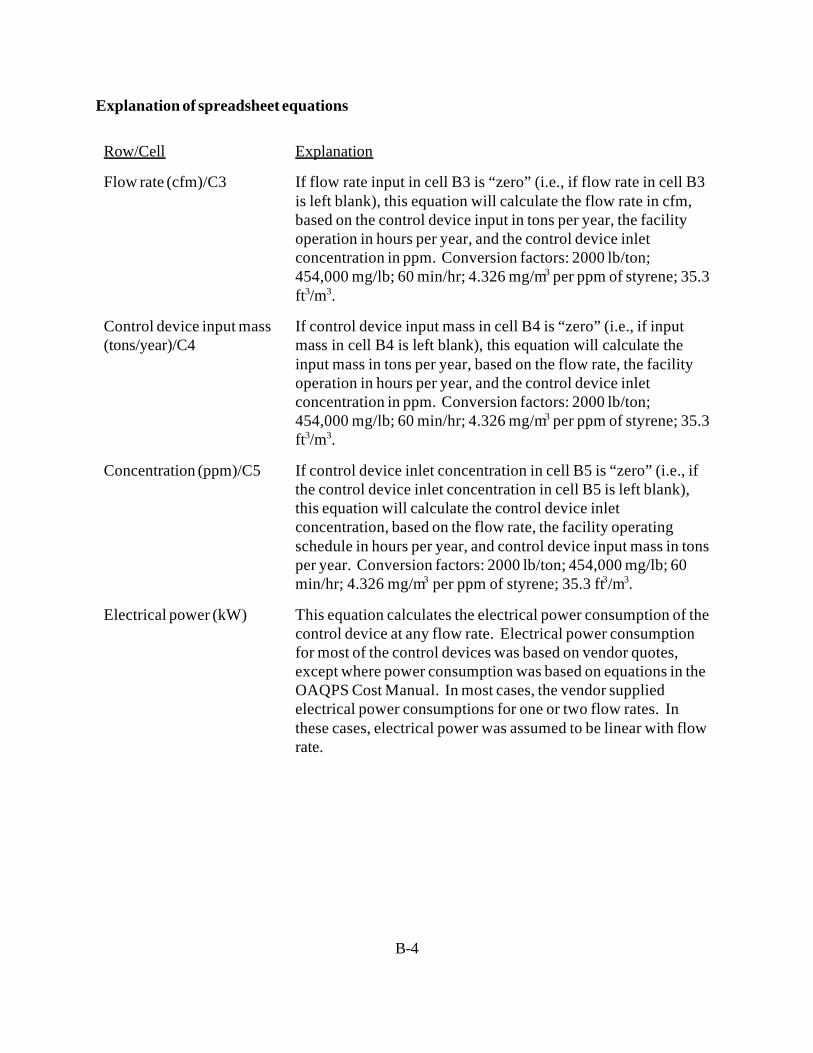
B-4
Explanation of spreadsheet equations
Row/Cell Explanation
Flow rate (cfm)/C3 If flow rate input in cell B3 is “zero” (i.e., if flow rate in cell B3is left blank), this equation will calculate the flow rate in cfm,based on the control device input in tons per year, the facilityoperation in hours per year, and the control device inletconcentration in ppm. Conversion factors: 2000 lb/ton;454,000 mg/lb; 60 min/hr; 4.326 mg/m per ppm of styrene; 35.33
ft /m .3 3
Control device input mass If control device input mass in cell B4 is “zero” (i.e., if input(tons/year)/C4 mass in cell B4 is left blank), this equation will calculate the
input mass in tons per year, based on the flow rate, the facilityoperation in hours per year, and the control device inletconcentration in ppm. Conversion factors: 2000 lb/ton;454,000 mg/lb; 60 min/hr; 4.326 mg/m per ppm of styrene; 35.33
ft /m .3 3
Concentration (ppm)/C5 If control device inlet concentration in cell B5 is “zero” (i.e., ifthe control device inlet concentration in cell B5 is left blank),this equation will calculate the control device inletconcentration, based on the flow rate, the facility operatingschedule in hours per year, and control device input mass in tonsper year. Conversion factors: 2000 lb/ton; 454,000 mg/lb; 60min/hr; 4.326 mg/m per ppm of styrene; 35.3 ft /m .3 3 3
Electrical power (kW) This equation calculates the electrical power consumption of thecontrol device at any flow rate. Electrical power consumptionfor most of the control devices was based on vendor quotes,except where power consumption was based on equations in theOAQPS Cost Manual. In most cases, the vendor suppliedelectrical power consumptions for one or two flow rates. Inthese cases, electrical power was assumed to be linear with flowrate.
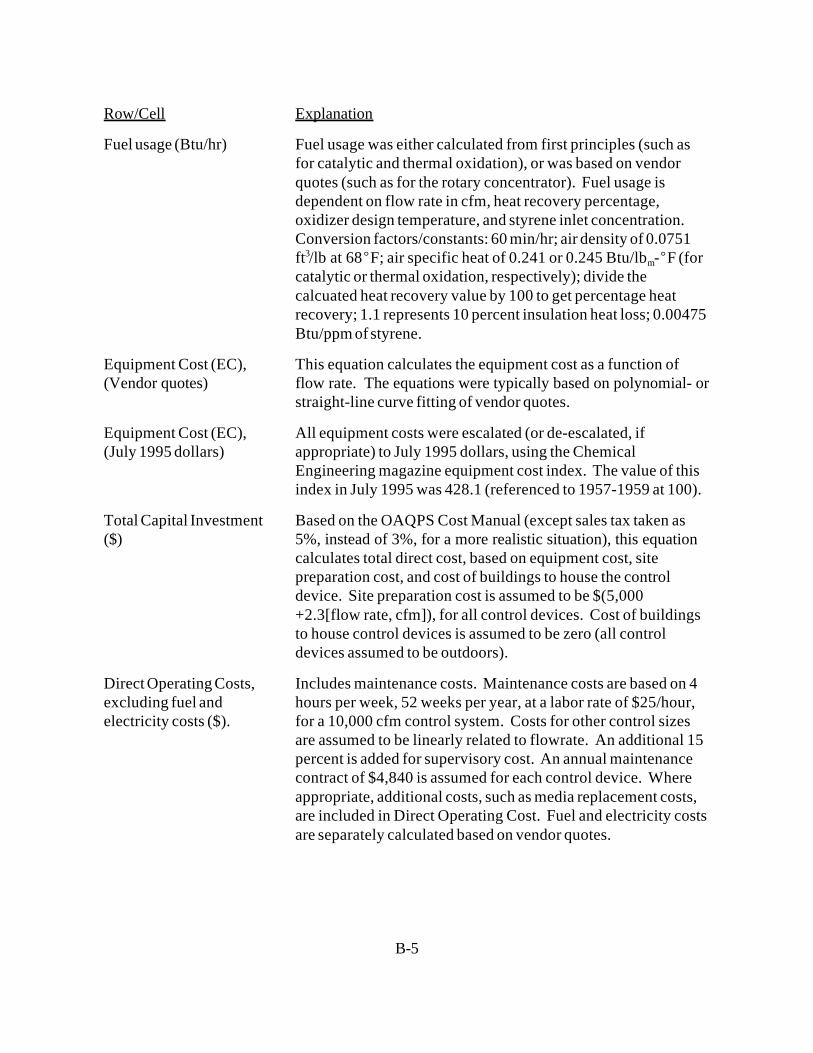
Row/Cell Explanation
B-5
Fuel usage (Btu/hr) Fuel usage was either calculated from first principles (such asfor catalytic and thermal oxidation), or was based on vendorquotes (such as for the rotary concentrator). Fuel usage isdependent on flow rate in cfm, heat recovery percentage,oxidizer design temperature, and styrene inlet concentration. Conversion factors/constants: 60 min/hr; air density of 0.0751ft /lb at 68 F; air specific heat of 0.241 or 0.245 Btu/lb - F (for3
m
catalytic or thermal oxidation, respectively); divide thecalcuated heat recovery value by 100 to get percentage heatrecovery; 1.1 represents 10 percent insulation heat loss; 0.00475Btu/ppm of styrene.
Equipment Cost (EC), This equation calculates the equipment cost as a function of(Vendor quotes) flow rate. The equations were typically based on polynomial- or
straight-line curve fitting of vendor quotes.
Equipment Cost (EC), All equipment costs were escalated (or de-escalated, if(July 1995 dollars) appropriate) to July 1995 dollars, using the Chemical
Engineering magazine equipment cost index. The value of thisindex in July 1995 was 428.1 (referenced to 1957-1959 at 100).
Total Capital Investment Based on the OAQPS Cost Manual (except sales tax taken as($) 5%, instead of 3%, for a more realistic situation), this equation
calculates total direct cost, based on equipment cost, sitepreparation cost, and cost of buildings to house the controldevice. Site preparation cost is assumed to be $(5,000+2.3[flow rate, cfm]), for all control devices. Cost of buildingsto house control devices is assumed to be zero (all controldevices assumed to be outdoors).
Direct Operating Costs, Includes maintenance costs. Maintenance costs are based on 4excluding fuel and hours per week, 52 weeks per year, at a labor rate of $25/hour,electricity costs ($). for a 10,000 cfm control system. Costs for other control sizes
are assumed to be linearly related to flowrate. An additional 15percent is added for supervisory cost. An annual maintenancecontract of $4,840 is assumed for each control device. Whereappropriate, additional costs, such as media replacement costs,are included in Direct Operating Cost. Fuel and electricity costsare separately calculated based on vendor quotes.
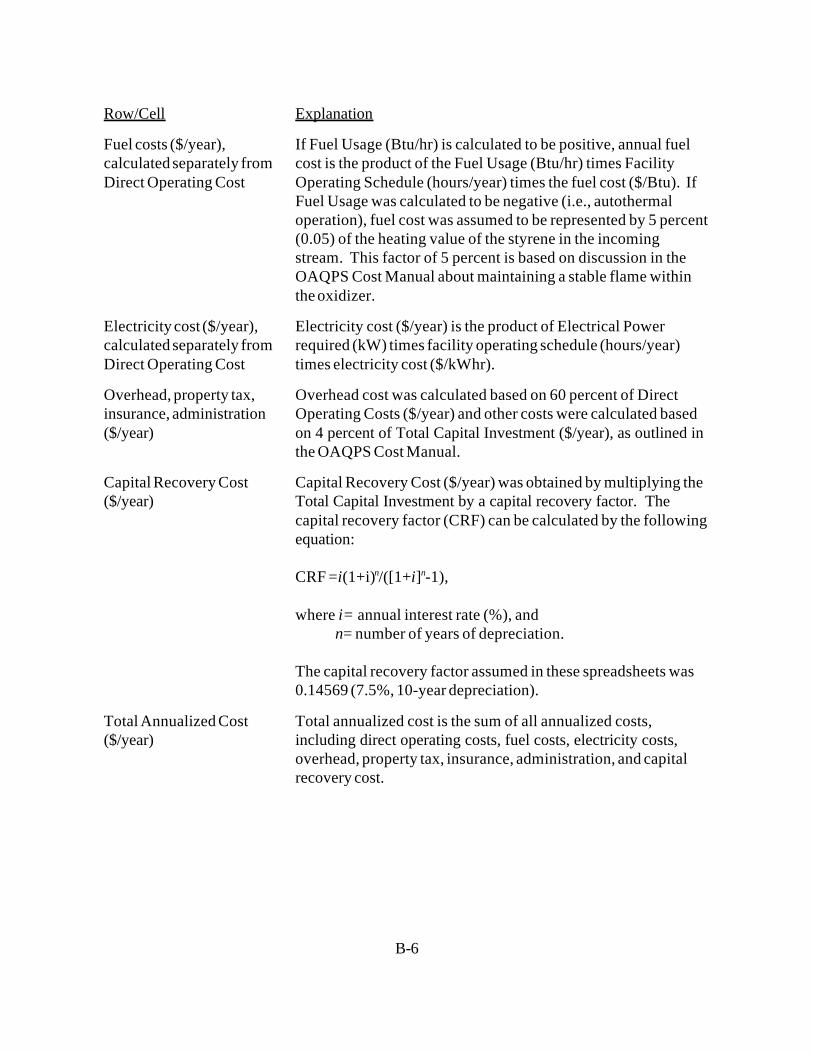
Row/Cell Explanation
B-6
Fuel costs ($/year), If Fuel Usage (Btu/hr) is calculated to be positive, annual fuelcalculated separately from cost is the product of the Fuel Usage (Btu/hr) times FacilityDirect Operating Cost Operating Schedule (hours/year) times the fuel cost ($/Btu). If
Fuel Usage was calculated to be negative (i.e., autothermaloperation), fuel cost was assumed to be represented by 5 percent(0.05) of the heating value of the styrene in the incomingstream. This factor of 5 percent is based on discussion in theOAQPS Cost Manual about maintaining a stable flame withinthe oxidizer.
Electricity cost ($/year), Electricity cost ($/year) is the product of Electrical Powercalculated separately from required (kW) times facility operating schedule (hours/year)Direct Operating Cost times electricity cost ($/kWhr).
Overhead, property tax, Overhead cost was calculated based on 60 percent of Directinsurance, administration Operating Costs ($/year) and other costs were calculated based($/year) on 4 percent of Total Capital Investment ($/year), as outlined in
the OAQPS Cost Manual.
Capital Recovery Cost Capital Recovery Cost ($/year) was obtained by multiplying the($/year) Total Capital Investment by a capital recovery factor. The
capital recovery factor (CRF) can be calculated by the followingequation:
CRF =i(1+i) /([1+i] -1), n n
where i= annual interest rate (%), and n= number of years of depreciation.
The capital recovery factor assumed in these spreadsheets was0.14569 (7.5%, 10-year depreciation).
Total Annualized Cost Total annualized cost is the sum of all annualized costs,($/year) including direct operating costs, fuel costs, electricity costs,
overhead, property tax, insurance, administration, and capitalrecovery cost.
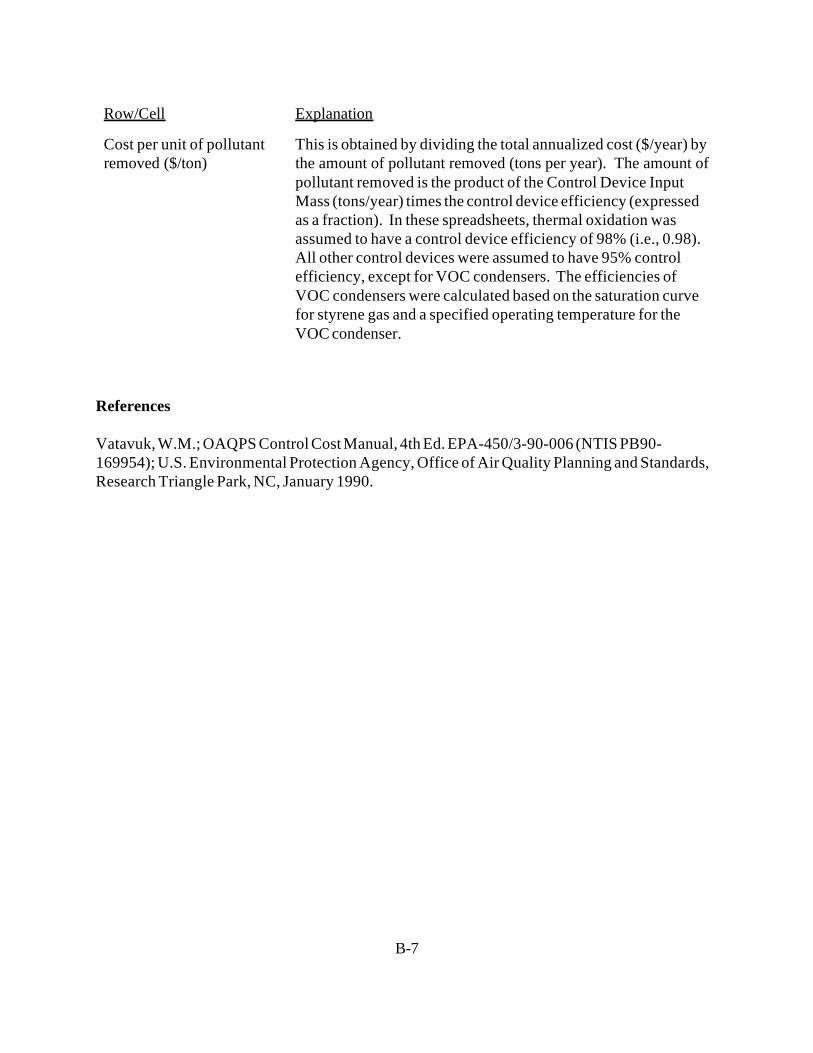
Row/Cell Explanation
B-7
Cost per unit of pollutant This is obtained by dividing the total annualized cost ($/year) byremoved ($/ton) the amount of pollutant removed (tons per year). The amount of
pollutant removed is the product of the Control Device InputMass (tons/year) times the control device efficiency (expressedas a fraction). In these spreadsheets, thermal oxidation wasassumed to have a control device efficiency of 98% (i.e., 0.98). All other control devices were assumed to have 95% controlefficiency, except for VOC condensers. The efficiencies ofVOC condensers were calculated based on the saturation curvefor styrene gas and a specified operating temperature for theVOC condenser.
References
Vatavuk, W.M.; OAQPS Control Cost Manual, 4th Ed. EPA-450/3-90-006 (NTIS PB90-169954); U.S. Environmental Protection Agency, Office of Air Quality Planning and Standards,Research Triangle Park, NC, January 1990.
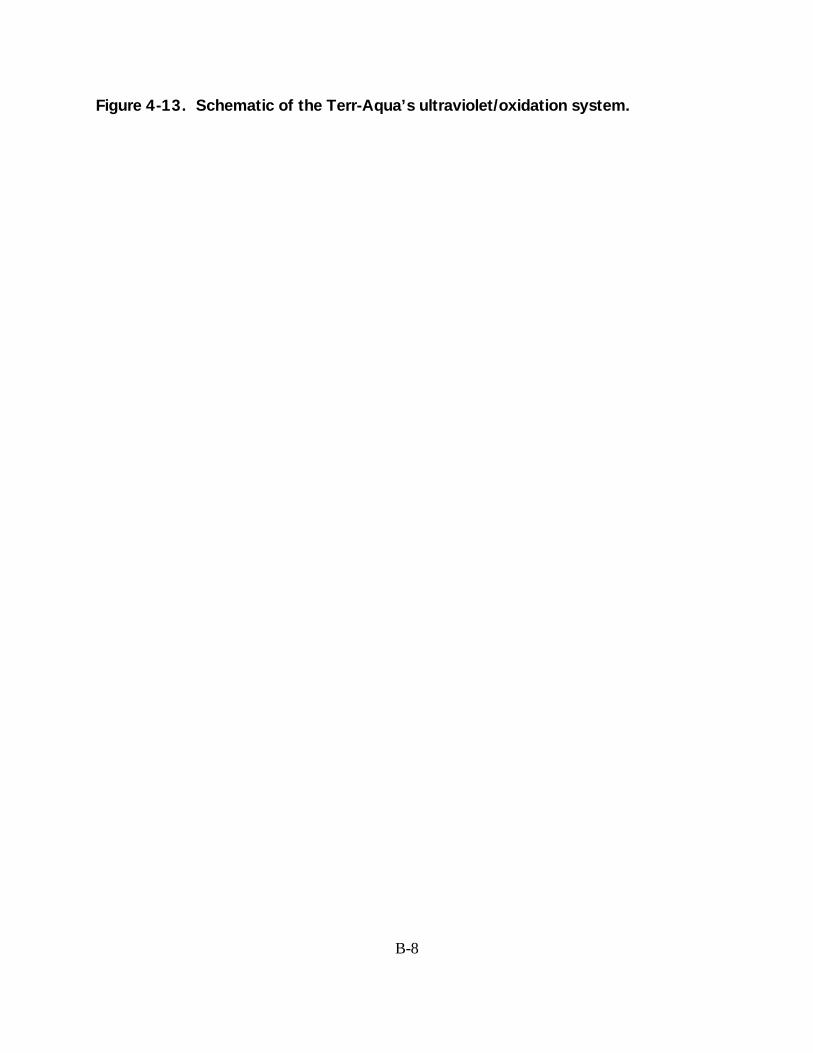
B-8
Figure 4-13. Schematic of the Terr-Aqua’s ultraviolet/oxidation system.


![Retrofit Emission Controls for Off-Road Diesel Engines · PDF fileJoe Kubsh Manufacturers of Emission Controls Association [MECA] ARB Off-Road Fleet Workshops December 18, 20, 21,](https://img.pdfslide.us/doc/110x75/5a8f93a17f8b9a4a268dce98/retrofit-emission-controls-for-off-road-diesel-engines-kubsh-manufacturers-of-emission.jpg)