Embed Size (px)
Citation preview

i
ASSESSMENT OF QUALITY OF WATER FROM PRIVATE HAND DUG WELLS
AND BOREHOLES WITHIN THE KWABENYA LOCALITY IN GREATER ACCRA
REGION OF GHANA
THIS THESIS IS SUBMITTED TO THE UNIVERSITY OF GHANA, LEGON IN
PARTIAL FULFILLMENT OF THE REQUIREMENT FOR THE AWARD OF MPHIL
NUCLEAR AND ENVIRONMENTAL PROTECTION DEGREE
BY
EVELYN DUODU
(10362758)
B.Ed (UCC), 2007
JULY, 2014
University of Ghana http://ugspace.ug.edu.gh

ii
DECLARATION
This thesis is the result of research work undertaken by Evelyn Duodu in the Department
of Nuclear Sciences and Applications, School of Nuclear and Allied Sciences, University
of Ghana under the supervision of
EVELYN DUODU ……………………… …………………………..
(Student) Date
DR T. T. AKITI ……………………… .…………………………
(Supervisor) Date
DR J. R. FIANKO ………………………. ………………………
(Supervisor) Date
University of Ghana http://ugspace.ug.edu.gh

iii
DEDICATION
This work is dedicated to my dear husband, Rev. Emmanuel Ofosu Sarfo, my lovely son
Ebenezer Ofosu Appiah and my late father Mr. Charles Duodu. You truly inspired me.
University of Ghana http://ugspace.ug.edu.gh

iv
ACKNOWLEDGMENT
I am most grateful to the almighty God for his mercies, love and kindness toward me,
without him this work would not have been completed successfully.
I sincerely appreciate the wonderful help of my two most formidable supervisors, Dr T T
Akiti and Dr J R Fianko. I want to thank them for their time, advice, guidance and
tolerance throughout the writing of the thesis.
My profound gratitude also goes to all the staff of National Nuclear and Research
Institute (G.A.E.C), especially Mr. Courage Argbey, Mr. David Saka, Mr Gibrilla Abass,
Mr. Peter Osei, Mr. Godfred Ayanu and Miss Ruby Torto for their immensely
contributions toward the success of this work. I wish to also thank Mr. Mark Aboagye of
Water Research Institute (CSIR-WRI), Accra for his support.
I am highly indebted to my siblings for supporting me financially. Lastly, to my dear
husband, Rev. Emmanuel Ofosu Sarfo for his prayers, encouragement and inspirational
words. It has really helped me. May the almighty God bless you all and meet you at the
point of your needs.
University of Ghana http://ugspace.ug.edu.gh

v
TABLE OF CONTENT
DEDICATION ................................................................................................................................ iii
ACKNOWLEDGMENT................................................................................................................. iv
TABLE OF CONTENT ................................................................................................................... v
LIST OF TABLES ......................................................................................................................... vii
LIST OF FIGURES ...................................................................................................................... viii
LIST OF ABBREVIATION ............................................................................................................ x
ABSTRACT .................................................................................................................................... xi
CHAPTER ONE .............................................................................................................................. 1
1.1 Introduction ...................................................................................................................... 1
1.2 Problem Statement ................................................................................................................. 5
1.3 Objectives .............................................................................................................................. 7
1.4 Justification ............................................................................................................................ 7
LITERATURE REVIEW ............................................................................................................ 9
2.1 INTRODUCTION ................................................................................................................. 9
2.2 Groundwater and hydrologic cycle ........................................................................................ 9
2.3 Groundwater Geochemistry ................................................................................................. 11
2.4 Groundwater Development in Ghana .................................................................................. 12
2.5 The Importance and uses of Groundwater in Ghana ............................................................ 13
2.6 Groundwater Quality in Ghana ............................................................................................ 17
2.7 The Use of Nuclear Technique in Groundwater Studies ..................................................... 22
METHODOLOGY .................................................................................................................... 25
3.1 Introduction .......................................................................................................................... 25
3.2 The Study Area .................................................................................................................... 25
3.2.1 Location ........................................................................................................................ 25
3.2.2 Climate .......................................................................................................................... 27
University of Ghana http://ugspace.ug.edu.gh

vi
3.2.3 Geology ......................................................................................................................... 28
3.5 Sampling .......................................................................................................................... 32
3.6 Field analysis ....................................................................................................................... 33
3.7 Laboratory analysis .............................................................................................................. 34
3.7.1 Physico-chemical analysis ................................................................................................ 34
3.7.2 Analysis of Trace Metals .............................................................................................. 35
3.8 Bacteriological Analysis ...................................................................................................... 36
3.8.2 Analysis of Total Heterotrophic Bacteria using Pour Plate Method ................................. 38
3.9 Analysis of Stable Isotopes .................................................................................................. 38
3.10 Water Quality Index ........................................................................................................... 39
3.11 Quality Control /Quality Assurance ....................................................................................... 42
3.12 Statistical Analysis ............................................................................................................. 42
RESULTS AND DISCUSSION ................................................................................................ 43
4.1 Introduction .......................................................................................................................... 43
4.2 Hydrochemistry.................................................................................................................... 43
4.3 Nutrients in Groundwater .................................................................................................... 52
4.4 Hydrochemical Facies of Groundwater ............................................................................... 57
4.5 Bacteriological Indicators for Groundwater samples .......................................................... 58
4.6 Trace Metals ........................................................................................................................ 67
4.7 Isotopic Composition of Groundwater ................................................................................. 70
4.8 Water Quality Index (WQI) ................................................................................................. 73
CHAPTER FIVE ........................................................................................................................... 76
SUMMARY, CONCLUSION AND RECOMMENDATIONS ................................................ 76
5.3 RECOMMENDATIONS ..................................................................................................... 80
University of Ghana http://ugspace.ug.edu.gh

vii
LIST OF TABLES
Table 1: Water Quality Parameters, their Standard Values and
the Assigned Weighting Factors……………………………… 40
Table 2: Water Quality Index Scale…………………………………… 43
Table 3: Statistical Summary of Bacteriological Indicator Results
of Hand Dug Wells and Boreholes for the Wet Season………… 59
Table 4: Results of the calculated WQI of the sampling points……………. 71
University of Ghana http://ugspace.ug.edu.gh

viii
LIST OF FIGURES
Figure 1: Plot of 2H against
18O showing the Global Meteoric Water Line (GMWL)
and some processes which can modify the isotopic composition of
groundwater……………………………………………………… 26
Figure 2: Map of the Study area…………………………………………….. 26
Figure 3: Geology of the study area…………………………………………. 29
Figure 4: Map showing the sampling locations of the study area…………… 31
Figure 5: pH of groundwater samples from the study area................................ 44
Figure 6: Map showing conductivity in the groundwater samples of the study area 47
Figure 7: Levels of SO42-
and Cl- in groundwater samples…………………. 49
Figure 8: Map showing chloride concentration in groundwater samples of the
study area…………………………………………………………… 51
Figure 9: Nitrate (mg/L) values in hand dug wells and stream for the wet
and dry seasons……………………………………………………… 52
Figure 10: Nitrate levels in borehole samples for the wet and dry seasons…… 53
Figure 11: Map showing nitrate concentration in groundwater samples of the
study area………………………………………………………… 54
Figure 12: Map showing sodium concentration in groundwater samples of
the study area……………………………………………………… 56
University of Ghana http://ugspace.ug.edu.gh

ix
Figure 13: Classification of hydrochemical facies using the Piper Plot……………..58
Figure 14: Total coliform values in hand dug wells and a stream for the wet season 60
Figure 15: Total coliform values in boreholes for the wet season………………… ..61
Figure 16: THB (/1ml) values in hand dug wells and stream for the wet season…….62
Figure 17: THB (/1ml) values in boreholes for the wet season…………………… …61
Figure 18: Map showing total coliform in groundwater samples of the study area… 65
Figure 19: Levels of iron in hand dug wells and a stream for the wet and the dry
seasons……………………………………………………………… 67
Figure 20: Levels of iron in boreholes for the wet and the dry seasons…………… 68
Figure 21: Relationship between hydrogen-2 and oxygen-18 isotopes for
Hand dug wells and boreholes in the study area during the wet season. 71
Figure 22: A Plot showing the relationship between Conductivity and δ18O for
groundwater samples and surface water……………………… 72
University of Ghana http://ugspace.ug.edu.gh

x
LIST OF ABBREVIATION
APHA - American Public Health Association
CSIR - Council for Scientific and Industrial Research
DA - District Assembly
EDTA - Ethylene diamine tetra acetic acid
EPA - Environmental Protection Agency
GIS - Geographical Information System
GSA - Ghana Standard Authority
GMA - Ghana Meteorological Agency
GWCL - Ghana Water Company Limited
MDGs - Millennium Development Goals
TDS - Total Dissolved Solids
U.S.A - United States of America
UNEP - United Nations Environment Programme
UNESCO - United Nations Educational, Scientific and Cultural Organisation
WHO - World Health Organisation
WRC - Water Resources Commission
WRI - Water Research Institute
KVIP - Kumasi Ventilated Improved Pit
KHD - Kwabenya Hand Dug Well
KBH - Kwabenya Borehole
University of Ghana http://ugspace.ug.edu.gh

xi
ABSTRACT
Groundwater resource development in Ghana contributes substantially to the socio-
economic development of Ghana. Utilization of water for domestic, irrigation and
industrial purposes for about 80% of the rural – urban population in the Kwabenya
Community within the Ga East Municipality are primarily dependent on existing
groundwater resources. However, groundwater potential is under serious threat and run a
high risk of pollution by agrochemicals, municipal, industrial, and domestic wastes due to
population explosion. The indiscriminate sitting of boreholes and hand dug wells in the
Kwabenya community without proper planning have raised concerns about potentially
adverse effects on human health and the environment.
In this study, the quality of water from private hand dug wells and boreholes within
Kwabenya community in Greater Accra region of Ghana were assessed. The
physicochemical, bacteriological and nutrient levels, as well as, the seasonal trends in the
groundwater were also evaluated. The study also assessed the origin and mixing pattern
of the groundwater in the Kwabenya locality using stable isotopes and determines the
water quality index of groundwater within the community.
The results of the study revealed that water from boreholes and hand dug wells sampled
were slightly acidic to basic with few localized areas showing strong acidic groundwater.
Majority of the groundwater samples analyzed (85 %) were found to be fresh since their
total dissolved solids (TDS) did not exceed 1000 mgL-1
(WHO, 2011). The total
dissolved solids (TDS) of the hand dug wells varied from 256 mg/L to 761 mg/L while
that of the borehole varied from 120.50 mg/L to 1003 mg/L.
University of Ghana http://ugspace.ug.edu.gh

xii
Relatively low concentrations of inorganic constituents were found in water from hand
dug wells and boreholes from the study area. Generally, the major anions (chloride [Cl-],
nitrate [NO3-], and sulphate [SO4
2-]) in the groundwater samples were low. The low
values suggested minimal anthropogenic influence because of the minimal industrial
activity in the Ga East District. The hand dug wells were found to have higher nitrate
content than the boreholes. Hand dug wells and boreholes which were closer to septic
tanks, soakaway and KVIPs measured nitrate concentration above the WHO limit (2011).
The concentration of the major cations were in the order of Na+>Ca
2+>K
+>Mg
2+. The
hydrochemical facies identified Na-Cl as the main water type within the locality.
Hand dug wells and boreholes which were less or about 10 m away from septic tanks,
soakaway and KVIPs were found to be highly contaminated with total coliform, faecal
coliform, E. coli and total heterotrophic bacterial.
Stable isotope composition of δ18
O and δ2H of hand dug wells and boreholes showed that
recharge is by direct precipitation of -3.5 δ 18
O ‰ VSMOW rainfall infiltration and plot
of conductivity versus δ18
O confirm complete dissolution as precipitation dissolves
materials of the aquifer.
The results of the computed water quality index (WQI) indicated that most of the
groundwater in the study area (63.64% hand dug wells and 68.42% boreholes) showed
‘excellent water’ quality and 32.25% were found to be of poor quality and unsuitable for
drinking without treatment.
University of Ghana http://ugspace.ug.edu.gh

1
CHAPTER ONE
1.1 Introduction
The exploitation of groundwater for water supply needs of many urban and rural
communities in Africa has been on the increase in the last decade. In Ghana, groundwater
continues to play an important role in the socio-economic development of the country. In
many rural and urban communities such as the Kwabenya locality in the Ga East District,
utilization of water for domestic, irrigation and industrial uses are primarily dependant on
existing groundwater resources. However, groundwater resources potential is under
serious threat due to increasing population density, growing interest in mechanized
agricultural practices and rapid urbanization, as well as, domestic and industrial usage.
In Ghana, most of the drinking water in the urban areas is through the collection,
treatment, and purification of surface water from rivers such as Densu, Pra, Birim,
Ayensu, and Volta. Most rural settlements traditionally rely on raw surface water from
sources such as streams, lakes, rivers, ponds, and unpondered reservoirs. The quality of
which is in doubt hence the manifestation of waterborne-related diseases such as
diarrhea, guinea worm, river blindness, dysentery, etc. The idea of providing groundwater
as a replacement for seemingly pathogen infested surface water resources was mooted
from the fact that groundwater being scheduled from the atmosphere would be less
vulnerable to pollution. Nevertheless, Ghana water management study in 1997 revealed
that groundwater is also vulnerable to pollution due to anthropogenic and natural
processes (Nii Consult, 1998). Additional groundwater from hard rock areas is known to
University of Ghana http://ugspace.ug.edu.gh
2
be vulnerable to low quality problems that may have serious impacts on human health
(Smedley et al, 1995).
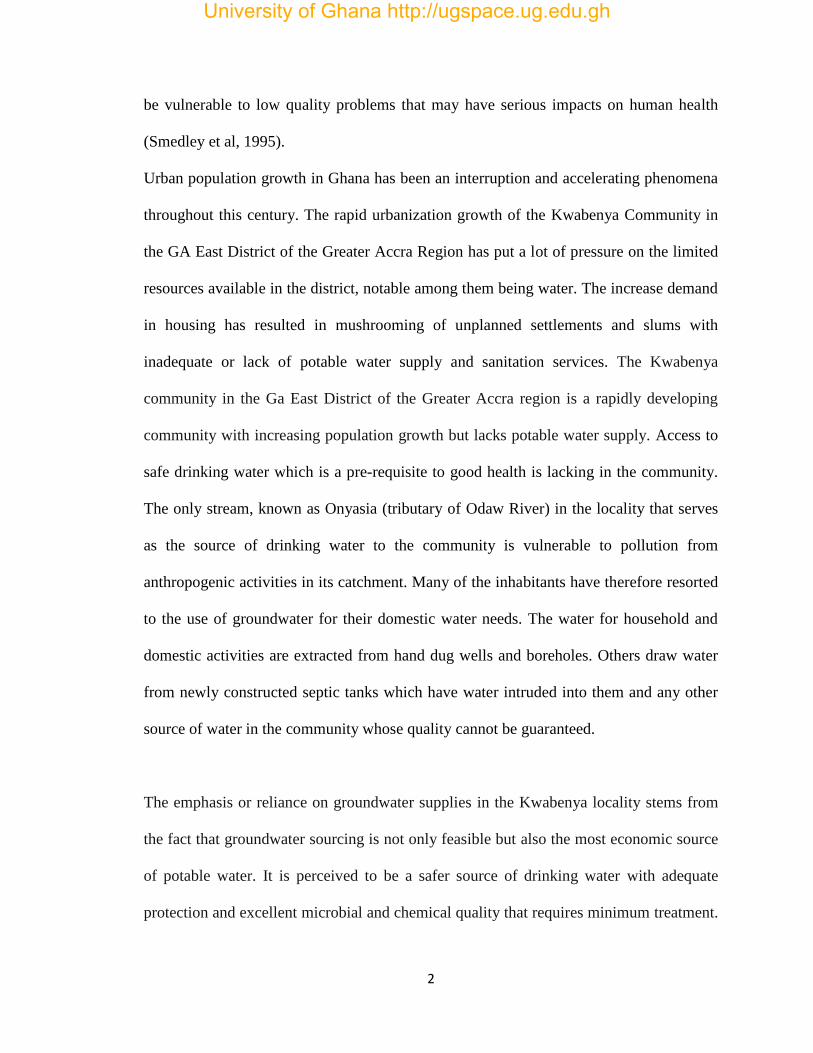
Urban population growth in Ghana has been an interruption and accelerating phenomena
throughout this century. The rapid urbanization growth of the Kwabenya Community in
the GA East District of the Greater Accra Region has put a lot of pressure on the limited
resources available in the district, notable among them being water. The increase demand
in housing has resulted in mushrooming of unplanned settlements and slums with
inadequate or lack of potable water supply and sanitation services. The Kwabenya
community in the Ga East District of the Greater Accra region is a rapidly developing
community with increasing population growth but lacks potable water supply. Access to
safe drinking water which is a pre-requisite to good health is lacking in the community.
The only stream, known as Onyasia (tributary of Odaw River) in the locality that serves
as the source of drinking water to the community is vulnerable to pollution from
anthropogenic activities in its catchment. Many of the inhabitants have therefore resorted
to the use of groundwater for their domestic water needs. The water for household and
domestic activities are extracted from hand dug wells and boreholes. Others draw water
from newly constructed septic tanks which have water intruded into them and any other
source of water in the community whose quality cannot be guaranteed.
The emphasis or reliance on groundwater supplies in the Kwabenya locality stems from
the fact that groundwater sourcing is not only feasible but also the most economic source
of potable water. It is perceived to be a safer source of drinking water with adequate
protection and excellent microbial and chemical quality that requires minimum treatment.
University of Ghana http://ugspace.ug.edu.gh

3
Groundwater development in the Kwabenya locality have often been hampered among
other things by the improper waste disposal, leakage of underground storage tanks, and
seepage of agrochemicals from vegetable farms. Chemical and microbiological activities
are the major threats to the effect of total reliance on groundwater as source of drinking
water.
In developing countries, thousands of children under five years die daily due to drinking
contaminated water (WHO, 2004). Thus, lack of safe drinking water supply, basic
sanitation and hygienic practices is associated with high morbidity and mortality from
excreta related diseases such as cholera, diarrhea, burulli ulcer, river blindness, dysentery,
and typhoid. Even though, Ghana is greatly endowed with numerous water resources, the
quantity of available potable water changes markedly from season to season as well as
from year to year. The availability of water is also decreasing mainly due to rainfall
variability (climate change), rapid population growth, increased environmental
degradation, pollution of rivers from galamsey activities in Ghana and draining of
wetlands (WRC, 2008; Ackah et al., 2011).
The primary goal of water quality management from health perspective is to ensure that
consumers are not exposed to pathogens that are likely to cause diseases. Protection of water
sources and treatment of water supplies have greatly reduced the incidence of these diseases
in developed countries (Craun, 1986; Grabow, 2000). One of the goals of the United
Nations Millennium Development Goals (MDG’s) is to reduce persistent poverty and
promote sustainable development worldwide especially in developing countries through
the improvement of drinking water supply and sanitation. The MDG target for water is to
University of Ghana http://ugspace.ug.edu.gh

4
half by 2015 the proportion of people without sustainable access to safe drinking water
and basic sanitation. The WHO (2004) estimates that if these improvements were to be
made in sub-Saharan Africa alone, 434,000 child deaths due to diarrhoea would be
averted annually.
Ghana’s, groundwater resources are under increasing pressure in response to threats of
rapid population growth, coupled with the establishment of human settlements lacking
proper water supply and sanitation services (Anim et al., 2011). Pollution of groundwater
has become alarming in response to increasing knowledge on their effect to human health
(Anazawa et al, 2004). Research has found chlorides, nitrogen compounds, heavy metals,
organic carbon, hydrocarbons, chlorinated-aromatic-halogenated hydrocarbons, fecal
coliform and fecal streptococci, pesticides, ethylene glycol and many other contaminants
items as constituents of runoff from urban impervious surfaces. Surface water or runoff
water can carry numerous contaminants from legal and illegal sources; dumping, leaky
tanks and infiltration of human wastes, both fecal and household, from septic tanks or
direct waste dumping into aquifer (Foster, 1990).
Disposal of liquid effluent, sludge and landfills have been identified as one of the major
threats to groundwater resources (US EPA, 1984). Waste from urban, municipal and
domestic communities placed in landfills or open dumps are subjected to either ground
water underflow or infiltration from precipitation. The dumped wastes gradually release
its initial interstitial water and some of it’s decomposed by- products get into water.
Areas near effluent and refuse disposal sites have a greater possibility of groundwater
University of Ghana http://ugspace.ug.edu.gh

5
contamination because of the potential pollution source of leachate originating from the
nearby site. The leachate which contains innumerable organic and inorganic compounds
accumulates at the bottom of landfill and percolates through the soil in the groundwater
system. Such contamination of groundwater resources poses substantial risks to local
resource and user and natural environment. Water has been identified as the major means
of the spread of infectious diseases such as typhoid, dysentery and cholera and therefore,
needs to be constantly monitored, (USEPA, 2005). Rapid urbanization in Ga East District
with indiscriminate use of the ground for liquid effluent and solid waste disposal present
a complex array of potential nonpoint pollution source to groundwater in the district.
1.2 Problem Statement
In many rural – urban communities in the Ga East Municipality, utilization of water for
domestic, irrigation and industrial are primarily dependant on groundwater resources.
However, groundwater resources are under a serious threat due to high population growth
density, high interest in mechanized agricultural practices and rapid urbanization, as well
as, domestic and industrial usage. Due to rapid population growth and lack of proper
water supply and sanitation services in the Kwabenya locality, groundwater resources are
under increasing pressure. There has been an increase in indiscriminate drilling of hand
dug wells and boreholes by individuals without proper regulations. Some hand dug wells
and boreholes are sited near septic tanks. Septic systems that are improperly sited,
designed, constructed, or maintained can contaminate groundwater with bacteria, viruses,
nitrates, detergents, oils, and other chemical substances.
University of Ghana http://ugspace.ug.edu.gh

6
The idea of providing groundwater as an alternative for seemingly polluted (pathogen
infested) surface water resource was mooted from the fact that groundwater being
secluded from the atmosphere would be less vulnerable to pollution. Nevertheless, Ghana
water management study in 2007 revealed that groundwater is also vulnerable to
pollution due to anthropogenic and natural processes. Contaminated groundwater
resources have important implications on health and the environment. Groundwater
quality can be affected by varied pollution sources.
A connection between agricultural and groundwater pollution is well established.
According to Fianko (2010), applications of nitrogen-phosphorous-potassium (NPK)
fertilizers have been increasing in the Ga East Municipality over the last few decades; as
a result, high concentration of NO3-N has been reported to be common in groundwater
sources in Kwabenya and its environs.
The demand for adequate water to satisfy the ever-increasing needs for domestic,
industrial and agricultural uses in Kwabenya and its environs is high. It is, therefore,
imperative for the existing water bodies to be protected from contamination. The siting of
refuse damp and other human activities have been observed as having effect on the
quality of groundwater. Despite the popularity of groundwater in the Kwabenya
Community and its environs in the Ga East District, only little knowledge is available on
the geochemical and biogeochemical processes that directly or indirectly affect its
quality. It is envisage that the study will produce credible data to assist in the proper
management of the groundwater resources in the Ga East District of the Greater Accra
Region of Ghana.
University of Ghana http://ugspace.ug.edu.gh

7
1.3 Objectives
This study seeks to assess the quality of water from private hand dug wells and boreholes
within the Kwabenya Locality in Greater Accra region.
The Specific Objectives are to;
• Determine the levels of physicochemical parameters and heavy metals in ground water.
• Determine the effects of seasonal variation on the parameters.
• Determine the levels of bacteriological contaminants of the hand dug wells and
boreholes, as well as, other water sources from the locality.
• Investigate the origin and the mixing pattern of the groundwater in the Kwabenya
locality using stable isotopes.
•Determine the overall quality of the groundwater samples in the locality using water
quality index.
1.4 Justification
Water is life, and clean water is a necessity for the survival of every living organism. This
is because many water borne diseases such as diarrhea, dysentery, cholera, and typhoid
occurred as a result of using contaminated water. The importance of groundwater quality
in human health has recently attracted a great deal of interest (Vasanthavisar, et, al,
2010). About 80% of all illness in developing countries is related to water and sanitation
and 15% of all child mortality below the age of five years in developing countries is
attributed to diarrhoeal diseases (WHO, 2004; Thompson and Khan, 2003).
University of Ghana http://ugspace.ug.edu.gh

8
Groundwater is the most important source of domestic, industrial and agricultural water
supply in the world. Many communities in Africa depend greatly on groundwater. Due to
increase in surface water pollution and expensive nature of treatment, its exploitation has
reduced, resulting in an increase dependent on groundwater abstraction (Kortatsi, 2007).
Septic systems that are not properly sited, designed, constructed, or maintained can
contaminate ground water with bacteria, viruses, nitrates, detergents, oils, and other
chemical substances that may have adverse effects on human life, more especially
pregnant women, nursing mothers and children which can result in methemoglobinaemia
“blue babies syndrome’’.
The results obtained from this investigation would be used to assess groundwater quality
in Kwabenya community in Greater Accra region of Ghana. It will also provide the
baseline data for future investigation which will aid in assessing the potential risk to
human and the environment.
University of Ghana http://ugspace.ug.edu.gh

9
CHAPTER TWO
LITERATURE REVIEW
2.1 INTRODUCTION
People living in both rural and urban communities across the globe are resorting to the
use of groundwater as the source of potable water supply due to the intermittent surface
water shortage and pollution as well as reduction in rains and climate change. It has been
estimated that lack of clean drinking water and sanitation services leads to water-related
diseases globally and between five to ten million deaths occur annually (Snyder and
Merson, 1982). Drinking water supply in urban areas is through the collection, treatment,
and purification of surface water from rivers, streams and dams while most rural
settlements traditionally rely on raw and untreated surface waters whose quality is always
in doubt hence the manifestation of numerous water-related diseases in most rural
communities around the globe. Notwithstanding, the anticipated cost of treating polluted
surface water, many countries have shifted attention to groundwater resource
development to meet the ever increasing rural and urban population water requirements,
thus making groundwater the principal source of potable water supply in many countries.
2.2 Groundwater and hydrologic cycle
Groundwater is the water that occurs naturally beneath the Earth’s surface and constitutes
about two thirds of the freshwater resources of the world (Smith, 2005). Groundwater
occurs in many different geological formations. The interaction between groundwater and
surface water system is a key component of the hydrological cycle and an understanding
of their connectivity is fundamental for sustainable water resource management. The
University of Ghana http://ugspace.ug.edu.gh

10
infiltration of water into the ground is the transition from surface water to ground water
and it depends upon soil or rock permeability as well as other factors. Infiltrated water
may reach the aquifer which stores and transmit significant quantities of water (Gunn,
2004).
Groundwater recharge is an essential part of the hydrologic cycle, in which water from
the surface works its way into the subsurface, replenishing groundwater supplies (De
Vries and Simmers, 2002). The most important factor in groundwater recharge is the time
delay between the time when the meteoric water enters the soil profile, and the time it is
manifested as an effectively exploitable groundwater source. The actual recharge rate is
controlled by several factors, such as the amount and rate of rainfall that infiltrate into the
soil without being lost to surface runoff or evapotranspiration, the initial amount of water
in the soil, the elevation of the recharge surface relative to the discharge area, the
horizontal hydraulic conductivity of the aquifer being recharged and its hydraulic
gradient, the vertical hydraulic conductivity of the soil being recharged, and the presence
of man – made alterations to the subsurface, such as drainage tiles that carry water away
as runoff into rivers and streams (Leap, 1999).
Groundwater discharge may occur in low land areas in the form of seepage and potential
spring discharge. Naturally, groundwater discharge systems are not only the flow of
spring’s water into streams or wetlands but also evaporations from upper parts of
capillary fringe where groundwater is very close to the surface (Jenkins et al., 1994).
When groundwater discharge exceeds recharge of the system, declining of the water
University of Ghana http://ugspace.ug.edu.gh

11
table can occur, resulting in springs drying up and wells having to be dug to deeper levels
(Balek, 1989). If water is over abstracted out of a confined aquifer, pore pressure reduces
in the aquifer and that could result in compaction of the now dry aquifer resulting in land
subsidence.
2.3 Groundwater Geochemistry
The assessment of groundwater resources involves a greater understanding of various
parameters related to groundwater formation, movement and distribution in the prevailing
hydrogeologic environment. It involves identification and characterization of
hydrogeologic units, type of aquifer, groundwater flow system as well as the interaction
of surface and groundwater. Groundwater geochemistry is governed by reactions between
water and the minerals present in the rock. These minerals include silicon, aluminium,
and oxygen, with varying amount of alkalis and alkaline earth elements (McSween,
2003). The other minerals commonly found in groundwater reservoirs are carbonates
such as calcite and dolomite. Once rainwater percolates into the earth’s crust, it reacts
with the minerals in the groundwater reservoirs. The composition of the water thus
reflects the composition of the rocks (Ragnarsdottir, 2010).
The concentrations of inorganic constituents in groundwater are controlled by chemical
equilibria which can be described in terms of the solubility of a given mineral (Elango,
2010). The ionic composition and pH of groundwater are governed by the mineralogy of
the rock in the groundwater reservoir. Waters that are rich in dissolved constituents are
University of Ghana http://ugspace.ug.edu.gh
12
often referred to as ‘mineral waters’. When they contain calcium carbonate gas (CO2)
they are described as carbonated (Ragnarsdottir, 2010).
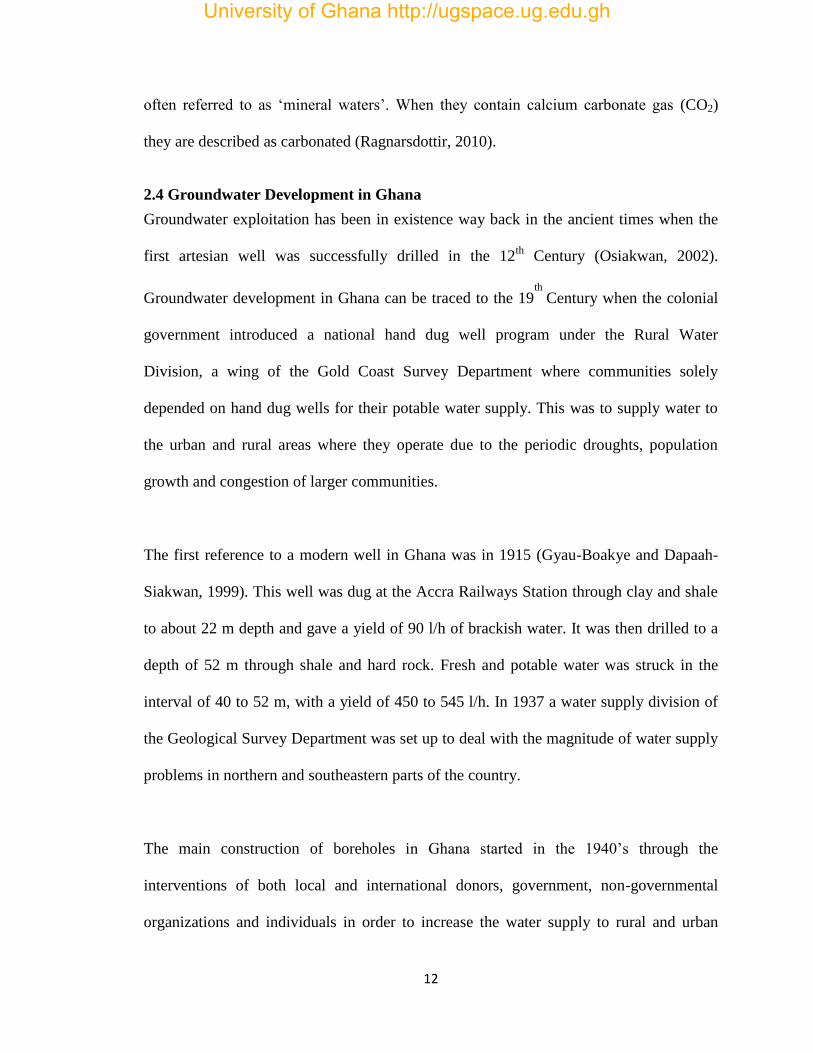
2.4 Groundwater Development in Ghana
Groundwater exploitation has been in existence way back in the ancient times when the
first artesian well was successfully drilled in the 12th
Century (Osiakwan, 2002).
Groundwater development in Ghana can be traced to the 19th
Century when the colonial
government introduced a national hand dug well program under the Rural Water
Division, a wing of the Gold Coast Survey Department where communities solely
depended on hand dug wells for their potable water supply. This was to supply water to
the urban and rural areas where they operate due to the periodic droughts, population
growth and congestion of larger communities.
The first reference to a modern well in Ghana was in 1915 (Gyau-Boakye and Dapaah-
Siakwan, 1999). This well was dug at the Accra Railways Station through clay and shale
to about 22 m depth and gave a yield of 90 l/h of brackish water. It was then drilled to a
depth of 52 m through shale and hard rock. Fresh and potable water was struck in the
interval of 40 to 52 m, with a yield of 450 to 545 l/h. In 1937 a water supply division of
the Geological Survey Department was set up to deal with the magnitude of water supply
problems in northern and southeastern parts of the country.
The main construction of boreholes in Ghana started in the 1940’s through the
interventions of both local and international donors, government, non-governmental
organizations and individuals in order to increase the water supply to rural and urban
University of Ghana http://ugspace.ug.edu.gh

13
communities across the country. The Ghana Water Company Limited by the year 2000
had constructed 25,000 boreholes all over the country. Through the help of the German
government, another 3,000 boreholes were drilled in southern Ghana between 1978 and
1983 (Issah, 2000). The World Vision International (WVI) between 1985 to June 2000
drilled 1,523 boreholes throughout the country (WVI, 2000). The governments of Ghana
through the Community Water and Sanitation Agency in collaboration with non-
governmental organizations such as Catholic Relief Agency, World Vision International
and many others drill hundreds of boreholes yearly throughout the country.
2.5 The Importance and uses of Groundwater in Ghana
Groundwater is one of the most important fresh water resources in Ghana. It has a special
economic significance, representing the country’s greatest hydrostructure with
freshwater. In many rural and urban communities water supplies for domestic, irrigation
and industrial uses are primarily dependent on existing groundwater resources. However,
groundwater potential is under serious treat, due to increasing population density,
mechanized agricultural practices, rapid urbanization, as well as domestic and industrial
usage.
Freshwater resources in Ghana are classified into groundwater and surface water. The
surface water resources are further classified into three river basins, which are the Volta
Basin system (Daka, Oti, Black, White and Lower Volta Rivers), the Southwestern Basin
System (Bia, Tano, Ankobra and Pra rivers) and the coastal basin system (Tordzie,
Densu, Ayensu, Ochi-Nakwa and Ochi-Amissah rivers). However, these surface water
University of Ghana http://ugspace.ug.edu.gh

14
resources are unable to satisfy the ever increasing water demand for socio-economic
development of the country.
The river basin system is one of the largest contributors to replenishment of groundwater
reserves in Ghana but this river systems are known to be polluted (WRC, 2003). The
basins are primarily agriculture although the growth of relatively large cities and
urbanization of rural lands throughout have led to the development of expanding urban
watershed. Rural and urban regions are frequently in close proximity to each other
leading to the potential for nutrient and other contaminant loading from surface runoff.
Pressure exerted on the water resources in the basins as a result of population increase in
addition to poor agricultural practices has raised the question of sustainability and quality
of water from the basins. Besides direct pollution of the surface water, agriculture has
placed an extremely heavy burden on the world’s water resources (State of the World,
2002).
The exploitation of groundwater for most water supply needs of many rural and urban
communities in Ghana has been on the increase in the last decade. The reliance on
groundwater supplies for rural and urban communities stern from the fact that
groundwater resourcing is not only feasible but also the most economic source of potable
water. The major consumptive water sectors of the country are Agriculture, domestic
water supply and industry. Agriculture and Industry are the largest and least users of
water, respectively.
University of Ghana http://ugspace.ug.edu.gh

15
It is estimated that over 95% of groundwater use in the country is for domestic purposes
(Gyau-Boakye et al., 2008). Data from the population census in the year 2000 reveal that
groundwater sources (mainly boreholes and hand-dug wells) constitute 33% of the main
sources of drinking water supply in Ghana. As at 1994, there were over 55,500
abstracting systems in the country. This was made up of about 10,500 boreholes, 45,000
hand-dug wells and some dugouts (Kortatsi, 1994). The number of abstraction systems
increased to 71,500 in the year 2000 and consist of 11,500 boreholes and 60,000 hand-
dug wells (Dapaah-Siakwan and Gyau-Boakye, 2000). About 50% of the total number of
borehole and hand dug wells in the country is used solely for drinking and domestic
water supply (Kortatsi, 1994). The rest are used for irrigation and watering of livestock.
Groundwater irrigators are mostly small-scale farmers who produce vegetables like
cabbage, spring onions, carrots, tomatoes, green pepper, okra and shallots to feed the
local markets.
In the southeastern part of the Volta Region, more than 60% of the shallow hand-dug
wells drilled in the recent times are used solely for irrigation. Laube et al, (2008)
estimated that about 100-200 ha of land are cultivated in the dry season with groundwater
by small-scale farmers in the Atankwidi-Anayare catchment area in the Upper East
Region. Farmers using buckets for irrigation cultivate average farm size of 600 m² (0.06
ha), while those using pumps cultivate an average farm size of 2000 m² (0.2 ha). In the
Accra plains, about 70% of the boreholes were drilled for agricultural purposes and 33%
are used for irrigation (Kankam-Yeboah, 1987). Groundwater is used for growing leafy
University of Ghana http://ugspace.ug.edu.gh

16
vegetables in urban and peri-urban areas of Accra, Kumasi, Tamale and Takoradi
(Cornish and Aidoo, 2000).
The watering of livestock with groundwater is mostly done in the Upper East, Upper
West, Northern and the Greater Accra regions of Ghana. In the Northern, Upper East and
Upper West regions, animals are not restricted but are allowed to move in search of food
and water. Watering troughs are constructed between 5 and 10 m from boreholes.
Spillways are constructed from the drainage aprons of the borehole to the watering
troughs. Spilled water from the boreholes collect in these troughs are used by livestock
mainly goat, sheep, cattle and pigs. About 70% of Ghana’s 1.34 million head of cattle
and 40% of other livestock and poultry (sheep-3.02 MH; goats-3.56 MH; pigs-3.03 MH;
and poultry-2.64 MH) are produced in these three regions and are watered exclusively
using groundwater (MOFA, 2004; Kortatsi, 1994).
Industrial use of groundwater in Ghana is very recent but the interest to do so is steadily
rising. A number of boreholes have been drilled purposely for the large scale commercial
bottled water industries in the south of the country (Gyau-Boakye et al., 2008). Previous
investigation on groundwater uses in the Densu Basin in the south of the country revealed
that all the major commercial bottled water industries in Ghana got their water supplies
from groundwater sources in the Densu basin and that industrial uses of groundwater
constituted about 85% of all groundwater uses in the basin (Darko et al., 2003).
University of Ghana http://ugspace.ug.edu.gh

17
2.6 Groundwater Quality in Ghana
Groundwater quality has special economic significance in Ghana. Groundwater in the
Greater Accra region of Ghana especially Kwabenya Community in the Ga East District
runs a high risk of pollution with agrochemicals, municipal and domestic waste because
of the high density of urbanization and intense urban agricultural activities.
Anthropogenic loading of nitrogen and phosphorous from industrial, municipal and
agricultural sources has increased nutrient load in the aquifers.
The development of industrial and agricultural activities as well as general social welfare
has led to an increase in the demand for potable water in Ghana. The government of
Ghana has been providing groundwater by means of boreholes and hand-dug wells to
communities in order to curb the ever increasing incidence of water-borne diseases in the
country (WRI, 2005). The idea of providing groundwater as a replacement for seemingly
pathogen-infested surface water sources was mooted from the fact that groundwater
being secluded from the atmosphere would be less vulnerable to pollution (WHO, 1993).
Nonetheless, Ghana water management study in 1997 revealed that groundwater is also
vulnerable to pollution due to anthropogenic and natural processes (Nii Consult, 1998).
The chemical quality of groundwater depends on the characteristics of the soil and rock
media through which it passes en route to the groundwater zone of saturation (Foster et
al. 2000). It is also dependent on the length of time the water is stored in the ground
(residence time) (MacDonald et al., 2002). As water infiltrates through the soil layer and
comes into contact with the soil air, considerable changes occur. The chemistry of the
water at the infiltration zone is modified as it flows through the aquifers. Hence,
University of Ghana http://ugspace.ug.edu.gh

18
evaluation of groundwater resources for development requires an understanding of the
hydrogeologic and hydrochemical properties of the aquifers (Acheampong and Hess
1998). Groundwater from hard rock areas is known to be vulnerable to quality problems
that may have serious health effect on human due to the carbonate-deficient leading to
poorly buffered groundwater (Smedley et al., 1995). Furthermore, some hard rocks are
known to contain sulphide minerals such as pyrite and arsenopyrite.
Suitability of water for various uses depends on type and concentration of dissolved
minerals (Mirribasi et al., 2008). Apart from natural factors influencing water quality,
human activities such as domestic, industrial and agricultural practices impact negatively
on groundwater resources. The type and extent of chemical contamination of the
groundwater is largely dependent on the geochemistry of the soil through which the water
flows prior to reaching the Aquifers (Zhang et al., 2011).
Chemical and microbiological activities are the major threats to the effect of total
reliance on groundwater as a source of drinking water. As groundwater comes into
contact with ore-bearing rocks, dissolution of elements into the water course occurs.
Groundwater development in Ghana is further hampered by improper disposal of
hazardous and solid wastes, leakage of underground storage tanks, and seepage of
agrochemicals from agricultural farms. Available data from previous studies (e.g.,
Amuzu, 1975; Andah, 1993; Kortatsi, 1994; WARM, 1998; Darko et al, 2003;
Amankona, 2010) indicate that the quality of groundwater abstracted from boreholes in
University of Ghana http://ugspace.ug.edu.gh

19
some parts of Ghana is generally of good chemical and microbiological quality.
However, groundwater quality problems in certain localities exit. The problems include
low pH (3.5-6.0) waters found mostly in the forest zones of southern Ghana, high
concentration of iron in many places throughout the country, high concentration of
manganese and fluoride mostly in the Northern part of Ghana as well as high
mineralization with TDS in the range 2000-14,584 mg/l in some coastal aquifers
(Kortatsi, 1994).
Research conducted on groundwater by Amfo-Outo et al, (2012), Ackah et al. (2011),
Saka (2013) and Nyarko (2008) in the Togo formation, of Greater Accra region revealed
water with pH values mostly less than 7.0 which is acidic in nature. In the Densu basin
pH values obtained for groundwater ranged from 6.40 to 6.70 (Tay and Kortatsi, 2008). A
major groundwater quality problem identified in Ghana is the presence of high
concentration of iron in nearly all geological formations in the country. High iron
concentrations are normally associated with acidic or anaerobic groundwater. According
to Ayibotele (1985), about 30% of all boreholes in Ghana have iron problem. High iron
concentrations in the range 1 – 64 mg/l have been observed in boreholes in all aquifers in
the country (WARM, 1998). In a study conducted in the Oyibi area of the Greater Accra
Region, Fe concentrations as high as 57 mg/l were found in groundwater in some
boreholes. The high concentrations of Fe in groundwater in Ghana have been partly
attributed to the bedrock of aquifers as they have relatively high iron proportion and
partly to corrosive pump parts as a result of the attack of low pH waters on those parts.
University of Ghana http://ugspace.ug.edu.gh

20
High fluoride concentrations in groundwater occur mostly in the Upper Regions of
Northern Ghana where the geology is dominated by granite. High fluoride concentrations
in the range of 1.5-5.0 mg/l have been found in boreholes situated in granitic formations
in the Upper East and West Regions (Pelig-Ba, 1989). In the Bolgatanga and Sekoti areas
of the Upper east Region, Smedley et al., (1995) reported fluoride concentration in excess
of the World Health Organisation guideline value of 1.5 mg/l (WHO, 2004) with up to
3.8 mg/l in some boreholes. High fluoride concentrations are attributed mostly to the
dissolution of mineral fluorite in a type of granite locally known as the Bongo granite
(HAP, 2006). Smedley et al., (1995) observed significant variation in fluoride
concentration with depth in groundwater from the Bongo granite in the Bolgatanga area.
Groundwater from shallow hand-dug wells was noted to have much lower fluoride
concentrations compared to groundwater from deep boreholes due to dilution by recent
recharge. Excess fluoride in drinking water (> 2.0 mg/l) can result in dental fluorosis and
concentrations above 5.0 mg/l can cause skeletal fluorosis.
Studies on groundwater quality in the Eastern Region of Ghana by Fianko et al, (2011)
identified that there are multiple anthropogenic influences on the aquatic ecosystem of
Ghana. It ranges from improper waste disposal to bad agricultural practice in the country.
Majority of the groundwater sampled from the Region were found to be weakly to
moderately mineralize with Na+, HCO3
− and Cl
− being the dominant ions. Hydrochemical
data indicate that intensive use of land for agricultural and industrial activities impact
greatly on the groundwater quality of the region. Elevated level of NO3–N was recorded
in about 50% of the boreholes sampled.
University of Ghana http://ugspace.ug.edu.gh

21
Physicochemical data obtained by Saka (2013) on groundwater quality in the Ga West
Municipal Area revealed high levels of TDS, electrical conductivity, salinity, sodium and
chloride ions and this was attributed to dissolution of minerals in the rocks. The problem
of high levels of arsenic (As) in groundwater in Ghana is not widespread but a localized
situation has been found in gold mining areas. Arsenic comes mainly from arsenic-
bearing minerals such as arsenopyrite and pyrite that occur in close association with gold
(Smedley et al., 1995). In a study of As in groundwater samples taken from the gold
mining areas in Obuasi in the Ashanti Region and the Bolgatanga area in the Upper East
Region, Smedley et al, (1995) reported that As concentrations in 78 samples taken from
the Obuasi area ranged from < 0.001 mg/l to 0.064mg/l. whiles those from Bolgatanga
(118 samples) had As concentrations ranging from <0.001 mg/l to 0.141 mg/l.
Nutrient and bacteriological problems in groundwater have mostly been associated with
shallow groundwater which is taped in hand-dug wells or dugout. In many hand-dug
wells throughout the country, the water were identified to be turbid and polluted in terms
of nutrient and coliform bacteria (Kortatsi, 1994). High nitrate concentrations have been
found in shallow groundwater mostly near towns and villages and could have originated
from anthropogenic sources including improper sitting of sanitation facilities and
inadequate protection of well from contamination from surface runoff and animal
droppings.
According to WHO (2006), the main sources of nitrogen in groundwater are nitrate
runoff or seepage from fertilized agricultural lands, municipal and industrial waste water,
refuse dumps, animal feedstuffs, septic tanks, private sewage disposal systems and urban
University of Ghana http://ugspace.ug.edu.gh

22
drainage. Research conducted by Nyarko (2008), Tiwari (2011), Ackah et al (2011), Saka
(2013) in Ghana revealed high levels of nitrate in ground water samples taken from hand
dug wells sited closer to septic tanks and pit latrines. Exposure to high levels of nitrates
for a long time could lead to methemoglobinaemia) or “blue-baby syndrome’’ (WHO,
2006).
The highest risk from microbes in groundwater is associated with consumption of
drinking-water that is polluted with human and animal excreta, although other sources
and routes of exposure may also be significant. Groundwater from a shallow origin is
particularly susceptible to contamination from a combination of point and diffuses
sources (Fuest et al, 1998; Nolan and Stoner, 2000). Studies on hand dug wells and
boreholes by Amin et al (2012), Obiri-Danso (2008), Nyarko (2008) and Hamida et al
(2006) revealed high levels of total coliform, faecal coliform and E. coli in the water.
2.7 The Use of Nuclear Technique in Groundwater Studies
In recent time, nuclear techniques have been employed in groundwater resource
management. Stable isotopes have contributed immensely to the investigations of
groundwater origin, recharge mechanism and rock-water interaction (Fontes, 1980). In
hydrological studies, the stable isotopes which are of most interest to hydrogeologists are
those of hydrogen and oxygen. The stable isotopes of 18
O (oxygen-18) and 2H
(deuterium) are used to provide information on hydrological processes, such as the
interaction of surface water with groundwater while 15
N is used to study the origin of
University of Ghana http://ugspace.ug.edu.gh

23
pollutants such as nutrients. Nuclear techniques have also been employed in the study of
recharge of groundwater (Adomako, 2010).
The process by which the isotope content of water changes as a result of evaporation,
condensation, freezing, melting, chemical reactions or biological processes is known as
isotope fractionation. Evaporation of water results in isotope fractionation of hydrogen
and oxygen such that 16
O and 1H preferentially enter the vapour phase, while
18O and
2H
are concentrated in the liquid phase (Freeze and Cherry, 1979). The rate of evaporation at
a given temperature is a function of the vapour pressure of H2O, which is a function of
the hydrogen bond strength between water molecules. Since an 18
O-H bond between
molecules is stronger than a 16
O-H bond, the H218
O has a lower vapour pressure than
H216
O. The greater vapour pressure or flux of H216
O leads to an enrichment of 16
O in the
vapour phase. Conversely, heavier H218
O accumulates in the liquid phase. When the
system has reached isotopic equilibrium, the greater vapour pressure of 16
O causes an
overall enrichment in the vapour, and depletion for 18
O (Clark and Fritz, 1997).
Isotopic fractionation of water molecules due to evaporation of seawater and later
precipitation in rainfall was recognized by Craig (1961). He collected about 400 water
samples from rivers, lakes and precipitation, and established a linear relationship between
deuterium and oxygen-18 for average global meteoric waters. This relationship
(δ2H=8δ
18O+10) is known as the Global Meteoric Water Line (GMWL) and provides a
useful relationship against which regional or local waters can be compared and their
isotopic composition interpreted (fig.1). Local Meteoric Water Lines (LMWL) can be
University of Ghana http://ugspace.ug.edu.gh

24
established from isotopic analysis of local precipitation events. The LMWL for Southern
Ghana [LMWL, δ2H = 7.86δ
18O + 13.61] was established by Akiti (1980).
Fig. 1 Plot of 2H against
18O showing the Global Meteoric Water Line (GMWL) and
some processes which can modify the isotopic composition of groundwater.
University of Ghana http://ugspace.ug.edu.gh

25
CHAPTER THREE
METHODOLOGY
3.1 Introduction
This chapter deals with the description of the research methodology used for the study. It
describes the study area, the population and sample, sampling techniques and sample
preparation. It also looks at the procedures followed in sample analysis, data collection
and analysis.
3.2 The Study Area
3.2.1 Location
The Kwabenya community is located in the Ga East Municipality of Ghana and is
characterized by undulating topography with hills of craggy summits, giving a striking
appearance to the landscape. The study area lies between latitude 5°
30’ N – 6°
20’ N and
longitude 0°
10’ W – 0°
35’ W (Fig. 2). The district has a growth rate of 4.5% and
bordered on the North by the Akwapim South Municipality, on the south by Greater
Accra metropolitan Assembly, and the west by the Ga West District. The Onyasia River,
which is a tributary of the Odaw River passes through Kwabenya and its environs. The
mainstay of the inhabitants of Ga East District is petty trading with isolated agricultural
activities. They are involved in batik, tie and dye making, metal processing, vehicle
maintenance, laundry services and photo processing as well as vegetable farming. Small
scale industries and rapid urbanization is the order of the day. There are stone quarries in
the upper parts of the study area. The major towns include: Abokobi, Dome, Madina,
Taifa, Ashongman, Ayi Mensa, Bansa, Haatso, Kwabenya, Oyarifa and Pantang.
University of Ghana http://ugspace.ug.edu.gh

26
Fig. 2: Map of the Study area
University of Ghana http://ugspace.ug.edu.gh

27
3.2.2 Climate
Ghana’s climate is influenced by three air masses, namely; the South-West Monsoon, the
North-East Trade Winds (Tropical Continental Air Mass) and the Equatorial Easterly
Winds. The warm but moist South-West Monsoon originates from the Atlantic Ocean
and the warm, dry and dusty Tropical Continental Air Mass (Harmattan) from the Sahara
Desert approach the tropics from opposite sides of the equator and flow towards each
other into a low pressure belt known as the Inter Tropical Convergence Zone (ITCZ). The
slow and irregular north-south oscillations of the ITCZ gives rise to the regime of the wet
and dry seasons of the sub-region. The climate ranges from the bimodal rainfall
equatorial type in the south to tropical unimodal monsoon type in the north (Dickson and
Benneh, 1980).
The study area lies between two distinct climatic zones; the dry equatorial climate of the
south east coastal plains, and the wet semi-equatorial climate further north from the coast.
Both climatic zones are characterized by two rainfall seasons with different intensities
(Dickson and Benneh, 1980). The major rainy season extends from April to July and
peaking in June when the maritime instability causes a surge of the moist south-westerly
air stream resulting in the intensification of the monsoon rain. The second rainfall period
is a minor one that occurs between September and November. The study area falls in the
coastal-savannah agro-ecological zone and experiences two wet seasons. The annual
rainfall ranges between 740-890 mm and the mean annual temperature is about 27oC with
an average relative humidity of 77% (DA, 2006).
University of Ghana http://ugspace.ug.edu.gh
28
3.2.3 Geology
The study area is underlain predominantly by Precambrian granitoids comprising mostly
Cape Coast granite and granodiorites with associated gneisses (Fig. 3). The Togo
formation in the area is highly folded and jointed and consists of sandstones, quartzite,
quartz, schist, shale, phyllites and some talc mica schist. The Cape Coast granitoids are
well foliated, often magmatic, potash rich granitoids that often come in the form of
muscovite biotite granite and granodiorites (Kesse, 1985). The Ga East District can be
classified as low lying plains. The area is generally undulating and in some areas steep
hills are encountered with altitudes over 350 m above sea level. The plains occur mostly
on top of these high altitudes and are bordered by ridges and escarpments whose
minimum average elevations are 500 m above mean sea level; and in some places the
elevations are higher as 700 m above mean sea level. The rocks themselves are
impervious but contain openings along joint, bedding and cleavage planes. Where these
openings are extensive, good suppliers of groundwater can be developed from boreholes.
Where quartzites are in contact with argillaceous rocks of the valleys, springs can usually
be found such as the springs that do occur in the Akwapim Range (Kesse, 1985).
The depth of boreholes varies from 28.0 m to 41.0 m. Borehole yields in cubic meters per
hour are highly variable and range between 0.6 m3h
-1 and 6.0 m
3h
-1 with a mean value of
2.8 m3h
-1.
University of Ghana http://ugspace.ug.edu.gh

29
Fig. 3: Geology of the study area
University of Ghana http://ugspace.ug.edu.gh

30
3.3 Sampling site selection
A field survey reconnaissance visits were undertaken to the entire study area to identify
sampling locations. The field survey, spanned over a period of four (4) months, included
visits to various public water abstraction points, the municipal assembly, individual
homes where water is been sold to the public as well as the banks of river Onyasia,
vegetable farms and small scale industries. The choice of sampling sites was due to their
strategic location, the bulk of human activities as well as population densities. Sampling
locations (fig. 4) targeted the major water abstraction points, water vending points, rural
settlements that use water from uncompleted septic tanks and surface water (stream).
Topographic and geological maps, as well as aerial photographs and satellite images of
the project area were acquired and studied. Lineaments were inferred and areas of
intense anthropogenic activity were demarcated sampling.
University of Ghana http://ugspace.ug.edu.gh

31
Fig. 4: A Map showing the sampling locations of the study area.
University of Ghana http://ugspace.ug.edu.gh

32
3.4 Treatment of sample containers
New high density polyethylene (HDPE) containers (1L) were used to take samples for
physico-chemical analysis while 80 mL polyethylene bottles with tight caps were used
for isotope samples and 500ml sterilized high density polyethylene bottles for
bacteriological samples. The bottles for bacteriological samples were washed thoroughly
with soap and rinsed with hot water to remove traces of any washing compound and
finally rinsed with distilled water. The bottles were then sterilized in the Gallenkamp
autoclave at a temperature of 170oC for three (3) hours. The high density polyethylene
(HDPE) bottles were immersed in a warm liquid soap bath for two days and then rinsed
with de-ionized water, immersed in 10 % HNO3 at room temperature for three days.
Bottles were again rinsed three times with de-ionized water, and then immersed in 50 %
HNO3 bath at 90 ºC for 24 hours. Bottles were further rinsed with de-ionized water and
dried overnight in a clean oven at 60 ºC. The bottles were then removed from the oven
and allowed to cool-down, capped tightly and double bagged in re-sealable new
polyethylene bags and stored.
3.5 Sampling
Sampling was designed to cover the dry and wet periods of 2013 and 2014. The
groundwater samples were collected on monthly intervals. Overall, 11 hand dug wells, 19
boreholes and 1 surface water were sampled. The samples were collected employing the
ultraclean free-metal sampling protocol (APHA, 1998). Groundwater samples were
collected separately from domestic and private water collection points into acid cleaned
1L high density polyethylene (HDPE) bottles. Groundwater samples were collected using
existing infrastructure. Prior to sampling, boreholes were purged by pumping water out
University of Ghana http://ugspace.ug.edu.gh

33
for at least 20 minutes. Samples were filtered in the field using Sartorius polycarbonate
filtering apparatus and 0.45µm cellulose acetate filters membrane. At each point, four
samples were collected for cations, anions, bacteriological and isotope analysis. Samples
for trace metal analyses were acidified to pH < 2 after filtration with 2 ml of 10%
analytical-grade HNO3. Groundwater samples for Stable isotopes (oxygen-18 and
deuterium) were collected into 80 mL polyethylene bottles by immersing and tightly
capped in the water to prevent evaporation. Samples for bacteriological analysis were
collected into sterilized 500 ml conditioned bottles, covered with aluminum foil and
indicator tape placed across the foil. Water samples were transported in ice cooler on ice
to the laboratory for analyses.
3.6 Field analysis
Water samples collected were analyzed by both classical and automated instrumental
standard methods for the analysis of water and wastewater (APHA, 1998). Water
temperature, electrical conductivity (Ec), total dissolved solids (TDS), turbidity and pH
were measured at each sampling site using portable (field-type) instruments (HACH
conductivity meter and Metrolin model 691-pH meter). Alkalinity was determined in the
field using HACH Digital Multi-sampler titrator Model 1690 and estimated as mgL-1
of
CaCO3.
University of Ghana http://ugspace.ug.edu.gh

34
3.7 Laboratory analysis
3.7.1 Physico-chemical analysis
Physico-chemical parameters in groundwater samples were analysed using standard
protocol as stated in Standard Methods for the Examination of Water and Waste Water
(APHA, 1998)
Total hardness of water sample (100 ml) was estimated titrimetrically using 0.01 M
EDTA (Ethylene diamine tetra acetic acid) and ammonia buffer and calculated as mgL-1
.
The concentrations of major ions; sulphate (SO42-
), nitrate (NO3
- - N), chloride (Cl
-), and
phosphate (PO43-
-P) were determined using ion chromatographic techniques (Dionex
ICS-90 ion chromatograph) (Welch et al., 1996) and spectrophotometric techniques in the
laboratory. Sodium (Na) and potassium (K) were measured by flame photometer
(Sherwood model 420) where groundwater samples (5ml) were mixed thoroughly with
2ml of Li standard (100mgL-1
). Before the samples were analysed for major ions, the
Dionex ICS-90 was calibrated using a standard anion solution (seven anion standard II).
The samples were filtered with a 0.45 μm size pore filter paper. Samples with
conductivity above 700 μS/cm and salinity above 0.1mgL-1
were diluted. Aliquot of
groundwater samples were interspersed with analytical standards of interest, placed on
auto sampler with standards at the start, between every 15 samples and the last on the ion
chromatograph sample run. The major ion components were identified by comparing
their retention times with those of the standard mixture. Quantification was based on
comparison with calibration curves drawn with the standards.
University of Ghana http://ugspace.ug.edu.gh

35
3.7.2 Analysis of Trace Metals
Trace metals were determined using a Varian AA240 Fast Sequential Atomic Absorption
Spectrometer. Samples were acid microwave digested using HCl, HNO3 and H2O2.
The groundwater samples were microwave digested following Milestone Application
protocol. For each groundwater sample, 5 ml was measured into a labeled acid cleaned
polytetrafluoroethylene (PTEF) Teflon vessel (bomb) of ETHOS 900 Labstation
microwave digestor. The volumes of 6 ml of 65% v/v HNO3, 3 ml of HCl and 0.25 ml
H2O2 were added respectively to each vessel containing the samples in a clean fume
chamber. The vessels were swirled gently to mix, loaded vertically onto the microwave
carousel and the vessel capped tightly using an appropriate screw tools. The complete
assembly was fitted into the Milestone ETHOS 900 Microwave Labstation and irradiated
for 21min in a Milestone microwave Lab station (Ethos 900) using the following
operation parameters: 250 W for 5 min, 0 W for 1 min, 250 W for 10 min, 450 W for 5
min, and 5 min allowed for venting. After digestion the Teflon bombs mounted on the
microwave carousel were cooled in a water bath to reduce internal pressure and to allow
volatilized material to re-solubilize. The digestates were analysed for trace metals using
both classical and automated instrumentation method as appropriated in standard methods
(APHA, 1998). The VARIAN AA-240 Fast Sequential Atomic Absorption
Spectrophotometer (AAS) was employed in the trace metal analysis using acetylene gas
as fuel and compressed air as oxidant. Each sample was analysed in triplicate. The
sample concentrations were verified using a series of standards of known concentrations
for each element. All reagents used were of analytical grade and equipment pre-calibrated
appropriately prior to measurement.
University of Ghana http://ugspace.ug.edu.gh

36
3.8 Bacteriological Analysis
The membrane filtration technique was employed in the determination of three indicator
bacteria (Total Coliform, Faecal Coliform, and Escherichia Coli (E. Coli) as enshrined in
the standard method of analysis of water and wastewater (APHA, 1998), at the
laboratories of Water Research institute of CSIR, Accra.
In the membrane-filtration (MF) method, a minimum of 10 ml sample (or dilution of the
sample) is introduced aseptically into a sterile or properly disinfected filtration assembly
containing a sterile membrane filter (nominal pore size 0.2 or 0.45 μm). A vacuum is
applied and the sample is drawn through the membrane filter. All indicator organisms are
retained on or within the filter, which is then transferred to a suitable selective culture
medium in a Petri dish. Following a period of resuscitation, during which the bacteria
become acclimatized to the new conditions, the Petri dish is transferred to an incubator at
the appropriate selective temperature where it is incubated for a suitable time to allow the
replication of the indicator organisms. Visually identifiable colonies are formed and
counted, and the results are expressed in numbers of “colony forming units” (CFU) per
100 ml of original sample. This technique is inappropriate for waters with high turbidity
that would cause the filter to become blocked before an adequate volume of water had
passed through. When it is necessary to process low sample volumes (less than 10 ml), an
adequate volume of sterile diluent must be used to disperse the sample before filtration
and ensure that it passes evenly across the entire surface of the membrane filter.
University of Ghana http://ugspace.ug.edu.gh

37
3.8.1 Procedure
The porous plate of the membrane filtration unit and the membrane filter forceps were
sterilized by being applied with 98% alcohol which was burnt off in a Bunsen flame. The
sterile forceps were then used to transfer the sterile membrane filter onto the porous plate
of the membrane filtration unit with the grid side up and a sterile meshed funnel placed
over the receptacle and locked in place. Groundwater sample (100 ml) was added to the
membrane filtration unit using the funnel measure. The flame from the Bunsen burner
was kept on throughout the whole analyses and the forceps was flamed intermittently to
keep it sterile. The sample was filtered through the membrane filter under partial pressure
created by a syringe fitted to the filtration unit. The filtrate was discarded and the funnel
unlocked and removed. The sterile forceps were then used to transfer the membrane filter
onto sterile labeled Petri plates of HiCromeTM
Coliform Agar which is a selective
chromogenic medium for the simultaneous detection of total coliform and Escherichia
coli. It contains sodium lauryl sulphate which inhibits gram- positive bacteria and two
substrates; salmon-GAL and X-glucoronide. The salmon-GAL stains coliform colonies
red whereas the X-glucoronide stains E. coli dark blue. The membrane filter was placed
on the medium by rolling action to prevent air bubbles from forming at the membrane-
medium interface. The Petri dishes were incubated upside down at the appropriate
temperatures, (37oC for total coliforms and 44
oC for faecal coliforms) for 24 hours. After
incubation, typical colonies were identified and counted and the results expressed as
colony forming units per 100 ml of sample analysed (c.f.u/100 ml).
University of Ghana http://ugspace.ug.edu.gh
38
3.8.2 Analysis of Total Heterotrophic Bacteria using Pour Plate Method
This method was based on the serial dilution of water sample, which were then pipetted
into each sterile Petri-dish. About 20 ml of molten nutrient and MacConkey agar was
cooled to 450C and poured into each Petri-dish containing 1ml of the groundwater
samples. Plates were allowed to cool, after which they were incubated in inverted
position at 370C. After 24 hrs of incubation, the plates were counted by colony counter
and expressed as colony forming units per 1ml of sample analysed (c.f.u/1 ml) to obtain
the total heterotrophic bacteria.
3.9 Analysis of Stable Isotopes
Samples were analysed for oxygen-18 and deuterium in the Isotope Hydrology
Laboratory of the Nuclear Chemistry and Environmental Research Centre, Ghana Atomic
Energy Commission using the IAEA Laser Spectroscopic Analysis of Liquid Water
Samples for Stable Hydrogen and Oxygen Isotopes method (IAEA, 2009). The samples
were analysed using the off-axis integrated cavity output spectroscopy (OA-ICOS) Los
Gatos Research DT-100 Liquid-Water Isotope Analyser (Model 908-008-2000). The
samples were shaken to equilibrate and then pipetted into vials. The tray was placed on
the auto sampler and the run configured on the laser instrument. When the run was
completed the run results were transferred, archived and post processed. All stable
isotope data are reported in the usual δ notation, where δ = (R/RSTD - 1)1000, R
represents either the 18
O/16
O or D/H ratio of the sample, and RSTD is the isotope ratio of
the SMOW, a reference standard.
University of Ghana http://ugspace.ug.edu.gh

39
3.10 Water Quality Index
Water Quality Index (WQI) is a very reliable, useful and efficient method for assessing
and communicating the information on the overall quality of water (Asadi et al., 2007;
Pradhan et al., 2001). The determination of WQI helps in deciding the suitability of
groundwater sources for its intended purpose. From the early 1960s, different WQI
methods have been developed (Harkins, 1974; Horton, 1965; etc.).
This work employed the use of WQI proposed by Tiwari and Mishra (1985) in assessing
the suitability of the water in the study area for drinking.
WQI=Antilog [∑W n=1log10qn] (1)
Where;
Wn = Weighting factor, calculated from the following equation:
Wn = K(Si ) -1
(2)
K= the proportionality constant derived from
K = [∑ (Si)-1
]-1
(3)
Si = the standard values of the water quality parameter (WHO, 2004; ICMR, 1975). The
calculated Weighting factors of each parameter are given in Table 1.
University of Ghana http://ugspace.ug.edu.gh

40
Table 1: Water quality parameters, their standard values, their ideal values and the
Assigned weighting factor
Parameter
Standard value,
Si Ideal value, Cid 1/Si
Assigned
Weighting
Factor, Wi
pH 8.5 7 0.117647 0.001106
TDS 1000 0 0.001 9.4E-06
Conductivity 1500 0 0.000667 6.27E-06
Alkalinity 200 0 0.005 0.000047
T. hardness 500 0 0.002 1.88E-05
Bicarbonate 380 0 0.002632 2.47E-05
Chloride 250 0 0.004 3.76E-05
Sulphate 500 0 0.002 1.88E-05
Nitrate 50 0 0.02 0.000188
Sodium 200 0 0.005 0.000047
Potassium 30 0 0.033333 0.000313
Calcium 200 0 0.005 0.000047
Magnesium 200 0 0.005 0.000047
Iron 0.3 0 3.333333 0.031333
Copper 2 0 0.5 0.0047
Manganese 0.5 0 2 0.0188
Zinc 3 0 0.333333 0.003133
Lead 0.01 0 100 0.94
106.3699 0.999877
1
University of Ghana http://ugspace.ug.edu.gh

41
Quality rating (qn) was calculated using the formula
Qn = x 100
where, qn = Quality rating of ith parameter for a total of n water quality parameters;
Vactual = The value of the water quality parameter obtained from laboratory analysis;
Videal = The value of that water quality parameter which can be obtained from the
standard tables
Videal for pH = 7, and for other parameters it is equivalent to zero;
Vstandard = the standard of the water quality parameter (WHO 2004; ICMR 1975).
The calculated WQI values were then used to rate the groundwater quality as excellent,
good, poor, very poor and unfit for human consumption (Table 2).
Table 2: Water Quality Index Scale
Quality Description
O – 25 Excellent
26 – 50 Good
51 – 75 Poor
76 – 100 Very Poor
>100 Unfit for drinking (UFD)
University of Ghana http://ugspace.ug.edu.gh
42
3.11 Quality Control /Quality Assurance
Quality assurance measures applied in the laboratory included rigorous contamination
control procedures (strict washing and cleaning procedures), monitoring of blank levels
3.11 Quality Control /Quality Assurance
Quality assurance measures applied in the laboratory included rigorous contamination
control procedures (strict washing and cleaning procedures), monitoring of blank levels
of solvents, equipment and other materials, analysis of procedural blanks, monitoring of
instrument response, linearity and quality of analysis. During analysis, blanks and
duplicates were included and re-calibration standards ran frequently to check the integrity
of the calibration. Analysis of all blank samples showed no inherent bias in the method of
analysis for analytes of interest. All differences measured in concentrations between
replicate pairs were within the precision of the method for all analytes of interest. The
Standard Mean Ocean Water (SMOW) was used as the external standard for both
deuterium and oxygen. Acceptable values were within 0.01–0.05‰ vs. VSMOW for 18
O
and 0.1–0.5‰ vs. VSMOW for 2H.
3.12 Statistical Analysis
Analysis of variance (ANOVA) was used to examine the apparent differences in
observed data between the different sampling location in hand dug wells and boreholes.
Significant difference was tested at 95% confidence le
University of Ghana http://ugspace.ug.edu.gh
43
CHAPTER FOUR
RESULTS AND DISCUSSION
4.1 Introduction
In this chapter, the physico-chemical constituents of groundwater samples from the
Kwabenya locality are presented in tables and figures. The results are compared with
World Health Organization (WHO) guidelines for drinking water (WHO, 2011), and the
international average for fresh water (Stumm et al, 1981), since communities in the
Kwabenya locality use the untreated water for domestic purposes. To this end, the
concentrations that are below and above the guideline values are identified and discussed.
4.2 Hydrochemistry
Groundwater derives its mineral character essentially from reactions between rainwater
and the host rock over a time scale of days, months, or years during percolation. The
extent of this water – rock interaction is controlled by the residence times of the water
and the mineralogy of the aquifer matrix. Modification of water chemistry in
groundwater can occur through physical, chemical, and biological processes.
Anthropogenic activities through excessive application of agrochemicals, release of
septic tank effluent, industrial and domestic waste also have considerable effect on
groundwater quality (Celle-Jeanton et al., 2007).
pH of groundwater sampled fluctuated between 5.00 – 8.10 for hand dug wells and 3.10
– 10.50 for the boreholes. Water samples were slightly acidic to basic with few localized
University of Ghana http://ugspace.ug.edu.gh

44
areas showing strong acidic groundwater. About 29% of groundwater samples were
slightly acidic. The lowest pH value (3.1) was recorded in water samples from BH 10
(Figure 5). The observed variation in pH of groundwater samples may be attributed to the
differences in the geological materials and chemistry of the groundwater. Similar results
were obtained by Amfo-Outo et al, (2012), Ackah et al. (2011), Saka (2010) and Nyarko
(2008) in the Togo formation, which is acidic in nature.
pH generally plays an important role in metal bioavailability, toxicity and leaching
capability. Therefore, such pH values in the groundwater could leach metal ions such as
iron, manganese, copper, lead, and zinc from the aquifer into the water (Stumm and
Morgan, 1981).
University of Ghana http://ugspace.ug.edu.gh

45
Hand Dug Wells
Boreholes
Fig. 5: pH of groundwater samples from the study area
University of Ghana http://ugspace.ug.edu.gh

46
The electrical conductivity (Ec) of the sampled groundwater ranged between 274 μS cm−1
and 2010 μS cm−1
. Water from borehole had conductivity ranging between 239.5 μS cm−1
and 1777 μS cm−1
in the wet season while in the dry season the electrical conductivity
was 274 – 2010 μS cm−1
. The conductivity of the hand dug wells were higher than the
boreholes especially in the wet season (Figure 6). The hand dug wells had values from
517.1 – 1841 μS cm−1
and 325 - 1522 μS cm−1
in the wet and dry seasons respectively.
The EC values for all the sampling points were within the WHO (2011) permissible limit
of 1500 μS cm−1
except KHD4, KHD9 and KBH10. The large values at KHD4 and
KHD9 could be the result of the open nature of the well allowing increased atmospheric
particulate matter deposition unlike the rest of the sites where boreholes were enclosed.
The conductivity range indicated large variability in salinity of the groundwater. A
sizable proportion of boreholes were low in salinity. Research work conducted by Ackah,
(2011) showed low conductivity values with the exception of one of the boreholes which
recorded a higher value of 2830 μS cm−1
.
University of Ghana http://ugspace.ug.edu.gh

47
Fig. 6: Map showing conductivity in the groundwater samples of the study area
University of Ghana http://ugspace.ug.edu.gh

48
Majority of the samples (85 %) were fresh water since their total dissolved solids (TDS)
did not exceed 1000 mgL-1
recommended for domestic water (Kattan, 1995). The total
dissolved solids (TDS) concentrations of the HD varied from 256mg/L to 627mg/L and
112mg/L to 761mg/L for the wet and dry seasons, respectively, while that of the borehole
BH varied from 120.50 mg/L to 888.80 mg/L and 137.60 mg/L to 1003 mg/L for the wet
and dry seasons respectively. All the samples recorded values within the recommended
guideline value of 1000 mg/L (WHO, 2011) except water samples from borehole BH10
(1003 mg/L). This could be resulting from urbanization. Effluents from domestic,
agricultural and small-scale industries might have contributed to the elevated TDS. The
low overall TDS concentrations suggested that the waters had short contact times with
host rock materials, rock dissolution had been relatively small, and the borehole waters
have undergone the greatest amounts of reaction.
Relatively low concentrations of inorganic constituents were found in wells and in the
borehole water. Generally, the major anions (chloride [Cl-], nitrate [NO3
-], and sulphate
[SO42-
]) in the groundwater samples were low. The low values suggested minimal
anthropogenic influence because of the minimal industrial activity in the Ga East District.
The highest mean level of SO42
(87 mg/L) was recorded at sample point KBH 11 while
the highest mean chloride level (161.95 mg/L) was registered in KHD 8 (Figure 7). Both
Cl- and SO4
2- showed strong positive correlation with TDS which indicated that these
conservative constituents of groundwater were steadily enriched up to high overall
mineralization. These facts once again revealed that very little solute was lost through
drainage and that lateral movement of groundwater was minimal (Verhagen et al., 1995).
University of Ghana http://ugspace.ug.edu.gh

49
Research works conducted by Amfo-Outo et al, (2012), Ackah et al. ,(2011), Saka (2010)
and Nyarko (2008) on groundwater recorded low inorganic ions values, except few
groundwater samples in which high chloride values were recorded.
Fig. 7: Levels of SO42-
and Cl- in groundwater samples
SO42-
and HCO3- were more enriched in the hand dug wells than the boreholes and this
occurs at locations where agricultural activities especially vegetable farming was
intensive with the use of more agrochemicals (KHD4 and KBH10). Bicarbonate and
sulphate concentrations were evenly distributed over the entire study area. The highest
level of bicarbonate (170.69 mgL-1
) was recorded at site KDH 5 while appreciable levels
were registered at sites KHD 4, KBH 9 and KBH 12. Bicarbonates levels measured could
be the result of granite formations and agriculture activities. The SO42-
in the water
samples might not be due to dissolution of evaporites since none of the levels registered
University of Ghana http://ugspace.ug.edu.gh

50
in the samples was near the high concentration of 275 mgL-1
(Verhagen et al, 1995).
Thus, the influence of agricultural and other anthropogenic activities could be the
probable source of SO42-
in the groundwater. The highest mean concentrations of Cl-
(347.89 mg/L was found at site KBH 10 with significant levels recorded at sites KHD 4,
KHD 5, KHD 2, KHD 3, KHD 8 and KHD 9 (Figure 8). These wells were found in
agricultural and high density residential areas.
University of Ghana http://ugspace.ug.edu.gh
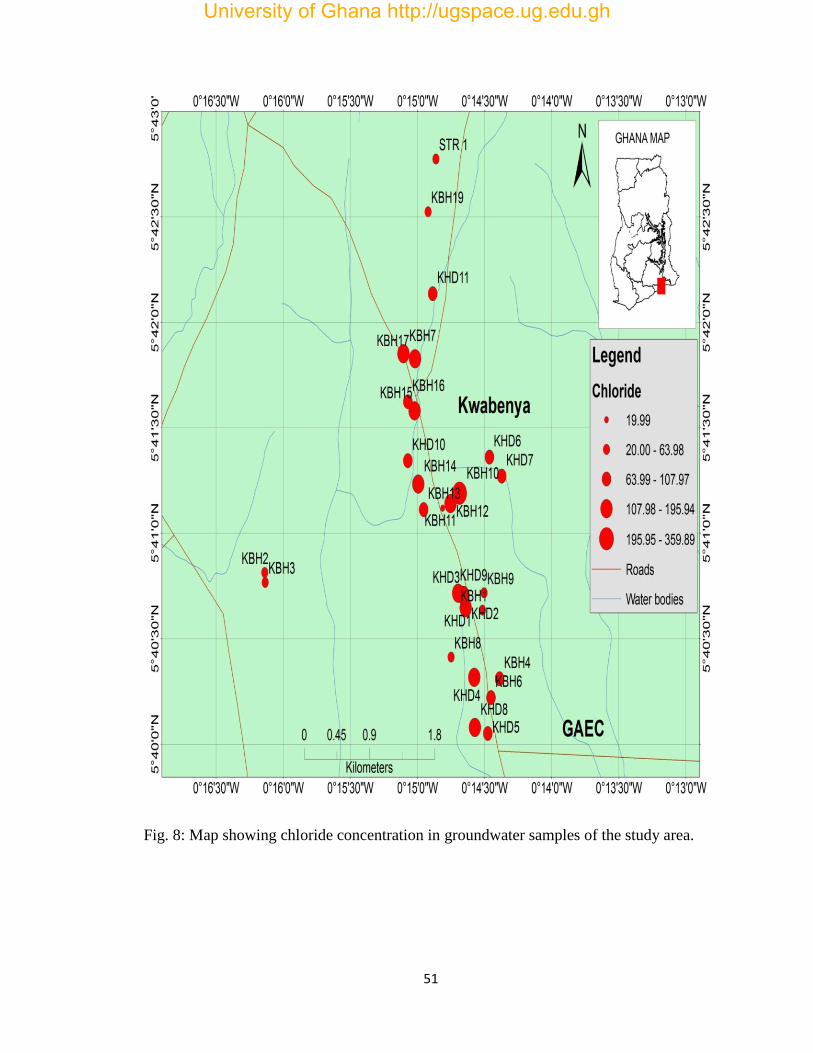
51
Fig. 8: Map showing chloride concentration in groundwater samples of the study area.
University of Ghana http://ugspace.ug.edu.gh
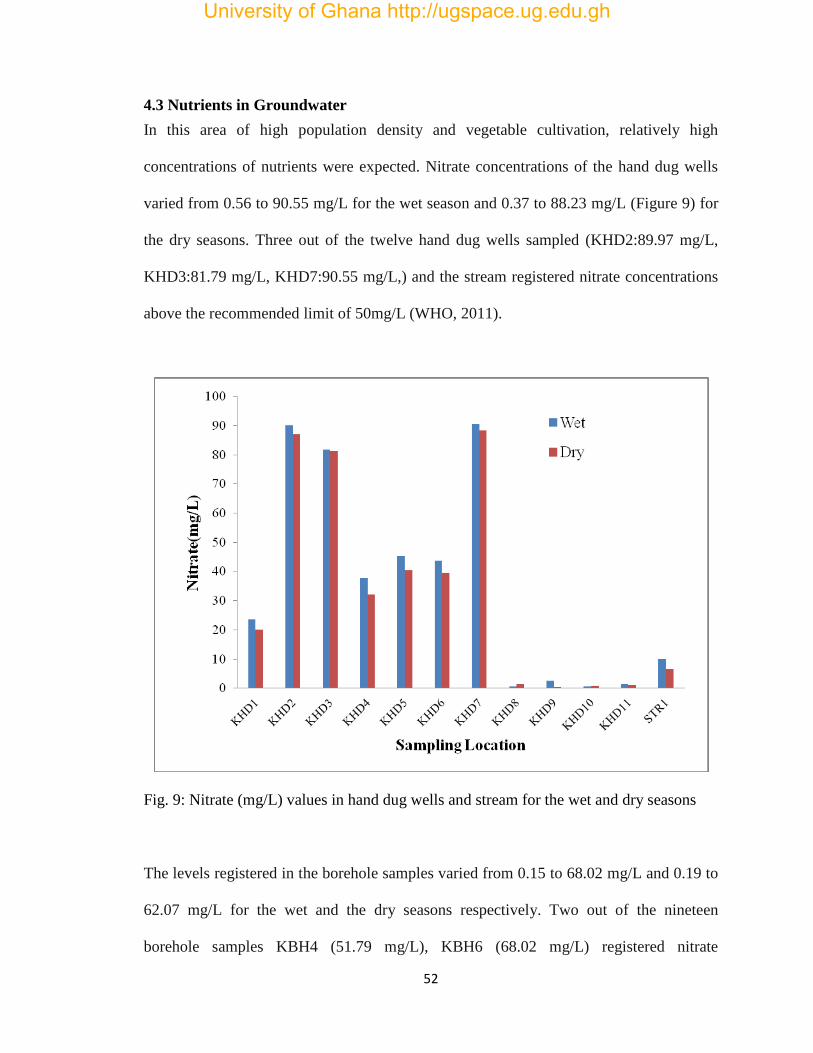
52
4.3 Nutrients in Groundwater
In this area of high population density and vegetable cultivation, relatively high
concentrations of nutrients were expected. Nitrate concentrations of the hand dug wells
varied from 0.56 to 90.55 mg/L for the wet season and 0.37 to 88.23 mg/L (Figure 9) for
the dry seasons. Three out of the twelve hand dug wells sampled (KHD2:89.97 mg/L,
KHD3:81.79 mg/L, KHD7:90.55 mg/L,) and the stream registered nitrate concentrations
above the recommended limit of 50mg/L (WHO, 2011).
Fig. 9: Nitrate (mg/L) values in hand dug wells and stream for the wet and dry seasons
The levels registered in the borehole samples varied from 0.15 to 68.02 mg/L and 0.19 to
62.07 mg/L for the wet and the dry seasons respectively. Two out of the nineteen
borehole samples KBH4 (51.79 mg/L), KBH6 (68.02 mg/L) registered nitrate
University of Ghana http://ugspace.ug.edu.gh

53
concentrations above the WHO acceptable limit of 50 mg/L during both seasons (Figure
10).
Fig. 10: Nitrate levels in borehole samples for the wet and dry seasons.
Hand dug well samples analysed had higher nitrate levels than boreholes samples. This is
because the hand dug wells are more exposed to the atmosphere than borehole (Figure
11). The results of the analysis indicated that nitrogen from agricultural and septic
systems could cause nitrate concentration to increase in the sampled groundwater. The
study area is noted for the large scale cultivation of vegetables and other non-traditional
export crops where inorganic fertilizer is used extensively. The elevated nutrient levels
could be attributed to the use of chemical fertilizers by the farming communities. Poor
drainage and the spreading of animal manure, sewage sludge, and effluent could also
contribute to nitrate leaching common in the study area.
University of Ghana http://ugspace.ug.edu.gh

54
Fig. 11: A Map showing nitrate concentration in groundwater samples of the study area
University of Ghana http://ugspace.ug.edu.gh

55
Similar studies conducted by Nyarko (2008), Ackah et al (2011), and Saka (2011) in
other parts of the municipality revealed the presence of high nitrate levels in some of the
ground water samples which were closer to septic tanks and pit latrines. Exposure to high
levels of nitrates for a long time could lead to methemoglobinaemia) or “blue-baby
syndrome’’ (WHO, 2006). This occurs when nitrate is reduced to nitrite in the stomach of
infants. The nitrite is able to oxidize haemoglobin (Hb) to methemoglobin (metHb),
which is unable to transport oxygen around the body. This reduces oxygen-transport
which becomes clinically manifested when metHb concentrations reach 10% or more of
normal Hb concentrations. It causes cyanosis and asphyxia at higher concentrations.
Generally, the study recorded low levels of Na+, Ca
2+ and K
+ in the groundwater samples.
This may be attributed to the minimal industrial activities in the Ga East District. The
concentration of sodium in hand dug wells ranged from 35.80 mg/L to 225.50 mg/L with
a mean value of 80.68 mg/L in the wet season while in the dry season the levels recorded
were between 32.50 and 499 mg/L with a mean value of 178.59 mg/L. The highest value
was recorded in KHD5. All the values recorded in the wet season were below the WHO,
(2011) acceptable limit of 200 mg/L except KHD5 (225.50 mg/L) but in the dry season,
eleven out of thirty values exceeded the WHO recommended limit. In the borehole water
samples the levels ranged from 32.50 mg/L to 385 mg/L for the entire sampling period.
The highest level of sodium in the borehole samples was recorded in KBH6 during the
wet season while in the dry season KBH10 registered the highest sodium concentration.
Groundwater samples from KBH6, KBH10 and KBH14 had sodium values above the
WHO recommended value (Figure 12).
University of Ghana http://ugspace.ug.edu.gh

56
Fig. 12: A Map showing sodium concentration in groundwater samples of the study area
University of Ghana http://ugspace.ug.edu.gh

57
The concentrations of potassium in the groundwater samples varied from 2.70 to 38 mg/L
Apart from samples from KBH3, KBH10 and KBH14, all the sampling points had values
within the recommended value of 30 mg/L (WHO, 2011).
4.4 Hydrochemical Facies of Groundwater
The concentrations of major ions of groundwater samples were plotted in the Piper
trilinear diagram (Piper, 1953) to determine the water type. The classification for cation
and anion facies, in terms of major ion percentages and water types, is according to the
domain in which they occur on the diagram segments (Back, 1966). The chemical
composition of water samples from the study area is shown on the Piper diagram
(Figure 13). In the cation plot field the samples plotted mainly towards the Na+K corner
indicating sodium type or potassium type waters. In the anion plot field the samples
mostly plotted toward the Cl+NO3- corner indicating chloride type or nitrate type waters.
Principally, the water samples plotted in the Na-Cl dominant of the diamond field
indicates that the groundwater experience mixing with salt water which could be due to
evaporation of rainwater before recharge.
University of Ghana http://ugspace.ug.edu.gh

58
Fig. 13: Classification of hydrochemical facies using the Piper Plot
4.5 Bacteriological Indicators for Groundwater samples
Representative groundwater samples for the wet season were analyzed for bacteria. The
bacteriological indicators of the selected samples are as presented in table 3.
University of Ghana http://ugspace.ug.edu.gh

59
Table 3: Statistical summary of bacteriological indicator results of hand dug wells
and boreholes for the wet season
Bacteriological
Indicator
Hand Dug Wells Boreholes WHO Limit
Total coliform
(c.p.u/100ml)
0 – 837 0 - 372 0
Faecal coliform
(c.p.u/100ml)
0 - 102 0 - 3 0
Escherichia coli
(c.p.u/100ml)
0 - 61 0 - 1 0
Total Heterotrophic
Bacteria (c.p.u/1ml)
22 - 4212 1 - 3744 <500
According to WHO (2011) and Ghana Standard Authority (2011), there should be no
detection for total coliform, faecal coliform, and Escherichia coli counts and the detection
limit for heterotrophic bacteria should not exceed 500.
The highest value for total coliform was recorded in KHD6 and the lowest in KHD4.
Seven out of the eight hand dug wells investigated were contaminated with total coliform,
representing 87% (Figure 14).
University of Ghana http://ugspace.ug.edu.gh

60
Fig. 14: Total coliform values in hand dug wells for the wet season
For the boreholes, the highest value of total coliform was recorded in KBH2 and the
lowest in KBH1, KBH5 and KBH10. Nine out of twelve boreholes samples investigated
were contaminated with total coliform, representing 75% (Fig. 15).
University of Ghana http://ugspace.ug.edu.gh

61
Fig. 15: Total coliform values in boreholes for the wet season.
Faecal coliform contamination was detected in four hand-dug wells, a stream which
recorded the highest and two borehole samples (KBH6 and KBH12). The presence of E.
coli was detected in four out of seven hand-dug wells and a stream, with the stream
recording the highest. Meanwhile, the presence of E. coli was measured in one out of the
twelve borehole samples taken. Total heterotrophic bacterial contamination which
exceeded the 500/1ml set by WHO (2011) and Ghana Standards Board (2011) were
detected in four out of eight HD samples (including a stream). The highest value was
recorded in KHD5 and the lowest value in KHD3 (Figure 16).
University of Ghana http://ugspace.ug.edu.gh
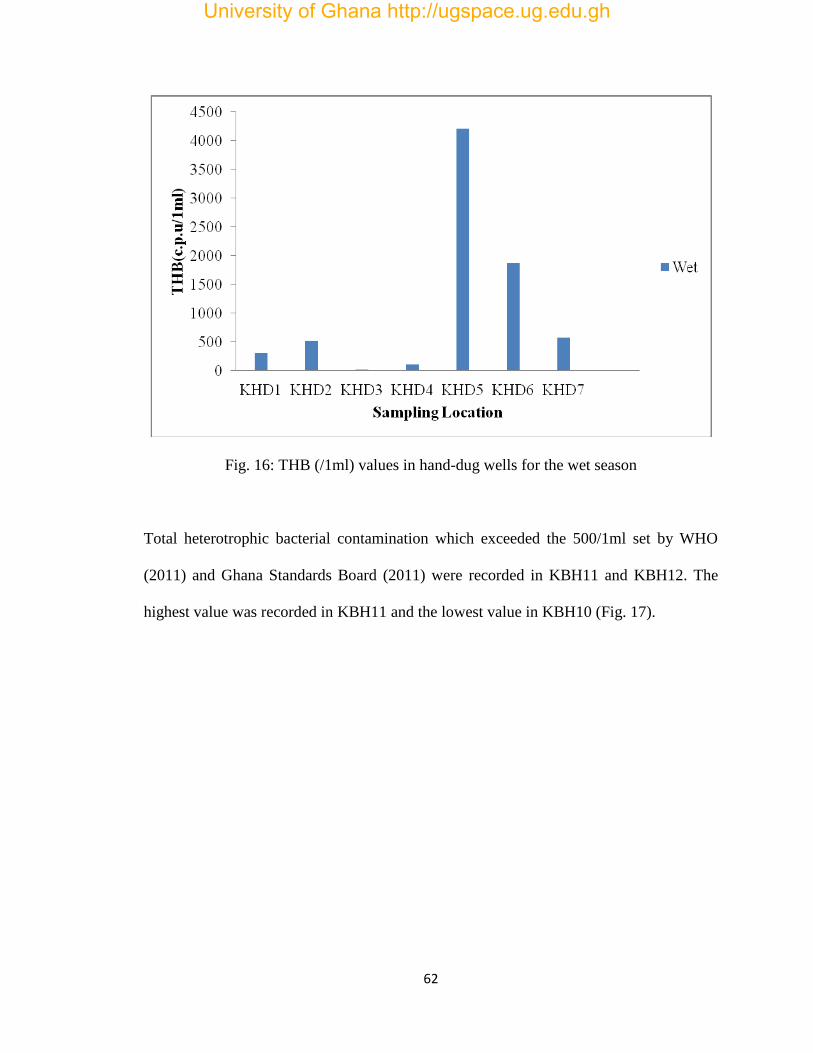
62
Fig. 16: THB (/1ml) values in hand-dug wells for the wet season
Total heterotrophic bacterial contamination which exceeded the 500/1ml set by WHO
(2011) and Ghana Standards Board (2011) were recorded in KBH11 and KBH12. The
highest value was recorded in KBH11 and the lowest value in KBH10 (Fig. 17).
University of Ghana http://ugspace.ug.edu.gh

63
Fig. 17: THB (/1ml) values in boreholes for the wet season.
Sanitation survey made at the sampling sites showed that the stream was highly polluted.
This is because it is not protected and therefore exposed to all kinds of pollutants,
especially during the rainy season where contaminants carried by runoff easily enter the
stream. Hand- dug well KHD1, KHD2, KHD5 and KHD7 which were polluted, were
found to be between 5 m and 10 m away from septic tanks (soak-away) while KHD7 was
about 10 m away from a KVIP. Faecal matter from the septic tanks and the KVIP may
have leaked into the water, since these wells were all drilled in waterlogged areas
resulting in the high level of bacteria measured. Most of the Hand-dug wells were not
properly covered and it was found out that water from these wells were drawn using
various unhygienic receptacles (plastic or aluminium buckets). These receptacles were
also used for other purposes including bathing and laundering. Similarly, there were no
windlass on these wells and all users had to use one rope for drawing water which was
University of Ghana http://ugspace.ug.edu.gh
64
often left in water that had been spilt around the well head. These practices make the
hand dug wells vulnerable to bacterial contamination and may have contributed to the
high level of bacteria recorded. All the eleven (11) hand-dug wells studied were found to
be shallow wells with depths approximately 3.6 m – 12 m, indicating that they are drilled
in the unsaturated and weathered zones. Again some of the walls of the wells have not
been raised well above the surrounding ground level allowing runoff water to enter
during heavy downpour. Boreholes KBH2, KBH3, KBH4, KBH6, KBH8 and KBH12
were also drilled in waterlogged areas and 10 – 15 m away from septic tanks and a dump
site whose effluent is likely to seep into the groundwater to contaminate them. Though
KBH10 was closer to a contaminated source, it was found to be less contaminated with
bacteria. Water from KBH10 was found to be highly acidic and this may have
contributed to the low bacteria load of KBH10 since acidic conditions may not be
conducive for bacterial to survive. The study revealed that the hand-dug wells were more
polluted than the boreholes (Fig 18). The construction and depth of the wells could
further explain the contamination levels of the hand dug wells. Also most of the
boreholes have been constructed by individual with good financial background; therefore,
certain sanitation measures were put in place unlike the hand dug wells.
University of Ghana http://ugspace.ug.edu.gh

65
Fig. 18: A Map showing total coliform in groundwater samples of the study area.
University of Ghana http://ugspace.ug.edu.gh

66
High microbial counts for potable water have been found in several earlier studies in the
tropics. Studies conducted on hand-dug wells and boreholes by Amin et al (2012), Obiri-
Danso (2008), Nyarko (2008) and Hamida et al (2006) recorded high level of total
coliform, faecal coliform and E. coli. Musa et al. (1999), working on peri-urban and rural
well water in Sudan, have also shown that faecal coliform counts in peri-urban water
supplies were less than in rural water sources. This might be because these wells were
better protected from surface contamination.
Cairncross and Cliff (1987) on their research conducted on groundwater have shown that
soakaway pits and pit latrines can extend their influence on groundwater quality up to 10
m or more as groundwater flow is either lateral or vertical. Pye and Patrick (1983)
working on ‘The Influence of land disposal of sewage sludge, illegal dumping of septic
tank pump age, improper toxic waste disposal and runoff from agricultural operations on
groundwater’ have also shown that land disposal of sewage sludge, illegal dumping of
septic tank pumpage, improper toxic waste disposal and runoff from agricultural
operations all contribute to groundwater contamination with chemicals and
microorganisms. Some bacteria thrive in oxygen rich environments (aerobic) and others
in oxygen deficient (anaerobic) conditions. Bacteria are very resilient, remaining dormant
when conditions are not ideal. Dried, but living bacteria can even be carried in the air.
Bacteria can excrete toxins or carry them inside their cell wall until they die and
disintegrate. Some bacteria may invade a specific organ of the body, for example the
brain, throat or bone. Many water borne diseases such as cholera, typhoid and diarrhea
are all due to bacterial contaminations.
University of Ghana http://ugspace.ug.edu.gh

67
4.6 Trace Metals
The levels of trace elements recorded in the study area were very low because of low
level of industrial activities in the area. Analysed samples revealed the presence of Fe,
Cu, Mn, Pb, Cd and Zn in the groundwater samples. The concentration of ferrous iron in
the hand-dug wells varied from 0.016 to 2.38 mg/L and 0.027 to 0.805 mg/L for the wet
and dry seasons, respectively, with the highest level recorded in KHD8. During the wet
season, iron levels above the recommended limit (0.3 mg/L) (WHO 2011) were
registered in six out of the twelve hand-dug wells and a stream but during the dry season
iron levels above the WHO limit were measured in four hand dug wells (Figure 19).
Fig. 19: Levels of iron in hand dug wells and a stream for the wet and the dry seasons
The concentration of iron in the boreholes varied from 0.06 to 1.00 mg/L and 0.072 to
0.836 mg/L for the wet and dry seasons, respectively. The highest iron concentration was
University of Ghana http://ugspace.ug.edu.gh

68
recorded in KBH6 and the lowest in KBH14 during the wet season. Meanwhile, during
the dry season the highest was recorded in KBH7 and the lowest in KBH16. The iron
levels above the WHO (2011) acceptable limit (0.3 mg/L) were registered in seven out of
nineteen boreholes during the wet season but during the dry season iron levels above the
WHO limit (2011) were recorded in three out of nineteen boreholes sampled (Figure 20).
Fig. 20: Bar chart of Levels of iron in boreholes for the wet and the dry seasons
The total iron concentration of the groundwater samples during the wet season was
higher than the dry season and this could be due to dissolution of underlying rock through
infiltration and also as a result of low pH of aquifers as they have relatively high iron
proportion (approximately 6%). According to Ayibotele (1985), about 30% of all
boreholes in Ghana have iron problem. A research conducted by Obiri-Danso (2009) on
boreholes and wells in the peri-urban communities in Kumasi revealed high iron
concentration of some of the boreholes. Saka (2010) measured high levels of iron in Ga
West district of Greater Accra region,
University of Ghana http://ugspace.ug.edu.gh

69
Manganese (Mn) concentration in the boreholes ranged from 0 to 0.76 mg/L. The highest
value was recorded in borehole (KBH10). Manganese concentration above the
permissible limit of 0.5mg/L (WHO, 2011) was measured in KBH10 and KBH12. The
levels of Mn could be due to the geology of the study area which is very rich in granite
(Karikari and Ansa-Asare, 2006). Manganese is also a naturally occurring element in
rocks and is released into the soil through weathering of the rocks. Excess manganese in a
person’s diet may inhibit the use of iron in the regeneration of blood hemoglobin. A high
dose of manganese causes apathy, headaches, insomnia and weakness of legs (Jennings et
al., 1996).
The concentrations of copper and lead in the HD wells varied from 0 to 0.084mg/L and 0
to 0.032mg/L for the entire study period. However during the dry season, none of them
was detected in any of the hand dug wells. The concentration of copper that was
measured in five out of twelve hand dug wells and a stream were all below the
permissible limit of 2 mg/L (WHO, 2011). Copper normally occurs in water from copper
pipes, as well as from additives designed to control algal growth. Meanwhile, the
concentration of lead that was measured in five out of twelve hand - dug wells and a
stream were all above the WHO, (2011) permissible limit of 0.010 mg/L. The
concentration of lead was recorded in six out of nineteen boreholes during the wet
season. The levels were all above the WHO limit of 0.010mg/L except borehole (KBH1).
The presence of lead in the hand-dug wells and boreholes during the wet season could be
due to corrosion of the lead used to put together the copper piping. Lead in the body can
cause serious damage to the brain, kidneys, nervous system and red blood cells.
University of Ghana http://ugspace.ug.edu.gh

70
Cadmium concentration of 0.056 mg/L was recorded in KHD2 for both seasons, which is
above the WHO, (2011) acceptable limit of 0.003 mg/L due to leakage from
contaminated sites. Again cadmium concentration of 0.048 mg/L, 0.016 mg/L and 0.042
mg/L, 0.017 mg/ which are above the WHO, (2011) acceptable limit of 0.003mg/L were
recorded in KBH 3 and KBH 4 for the wet and dry seasons respectively. Long-term
exposure to cadmium can cause kidney and liver damage, and damage to circulatory and
nerve tissue. KHD 4 measured the concentration of zinc to be 0.052 mg/L.
4.7 Isotopic Composition of Groundwater
The distribution of δ18
O in the hand dug wells ranges from –4.01 to –2.13‰ VSMOW
and δ2H from –16.09 to –7.04‰ VSMOW during the wet season. The distribution of
δ18
O of the boreholes ranges from –3.86 to –2.21‰ VSMOW and δ2H from –18.08 to –
8.35‰ VSMOW for the wet season. A plot of δ2H against δ
18O of the analyzed
groundwater samples for the wet season is shown in Figure 21.
University of Ghana http://ugspace.ug.edu.gh

71
Fig. 21: Relationship between hydrogen-2 and oxygen-18 isotopes for groundwater
samples in the study area during the wet season
During the wet season, it is shown in Figure 21 that most of the groundwater samples
plotted around the Local and Global Meteoric Water Lines. Indicating that the
groundwater is recharge by direct infiltration of rain water. This observation can be used
to understand that the recharge mechanism of groundwater in the study area is through
rainfall which infiltrates the soil and displaces the residual soil water downward.
Eventually, this mixed water will reach the water table. Again, it can be seen that most of
the samples plotted around -3.518
O ‰ VSMOW, indicating that the groundwater is
recharge by direct precipitation of -3.5 δ 18
O ‰ VSMOW.
University of Ghana http://ugspace.ug.edu.gh
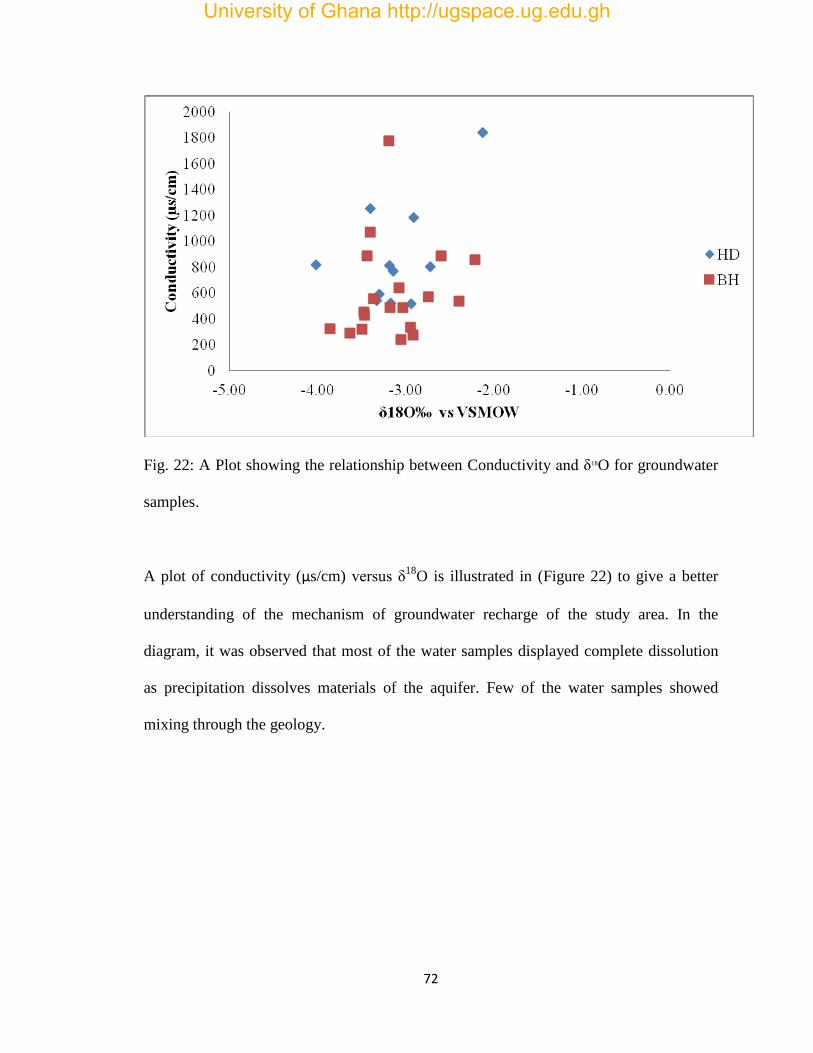
72
Fig. 22: A Plot showing the relationship between Conductivity and δ18O for groundwater
samples.
A plot of conductivity (µs/cm) versus δ18
O is illustrated in (Figure 22) to give a better
understanding of the mechanism of groundwater recharge of the study area. In the
diagram, it was observed that most of the water samples displayed complete dissolution
as precipitation dissolves materials of the aquifer. Few of the water samples showed
mixing through the geology.
University of Ghana http://ugspace.ug.edu.gh

73
4.8 Water Quality Index (WQI)
The chemistry of groundwater has been utilized as a measure to outlook the quality of
water for drinking and other purposes (Vasanthavigar et al. 2010; Edmunds et al. 2002).
Tiwari and Mishra (1985) specifically used WQI to determine the suitability of
groundwater for drinking purpose.
A location-wise calculated WQI values (using equation (1) page 39) for the different
groundwater samples are presented in Table 4.
Table 4: Results of the calculated WQI of the sampling points
Sample ID WQI Quality
KHD 1 248.95 Poor and unsuitable for drinking
KHD 2 143.39 Poor and unsuitable for drinking
KHD 3 273.18 Poor and unsuitable for drinking
KHD 4 283.19 Poor and unsuitable for drinking
KHD 5 1.152 Excellent
KHD 6 1.114 Excellent
KHD 7 1.118 Excellent
KHD 8 1.237 Excellent
KHD 9 1.060 Excellent
KHD 10 1.149 Excellent
KHD 11 1.126 Excellent
KBH 1 114.53 Poor and unsuitable for drinking
KBH 2 240.34 Poor and unsuitable for drinking
KBH 3 338.43 Poor and unsuitable for drinking
University of Ghana http://ugspace.ug.edu.gh

74
KBH 4 329.41 Poor and unsuitable for drinking
KBH 5 306.98 Poor and unsuitable for drinking
KBH 6 214.32 Poor and unsuitable for drinking
KBH 7 1.297 Excellent
KBH 8 1.212 Excellent
KBH 9 1.162 Excellent
KBH 10 1.279 Excellent
KBH 11 1.084 Excellent
KBH 12 1.275 Excellent
KBH 13 1.232 Excellent
KBH 14 1.189 Excellent
KBH 15 1.146 Excellent
KBH 16 1.123 Excellent
KBH 17 1.177 Excellent
KBH 18 1,133 Excellent
KBH 19 1.176 Excellent
The results of the computed WQI values of the hand-dug wells ranged from 1.060 to
283.19, while the boreholes ranged from 1.084 to 338.43. Most of the groundwater
samples showed ‘excellent water’ quality with the hand-dug wells registering 63.64% and
boreholes recording 68.42%. Few locations of the groundwater samples were unsuitable
for drinking. It is evident that, though the geological materials contribute to the presence
of dissolved ions in the water, these areas of ‘unsuitable’ water quality might be as a
University of Ghana http://ugspace.ug.edu.gh

75
result of leaching from point source pollutants from nearby effluents, domestic disposal
sites, septic tanks or agricultural wastes (agrochemicals, fertilizers, etc.). A comparison of
the WQI values of the samples showed that the groundwater samples which were closer
to septic tanks, soakaway and KVIPs were unsuitable for drinking.
University of Ghana http://ugspace.ug.edu.gh

76
CHAPTER FIVE
SUMMARY, CONCLUSION AND RECOMMENDATIONS
5.1 SUMMARY
Groundwater is the most important source of the domestic, industrial and agricultural
water supply in the world. Chemical and microbiological activities are the major threats
to the effect of total dependence on groundwater as a source of drinking water. As
groundwater comes into contact with ore-bearing rocks, dissolution of elements into the
water course occurs. Groundwater development in Ghana is further hampered by
improper disposal of hazardous and solid wastes, leakage of underground storage tanks,
and seepage of agrochemicals from agricultural farms. Available data from previous
studies (e.g., Amuzu, 1975; Andah, 1993; Kortatsi, 1994; WARM, 1998; Darko et al,
2003; Amankona, 2010) indicate that the quality of groundwater abstracted from
boreholes in some parts of Ghana is generally of good chemical and microbiological
quality. However, studies conducted by Amin et al (2012), Obiri-Danso (2008), Nyarko
(2008) and Hamida et al (2006) on hand dug wells and boreholes revealed high levels of
total coliform, faecal coliform and E. coli in the water.
Due to the high pollution of most of the surface water in Ghana, ground water is now
preferred to surface water (Adeyeye and Abulude, 2004). Accra, the capital city of
Ghana, is densely populated due to migration of people from the rural areas and various
regions to seek greener pastures. The conventional water treatment facility thus, cannot
meet the potable water demands of residents. Individuals have therefore resorted to
University of Ghana http://ugspace.ug.edu.gh

77
developing their own water supplies from groundwater resources through drilling of
individual boreholes, as in the case of Kwabenya (study area). Pollution of groundwater
has become alarming in response to increasing knowledge on their effect to human health
(Anazawa et al, 2004).
This research study was conducted to assess the quality of these private hand dug wells
and boreholes and to determine the water quality index.
Thirty one water sampling points made up of nineteen boreholes, eleven hand-dug wells
and surface water (stream) were sampled. Physical parameters such as temperature,
electrical conductivity (EC), salinity and total dissolved solids (TDS) were measured in
situ in the field by the HACH conductivity meter. The pH was measured with a pH meter
calibrated with standard pH buffers 4 and 7. Sodium and potassium concentrations were
determined using the flame emission photometer (Sherwood model 420). The major
anions (Cl-, SO4
2-, NO3
- and PO4
2-) were analysed using the Dionex ICS-90 ion
chromatograph system. EDTA Titrimetric Method was employed to determine calcium
concentration. Trace metals (Fe, Cu, Zn, Cr, Cd, Pb, Ni and Mg) were determined using
Varian AA240 Fast Sequential Atomic Absorption Spectrometer (AAS).
The membrane filtration technique was employed in the determination of three indicator
bacteria, namely; Total Coliform, Faecal Coliform, and Escherichia Coli (E. Coli)
whereas Total Heterotrophic Bacteria was analysed using Pour Plate Method. Stable
isotopes (oxygen-18 and deuterium) were analysed using the off-axis integrated cavity
output spectroscopy (OA-ICOS) Los Gatos Research DT-100 Liquid-Water Isotope
Analyser (Model 908-008-2000).
University of Ghana http://ugspace.ug.edu.gh

78
The research conducted in the Kwabenya community revealed that water from boreholes
and hand dug wells sampled were slightly acidic to basic with few localized areas
showing strong acidic groundwater. Majority of the groundwater samples analysed (85
%) were found to be fresh water since their total dissolved solids (TDS) did not exceed
1000 mgL1.
Relatively low concentrations of inorganic constituent were found in water from hand
dug wells and borehole from the study area. Generally, the major anions (chloride [Cl-],
nitrate [NO3-], and sulphate [SO4
2-]) in the groundwater samples were low. The
concentration of the major cations were in the order of Na+>Ca
2+>K
+>Mg
2+. Most of the
values for the major ions were found to be acceptable according to WHO guidelines for
drinking water. Hydrochemical facies identified Na-Cl as the main water type.
Stable isotope composition of δ18
O and δ2H of hand dug wells and boreholes showed
that recharge is by direct rainfall infiltration and also by evaporated water either on the
ground surface or in the unsaturated zone.
Plot of conductivity versus δ18
O displayed complete dissolution as precipitation dissolves
materials of the aquifer.
From the results of the computed WQI values, most of the ground water in the study area
(63.64% hand dug wells and 68.42% boreholes) showed ‘excellent water’ quality.
Generally 32.25% of all groundwater samples (6 boreholes and 4 hand dug wells) were
found to be of poor quality and unsuitable for drinking without treatment.
University of Ghana http://ugspace.ug.edu.gh

79
5.2 CONCLUSION
The research study conducted in the Kwabenya community revealed that most of the
groundwater samples analyzed were found to contain minimal physicochemical
parameters, with the exception of few which contain high nitrate, sodium and chloride
concentrations.
Hand dug wells and boreholes which were less or about 10m away from septic tanks,
soakaway and KVIP were found to be highly contaminated with total coliform, faecal
coliform, E. coli and total heterotrophic bacterial with faecal coliform and E. coli being
the least pollutants. It may therefore require treatment such as boiling or treatment with
hypochlorite solution since that will kill most microbial parasites before drinking.
Iron is a major component of all the hand dug wells and boreholes, probably originated
from the parent rocks. Stable isotope composition of δ18
O and δ2H of groundwater
samples showed that recharge is by direct rainfall infiltration and plot of conductivity
versus δ18
O displayed complete dissolution as precipitation dissolves materials of the
aquifer.
Also some of the groundwater’s, the hand dug wells in particular, are recharged by
evaporated water either on the ground surface or in the unsaturated zone. Hydrochemical
facies identified Na-Cl as the main water type.
Generally, hand dug wells and boreholes in the Kwabenya community are of good quality
and suitable for drinking and other domestic purposes, provided it is not drilled closer to
a septic tank, soakaway, or KVIP.
University of Ghana http://ugspace.ug.edu.gh

80
5.3 RECOMMENDATIONS
Further investigation should be conducted to ascertain the source of the higher acidic
level of borehole number ten (KBH10).
District assembly should make sure that drilling of hand dug wells and boreholes are not
closer to septic tanks, soakaway and KVIPs.
The Municipal Assembly should demand that water quality tests are conducted on all
hand dug wells and boreholes at least twice a year.
Public health education should be intensified in the rural communities within the
municipality on the need to keep sanitary conditions around hand dug wells and
boreholes.
The communities should be educated on the dangers associated with sitting hand dug
wells and boreholes closer to public places of convenience and dump sites.
5.4 SUGGESTIONS FOR FUTURE RESEARCH
The research has shown that the quality of water from the private hand dug wells and
boreholes are of good quality, provided it is not drilled closer to a septic tank, soakaway,
or KVIP. It was found out that most of the hand dug wells and boreholes are pumped into
tanks before distribution. Further research, can therefore, and be carried out on the
quality of water stored by people in these tanks.
University of Ghana http://ugspace.ug.edu.gh

81
REFERENCES
Ackah, M, Agyemang,O, Anim A.K, et al. 2011. Assessment of groundwater quality for
drinking and irrigation: the case study of Teiman-Oyarifa Community, Ga East
Municipality, Ghana. Proceedings of the International Academy of Ecology and
Environmental Sciences, 1(3-4): 186-194.
Adomako, D., Osae, S., Akiti, T. T., Faye S. and Maloszewski, P. (2011).Geochemical
and isotopic studies of groundwater conditions in the Densu River Basin of Ghana.
Environ Earth Sci 62:1071–1084.
Akiti, T. T. (1980). Étude géochimique et isotopique de quelqués aquifers du Ghana.
(Dr.Ing. Thesis) Univeristé Paris-Sud. pp. 232.
Amankona, B. K. (2010). Evaluation of the microbiological and physicochemical quality
of Borehole water in the Offinso District of Ashanti Region. (Published Thesis)
Department of Natural Resource Management, Kwame Nkrumah University of Science
and Technology. pp79.
Amfo-Out, R., Omari, S., Boakye-Dede, E. (2012). Assessment of physicochemical
quality of groundwater sources in Ga East Municipality of Ghana. Environ. and Natural
Resources Research; Vol. 2, No3.
University of Ghana http://ugspace.ug.edu.gh

82
Amin, R. Syed, A., Zubair, A. (2012). Microbial Analysis of drinking water and water
distribution system in new urban Peshawar. Current Research Journal of Biological
Science 4 (6): 731-737.
Amuzu, A. T., (1975). A survey of the water quality of the River Densu. WRRI
Technical Report. Accra, Ghana.
Anazawa, K, Kaido, Y, Shinomura, Y. (2004). Heavy-metal distribution in River waters
and sediments around a “Firefly Village´e, Shikoku, Japan: Application of multivariate
analysis. Analytical Sciences, 20: 79-84.
Andah, A.I., (1993). Groundwater Utilization for small-scale Irrigation in the Accra
Plains: Kponkpo and Ablekuma pilot schemes. Water Resources Research Institute
(C.S.I.R). Accra, Ghana.
Anim, A. K, Duodu G. O, Ahialey E. K. (2011). Assessment of surface water quality:
The perspectives of the Weija dam, Ghana. International Journal of Chemistry, 3(2): 32-
39.
American Public Health Association (1998). ‘‘Standard Methods for the examination of
Wastewater’’ Ed. 20th
.
University of Ghana http://ugspace.ug.edu.gh
83
Asadi, S.S, Vuppala, P, Reddy M.A (2007) Remote sensing and GIS techniques for
evaluation of groundwater quality in municipal corporation of Hyderabad (Zone-V)
India. Int J Environ Res Public Health 4(1):45–52.
Ayibotele, N. B., (1985). Development and management of groundwater resources in
Ghana — some current problems. Lecture IV, 2nd International Advanced Course on
Water Resources Management, Centre for International Studies, Perugia, Italy.
Balek, J. (1989). Groundwater resources assessment. Elsevier, pp 90 – 107.
Clark, I. and Fritz, P. (1997). Environmental Isotopes in Hydrogeology. Lewis
Publishers, Boca Raton.
Cairncross, S. (1987). Water supply and sanitation: an agenda for research. J. Trop. Med.
Hyg. 92: 301-314.
Cairncross, S, Cliff, J.L (1987). Water use and health in Mireda, Mozambique. Trans.
Royal Soc. Trop. Med. Hyg. 81: 51-54.
Cornish, G.A., Aidoo, J.B., (2000). Informal Irrigation in the peri-urban zone of Kumasi,
Ghana: Findings from an initial questionnaire survey. Report OD/TN 97. HR
Wallingford, UK.
Craig, H. (1961). Isotopic variations in natural waters. Science 133, 1702-1703.
University of Ghana http://ugspace.ug.edu.gh
84
Craun, G.F. (1986). Waterborne diseases in the United States. CRC Press Inc. Boca
Raton, Florida.
Darko, P.K., Krasny, J., (2003a). Quantitative limits for groundwater exploitation under
natural conditions in southwest Ghana. Proceedings of the IAH International Conference
on Groundwater in fractured rocks, Czech Republic, Sept. 2003, p. 141-142.
Darko, P.K., Krasny, J., (2003b). Regional transmissivity distribution and groundwater
potential in hard rocks of Ghana. Proceedings of the IAH International Conference on
Groundwater in fractured rocks, Czech Republic, Sept. 2003, p. 45-46.
De Vries, J.J. and Simmers I. (2002). Groundwater recharge: an overview of processes
and challenges. Hydrogeology Journal 10:5-17.
Dickson, K. and Benneh, G. (1988). A New Geography of Ghana.Longman, London,
U.K.
Elango, L., Subramani, T. and Rajmohan, N. (2010). Groundwater geochemistry and
identification of hydrogeochemical processes in a hard rock region, Southern India.
Environ Monit Assess 162:123-137.
Fianko, J.R., V.K. Nartey and A. Donkor,( 2010). The Hydrochemistry of groundwater in
rural communities within the Tema Disrict, Ghana. Envion. Monit. Assess., 168: 441-
449.
University of Ghana http://ugspace.ug.edu.gh

85
Fianko, J.R., Adomako, D., Osae, S., Ganyaglo, S., Kortatsi, B.K., Tay, C.K. and Glover,
E.T. (2011). The hydrochemistry of groundwater in the Densu River Basin, Ghana,
Environ Monit Assess (2010) 167:663–674.
Fontes, J.C. (1980). Environmental isotopes in groundwater hydrology. In: Fritz P.,
Fontes, J.C. (eds) Handbook of environmental isotope geochemistry. Elsevier,
Amsterdam.
Foster, S.S.D. and Gomes, D.C. (1989). Groundwater Quality Monitoring: An Appraisal
of Practices and Costs. Pan American Centre for Sanitary Engineering and Environmental
Science, Lima, 103 pp.
Freeze, R.A. and Cherry, J.A. (1979). Groundwater. Prentice-Hall, Englewood Cliffs,
New
Jersey, 604 pp.
Fuest S., Berlekamp J., Klein M., and Matthies M. (1998). Risk hazard mapping of
groundwater contamination using long-term monitoring data of shallow drinking water
wells. J Hazardous Mater 61:197–202.
Gibson, J.J., Edwards, T.W.D. and Bursey, G.G. (1993). Estimating evaporation using
stable isotopes: quantitative results and sensitivity analysis for two catchments in
northern Canada. Nord Hydrol 24:79–94.
University of Ghana http://ugspace.ug.edu.gh

86
Grabow, W.O.K. (2000). The Safety of Water Disinfection Chem. and Microb. Risks.
Radisson Denville Resort, Miami Beach, Florida. USA.
Gyau-Boakye, P. and Dapaah-Siakwan, S. (2000). Groundwater as source of rural water
supply in Ghana. Journal of applied science and technology (JAST), vol. 5, Nos. 1 & 2
pp. 77 – 86.
Gyau-Boakye, P., Dapaah-Siakwan, S. (1999). Groundwater: solution to Ghana’s rural
water supply industry? Water Resources Research Institute, Accra, Ghana.
Gyau-Boakye, P., Kankam-Yeboah, K., Darko, P.K., Dapaah-Siakwan, S., and Duah,
A.A., (2008). Groundwater as a vital resource for rural development: An example from
Ghana. In: S. Adelana, A. MacDonald, T.A. Alemayehu and C. Tindimugaya, eds.
Applied groundwater studies in Africa, IAH selected papers Q3 on hydrogeology. vol.
13.
Hamida, A., A. Javed, N.A. Mohammad and I. Musaddiq, (2006). Bacteriological
analysis of drinking water of hand pumps in different schools of District Peshawar
(Pakistan). Pak. J. Food. Sci., 16(1-4): 34-38.
HAP, (2006). Hydrological assessment of the Northern Regions of Ghana: A
bibliographical review of selected papers. CIDA, WRC, SNC-LAVALIN International.
University of Ghana http://ugspace.ug.edu.gh

87
ICMR (1975). Indian Council of Medical Research. Manual of standards of quality for
drinking water supplies.
Issah, A. (2002). Assessment of Underground Water Quality and Levels of Heavy Metals
in the Upper East and Northern Regions of Ghana (Published Thesis) Department of
Chemistry Kwame Nkrumah University of Science and Technology, Kumasi. pp3-4.
Jenkins, A., Peters, N.E and Rodhe, A. (1994). Hydrology, p 32-44. In: B. Moldan and J.
Cerny (eds.) Biogeochemistry ofSnwll Catchments: A Tool for Environmental Research.
John Wiley & Sons Ltd.
Jenningngs, G. D. and Sneed, R.E. (1996). Metals in Drinking water. Water Quality and
Waste Management, North Carolina Cooperative Extension Service, Publication NO.
AG-473-1.
Kankam-Yeboah, K., (1987). Status Report on the pilot scheme in Groundwater
Utilization in the Accra plains. WRRI-CSIR Accra, Ghana.
Karikari, A.Y., Ansa-Asare, O. D. (2009). Physico-Chemical and Microbial Water
Quality Assessment of Densu River of Ghana. CSIR-Water Research Institute, Accra,
Ghana.
University of Ghana http://ugspace.ug.edu.gh

88
Kattan, Z. (1995). Chemical and environmental isotope study of fissured basaltic aquifer
systems of the Yarmouk Basin. Proceedings of a Symposium on Isotopes in Water
Resources Management. Vol 2, Vienna. p.10.
Kesse, G.O. (1985). The mineral and rock resources of Ghana. Balkema, Rotterdam, pp
13–26, 40–67
Kortatsi, B.K. (1994). Groundwater utilization in Ghana. Paper presented at the future
groundwater resources at risk (Proceedings of the Helsinki Conference, June). IAHS
Publ. no. 222.
.
Kortatsi B.K. (2007). Hydrochemical framework of groundwater in the Ankobra Basin,
Ghana. Aquatic Geochemistry, 13: 41-74
Kortatsi B.K, Tay C, Hayford E,et al. (2008). Hydrogeochemical evaluation of
groundwater in the Lower Offin Basin of Ghana. Environmental Geology, 53(8): 1651-
1662.
Laube, W., Awo, M., Schraven, B., (2008). Erratic Rains and Erratic Markets:
Environmental change, economic globalisation and the expansion of shallow
groundwater irrigation in West Africa. ZEF Working Paper Series, ISSN 1864-6638.
University of Ghana http://ugspace.ug.edu.gh

89
Department of Political and Cultural Change Center for Development Research,
University of Bonn.
Leap, D.I. (1999). Geological occurrence of groundwater, p 40-43. In: J. Delleur (ed.)
The handbook of groundwater engineering. CRC Press LLC and Springer-Verlag
McSween, H.Y., Richardson, S.M. and Uhle M. (2003). Geochemistry: pathways and
processes. Columbia Uni. Press, 2nd edition.
Mirabbasi, R., Mazloumzadeh S.M, Rahnama M.B. (2008). Evaluation of irrigation water
quality using fuzzy logic. Research Journal of Environmental Sciences, 2(5): 340-352.
MOFA, (2004). Projected livestock population for 1997-2007. Ministry of Food and
Agriculture, Accra, Ghana
Nolan B.T., Stoner J.D. (2000). Nutrients in groundwaters of the conterminous United
States, 1992–1995. Environ Sci Technol; 34: 1156–65.
Nyarko,A.A. (2008). Assessment of groundwater quality and urban water provision, A
case study of Taifa township in the Ga East district of the Greater Accra region,
Ghana.(Published Thesis), Department of Theoretical and Applied Biology, Kwame
Nkrumah University of Science and Technology, Kumasi. pp55.57
University of Ghana http://ugspace.ug.edu.gh

90
Obiri-Danso K, Jones K (1999b). The effect of a new sewage treatment plant on faecal
indicator numbers, campylobacters and bathing water compliance in Morecambe Bay. J.
Appl. Microbiol. 86: 603-614.
Osiakwan, G.M. (2002). ‘Baseline Studies into the Groundwater Resources in The
Bosomtwi-Atwima-Kwanwoma District of Ashanti Region (Published thesis) Nkrumah
University of Science and Technology, Kumasi Ghana, Pp.23-26.
Pelig-Ba, K. B. (1989). An Investigation of the Water Quality Problem on Borehole
AP216 at Oyibi. Unpubl. Report of the Water Resources Research Institute, Accra.
Piper AM. (1953). A Graphic Procedure I the Geo-chemical Interpretation of Water
Analysis. USGS Groundwater Note, USA.
Pye VI, Patrick R (1983) Groundwater contamination in the United.States. Science 221:
713-718.
Ragnarsdottir, K.V., Kapitulcinova, D., Cockell, C.S. and Hallam, K.R. (2010). The role
of cyanobacteria in sheet silicate weathering: a laboratory study. Environmental
mineralogy group research in progress meeting (mineralogical society of Great Britain
and Ireland), Keyworth, UK.
University of Ghana http://ugspace.ug.edu.gh

91
Saka, D., Akiti, T.T, Osae, S. (2013). Hydrogeochemistry and Isotopes studies of
groundwater in the Ga East Municipal area, Ghana. Appl Water Sci ;3:577–588, Vol 3,
No3.
Smedley, P. L. ,Edmunds, W.M., West, J.M., Gardner, S.J. and Pelig-Ba, K.B. (1995).
Health problems related to groundwaters in the Obuasi and Bolgatanga areas, Ghana.
British Geological Survey Technical Report, WC/95/43.
Smith, J.W.N. (2005). Groundwater – surface water interaction in the hyporheic zone.
Environment Agency, Rio House, Bristol.
Snyder, J.D., and Merson M.H. (1982) .“The Magnitude of the Global Problem of Acute
Diarrhoeal Disease: A Review of Acute Surveillance Data”, Bulletin of the World
Meteorological Organisation, 60: 605-613.
Stumm, W., & Morgan, J. J. (1981). In Aquatic Chemistry (2nd ed.). John Wiley & Sons,
Inc New York, London, Sydney & Toronto.
US EPA (1993). Wellhead Protection: A Guide for small communities, Office of
Research and Development Office of Water, Washington DC (CEPA/ 625/ R-93/002).
UNESCO (2006). UNESCO water portal newsletter no. 161: Water-related diseases
University of Ghana http://ugspace.ug.edu.gh

92
Tazioli, G. S, Cantori, P. M., Ciancetti, G. F. (1995). Intercomparison of different tracers
in the evaluation of groundwater dynamics in heterogeneous porous aquifers. IAEA-SM-
336/40, Vienna. p. 147.
Thompson, T. and Khan, S. (2003). Situation analysis and epidemiology of infectious
disease transmission: a South-Asian regional perspective. International Journal of
Environmental Health Research, 13: S29-S39.
Tiwari, T.N, Mishra, M. (1985). A preliminary assignment of water quality index of
major Indian rivers. Indian J Environ Prot 5(4):276–279.
Todd, D.K. (1980) Groundwater Hydrology. 2nd edition, John Wiley, New York, 535 pp.
UNEP (United Nations Environment Programme) 1989 Environmental Data Report
1989/90, Blackwell Reference, Oxford, 547 pp.
Vasanthavigar, M., Srinivasamoorthy, K., Rajiv Gantha, R., Vijayaraghavan, K., &
Sarma, V. S. (2010). Characterization and quality assessment of groundwater with special
emphasis on irrigation utility: Thirumanimuttar sub-basin, Tamil Nadu, India.
WARM, (1998). Water resources management study, information ‘building block’ study.
Part II, Volta basin system, groundwater resources. Accra: Ministry of Works and
Housing.
WHO/UNICEF (2004). Meeting the MDG Drinking Water and Sanitation: A Mid-Term
Assessment of Progress. Geneva: WHO/UNICEF. ISBN 92 4 156278 1. World Health
University of Ghana http://ugspace.ug.edu.gh
93
Report 2003. Shaping our future. World Health Organisation. ISBN 9241562439
(http://www.who.int/whr/en/).
WHO (2000). The world Health Report: Making a difference. Geneva, World Health
Organisation. ISBN 94 4156201
WHO (2004). World health organisation guidelines for drinking water quality, 3rd edn,
vol 1. Geneva. ISBN 92 45 154638 7 pp 296–400
WRI (1993). Groundwater assessment report on the Accra plains. Unpublished Technical
Report, WRI of CSIR, Ghana.
World Vision International (WVI) (2000). Rural Water Project Ghana, Quarterly Report
Kumasi, Pp 1-3.
Zhang, W.J, Jiang, F.B, Ou, J.F. (2011). Global pesticide consumption and pollution:
with China as a focus. Proceedings of the International Academy of Ecology and
Environmental Sciences, 1(2): 125-144.
University of Ghana http://ugspace.ug.edu.gh

94
APPENDIX
APPENDIX A: Detailed field parameters of the study area for the wet
season.
Sam.
ID Tem
(°C) pH
TDS
(mg/L)
Cond.
(µS/cm)
Sal(
%) Alk.
(mg/L) Titre
Conc.
(mg/l)
Vol.
(ml) Alk HCO3- TH
KHD 1 28.8 5.4 409.9 816.4 1.5 20 1 0.02 50 20 24.38 40
KHD2 29 5.3 384.9 769.7 1.4 24 1.2 0.02 50 24 29.26 48
KHD3a 29 5.8 406.8 812.4 1.5 24 1.2 0.02 50 24 29.26 48
KHD3b 29.4 6 382.2 764.4 1.4 24 1.2 0.02 50 24 29.26 48
KHD4 30.1 6.5 592.9 1186 2.2 108 5.4 0.02 50 108 131.6 216
KHD5 30.4 7 401.8 802.4 1.5 140 7 0.02 50 140 170.68 280
KHD6 29.9 5 258 517.1 1 15 0.75 0.02 50 15 18.28 30
KHD7 30 5.2 260.2 520.6 1 13 0.65 0.02 50 13 15.84 26
KHD8 26.8 5.6 627 1254 0.6 50 2.5 0.02 50 50 60.95 100
KHD9 27 6.6 521 1841 0.5 52 2.6 0.02 50 52 63.39 104
KHD10 29.7 6.9 300 593 0.3 60 3 0.02 50 60 73.15 120
KHD11 28.7 6.2 274 544 0.3 50 2.5 0.02 50 50 60.95 100
STR 1 29.7 5.3 124 248.6 0.5 15 0.75 0.2 50 15 18.28 30
KBH1 29.7 6.1 162.8 325.5 0.6 52 2.6 0.02 50 52 63.39 104
KBH2 30.4 6.1 167.2 335 0.6 30 1.5 0.02 50 30 36.57 60
KBH3 29.9 7.3 225.6 451.4 0.8 110 5.5 0.02 50 110 134.11 220
KBH4 31.4 5.7 244.5 489 0.9 22 1.1 0.02 50 22 26.82 44
KBH5 30.3 6.1 267.3 534.6 1 22 1.1 0.02 50 22 26.82 44
University of Ghana http://ugspace.ug.edu.gh

95
KBH6 30 5.3 285.8 571.9 1.1 14 0.7 0.02 50 14 17.06 28
KBH7 27.6 5.9 277.5 556.1 0.19 41 2.05 0.02 50 41 49.98 82
KBH8 30.7 6.9 120.5 239.5 0.4 43 2.15 0.02 50 43 52.42 86
KBH9 30.3 8.3 214.9 430.5 0.8 124 6.2 0.02 50 124 151.1 248
KBH10 32.9 3.1 888.8 1777 3.3 0 0 0.02 50 0 0 0
KBH11 30.5 5 429.8 859.7 1.6 14 0.7 0.02 50 14 17.06 28
KBH12 28.7 6 443.7 887.8 1.6 95 4.75 0.02 50 95 115.8 190
KBH13 27.8 6 159.9 319 0.1 40 2 0.02 50 40 48.76 80
KBH14 28.1 6.4 537 1068 0.5 40 2 0.02 50 40 48.76 80
KBH15 29 6.3 445 888 0.4 56 2.8 0.02 50 56 68.27 112
KBH16 30.3 6 138.7 277 0.1 42.5 1.7 0.02 50 34 41.45 68
KBH17 34.2 5.8 245 489 0.2 40 2 0.02 50 40 48.72 80
KBH18 29.6 6 326 642 0.3 50 2 0.02 50 40 48.76 80
KBH19 30.8 6.2 144.4 289 0.1 60 3 0.02 50 60 73.15 120
University of Ghana http://ugspace.ug.edu.gh

96
APPENDIX A (Continued)
Detailed field parameters of the study area for the dry season.
Sample Tem
(°C) pH
TDS
mg/L
Cond
(µS/cm
)
Sal
% Titre
Con
c.m
g/L
Vol/
ml Alkal Bicarbo TH
KHD 1 31.2 7.4 503 1004 0.5 1.2 0.02 50 24 29.26 1.219 48
KHD2 35.1 5.5 486 971 0.5 0.7 0.02 50 14 17.07 1.219 28
KHD3a 33.4 5.2 476 951 0.5 0.7 0.02 50 14 17.07 1.219 28
KHD3b 29.6 5.5 461 981 0.4 1 0.02 50 20 24.38 1.219 40
KHD4 29.6 6.2 761 1522 0.8 1.5 0.02 50 30 36.58 1.219 60
KHD5 29.3 6.3 580 1161 0.6 4.8 0.02 50 96 117.04 1.219 192
KHD6 29.5 6.1 317 633 0.3 2.4 0.02 50 48 58.52 1.219 96
KHD7 30 5.8 322 643 0.3 1.2 0.02 50 24 29.26 1.219 48
KHD8 27.7 6 654 1305 0.6 1.8 0.02 50 36 43.89 1.219 72
KHD9 32.3 6.5 515 1028 0.5 1.3 0.02 50 26 31.70 1.219 52
KHD10 31.8 8 291 583 0.3 2.6 0.02 50 52 63.40 1.219 104
KHD11 25 8.1 112 325 0.2 3.4 0.02 50 68 82.90 1.219 136
STR 1 32.8 7.9 158.6 317 0.1 2.2 0.2 50 44 53.6439 1.219 58.5
KBH1 32.3 6.4 186.1 372 0.2 1.6 0.02 50 32 39.01 1.219 64
KBH2 30.2 6.8 198.7 396 0.2 0.9 0.02 50 18 21.95 1.219 36
KBH3 30.7 6.9 240 479 0.2 2.9 0.02 50 58 70.71 1.219 116
KBH4 34.2 6.3 278 556 0.3 1 0.02 50 20 24.38 1.219 40
KBH6 29.9 5.3 357 714 0.3 0.9 0.02 50 18 21.95 1.219 36
KBH7 27.8 7.9 315 604 0.3 2.8 0.02 50 56 68.27 1.219 112
KBH8 32.4 7.4 137.6 274 0.1 1.2 0.02 50 24 29.26 1.219 48
University of Ghana http://ugspace.ug.edu.gh

97
KBH9 31 10.5 177 354 0.2 1.2 0.02 50 24 29.26 1.219 48
KBH10 31.7 4.5 1003 2010 1 0 0.02 50 0 0.00 0.0 0
KBH11 33.2 6 327 652 0.3 1.2 0.02 50 24 29.26 1.219 48
KBH12 31.4 7.1 289 575 0.3 3 0.02 50 60 73.15 1.219 120
KBH13 32.8 7.3 161.1 322 0.3 1.6 0.02 50 32 39.01
1.219
182 64
KBH14 29.5 8.3 524 1042 0.5 2.6 0.02 50 52 63.40 1.219 104
KBH15 31.4 8 471 939 0.5 4 0.02 50 80 97.53 1.219 160
KBH16 31.7 7.2 186.3 372 0.2 1.4 0.02 50 28 34.14 1.219 56
KBH17 30.9 7.7 230 458 0.2 1.8 0.02 50 36 43.89 1.219 72
KBH19 36.1 7.6 141.7 283 0.1 2 0.02 50 40 48.77 1.219 80
University of Ghana http://ugspace.ug.edu.gh

98
APPENDIX B
Detailed Major Ions Results for the Wet Seasons
Sample
ID Ca2+ Na+ K+
Mg2+
Cl- SO42- NO3- PO43-
KHD 1 19.2 123 13.8 1.48 46.824 14.287 23.547 0
KHD2 19.2 135 11.2 1.65 132.227 53.544 89.971 0
KHD3a 9.6 156 10.9 1.2 148.635 57.69 81.792 0
KHD3b 16 117 11.2 1.62
KHD4 16 225.5 6.8 1.47 194.566 64.109 37.811 0
KHD5 41.6 36.2 2.7 0.66 95.97 55.055 45.287 0
KHD6 25.6 77.5 20.9 0.59 91.971 42.57 43.649 0
KHD7 9.6 75.3 3.3 0.67 72.555 21.91 90.55 0
KHD8 9.6 51.4 15.5 0.72 171.95 39.4 0.613 0.19
KHD9 19.2 53 10.6 1.28 183.94 64.94 2.634 0
KHD10 19.2 96.4 11.2 1.11 107.97 29.3 0.56 0
KHD11 12.8 98.7 8.9 0.88 107.97 24.64 1.45 0
KBH1 12.8 43.2 20.1 1.14 60.165 14.174 3.336 2.4
KBH2 9.6 75.1 28.2 0.81 55.074 8.671 37.396 1.95
KBH3 35.2 52.2 31.5 0.88 56.441 12.62 11.129 0
KBH4 9.6 111.2 20.2 0.49 74.754 22.445 51.792 0
KBH5 9.6 97.4 11.6 0.69 79.959 31.11 67.283 0
KBH6 12.8 115.5 10.1 0.82 88.184 30.229 68.016 0
KBH7 12.8 105.3 10.5 1.33 123.96 18.63 0.59 0
University of Ghana http://ugspace.ug.edu.gh
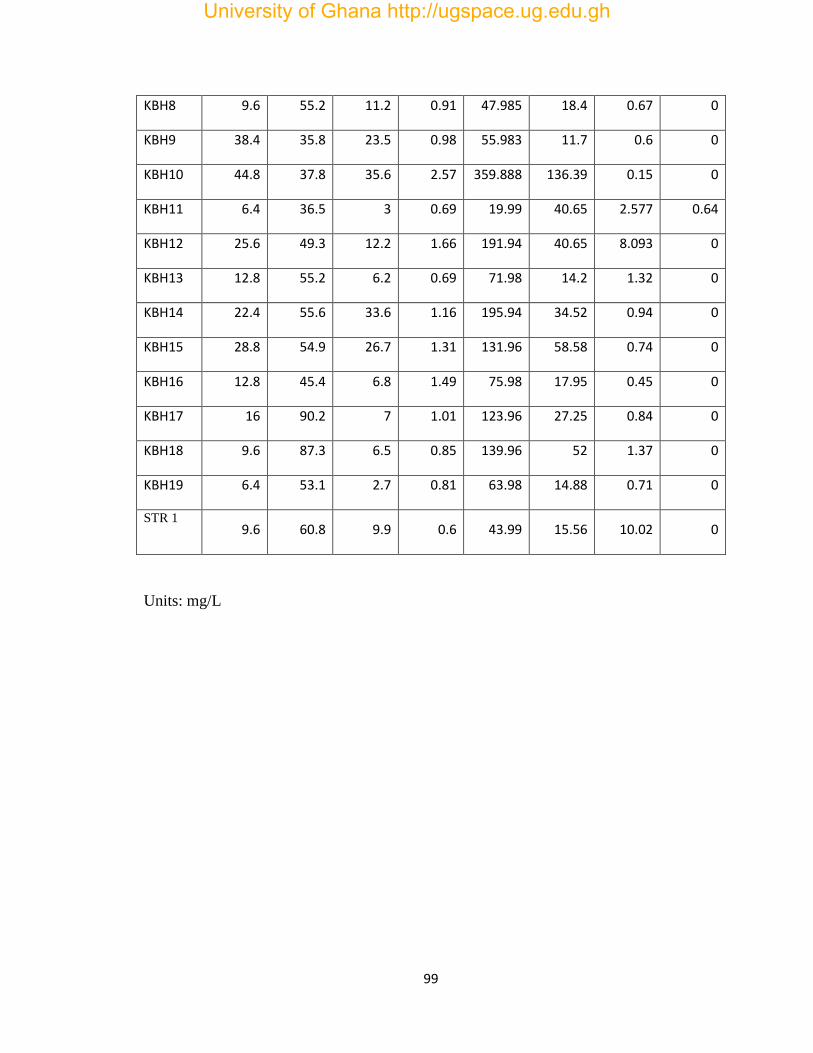
99
KBH8 9.6 55.2 11.2 0.91 47.985 18.4 0.67 0
KBH9 38.4 35.8 23.5 0.98 55.983 11.7 0.6 0
KBH10 44.8 37.8 35.6 2.57 359.888 136.39 0.15 0
KBH11 6.4 36.5 3 0.69 19.99 40.65 2.577 0.64
KBH12 25.6 49.3 12.2 1.66 191.94 40.65 8.093 0
KBH13 12.8 55.2 6.2 0.69 71.98 14.2 1.32 0
KBH14 22.4 55.6 33.6 1.16 195.94 34.52 0.94 0
KBH15 28.8 54.9 26.7 1.31 131.96 58.58 0.74 0
KBH16 12.8 45.4 6.8 1.49 75.98 17.95 0.45 0
KBH17 16 90.2 7 1.01 123.96 27.25 0.84 0
KBH18 9.6 87.3 6.5 0.85 139.96 52 1.37 0
KBH19 6.4 53.1 2.7 0.81 63.98 14.88 0.71 0
STR 1 9.6 60.8 9.9 0.6 43.99 15.56 10.02 0
Units: mg/L
University of Ghana http://ugspace.ug.edu.gh

100
APPENDIX B (CONTINUED)
Detailed Major Ions Results for the Dry Season
Sample
ID Ca2+ Na+ K+
Mg2+
Cl- SO42- NO3- PO43-
KHD 1 16 273 10.2 0.66 46.824 14.287 23.547 0
KHD2 16 292 5.6 0.56 132.227 53.544 89.971 0
KHD3a 9.6 314 5.1 0.41 148.635 57.69 81.792 0
KHD3b 12.8 258 6.5 0.43
KHD4 12.8 478 5.6 0.66 194.566 64.109 37.811 0
KHD5 28.8 499 3.9 0.68 95.97 55.055 45.287 0
KHD6 16 116.5 9.9 0.82 91.971 42.57 43.649 0
KHD7 12.8 158 4.3 1.6 72.555 21.91 90.55 0
KHD8 12.8 404 18.3 1.85 171.95 39.4 0.613 0.19
KHD9 19.2 225 8.1 1.91 183.94 64.94 2.634 0
KHD10 12.8 93.5 6.3 4.62 107.97 29.3 0.56 0
KHD11 25.6 105.5 8.1 2.66 107.97 24.64 1.45 0
KBH1 12.8 41.2 22.9 1.61 55.98 13.7 2.9 0.04
KBH2 9.6 72.1 27.1 0.63 51.98 10.06 32.72 0.31
KBH3 32 50.5 33.1 1.08 47.99 14 10.9 0.04
KBH4 9.6 110.9 16.1 0.99 67.98 37.33 49.1 0.09
KBH6 12.8 233 8.9 1.14 87.97 33.85 62.07 0
KBH7 16 101.9 10.1 1.38 107.97 35.97 0.6 0
KBH8 16 53 10.8 0.61 35.99 15.67 0.81 0.04
KBH9 28.8 32.5 9.8 0.33 47.99 11.12 1.08 0.03
University of Ghana http://ugspace.ug.edu.gh

101
KBH10 22.4 385 38 4.61 335.9 154 0.4 0.02
KBH11 12.8 108.7 8.6 1.96 119.96 39.45 0.38 0.04
KBH12 16 95.6 13.1 2.17 39.99 34.76 0.3 0.05
KBH13 12.8 62.3 7.2 1.19 87.97 8.55 1.03 0.02
KBH14 22.4 307 30.4 1.32 143.96 39.61 0.73 0
KBH15 32 96.6 17.4 1.2 91.97 49.15 0.84 0.02
KBH16 9.6 75.4 7.8 0.2 63.98 9.61 0.79 0.05
KBH17 9.6 81.3 3.6 0.57 63.98 29.91 0.69 0.05
KBH19 6.4 55.5 3.8 0.27 43.99 15.21 0.19 0.03
STR 1 6.4 88 9 1.17 39.99 28.24 6.62 0.04
Units: mg/L
University of Ghana http://ugspace.ug.edu.gh
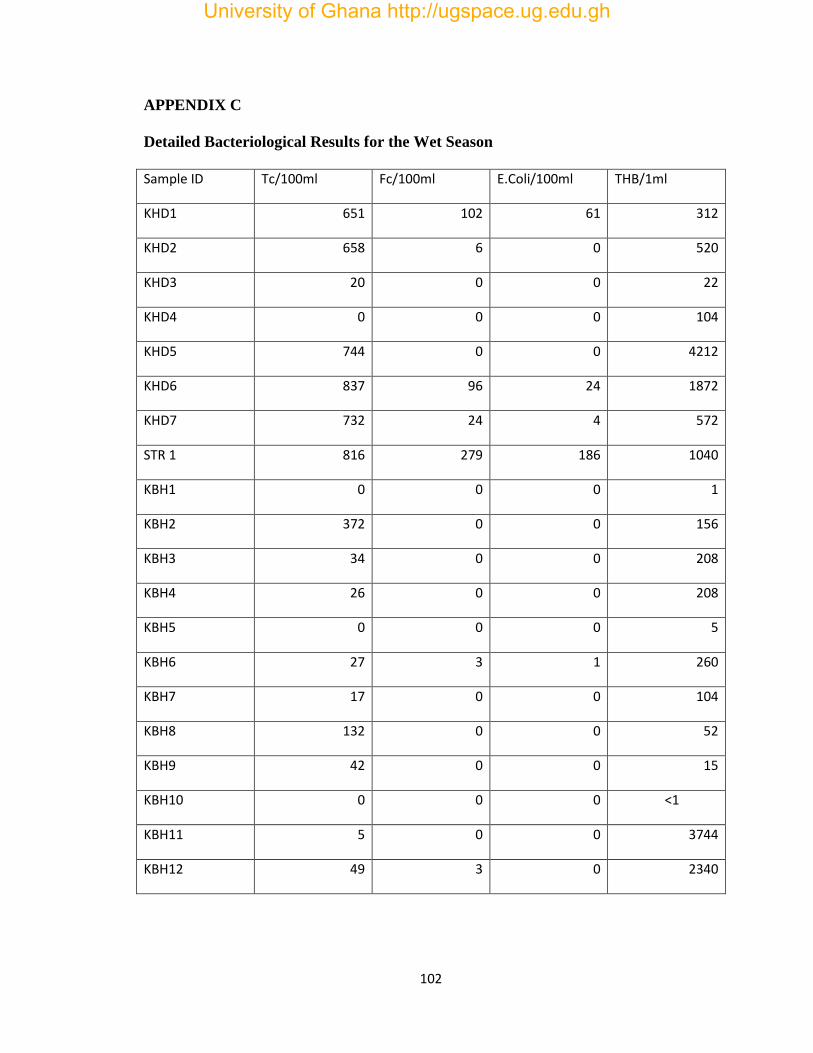
102
APPENDIX C
Detailed Bacteriological Results for the Wet Season
Sample ID Tc/100ml Fc/100ml E.Coli/100ml THB/1ml
KHD1 651 102 61 312
KHD2 658 6 0 520
KHD3 20 0 0 22
KHD4 0 0 0 104
KHD5 744 0 0 4212
KHD6 837 96 24 1872
KHD7 732 24 4 572
STR 1 816 279 186 1040
KBH1 0 0 0 1
KBH2 372 0 0 156
KBH3 34 0 0 208
KBH4 26 0 0 208
KBH5 0 0 0 5
KBH6 27 3 1 260
KBH7 17 0 0 104
KBH8 132 0 0 52
KBH9 42 0 0 15
KBH10 0 0 0 <1
KBH11 5 0 0 3744
KBH12 49 3 0 2340
University of Ghana http://ugspace.ug.edu.gh

103
APPENDIX D
Detailed Trace Metals Results for the Wet Season
Sample
ID Fe Cu Zn Pb Cd Mn Ni Mg
KHD1 0.564 0.016 0 0.028 0 0.072 0 1.48
KHD2 1.268 0.012 0 0.016 0.056 0 0 1.65
KHD3a 0.992 0.016 0 0.032 0 0 0 1.2
KHD3b 1.452 0.016 0 0.028 0 0 0 1.62
KHD4 2.38 0.084 0.052 0.032 0 0 0 1.47
KHD5 0.252 0 0 0 0 0 0 0.66
KHD6 0.072 0 0 0 0 0 0 0.59
KHD7 0.084 0 0 0 0 0 0 0.67
KHD8 2.128 0 0 0 0 0 0 0.72
KHD9 0.016 0 0 0 0 0 0 1.28
KHD10 0.224 0 0 0 0 0 0 1.11
KHD11 0.108 0 0 0 0 0 0 0.88
KBH1 0.516 0 0 0.012 0 0.24 0 1.14
KBH2 0.316 0 0 0.028 0 0.028 0 0.81
KBH3 0.448 0 0 0.04 0.048 0.024 0 0.88
KBH4 0.46 0 0 0.04 0.016 0 0 0.49
KBH5 0.556 0.012 0 0.036 0 0.02 0 0.69
KBH6 1.004 0 0 0.024 0 0.02 0 0.82
KBH7 0.8 0 0 0 0 0.32 0 1.33
KBH8 0.192 0 0 0 0 0.108 0 0.91
KBH9 0.292 0 0 0 0 0 0 0.98
University of Ghana http://ugspace.ug.edu.gh

104
KBH10 0.292 0 0 0 0 0.76 0 2.57
KBH11 0.068 0 0 0 0 0.152 0 0.69
KBH12 0.32 0 0 0 0 0.592 0 1.66
KBH13 0.236 0 0 0 0 0.16 0 0.69
KBH14 0.064 0 0 0 0 0.22 0 1.16
KBH15 0.188 0 0 0 0 0 0 1.31
KBH16 0.1 0 0 0 0 0 0 1.49
KBH17 0.44 0 0 0 0 0 0 1.01
KBH18 0.132 0 0 0 0 0 0 0.85
KBH19 0.144 0 0 0 0 0.032 0 0.81
STR 1 0.248 0 0 0 0 0 0 0.6
Units: mg/L
University of Ghana http://ugspace.ug.edu.gh

105
APPENDIX D (CONTINUED)
Detailed Trace Metals Results for the Dry Season
Sample
ID Fe Cu Zn Pb Cd Mn Ni Mg
KHD1 0.212 0 0 0 0 0.072 0 0.66
KHD2 0.804 0 0 0 0.056 0 0 0.56
KHD3a 0.432 0 0 0 0 0 0 0.41
KHD3b 0.072 0 0 0 0 0 0 0.43
KHD4 0.104 0 0 0 0 0 0 0.66
KHD5 0.232 0 0 0 0 0 0 0.68
KHD6 0.08 0 0 0 0 0 0 0.82
KHD7 0.027 0 0 0 0 0 0 1.6
KHD8 0.348 0 0 0 0 0 0 1.85
KHD9 0.344 0 0 0 0 0 0 1.91
KHD10 0.232 0 0 0 0 0 0 4.62
KHD11 0.256 0 0 0 0 0 0 2.66
KBH1 0.312 0 0 0 0 0.228 0 1.61
KBH2 0.3 0 0 0 0 0.032 0 0.63
KBH3 0.096 0 0 0 0.042 0.02 0 1.08
KBH4 0.124 0 0 0 0.011 0 0 0.99
KBH6 0.224 0 0 0 0 0.02 0 1.14
KBH7 0.836 0 0 0 0 0.364 0 1.38
KBH8 0.192 0 0 0 0 0.128 0 0.61
KBH9 0.292 0 0 0 0 0 0 0.33
KBH10 0.3 0 0 0 0 0.72 0 4.61
University of Ghana http://ugspace.ug.edu.gh

106
KBH11 0.072 0 0 0 0 0.176 0 1.96
KBH12 0.336 0 0 0 0 0.6 0 2.17
KBH13 0.828 0 0 0 0 0.196 0 1.19
KBH14 0.2 0 0 0 0 0.252 0 1.32
KBH15 0.304 0 0 0 0 0 0 1.2
KBH16 0.072 0 0 0 0 0 0 0.2
KBH17 0.836 0 0 0 0 0 0 0.57
KBH19 0.296 0 0 0 0 0.02 0 0.27
STR 1 0.256 0 0 0 0 0 0 1.17
Units: mg/L
University of Ghana http://ugspace.ug.edu.gh

107
APPENDIX E
Detailed Results of Isotopes 2H and
18O for the Dry Season
Sample ID 2H
18O
KHD1(D) -9.44 -2.97
KHD2(D) -6.62 -3.38
KHD3A(D) -8.50 -3.35
KHD3B(D) -9.19 -3.20
KHD4(D) -9.15 -2.78
KHD5(D) -11.30 -2.75
KHD6(D) -7.55 -2.52
KHD7(D) -14.67 -3.38
KHD8(D) -7.74 -2.64
KHD9(D) -13.81 -3.51
KHD11(D) -9.98 -3.29
KBH1(D) -14.15 -4.01
KBH2(D) -12.09 -3.56
KBH3(D) -15.34 -3.89
KBH4(D) -5.28 -2.10
KBH6(D) -9.04 -2.64
KBH7(D) -12.99 -3.84
KBH8(D) -12.26 -3.30
KBH9(D) -19.23 -3.90
KBH10(D) -15.45 -3.58
KBH11(D) -14.89 -3.40
University of Ghana http://ugspace.ug.edu.gh

108
KBH12(D) -14.64 -3.49
KBH13(D) -14.35 -3.26
KBH14(D) -12.78 -3.15
KBH15(D) -10.33 -2.72
KBH16(D) -13.65 -3.14
KBH17(D) -18.16 -2.91
KBH19(D) -15.25 -3.76
STRI -10.29 -2.61
University of Ghana http://ugspace.ug.edu.gh

109
APPENDIX E (CONTINUED)
Detailed Results of Isotopes 2H and
18O for the Wet Season
Sample ID 2H
18O
KHD1 -14.15 -4.01
KHD2 -14.83 -3.14
KHD3A -13.32 -3.19
KHD3B -13.95 -2.91
KHD4 -11.56 -2.72
KHD5 -12.78 -2.94
KHD6 -16.09 -3.17
KHD7 -15.79 -3.40
KHD8 -7.04 -2.13
KHD9 -12.06 -3.30
KHD11 -12.75 -3.33
KBH1 -14.78 -3.86
KBH2 -12.81 -2.94
KBH3 -17.59 -3.48
KBH4 -14.24 -3.03
KBH5 -9.41 -2.40
KBH6 -12.23 -2.74
KBH7 -14.15 -3.36
KBH8 -12.50 -3.05
KBH9 -16.14 -3.47
KBH10 -11.48 -3.19
University of Ghana http://ugspace.ug.edu.gh

110
KBH11 -8.35 -2.21
KBH12(3:09) -14.50 -3.44
KBH13 -13.39 -3.50
KBH14 -11.58 -3.40
KBH15 -13.04 -2.59
KBH16 -15.41 -2.91
KBH17 -14.92 -3.18
KBH18 -15.93 -3.07
KBH19 -18.08 -3.64
STR 1 -14.30 -2.97
University of Ghana http://ugspace.ug.edu.gh

111
APPENDIX F
Ranges of Physicochemical Parameters of Hand Dug Well and Boreholes for the
Wet and Dry Seasons
Hand Dug Wells Boreholes
Wet Dry Wet Dry
Parameter
(mg/L)
Range Range Range Range WHO
Temp(ºC) 26.8-30.4 25-35.1 27.6-34.2 27.8-36.1
pH 5-7 5.2-8.1 3.1-8.3 4.5-10.5 6.5-8.5
TDS 258-627 112-761 120.5-888.8 137.6-1003 1000
Conductivity 517.1-1841 325-1522 239.5-1777 274-2010 1500
Salinity (%) 0.3-2.2 0.2-0.8 0.1-3.3 0.1-1 1.3
Alkalinity 13-140 14-96 0-124 0-80 200
T. hardness 26-280 28-192 0-248 0-160 500
Bicarbonate 15.85-
170.69
17.07-
117.04
0-151.18 0-97.53 380
Chloride 46.82- 67.98- 19.99- 35.99-335.9 250
University of Ghana http://ugspace.ug.edu.gh

112
194.57 247.92 359.89
Sulphate 14.29-64.94 17.64-98.09 8.67-136.39 8.55-154 500
Nitrate 0.56-90.55 0.37-88.23 0.15-68.02 0.19-62.02 50
Phosphate 0-0.19 0-0.11 0-2.4 0-0.31
Sodium 36.2-225.5 93.5-499 35.8-115.5 32.5-385 200
Potassium 2.7-20.9 3.9-18.3 2.7-35.6 3.6-38 30
Calcium 9.6-41.6 9.6-28.8 6.4-44.8 6.4-32 200
Magnesium 0.59-1.65 0.41-4.62 0.49-2.57 0.2-4.61 200
University of Ghana http://ugspace.ug.edu.gh

113
APPENDIX G
Ranges of Trace Metals of Hand Dug Well and Boreholes for the Wet and Dry
Seasons
Hand Dug Well Borehole
Wet Dry Wet Dry
Parameter
(mg/L)
Range Range Range Range WHO Limit
Iron 0.016-2.38 0.027-0.805 0.06-1.00 0.07-0.836 0.3
Copper 0-0.084 0.00 0-0.012 0.00 2.0
Manganese 0-0.72 0-0.072 0-0.76 0-0.072 0.5
Lead 0-0.032 0.00 0-0.04 0.00 0.010
Nickel 0.00 0.00 0.00 0.00
Cadmium 0-0.056 0-0.056 0-0.048 0-0.042 0.003
Zinc 0-0.052 0.00 0-0.00 0.00 3.0
University of Ghana http://ugspace.ug.edu.gh