Embed Size (px)
Citation preview

Assessment of NOy and True NO2 MeasurementsDenver CO, San Jose CA, & RTP NC
Tim Hanley, EPA – OAQPS National Ambient Air Monitoring Conference
August 10th, 2016
1

Locations with NOy and collocated NOy/NOx
NOY
• NOy is required at NCore and PAMS• 99 NOy monitors
Collocated NOy and NOx• 60 collocated stations
NO2 and NOx• 475 NO2 monitors• NO2 is required in areas over 1 million in
Population, plus near-road• most NO2 analyzers provide NOx• “True NO2” required at PAMS by July 1,
2019.• 22 Photolytic (NO, NO2, NOx) and 8 CAPS
(NO2 only) reported to AQS in 2015
Orange = Collocated NOy/NOxPurple = NOy
2

Key Features and Differences in Ambient NO/NO2/NOx/NOy Measurements
3
Method ChannelsDetection
Limit Key Features/issues
Chemiluminescence(chemical reaction that creates light) NOx
NONO2
NOx
5 ppb (conventional)50 ppt (trace level)
- Most widely used NO2 method- Thermal converter (315C) is used to convert NO2 to NO; detection of NO is made by its chemiluminescence reaction with an excess of O3.- NO is measured by bypassing the converter- Known to have interference with part of NOz
Chemiluminescence NOy
NONOy
50 ppt(tracelevel)
- Electronics run the same as a NOx; - Molybdenum converter externally located on 10 M
tower to minimize the surfaces available that can absorb reactive nitrogen.
- Converter is operated higher than NOx (350C)
Cavity Attenuated Phase Shift (CAPS) NO2
NO2 40 ppt- High sensitivity and highly specific measurement of
NO2 with negligible interference's.- Good experiences with ease of operation
Photolytic NOxNONO2
NOx100 ppt
- Utilizes photolytic LED to separate NO2 followed by chemiluminescence.
Typical NOx analyzer

4
NOy includes:
NOx = NO + NO2
NOy = NO + NO2 + NOzNOz = PAN + HNO3 + other
Interferences may include NH3, which can be minimized with good siting(e.g., away from agricultural feed lots)

Key Denver Colorado Monitoring Stations with active nitrogen
measurements
5
Welby Station 08-001-3001operates a Photolytic - chemiluminescence NOx monitor
LaCasa NCore Station 08-031-0026operates an NOy and CAPS NO2 (T500U)
CAMP Station 08-031-0002 operates a chemiluminescence NOx monitor
I-25 Near-Road Station 08-031-0027operates a chemiluminescence NOx monitor
Chemiluminescence NOx monitors provide measurement of: NO NO2
NOx
Direct NO2 Cavity Attenuated Phase Shift Spectroscopy (CAPS) provides a measurement of: NO2

In the 2014 – 2015 data set there are four ozone episodes where one or more sites in Denver CO has an 8-hour average above 0.070 ppm
6/17/15 6/18/15 6/19/15 6/20/15 6/21/15 6/22/15 6/23/15 6/24/15 6/25/15 6/26/15
0.054 0.054 0.067 0.069 0.080 0.051 0.074 0.056 0.064 0.054
0.053 0.052 0.061 0.067 0.077 0.049 0.067 0.055 0.063 0.052
6
7/28/15 7/29/15 7/30/15 7/31/15 8/1/15 8/2/15 8/3/15 8/4/15 8/5/15 8/6/15
0.05 0.06 0.064 0.061 0.071 0.061 0.043 0.049 0.057 0.043
0.047 0.054 0.059 0.053 0.066 0.057 0.04 0.045 0.05 0.037
8/16/15 8/17/15 8/18/15 8/19/15 8/20/15 8/21/15 8/22/15 8/23/15 8/24/15 8/25/15
0.061 0.051 0.053 0.049 0.072 0.066 0.055 0.063 0.058 0.0580.055 0.046 0.052 0.05 0.067 0.062 0.055 0.061 0.056 0.03
LaCasa StationCAMP Station
LaCasa StationCAMP Station
LaCasa StationCAMP Station

What do we see in the nitrogen measurements during an ozone episode?
What’s measured and what can we calculate?
LaCasa NCore Station - What’s measured and reported:• NO and NOy on one monitor.• Direct NO2 on CAPS
What can we calculate?• NOy – (NO + NO2) = Noz• In these data we see 9-10 ppb
of NOz on high ozone days.
7

8
What do we see in the nitrogen measurements during an ozone episode?
In these data we see 3-4 ppb of NOz on high ozone days.

What do the reported QC checks look like for the Denver NCore station compared to the rest of the country?
9
0
5
10
15
20
1 2 3 4 5 6 7 8 9 10 11 12 13 14 15 16 17 18 19 20 21 22 23 24 25 26 27 28 29 30 31 32 33 34 35 36 37 38
NOy CV Upper Bound2015 (for sites with at least 20 checks)
D
en
ver
NC
ore
= 2
.8%
n =
27
ch
eck
s in
20
15
2 sites above 20
0
5
10
15
20
1 2 3 4 5 6 7 8 9 10 11 12 13 14 15 16 17 18 19 20 21 22 23 24 25 26 27 28 29 30 31 32 33 34 35 36 37 38 39 40 41 42 43 44 45 46 47 48 49 50 51 52 53 54 55 56 57 58 59 60 61 62 63 64 65 66 67 68 69 70 71 72 73 74 75 76 77 78 79 80 81 82 83 84
NO CV Upper Bound2015 (for sites with at least 20 QC checks)
1 site above 20

10
0
2
4
6
8
10
12
14
16
18
20
1 4 7 10 13 16 19 22 25 28 31 34 37 40 43 46 49 52 55 58 61 64 67 70 73 76 79 82 85 88 91 94 97 100103106109112115118121124127130133136139142145148151154157160163166169172175178181184187190193196
NO2 CV Upper Bound2015 (for sites with at least 20 QC checks)
D
en
ver
NC
ore
= 5
.1%
n =
27
ch
eck
s in
20
15

11
In 2014-2015 data set, there are several cases where one or more Denver area PM2.5 sites are above 35 µg/m3.
What if we look at PM2.5 in Denver?

12
What do we see in the Denver NOz data during these PM2.5 episodes?October 2014
In these data we see ~15 ppb of NOz on the highest PM2.5 day.

13
Denver NOz data during PM2.5 episode in March 2015
In these data we see ~15 ppb of NOz on the highest PM2.5 day; NOz drops back down to near 0 when PM2.5 drops to <10 ug/m3
14
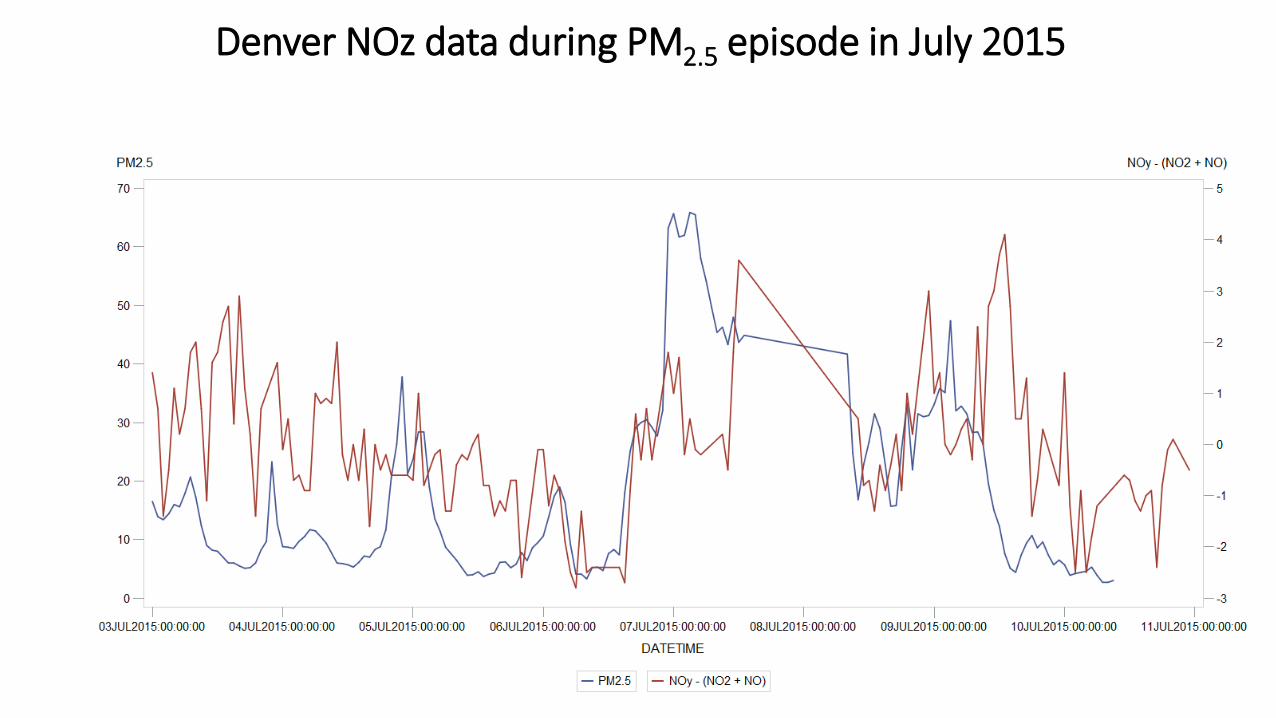
Denver NOz data during PM2.5 episode in July 2015
In these data we see ~3-4 ppb of NOz on the highest PM2.5 days.
15
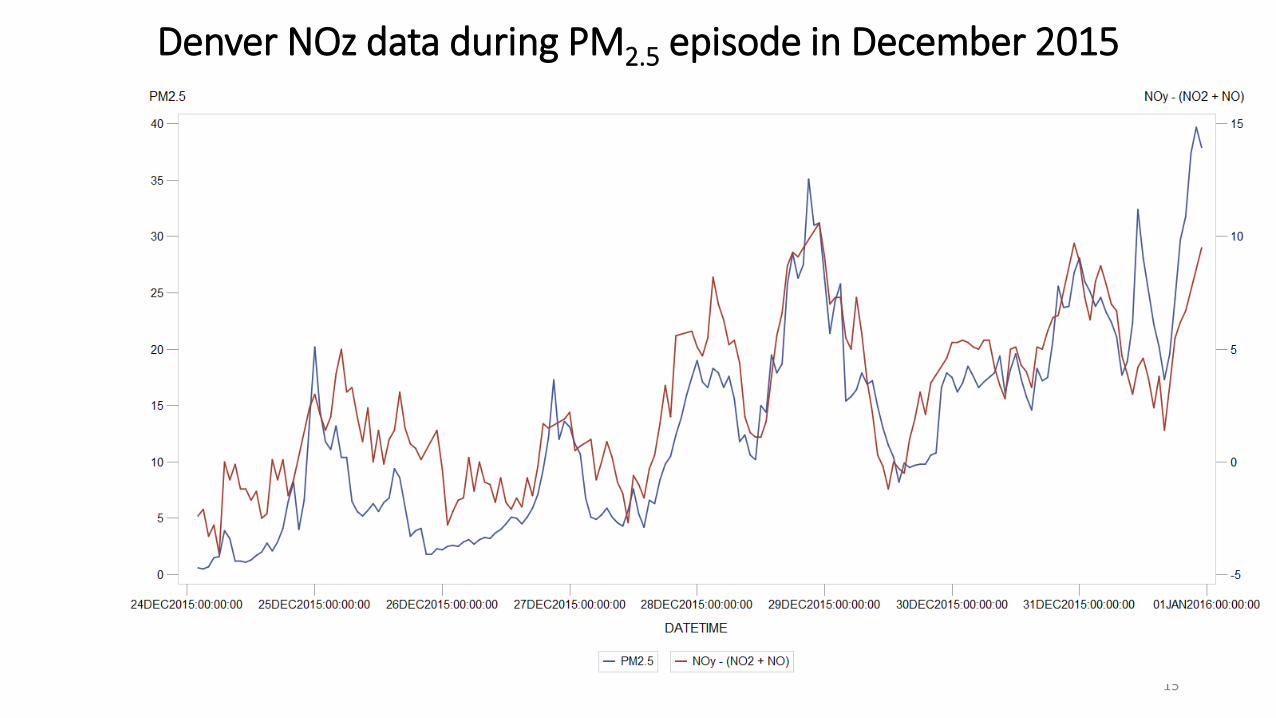
Denver NOz data during PM2.5 episode in December 2015
In these data we see ~10 ppb of NOz on the highest PM2.5 days.
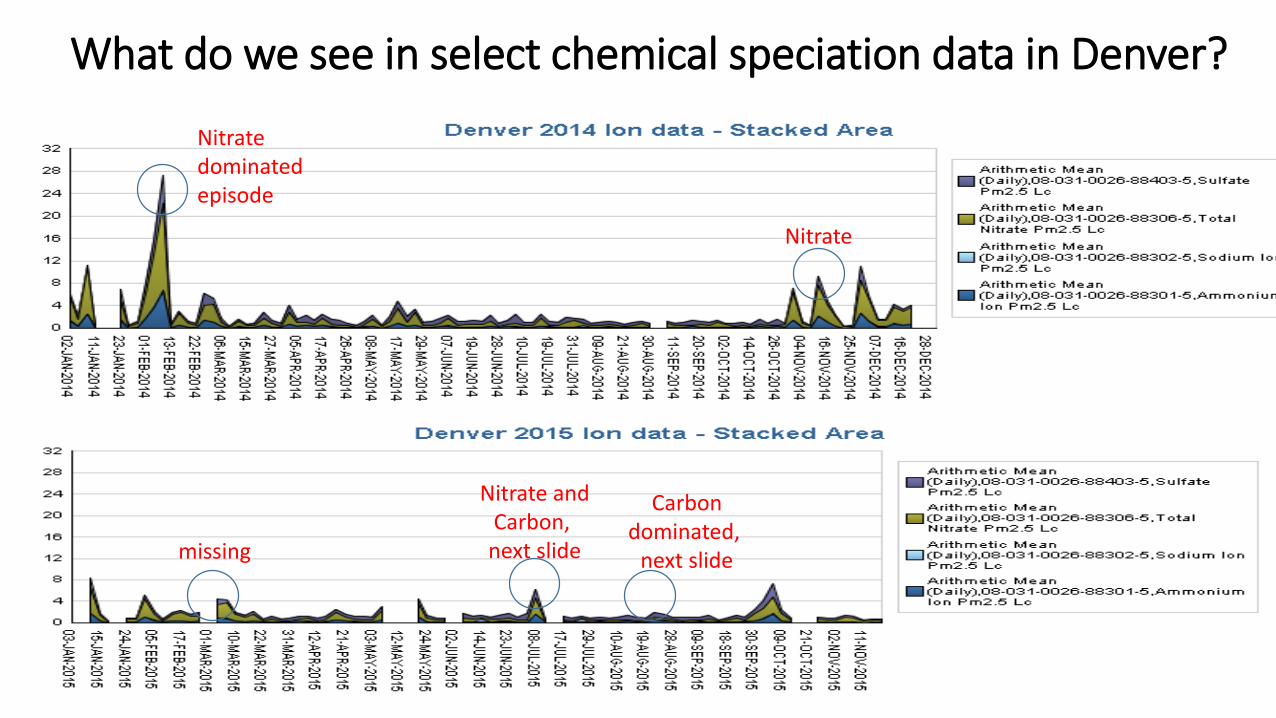
What do we see in select chemical speciation data in Denver?
16
Nitratedominatedepisode
Nitrate
missing
Carbondominated,
next slide
Nitrate andCarbon,
next slide

What do we see in select chemical speciation data in Denver?
17
EC in light blueOC in dark blue
Nitratedominatedepisode
missing
Carbondominatedepisode
Nitrate andCarbon
More nitrate dominated

What do we see in the nitrogen measurements during an episode in San Jose CA?
• What’s measured and what can we calculate?What’s measured and reported:
• NO and NOy on one monitor.
• NO, NO2, and NOx on a second monitor.
What can we calculate?• NOy – NOx = NOz
• (NOy – NO) – (NOx – NO) = NOz (normalized for each NO channel)
18
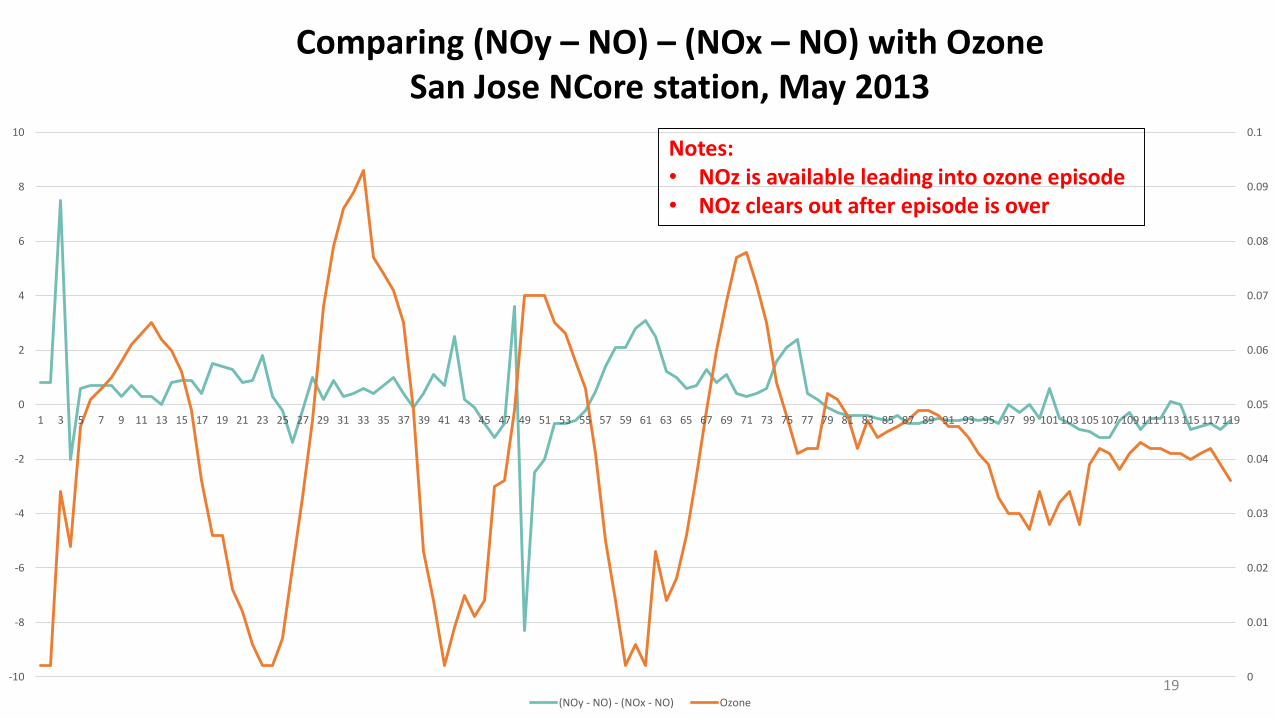
Comparing (NOy – NO) – (NOx – NO) with OzoneSan Jose NCore station, May 2013
190
0.01
0.02
0.03
0.04
0.05
0.06
0.07
0.08
0.09
0.1
-10
-8
-6
-4
-2
0
2
4
6
8
10
1 3 5 7 9 11 13 15 17 19 21 23 25 27 29 31 33 35 37 39 41 43 45 47 49 51 53 55 57 59 61 63 65 67 69 71 73 75 77 79 81 83 85 87 89 91 93 95 97 99 101 103 105 107 109 111 113 115 117 119
(NOy - NO) - (NOx - NO) Ozone
Notes:• NOz is available leading into ozone episode • NOz clears out after episode is over

0
10
20
30
40
50
60
70
80
-4
-3
-2
-1
0
1
2
3
4
5
6
1
20
39
58
77
96
11
5
13
4
15
3
17
2
19
1
21
0
22
9
24
8
26
7
28
6
30
5
32
4
34
3
36
2
38
1
40
0
41
9
43
8
45
7
47
6
49
5
51
4
53
3
55
2
57
1
59
0
60
9
62
8
64
7
66
6
68
5
70
4
72
3
74
2
76
1
78
0
79
9
81
8
83
7
85
6
87
5
89
4
91
3
93
2
95
1
97
0
98
9
10
08
10
27
10
46
10
65
10
84
11
03
11
22
11
41
11
60
11
79
11
98
12
17
12
36
12
55
12
74
12
93
13
12
13
31
13
50
13
69
13
88
14
07
14
26
14
45
Trend of difference between NOy and NOx compared to PM2.5 (24 hour rolling averages)San Jose NCore Station 11/20/2013 to 1/28/2014
Rolling 24 Hour NOy - NOx Rolling 24 hour PM2.5 20
In these data we see ~4 ppb of NOz on the highest PM2.5 day. However, we are likely not measuring all of the NOz.

21
Comparing ions and Carbon to Mass in CSN
22
-1
-0.5
0
0.5
1
1.5
2
2.5
3
3.5
4
0
10
20
30
40
50
60
70
80
90
8/1
4/2
01
5 1
2:0
0 A
M
8/1
4/2
01
5 3
:00
AM
8/1
4/2
01
5 6
:00
AM
8/1
4/2
01
5 9
:00
AM
8/1
4/2
01
5 1
2:0
0 P
M
8/1
4/2
01
5 3
:00
PM
8/1
4/2
01
5 6
:00
PM
8/1
4/2
01
5 9
:00
PM
8/1
5/2
01
5 1
2:0
0 A
M
8/1
5/2
01
5 3
:00
AM
8/1
5/2
01
5 6
:00
AM
8/1
5/2
01
5 9
:00
AM
8/1
5/2
01
5 1
2:0
0 P
M
8/1
5/2
01
5 3
:00
PM
8/1
5/2
01
5 6
:00
PM
8/1
5/2
01
5 9
:00
PM
8/1
6/2
01
5 1
2:0
0 A
M
8/1
6/2
01
5 3
:00
AM
8/1
6/2
01
5 6
:00
AM
8/1
6/2
01
5 9
:00
AM
8/1
6/2
01
5 1
2:0
0 P
M
8/1
6/2
01
5 3
:00
PM
8/1
6/2
01
5 6
:00
PM
8/1
6/2
01
5 9
:00
PM
8/1
7/2
01
5 1
2:0
0 A
M
8/1
7/2
01
5 3
:00
AM
8/1
7/2
01
5 6
:00
AM
8/1
7/2
01
5 9
:00
AM
8/1
7/2
01
5 1
2:0
0 P
M
8/1
7/2
01
5 3
:00
PM
8/1
7/2
01
5 6
:00
PM
8/1
7/2
01
5 9
:00
PM
8/1
8/2
01
5 1
2:0
0 A
M
8/1
8/2
01
5 3
:00
AM
8/1
8/2
01
5 6
:00
AM
8/1
8/2
01
5 9
:00
AM
8/1
8/2
01
5 1
2:0
0 P
M
8/1
8/2
01
5 3
:00
PM
8/1
8/2
01
5 6
:00
PM
8/1
8/2
01
5 9
:00
PM
8/1
9/2
01
5 1
2:0
0 A
M
8/1
9/2
01
5 3
:00
AM
8/1
9/2
01
5 6
:00
AM
8/1
9/2
01
5 9
:00
AM
8/1
9/2
01
5 1
2:0
0 P
M
8/1
9/2
01
5 3
:00
PM
8/1
9/2
01
5 6
:00
PM
8/1
9/2
01
5 9
:00
PM
8/2
0/2
01
5 1
2:0
0 A
M
8/2
0/2
01
5 3
:00
AM
8/2
0/2
01
5 6
:00
AM
8/2
0/2
01
5 9
:00
AM
8/2
0/2
01
5 1
2:0
0 P
M
8/2
0/2
01
5 3
:00
PM
8/2
0/2
01
5 6
:00
PM
8/2
0/2
01
5 9
:00
PM
8/2
1/2
01
5 1
2:0
0 A
M
8/2
1/2
01
5 3
:00
AM
8/2
1/2
01
5 6
:00
AM
8/2
1/2
01
5 9
:00
AM
8/2
1/2
01
5 1
2:0
0 P
M
8/2
1/2
01
5 3
:00
PM
8/2
1/2
01
5 6
:00
PM
8/2
1/2
01
5 9
:00
PM
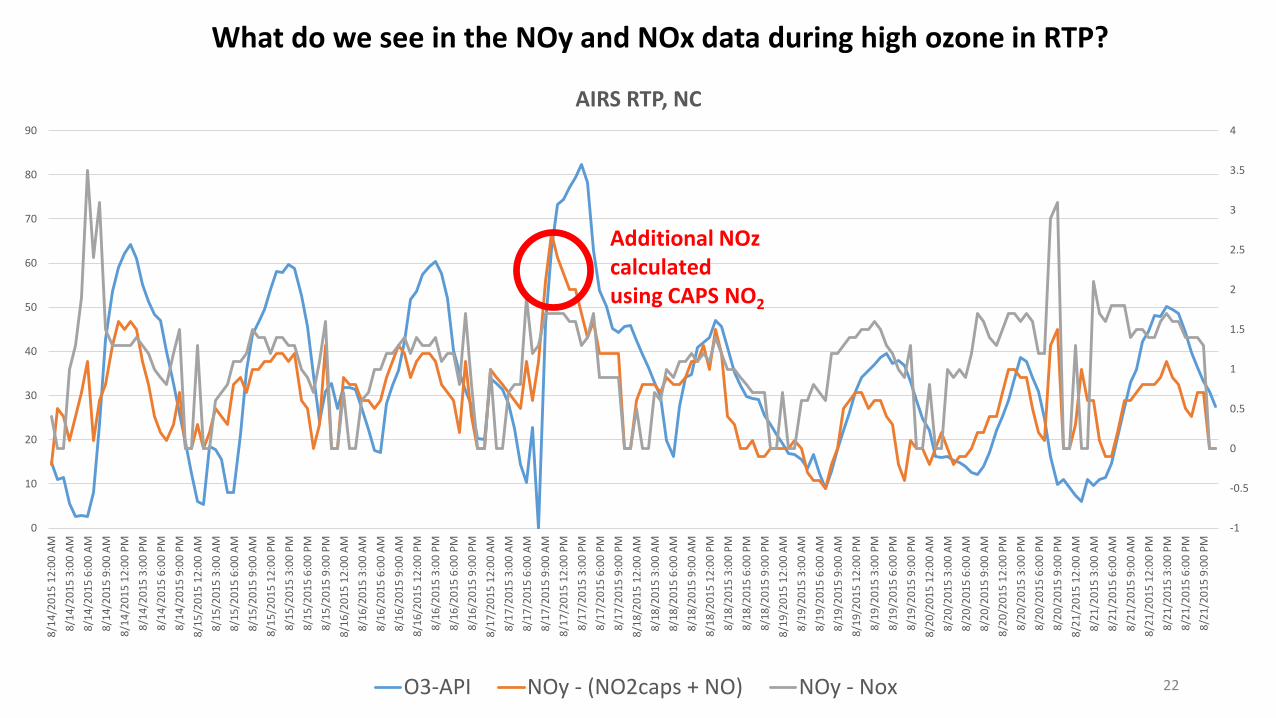
AIRS RTP, NC
O3-API NOy - (NO2caps + NO) NOy - Nox
Additional NOzcalculated using CAPS NO2
What do we see in the NOy and NOx data during high ozone in RTP?

-10
-8
-6
-4
-2
0
2
4
-10
-5
0
5
10
15
20
25
30
35
6/2
7/2
01
5 1
2:0
0 A
M
6/2
7/2
01
5 6
:00
AM
6/2
7/2
01
5 1
2:0
0 P
M
6/2
7/2
01
5 6
:00
PM
6/2
8/2
01
5 2
:00
AM
6/2
8/2
01
5 8
:00
AM
6/2
8/2
01
5 2
:00
PM
6/2
8/2
01
5 8
:00
PM
6/2
9/2
01
5 4
:00
AM
6/2
9/2
01
5 1
0:0
0 A
M
6/2
9/2
01
5 4
:00
PM
6/3
0/2
01
5 1
2:0
0 A
M
6/3
0/2
01
5 6
:00
AM
6/3
0/2
01
5 1
2:0
0 P
M
6/3
0/2
01
5 6
:00
PM
7/1
/20
15
2:0
0 A
M
7/1
/20
15
8:0
0 A
M
7/1
/20
15
2:0
0 P
M
7/1
/20
15
8:0
0 P
M
7/2
/20
15
4:0
0 A
M
7/2
/20
15
10
:00
AM
7/2
/20
15
4:0
0 P
M
7/3
/20
15
12
:00
AM
7/3
/20
15
6:0
0 A
M
7/3
/20
15
12
:00
PM
7/3
/20
15
6:0
0 P
M
7/4
/20
15
2:0
0 A
M
7/4
/20
15
8:0
0 A
M
7/4
/20
15
2:0
0 P
M
7/4
/20
15
8:0
0 P
M
7/5
/20
15
4:0
0 A
M
7/5
/20
15
10
:00
AM
7/5
/20
15
4:0
0 P
M
7/6
/20
15
12
:00
AM
7/6
/20
15
6:0
0 A
M
7/6
/20
15
12
:00
PM
7/6
/20
15
6:0
0 P
M
7/7
/20
15
2:0
0 A
M
7/7
/20
15
8:0
0 A
M
7/7
/20
15
2:0
0 P
M
7/7
/20
15
8:0
0 P
M
7/8
/20
15
4:0
0 A
M
7/8
/20
15
12
:00
PM
7/8
/20
15
6:0
0 P
M
7/9
/20
15
2:0
0 A
M
7/9
/20
15
8:0
0 A
M
7/9
/20
15
2:0
0 P
M
7/9
/20
15
8:0
0 P
M
7/1
0/2
01
5 4
:00
AM
7/1
0/2
01
5 1
0:0
0 A
M
7/1
0/2
01
5 4
:00
PM
7/1
1/2
01
5 1
2:0
0 A
M
7/1
1/2
01
5 6
:00
AM
7/1
1/2
01
5 1
2:0
0 P
M
7/1
1/2
01
5 6
:00
PM
7/1
2/2
01
5 2
:00
AM
7/1
2/2
01
5 8
:00
AM
7/1
2/2
01
5 2
:00
PM
7/1
2/2
01
5 8
:00
PM
7/1
3/2
01
5 4
:00
AM
7/1
3/2
01
5 1
0:0
0 A
M
7/1
3/2
01
5 4
:00
PM
7/1
4/2
01
5 1
2:0
0 A
M
7/1
4/2
01
5 6
:00
AM
7/1
4/2
01
5 1
2:0
0 P
M
7/1
4/2
01
5 6
:00
PM
7/1
5/2
01
5 2
:00
AM
7/1
5/2
01
5 8
:00
AM
7/1
5/2
01
5 2
:00
PM
7/1
5/2
01
5 8
:00
PM
AIRS RTP NC - PM2.5, Sunset Carbon, and NOz
GRIMM (ug/m3) PM2.5 (ug/m3L) Sunsert TC (ug/m3) NOy - (CAPS NO2 + NO)23
What do we see in the NOy and NOx data during high PM2.5 in RTP?
In early July we have high PM2.5; however, NOz does not appear to correspond to the high PM2.5, but carbon measured by the Sunset does.
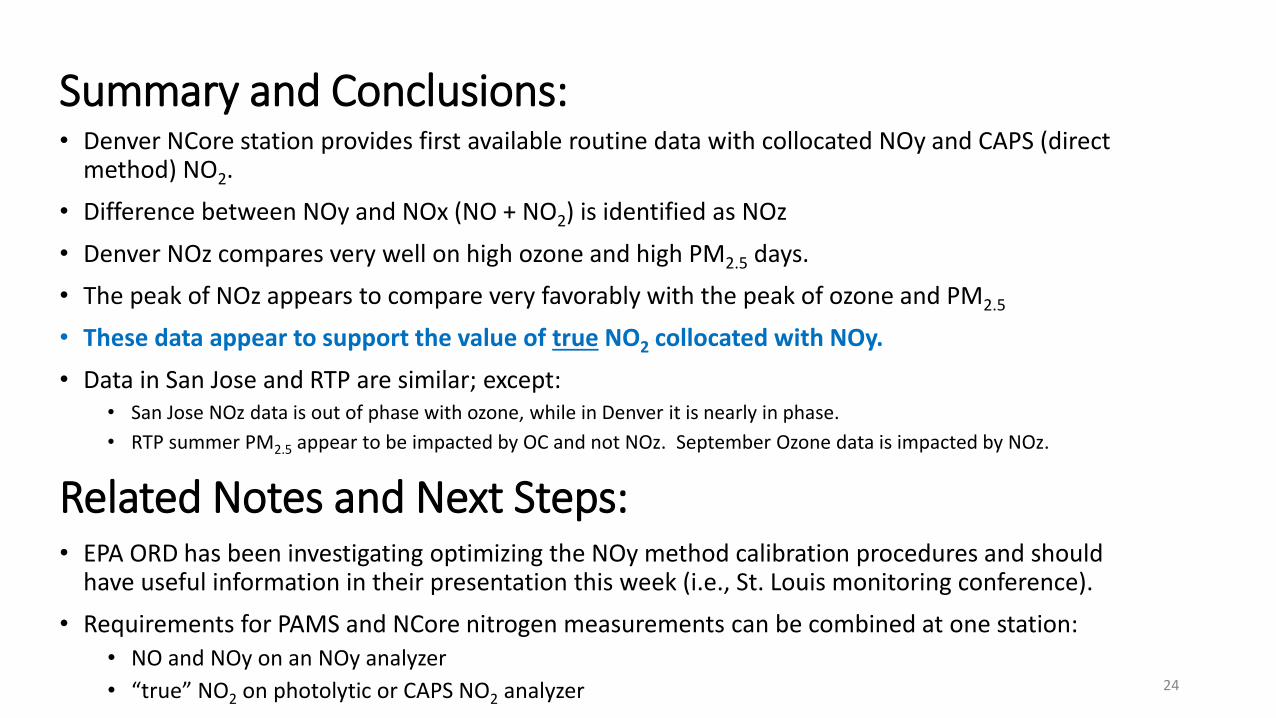
Summary and Conclusions:• Denver NCore station provides first available routine data with collocated NOy and CAPS (direct
method) NO2.
• Difference between NOy and NOx (NO + NO2) is identified as NOz
• Denver NOz compares very well on high ozone and high PM2.5 days.
• The peak of NOz appears to compare very favorably with the peak of ozone and PM2.5
• These data appear to support the value of true NO2 collocated with NOy.
• Data in San Jose and RTP are similar; except:• San Jose NOz data is out of phase with ozone, while in Denver it is nearly in phase.
• RTP summer PM2.5 appear to be impacted by OC and not NOz. September Ozone data is impacted by NOz.
24
Related Notes and Next Steps:• EPA ORD has been investigating optimizing the NOy method calibration procedures and should
have useful information in their presentation this week (i.e., St. Louis monitoring conference).
• Requirements for PAMS and NCore nitrogen measurements can be combined at one station:• NO and NOy on an NOy analyzer
• “true” NO2 on photolytic or CAPS NO2 analyzer


![Measurements of NOy and HNO at a Rural-Forested Site in ...nadp.slh.wisc.edu/conf/2016/pptpdf/174_edgerton.pdf · [ppb] CV (%) n (hours) mean [ppb] CV (%) n (hours) % HNO 3 Su15 0.592](https://img.pdfslide.us/doc/110x75/5fc9ab11558bbe204902d7fc/measurements-of-noy-and-hno-at-a-rural-forested-site-in-nadpslhwisceduconf2016pptpdf174.jpg)