Embed Size (px)
Citation preview

Assessment of neuroretinal function in a group of functionalamblyopes with documented LGN deficitsBrian Brown1, Beatrix Feigl1,2, Glen A Gole3, Kathy Mullen4 and Robert F Hess4
1Institute of Health and Biomedical Innovation, Queensland University of Technology, Brisbane, Australia, 2Queensland Eye Institute, Brisbane,
Australia, 3The Wesley Hospital Research Institute and The Discipline of Paediatrics and Child Health, University of Queensland, Brisbane, Australia,
and 4McGill Vision Research, Department of Ophthalmology, McGill University, Montreal, Canada
Citation information: Brown B, Feigl B, Gole GA, Mullen K & Hess RF. Assessment of neuroretinal function in a group of functional amblyopes with
documented LGN deficits. Ophthalmic Physiol Opt 2013, 33, 138–149. doi: 10.1111/opo.12024
Keywords: amblyopia, multifocal
electroretinogram, lateral geniculate nucleus,
functional MRI, optical coherence tomography,
fixation stability
Correspondence: Brian Brown
E-mail address: [email protected]
Received: 8 June 2012; Accepted: 23
December 2012
Abstract
Purpose: In this study we examine neuroretinal function in five amblyopes, who
had been shown in previous functional MRI (fMRI) studies to have compromised
function of the lateral geniculate nucleus (LGN), to determine if the fMRI deficit
in amblyopia may have its origin at the retinal level.
Methods: We used slow flash multifocal ERG (mfERG) and compared averaged
five ring responses of the amblyopic and fellow eyes across a 35 deg field. Central
responses were also assessed over a field which was about 6.3 deg in diameter. We
measured central retinal thickness using optical coherence tomography. Central
fields were measured using the MP1-Microperimeter which also assesses ocular
fixation during perimetry. MfERG data were compared with fMRI results from a
previous study.
Results: Amblyopic eyes had reduced response density amplitudes (first major
negative to first positive (N1-P1) responses) for the central and paracentral ret-
ina (up to 18 deg diameter) but not for the mid-periphery (from 18 to
35 deg). Retinal thickness was within normal limits for all eyes, and not differ-
ent between amblyopic and fellow eyes. Fixation was maintained within the
central 4° more than 80% of the time by four of the five participants; fixation
assessed using bivariate contour ellipse areas (BCEA) gave rankings similar to
those of the MP-1 system. There was no significant relationship between BCEA
and mfERG response for either amblyopic or fellow eye. There was no signifi-
cant relationship between the central mfERG eye response difference and the
selective blood oxygen level dependent (BOLD) LGN eye response difference
previously seen in these participants.
Conclusions: Retinal responses in amblyopes can be reduced within the central
field without an obvious anatomical basis. Additionally, this retinal deficit may
not be the reason why the LGN BOLD (blood oxygen level dependent) responses
are reduced for amblyopic eye stimulation.
Introduction
Amblyopia is a developmental disorder of the visual system
resulting in reduced visual acuity and reduced contrast sen-
sitivity in one eye, as well as a range of accompanying con-
ditions including fixation and eye movement disorders,1
disorders of spatial coding,2 contrast sensitivity,3,4 position
coding5–7 and global sensitivity.8–11 It is accompanied by
disruption of binocular vision and stereopsis.
There is an extensive literature in primate and non-pri-
mate models that suggests that the major deficit in experi-
mental amblyopia, whether surgically induced, optically
induced or induced by deprivation, is at the cortical level.
Much available evidence supports the notion that the
Ophthalmic & Physiological Optics 33 (2013) 138–149 © 2013 The College of Optometrists138
Ophthalmic & Physiological Optics ISSN 0275-5408

retina12–16 and LGN17–19 are not affected. The primary site
of the deficit in amblyopia was thought to be cortical,20,21
however the LGN has long been known to exhibit structural
deficits specific to the deprived eye input in animals22–24 and
a number of studies have also questioned the structural
integrity of the LGN in humans with amblyopia.25–27
In two related studies, Hess and colleagues have provided
fMRI evidence of an LGN deficit to broadband stimuli
(achromatic/chromatic; spatial/temporal)28 as well as a
selective deficit to red/green chromatic stimulation, impli-
cating the parvocellular layers that receive input from the
amblyopic eye.29 These findings in humans receive support
from some previous animal studies.18,30–33
In these fMRI studies by Hess and colleagues the broad-
band stimulus contained luminance, contrast and colour
modulation and a broad spatial frequency spectrum, while
the narrowband stimulation was a spatio-temporal sinusoi-
dal stimulus containing just chromatic red/green, blue/yel-
low or achromatic contrast modulation. Since the fMRI
responses reflect synaptic and inter-cellular activity within
the LGN, any differences between the responses to fellow
versus amblyopic eye stimulation could merely be a conse-
quence of reduced input from the amblyopic eye due to a
primary anomaly at the retinal level. To address this issue
we assessed the structural and functional integrity of the
inner retina of the amblyopic eye in the same participants
who have been shown to have anomalous geniculate func-
tion. Retinal structure was assessed using optical coherence
tomography (OCT). The functional assessment was
obtained using microperimetry and the multifocal electro-
retinogram (mfERG).34 In particular, we used a slowed
stimulation version of this technique which is known to
bias responses to cells in the inner retina.35–37
In this paper we examine OCT and mfERG data
(response density amplitudes) to determine if there is a
structural retinal deficit and additionally we compare
mfERG data with previously obtained fMRI data28,29 (aver-
age%BOLD response) to assess the possible functional reti-
nal contribution to the reduced fMRI responses.
Methods
Participants
We tested five of the seven amblyopes who had participated
in the previous fMRI studies conducted by Hess et al.28,29
Three had strabismic amblyopia, one had anisometropic
amblyopia, and one was amblyopic because of a combina-
tion of visual deprivation and strabismus. All were adults
(aged 35–67 years) and had amblyopia of many years
standing. The clinical characteristics of these participants
are shown in Table 1.
The multifocal electroretinogram
The multifocal electroretinogram (mfERG) (VERIS 5.1,
www.veris-edi.com) was recorded monocularly for each eye
using DTL-electrodes with the unrecorded eye occluded.
The reference electrode was at the outer canthus of the
recorded eye and the ground electrode at the central fore-
head. Participants were corrected for the test distance using
the EDI eye monitor/refraction unit. Pupils were dilated
(Tropicamide 0.5%, www.alcon.com) and recordings were
made under ambient room light conditions. The visual
stimulus consisted of 103 scaled hexagons displayed on a
high luminance 7 inch monitor and subtended approxi-
mately 35 deg 9 30 deg in extent. A two degree fixation
cross was provided at the centre of the display. Fixation
was also aided by the stable outline of the whole mfERG
target, and the fact that the participants were asked to fixate
the centre of this array (Figure 1, left panel). They were fur-
ther assisted in their fixation by the edges of the CRT
screen. Fixation had only to be held steady for about 25 s at
a time because of the nature of the mfERG task (see below).
Retinal signals were band pass filtered (10–300 Hz), sam-
pled every 0.83 ms and amplified (50,0009, Grass P5
amplifier (www.grass-telefactor.com)). A camera allowed
viewing of the eye under test during signal acquisition, and
the ERG signal was monitored for fixation artifacts, which
could have contaminated the data. Segments that were
Table 1. Subject characteristics (Modified from Table 128)
Subject/Type Age Eye Refraction (D) Acuity Alignment History
DL/deprivation 37 R +8.25/�1.00 9 90 ET Surgery for RET aet 9y (92)
L +0.25 6/6
CF/strabismic 43 R �2.75 6/6 Surgery for LET in infancy and at aet 25y
L �3.00 6/240 LXT,LhypoT
SH/anisometropic 35 R +7.00/�3.00 9 150 6/30 Ortho First Rx aet 19y
L +2.50/�1.25 9 80 6/4.5
BB/strabismic 67 R +0.50/�0.50 9 160 6/5 Surgery aet 7y, for large angle LET
L +1.00/�0.25 9 180 6/600 LET
JL/strabismic 51 R +0.75 6/5 Patching, aet 2 y Surgery aet 5y
L +0.75 6/48 LET
CF, counts fingers; RET, right esotropia; LET, left esotropia; LXT, left exotropia; LhypoT, left hypotropia.
Ophthalmic & Physiological Optics 33 (2013) 138–149 © 2013 The College of Optometrists 139
B Brown et al. mfERG in amblyopes with LGN deficits

contaminated with blinks, small eye movements or artefacts
were rejected and re-recorded.
All participants were tested with the slow flash mfERG;
hexagons (ranging in size from about 3.2 to 5 deg in hori-
zontal extent) flickered according to a pseudorandom bin-
ary m-sequence, and three blank frames were inserted
between steps of the pseudorandom sequence (Figure 1).
Each step in the binary m-sequence (213-1 steps in length)
was four frames long. In the first frame, each hexagonal
patch had a 50% probability of being white (200 cd m�2)
or black (3 cd m�2) and the next three frames remained
dark grey (mean luminance 26 cd m�2). The slow flash
response is generated predominantly by ON and OFF bipo-
lar cells, but reflects less temporal nonlinear processing
than the conventional fast flicker mfERG due to slowing of
the stimulation sequence.37
Recordings were divided into 16 segments which over-
lapped slightly in time and the stimulus sequence in the
overlapped section was repeated; the repeated sections of
the record were excised by the VERIS software so that one
continuous record was available for analysis. Participants
were given breaks of 5–10 s between segments, resulting in
a total recording time of about 7 min per eye. Whether am-
blyopic or fellow eye was tested first was chosen randomly.
Participants used the inbuilt refraction unit of the VERIS
system to perform their own refraction and adjust the focus
of the target hexagons when presented as a static display
(Figure 1, left panel). This task is easily accomplished, even
by severe amblyopes, as the distinction between sharp and
blurred high contrast images does not form part of the defi-
cit in amblyopia. The inbuilt refractor has no scale for
assessing refraction (see Discussion for further consider-
ation of refraction and amblyopia).
Optical coherence tomography
Retinal thickness was assessed using the Cirrus Optical
Coherence Tomography system (www.meditec.zeiss.com).
The Macular cube 512 9 128-scan pattern was chosen. The
caliper was moved across the retina to ensure that it was
centred on the foveal pit when fixation was not central in
the amblyopic eye.
Microperimetry and fixation assessment
Microperimetry and fixation assessment were performed
using the MP-1 Microperimeter (www.nidek-intl.com/
products/diagnosis/mp-1.html). In addition to a threshold
assessment of sensitivity for 6 min of arc targets in the cen-
tral retina, this system gives an assessment of fixation stabil-
ity. The system gathers real-time fundus images at 25 Hz.
Retinal autotracking was performed by selecting a region
of interest (for example a particular vessel or vessel junc-
tion), and the stimuli are referenced to this point in the
image. Movements of this point are monitored with respect
to the internal reference frame of the instrument to provide
an index of fixation.
To assess central field sensitivity, we used the Humphrey
10-2 program of the MP-1 system with a grid of 68 stimuli
and a Goldmann V stimulus size to cover the central 20
degrees (diameter) of the field. Thresholds were estimated
with a 4-2 double staircase strategy.38 The white back-
ground was 1.27 cd.m�2 (four asb) and the stimulus lumi-
nance ranged from its highest level (0 dB attenuation,
127 cd.m�2) to lowest level (20 dB attenuation, 2.54 cd.
m�2). Stimulus presentation duration was 200 ms.
All participants in the study gavewritten informedconsent;
the tenets of theDeclaration ofHelsinki and the requirements
of the University Human Research Ethics Committee of the
QueenslandUniversity of Technologywere followed. Partici-
pants were advised of their right towithdraw from any proce-
duresatany timewithoutprejudice.
Data analysis
Retinal thickness values were assessed according to the nine
subfields defined by the Early Treatment Diabetic Retinop-
athy Study.39 These are a central region 1 mm in diameter,
and concentric circles, 3 mm and 6 mm in diameter. The
inner and outer concentric circles contain four regions
each, thus making nine subfields in all.
The Nidek Microperimeter gives a continuous assess-
ment of eye position during the test, and provides statistics
on the two-dimensional distribution of eye position. This is
translated to ‘time within a specific region’, and these data
Figure 1. Sequence of four frames in the slow flash mfERG paradigm. Frames are presented at 75 Hz (13.3 ms intervals).
Ophthalmic & Physiological Optics 33 (2013) 138–149 © 2013 The College of Optometrists140
mfERG in amblyopes with LGN deficits B Brown et al.

are presented; the device can also output a file of fixation
positions at the time of detection of perimetry targets.
These have been converted to ‘bivariate contour ellipse
areas’40 (BCEA) describing fixation for four of five partici-
pants.
The mfERG data were averaged into five concentric rings
and trough to peak N1-P1 response densities and P1 impli-
cit times were measured. Data were compared by two way
ANOVA with eye (fellow/amblyopic) and ring (eccentricity)
as factors.
Pearson correlation coefficients were calculated between
the BOLD fMRI responses and the mfERG responses for
the same participants. All comparisons have been made in
terms of right/left eye differences. We computed average
BOLD activation (%BOLD change in the averaged haemo-
dynamic response function) for each eye and mfERG
response (response density amplitudes) averaged across the
stimulus field for each eye. For the narrowband stimulus,
we used the BOLD average responses to luminance, red/
green, and blue/yellow stimuli for each eye and compared
this to the central/peripheral mfERG difference (a measure
of the foveal specificity of the deficit). This was derived by
differencing the central and peripheral mfERG responses
(i.e. central mfERG-peripheral mfERG for the 9.5° radius)and these measures were compared between eyes. Since the
BOLD average response reflects blood flow changes as a
result of increased metabolic activity it is biased towards
field potential changes resulting from the summed intra-
cellular potential changes within the LGN, which include
synaptic activity; any differences between the responses to
fixing versus amblyopic eye stimulation could be a conse-
quence of reduced input from the amblyopic eye due to a
primary anomaly at the retinal level. In such a case one
would expect the reduced responsivity of LGN, as mea-
sured with fMRI to correlate with reduced responsivity of
the retina, as measured with mfERGs across our partici-
pants.
Results
OCT findings
There were no consistent differences in central retinal
thickness measures between participants; the average differ-
ence in central retinal thickness was 9l, with the amblyopic
eye having greater thickness but this was made up of values
ranging from +14 to �30l.There was no significant difference in retinal thickness in
the subfields between the two eyes of any of the participants
(one-way ANOVA; p > 0.05). The near circumfoveal subre-
gion (fields 2–5) was, on average, thicker than the more
peripheral (fields 6–9) by about 40 lm for both amblyopic
and fellow eyes (one-way ANOVA p < 0.0001) (Figure 2).
Figure 2. Retinal thickness for OCT measures for amblyopic and fellow eyes. They are compared with those of Hagen et al.41 for the nine central
fields as defined by the Early Treatment Diabetic Retinopathy Study Research Group39 (see inset at top left). Error bars show one S.D.
Ophthalmic & Physiological Optics 33 (2013) 138–149 © 2013 The College of Optometrists 141
B Brown et al. mfERG in amblyopes with LGN deficits

The variation seen in Figure 2 is within the variability of
the Cirrus OCT system.41 Central thicknesses (Field 1 in
Figure 2) are higher than averages reported by Hagen
et al.41 but within their 95% confidence limits.
mfERG results
Central neuroretinal responses were depressed for the
amblyopic eye of participant BB as shown in Figure 3;
peripheral neuroretinal responses were comparatively large
in the temporal periphery. Similar differences in central
response and asymmetries in response were seen in the
remaining participants. Amblyopic eyes in general showed
reduced N1-P1 response densities in the central retina,
although average peripheral responses were similar in
amplitude to those of fellow eyes.
Concentric ring averages are illustrated for one partici-
pant in Figure 4. The ring averages (schematic shown cen-
trally), for the amblyopic and fellow eye of participant BB
are shown on the left, and the right, respectively. The N1-
P1 response densities decrease with increasing eccentricity.
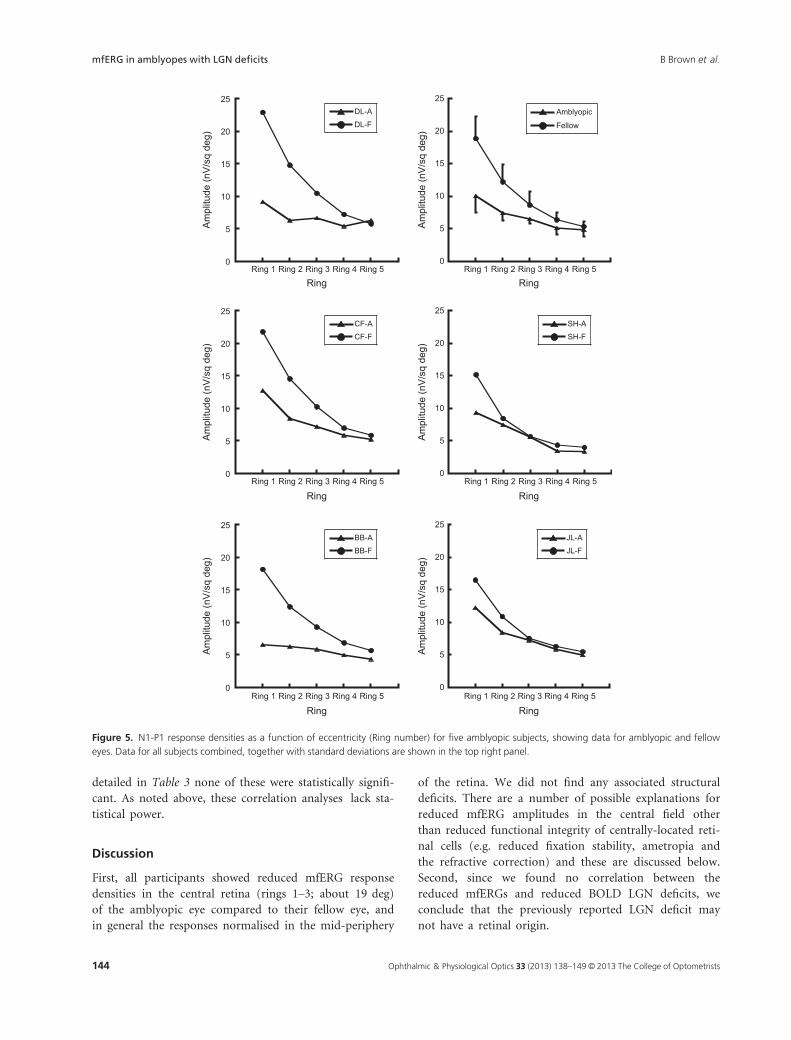
All of the participants showed reduced central mfERG
N1-P1 response densities in the amblyopic eye, compared
to the fellow eye; there were, on average, significant reduc-
tions in response densities for rings 1, 2 and 3 (one way
ANOVA: p < 0.001; p < 0.001; p = 0.06) (Figure 5).
Response densities decreased with eccentricity but there
was variability in the response profile and an interaction
between eye and eccentricity (Figure 5) (two way ANOVA;
p < 0.001), indicating differential effects of eccentricity
on responses for the amblyopic and fellow eyes. Fellow
eyes had greater central N1-P1 responses than amblyopic
eyes, but in the periphery the averaged responses of the
eyes were essentially the same. This can most clearly be
seen in the responses of participants DL, CF and BB in
Figure 5.
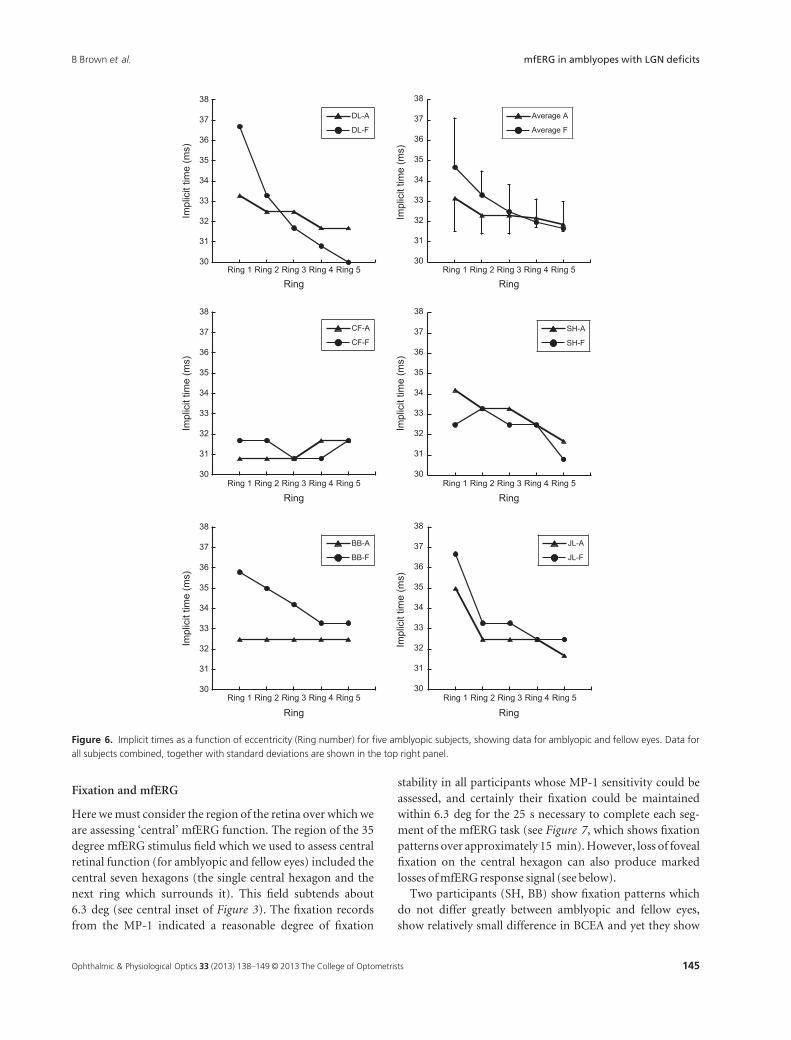
The implicit time data showed a similar pattern to that
of the response density data, with differences at the fovea
and no differences in the periphery, but the individual data
were considerably more variable (see Figure 6). Central IT
values (ring 1) are 1–2 ms longer than peripheral IT values
(ring 2–4) on average (see upper right plot). Two-way
ANOVA showed significant differences with eccentricity
(rings) (p < 0.05), but no differences between eyes (i.e. no
effect of amblyopic/fellow eye), and no interaction of eye
with eccentricity.
Microperimetry
The mean sensitivity values for the Humphrey 10-2 visual
field program were all within the normal range42, 43 in four
participants who could perform the task. These average val-
ues were 19.6 � 0.4 dB and 19.4 � 0.7 dB in fellow and
amblyopic eyes, respectively; participant DL was unable to
complete microperimetry due to her poor visual acuity.
Fixation was within 4 deg at least 67% of the time and
largely central (except for participant JL); it was within
2 deg between 13% and 56% of the time (Figure 7,
Table 2). The fixation patterns of the fellow eyes of the four
participants who completed this test are shown in the lower
panels of Figure 7, for direct comparison with the patterns
of the amblyopic eyes. The only participant to show a strik-
ing difference between eyes is JL (see below). Fellow eyes
show better fixation, with three participants having 80% of
fixation within 2 deg and all four having 99%–100% within
4 deg (Table 2).
Figure 3. Individual hexagon responses for all 103 hexagons for R (fellow) and L (amblyopic) eye of subject BB.
Ophthalmic & Physiological Optics 33 (2013) 138–149 © 2013 The College of Optometrists142
mfERG in amblyopes with LGN deficits B Brown et al.

Bivariate contour ellipse area (BCEA) was calculated
from the fixation data output from the Nidek device for
each perimetry session. Table 2 shows BCEA values for
the amblyopic eye, fellow eye, and the ratio of fixation
areas in amblyopic eye/fellow eye. These are a factor of
10 or less, except for JL, who has multiple fixation loci
in her amblyopic eye and extremely good fixation at the
foveal locus of her fellow eye (Figure 7). There is no sig-
nificant correlation between mfERG response and BCEA
for either amblyopic eye (r = 0.68; p > 0.05 n = 4) or
fellow eye (r = 0.04; p > 0.05 n = 4) in these partici-
pants, although these correlation analyses lack statistical
power because of the small numbers of participants
involved.
Correlation of mfERG results with fMRI results
Correlations were calculated between BOLD average
response differences (differenced between right and left
eye) and mfERG response differences (differenced
between right and left eyes), either averaged across the
entire stimulus field or targeting just the foveal selective
mfERG deficit. The average BOLD measure represents
the integrated hemodynamic response function28,29. As
Figure 4. Ring responses for an individual subject (BB), showing reduction in response with increasing eccentricity (ring number), and reduced
response in the amblyopic eye (see also Figures 3 and 5). Central N1-P1 response densities (ring 1) are shown at the top and more peripheral
responses (rings 2–5) below.
Table 2. Fixation data from Nidek P-1 Microperimeter; BCEA (Bivariate contour ellipse area) is calculated from fixation data output from the
Microperimeter. (JL has multiple fixation loci.)
Participant
Amblyopic Within
2/4 deg (percent)
Fellow Within
2/4 deg (percent)
BCEA (Amblyopic)
(log min arc sq)
BCEA (Fellow)
(log min arc sq)
CF 36/84 80/99 4.41 3.37
SH 49/86 49/96 4.15 4.1
BB 56/91 97/100 4.13 3.38
JL 13/67 100/100 5.08 1.73
Ophthalmic & Physiological Optics 33 (2013) 138–149 © 2013 The College of Optometrists 143
B Brown et al. mfERG in amblyopes with LGN deficits
detailed in Table 3 none of these were statistically signifi-
cant. As noted above, these correlation analyses lack sta-
tistical power.
Discussion
First, all participants showed reduced mfERG response
densities in the central retina (rings 1–3; about 19 deg)
of the amblyopic eye compared to their fellow eye, and
in general the responses normalised in the mid-periphery
of the retina. We did not find any associated structural
deficits. There are a number of possible explanations for
reduced mfERG amplitudes in the central field other
than reduced functional integrity of centrally-located reti-
nal cells (e.g. reduced fixation stability, ametropia and
the refractive correction) and these are discussed below.
Second, since we found no correlation between the
reduced mfERGs and reduced BOLD LGN deficits, we
conclude that the previously reported LGN deficit may
not have a retinal origin.
0
5
10
15
20
25
Ring 1 Ring 2 Ring 3 Ring 4 Ring 5
Amblyopic
Fellow
Am
plitu
de (n
V/s
q de
g)
Ring
0
5
10
15
20
25
Ring 1 Ring 2 Ring 3 Ring 4 Ring 5
DL-A
DL-F
Am
plitu
de (n
V/s
q de
g)
Ring
0
5
10
15
20
25
Ring 1 Ring 2 Ring 3 Ring 4 Ring 5
CF-A
CF-F
Am
plitu
de (n
V/s
q de
g)
Ring
0
5
10
15
20
25
Ring 1 Ring 2 Ring 3 Ring 4 Ring 5
SH-A
SH-F
Am
plitu
de (n
V/s
q de
g)
Ring
0
5
10
15
20
25
Ring 1 Ring 2 Ring 3 Ring 4 Ring 5
BB-A
BB-F
Am
plitu
de (n
V/s
q de
g)
Ring
0
5
10
15
20
25
Ring 1 Ring 2 Ring 3 Ring 4 Ring 5
JL-A
JL-F
Am
plitu
de (n
V/s
q de
g)
Ring
Figure 5. N1-P1 response densities as a function of eccentricity (Ring number) for five amblyopic subjects, showing data for amblyopic and fellow
eyes. Data for all subjects combined, together with standard deviations are shown in the top right panel.
Ophthalmic & Physiological Optics 33 (2013) 138–149 © 2013 The College of Optometrists144
mfERG in amblyopes with LGN deficits B Brown et al.
Fixation and mfERG
Here wemust consider the region of the retina over which we
are assessing ‘central’ mfERG function. The region of the 35
degree mfERG stimulus field which we used to assess central
retinal function (for amblyopic and fellow eyes) included the
central seven hexagons (the single central hexagon and the
next ring which surrounds it). This field subtends about
6.3 deg (see central inset of Figure 3). The fixation records
from the MP-1 indicated a reasonable degree of fixation
stability in all participants whose MP-1 sensitivity could be
assessed, and certainly their fixation could be maintained
within 6.3 deg for the 25 s necessary to complete each seg-
ment of the mfERG task (see Figure 7, which shows fixation
patterns over approximately 15 min).However, loss of foveal
fixation on the central hexagon can also produce marked
losses ofmfERG response signal (see below).
Two participants (SH, BB) show fixation patterns which
do not differ greatly between amblyopic and fellow eyes,
show relatively small difference in BCEA and yet they show
30
31
32
33
34
35
36
37
38
Ring 1 Ring 2 Ring 3 Ring 4 Ring 5
Average A
Average F
Impl
icit
time
(ms)
Ring
30
31
32
33
34
35
36
37
38
Ring 1 Ring 2 Ring 3 Ring 4 Ring 5
DL-A
DL-F
Impl
icit
time
(ms)
Ring
30
31
32
33
34
35
36
37
38
Ring 1 Ring 2 Ring 3 Ring 4 Ring 5
CF-A
CF-F
Impl
icit
time
(ms)
Ring
30
31
32
33
34
35
36
37
38
Ring 1 Ring 2 Ring 3 Ring 4 Ring 5
JL-A
JL-F
Impl
icit
time
(ms)
Ring
30
31
32
33
34
35
36
37
38
Ring 1 Ring 2 Ring 3 Ring 4 Ring 5
BB-A
BB-F
Impl
icit
time
(ms)
Ring
30
31
32
33
34
35
36
37
38
Ring 1 Ring 2 Ring 3 Ring 4 Ring 5
SH-A
SH-F
Impl
icit
time
(ms)
Ring
Figure 6. Implicit times as a function of eccentricity (Ring number) for five amblyopic subjects, showing data for amblyopic and fellow eyes. Data for
all subjects combined, together with standard deviations are shown in the top right panel.
Ophthalmic & Physiological Optics 33 (2013) 138–149 © 2013 The College of Optometrists 145
B Brown et al. mfERG in amblyopes with LGN deficits

markedly reduced central mfERG response in the amblyo-
pic eye. As noted above, there was no significant correlation
between BCEA and mfERG response in either amblyopic or
fellow eye, although the power of this test is low because of
the small number of subjects available.
Chu, Chan & Leat44 examined the mfERG in 20 partic-
ipants with normal vision who were asked to make con-
trolled eye movements; fixation was moved regularly so
that 51.2% of the time fixation was central and 12.2% of
the time fixation was at each end of the fixation cross
provided. Fixation crosses of 2°, 4° and 6° were used.
For the 2° unsteady fixation, central (one hexagon, sub-
tending only 2.4 deg) N1 and P1 amplitudes were unaf-
fected; for 4° unsteady fixation, N1 amplitude was
unaffected but P1 was reduced by some 30%. Implicit
times of the mfERG N1-P1 responses were unaffected in
any of the eye movement conditions which they used.
The idea that fixation instability has small effects on the
mfERG does not accord with the conclusions of Zhang
et al.45 who reported mfERG data in a group of six amblyo-
pes. They measured eye movements using a dual Purkinje
image eye tracker prior to mfERG measurements, and
found a selective central field mfERG deficit in amblyopic
eyes that was tightly correlated with fixation instability.
However the mfERG findings of Zhang et al. were assessed
in terms of the P1-N2 amplitude instead of the more usual
N1-P1 derivation that we used. In addition, their final anal-
ysis was biased toward amblyopia with gross nystagmus by
the inclusion of two control participants with 2 Hz and
4 Hz nystagmus superimposed, and the data of the am-
blyopes were normalised to the 4 Hz data of the control
participants before correlation and regression analysis.
These issues make it difficult to compare their results with
ours.
MP-1, fixation and perimetry
Shah and Chalam46 used the MP-1 microperimeter in con-
trol participants and found that the total mean fixation sta-
bility values within 2° and 4° were 86% and 96%,
respectively. They reported that older participants had
worse fixation, with the 2° value declining by 3.4% per dec-
ade. Thus our amblyopic participants are worse (on aver-
age) than controls for the central (2°) fixation hexagon by a
factor of about two, but considerably less than this for the
4° region. We would expect that fixation effects would be
AmblyopicCF SH BB JL
FellowCF SH BB JL
Figure 7. Fixation patterns as recorded by the Nidek MP-1 Microperimeter over a measurement period of approximately 15 min. Blue dots are
recorded fixation points at the time of detection of perimetry presentations. JLK has two other fixation loci on the nasal (R) side of the pattern shown,
which account for her larger bivariate contour ellipse value (see Table 2). Upper row shows patterns for amblyopic eyes, lower row shows patterns for
fellow eyes.
Ophthalmic & Physiological Optics 33 (2013) 138–149 © 2013 The College of Optometrists146
mfERG in amblyopes with LGN deficits B Brown et al.
minimal on ring 2 results, which encompass the region
with a radius from 3.15° to 6.3°.Bivariate contour ellipse area (BCEA) values (see
Table 3) are within the range of values for those seen in
age-related maculopathy patients40; we have been unable to
find BCEA values for amblyopes in the literature for com-
parison with our own. The BCEA values for fellow eyes
shown in Table 2 (apart from that of participant JL) are of
the expected value given the findings of Shah and Chalam46
and the known disruption of fixation seen in fellow eyes of
some amblyopes.47
The BCEA values we have measured reflect the ordering
seen in the 2° and 4° scores from the MP-1, except for
reversal of the positions of BB and SH in the 4° rankings.
MfERG and refractive error
It is known that high refractive errors in the absence of
amblyopia can lead to reducedmfERGs. This has been shown
for myopes48, 49 and for this reason we rejected participant
DG (�15.00D/�2.25D 9 180) fromour study even though
she had been part of the original fMRI studies to which we
compared our results.28, 29 There is evidence that the mfERG
response is reduced in cases of high myopia48 and reduces as
myopia increases.49 A number of our participants had mod-
erate to high levels of ametropia (DL + 8.0 D, SH + 7.0 D,
CF�3.0 D) that could have impacted on the mfERG results.
This is a possible confounding factor in our results.
Refractive correction
Refracting a severe amblyope can be quite difficult. If the
visual loss is cortical then it is especially important to
ensure optimal retinal focus for stimuli that are hard to see
because the mfERG has a strong and monotonic depen-
dence on stimulus contrast.50 Any reduction in retinal con-
trast will reduce the mfERG amplitude. While even severe
amblyopes can accurately detect image blur51, 52 the accu-
racy of our subjective refraction may have resulted in a
residual refractive error with a resultant loss of retinal con-
trast. This would produce a selective loss of mfERG ampli-
tude for the central retina; Chan & Siu53 have reported a
12% loss in P1 amplitude for a 3D error in refractive
correction and no loss in central N1 amplitude, so that any
loss for N1P1 amplitude should be less than 12%, assuming
that our self-refractions are within 3D. It is possible that
the amblyopes used the refractor to optimize contrast on
the peripheral retina, while ignoring the less functional (or
suppressed) central retina.
OCT and amblyopia
OCTdata fromthree outof fiveof our amblyopic participants
areconsistentwith thoseofprevious studies,54, 55which found
essentially nodifference inmacular thickness between ambly-
opic and fellow eyes. Values for participants SH (age 35) and
BB (age 67) appear thicker by about 40l in both central and
circumfoveal regions of both eyes but this is within the
expectednormal rangemeasuredbyHagen et al.41
Relationship to LGN fMRI results
The unique aspect of this study is that this group of partici-
pants has been extensively studied with fMRI and a reduced
LGN%BOLD response (both in terms of the averaged value
and the peak value) has been identified28 that is thought to
be selective for the parvocellular layers.29 Since we report
reduced mfERG responses in this same group of partici-
pants, it is of special interest to know the relationship of
the retinal and LGN deficits across the participants, to
ascertain whether the reduced LGN response could be due
to an attenuated input from the amblyopic eye.
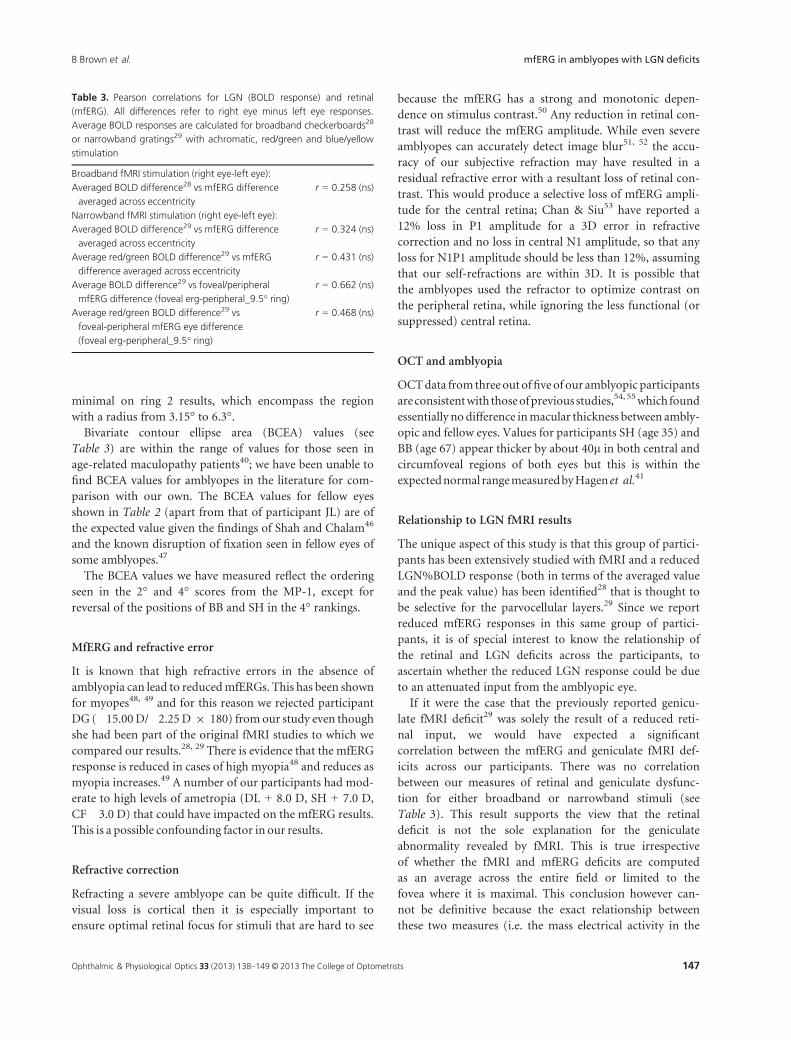
If it were the case that the previously reported genicu-
late fMRI deficit29 was solely the result of a reduced reti-
nal input, we would have expected a significant
correlation between the mfERG and geniculate fMRI def-
icits across our participants. There was no correlation
between our measures of retinal and geniculate dysfunc-
tion for either broadband or narrowband stimuli (see
Table 3). This result supports the view that the retinal
deficit is not the sole explanation for the geniculate
abnormality revealed by fMRI. This is true irrespective
of whether the fMRI and mfERG deficits are computed
as an average across the entire field or limited to the
fovea where it is maximal. This conclusion however can-
not be definitive because the exact relationship between
these two measures (i.e. the mass electrical activity in the
Table 3. Pearson correlations for LGN (BOLD response) and retinal
(mfERG). All differences refer to right eye minus left eye responses.
Average BOLD responses are calculated for broadband checkerboards28
or narrowband gratings29 with achromatic, red/green and blue/yellow
stimulation
Broadband fMRI stimulation (right eye-left eye):
Averaged BOLD difference28 vs mfERG difference
averaged across eccentricity
r = 0.258 (ns)
Narrowband fMRI stimulation (right eye-left eye):
Averaged BOLD difference29 vs mfERG difference
averaged across eccentricity
r = 0.324 (ns)
Average red/green BOLD difference29 vs mfERG
difference averaged across eccentricity
r = 0.431 (ns)
Average BOLD difference29 vs foveal/peripheral
mfERG difference (foveal erg-peripheral_9.5° ring)
r = 0.662 (ns)
Average red/green BOLD difference29 vs
foveal-peripheral mfERG eye difference
(foveal erg-peripheral_9.5° ring)
r = 0.468 (ns)
Ophthalmic & Physiological Optics 33 (2013) 138–149 © 2013 The College of Optometrists 147
B Brown et al. mfERG in amblyopes with LGN deficits
inner retinal layers and the BOLD activity in the LGN)
is not known for normal vision.
Conclusion
We have shown reduced central mfERG responses in a
small group of amblyopes who have previously exhibited
reduced BOLD responses (both in terms of the averaged
response and the peak response) from the LGN in a man-
ner that suggests a selective reduction of parvocellular func-
tion. There is no significant correlation between the retinal
and geniculate deficits for similar stimulating conditions.
We did not find any associated gross structural retinal defi-
cits. We cannot conclude that the reduced LGN responses
have a retinal basis because of the lack of a correlation
between the retinal and geniculate losses.
Acknowledgements
This work was supported by a Wesley research grant to
GAG, RFH and KTM, by CIHR grants to RFH (#53346)
and KTM and a QUT Vice Chancellor’s Research Fellow-
ship to BF.
Disclosure
All authors report no conflicts of interest.
References
1. Higgins KE, Daugman JG & Mansfield RJ. Amblyopic
contrast sensitivity: insensitivity to unsteady fixation. Invest
Ophthalmol Vis Sci 1982; 23: 113–120.
2. Hess RF, Campbell FW & Greenhalgh T. On the nature of
the neural abnormality in human amblyopia; neural aberra-
tions and neural sensitivity loss. Pflug Arch - Eur J Physiol
1978; 377: 201–207.
3. Hess RF & Howell ER. The threshold contrast sensitivity
function in strabismic amblyopia: evidence for a two type
classification. Vision Res 1977; 17: 1049–1055.
4. Levi M & Harwerth RS. Spatio-temporal interactions in
anisometropic and strabismic amblyopia. Invest Ophthalmol
Vis Sci 1977; 16: 90–95.
5. Hess RF & Holliday IE. The spatial localization deficit in
amblyopia. Vision Res 1992; 32: 1319–1339.
6. Lagreze WD & Sireteanu R. [Errors of monocular localiza-
tion in strabismic amblyopia. Two-dimensional distortion].
Klin Monatsbl Augenheilkd 1992; 201: 92–96.
7. Levi DM & Klein SA. Spatial localization in normal and
amblyopic vision. Vision Res 1983; 23: 1005–1017.
8. Aaen-Stockdale C & Hess RF. The amblyopic deficit for
global motion is spatial scale invariant. Vision Res 2008; 48:
1965–1971.
9. Simmers AJ, Ledgeway T & Hess RF. The influences of visi-
bility and anomalous integration processes on the percep-
tion of global spatial form versus motion in human
amblyopia. Vision Res 2004; 45: 449–460.
10. Simmers AJ, Ledgeway T, Hess RF & McGraw PV. Deficits
to global motion processing in human amblyopia. Vision
Res 2003; 43: 729–738.
11. Simmers AJ, Ledgeway T, Mansouri B, Hutchinson CV &
Hess RF. The extent of the dorsal extra-striate deficit in
amblyopia. Vision Res 2006; 46: 2571–2580.
12. Cleland BG, Crewther DP, Crewther SG & Mitchell DEM.
Normality of spatial resolution of retinal ganglion cells in
cats with strabismic amblyopia. J Physiol (Lond) 1982; 326:
235–249.
13. Cleland BG, Mitchell DEM, Gillard-Crewther S & Crewther
DP. Visual resolution of ganglion cells in monocularly-
deprived cats. Brain Res 1980; 192: 261–266.
14. Crewther DP, Crewther SG & Cleland BG. Is the retina
sensitive to the effects of prolonged blur? Exp Brain Res
1985; 58: 427–34.
15. Hess RF & Baker CL. Assessment of retinal function in
severely amblyopic individuals. Vision Res 1984; 24: 1367–
1376.
16. Hess RF, Baker CL, Verhoeve JN, Tulunay Keesey U &
France TD. The pattern evoked electoretinogram: its vari-
ability in normals and its relationship to amblyopia. Invest
Ophthalmol Vis Sci 1985; 26: 1610–1623.
17. Blakemore C & Vital-Durand F. Effects of visual deprivation
on the development of the monkey’s lateral geniculate
nucleus. J Physiol (Lond) 1986; 380: 493–511.
18. Levitt JB, Schumer RA, Sherman SM, Spear PD & Movshon
JA. Visual response properties of neurons in the LGN of
normally reared and visually deprived macaque monkeys.
J Neurophysiol 2001; 85: 2111–2129.
19. Zele AJ, Wood JM & Girgenti CC. Magnocellular and parvo-
cellular pathway mediated luminance contrast discrimina-
tion in amblyopia. Vision Res 2010; 50: 969–976.
20. Barnes GR, Hess RF, Dumoulin SO, Achtman RL & Pike
GB. The cortical deficit in humans with strabismic amblyo-
pia. J Physiol (Lond) 2001; 533(Pt.1): 281–97.
21. Zele AJ, Pokorny J, Lee DY & Ireland G. Anisometropic
amblyopia: spatial contrast sensitivity deficits in inferred
magnocellular and parvocellular vision. Invest Ophthalmol
Vis Sci 2007; 48: 3622–31.
22. Einon G, Ikeda H & Tremain KE. Perikaryal size of cells in
the lateral geniculate nucleus and amblyopia in cats reared
with convergent squint [proceedings]. J Physiol (Lond) 1978;
278: 50P.
23. Guillery RW. Binocular competition in the control of
geniculate cell growth. J Comp Neurol 1972; 144:
117–129.
24. Tremain KE & Ikeda H. Relationship between amblyopia,
LGN cell “shrinkage” and cortical ocular dominance in cats.
Exp Brain Res 1982; 45: 243–252.
Ophthalmic & Physiological Optics 33 (2013) 138–149 © 2013 The College of Optometrists148
mfERG in amblyopes with LGN deficits B Brown et al.

25. Barnes GR, Li X, Thompson B, Singh KD, Dumoulin SO &
Hess RF. Decreased gray matter concentration in the lateral
geniculate nuclei in human amblyopes. Invest Ophthalmol
Vis Sci 2009; 51: 1432–1438.
26. von Noorden GK, Crawford ML & Levacy RA. The lateral
geniculate nucleus in human anisometropic amblyopia.
Invest Ophthalmol Vis Sci 1983; 24: 788–790.
27. von Noorden GK & Crawford ML. The lateral geniculate
nucleus in human strabismic amblyopia. Invest Ophthalmol
Vis Sci 1992; 33: 2729–2732.
28. Hess RF, Thompson B, Gole G & Mullen KT. Deficient
responses from the lateral geniculate nucleus in humans
with amblyopia. Eur J Neurosci 2009; 29: 1064–1070.
29. Hess RF, Thompson B, Gole GA & Mullen KT. The amblyo-
pic deficit and its relationship to geniculo-cortical process-
ing streams. J Neurophysiol 2010; 104: 475–483.
30. Chino YM, Smith EL (3rd), Yoshida K, Cheng H & Hamam-
oto J. Binocular interactions in striate cortical neurons of
cats reared with discordant visual inputs. J Neurosci 1994;
14: 5050–5067.
31. Ikeda H, Tremain KE & Einon G. Loss of spatial resolution
of lateral geniculate nucleus neurones in kittens raised with
convergent squint produced at different stages in develop-
ment. Exp Brain Res 1978; 31: 207–220.
32. Sherman SM, Wilson JR & Guillery RW. Evidence that
binocular competition affects the postnatal development of
Y-cells in the cat’s lateral geniculate nucleus. Brain Res 1975;
100: 441–444.
33. Yin ZQ, Crewther SG, Wang C & Crewther DP. Pre- and
post-critical period induced reduction of Cat-301 immuno-
reactivity in the lateral geniculate nucleus and visual cortex
of cats Y-blocked as adults or made strabismic as kittens.
Mol Vis 2006; 12: 858–866.
34. Sutter EE & Tran D. The field topography of ERG compo-
nents in man–I. The photopic luminance response. Vision
Res 1992; 32: 433–446.
35. Rangaswamy NV, Hood DC & Frishman LJ. Regional varia-
tions in local contributions to the primate photopic flash
ERG: revealed using the slow-sequence mfERG. Invest
Ophthalmol Vis Sci 2003; 44: 3233–3247.
36. Shimada Y, Bearse MA Jr & Sutter EE. Multifocal electrore-
tinograms combined with periodic flashes: direct responses
and induced components. Graefes Arch Clin Exp Ophthalmol
2005; 243: 132–141.
37. Bearse MA Jr, Han Y, Schneck ME & Adams AJ. Retinal
function in normal and diabetic eyes mapped with the slow
flash multifocal electroretinogram. Invest Ophthalmol Vis Sci
2004; 45: 296–304.
38. Cornsweet TN. The staircase method in psychophysics. Am J
Psychol 1962; 75: 485–491.
39. Early Treatment of Diabetic Retinopathy Study Research
Group. Photocoagulation for diabetic macular edema. Early
Treatment Diabetic Retinopathy Study Report No. 1. Arch
Ophthalmol 1985;103:1796–1806.
40. CrosslandMD,DunbarHMP&RubinGS. Fixation stability
measurement using theMP1microperimeter. Retina 2009;
29: 651–656.
41. Hagen S, Krebs I, Haas P et al. Reproducibility and compar-
ison of retinal thickness and volume measurements in nor-
mal eyes determined with two different Cirrus OCT
scanning protocols. Retina 2011; 31: 41–7.
42. Feigl B & Zele AJ. Macular function in tilted disc syndrome.
Doc Ophthalmol 2010; 120: 201–203.
43. Springer C, Bultmann S, Volcker HE & Rohrschneider K.
Fundus perimetry with the Micro Perimeter 1 in normal
individuals: comparison with conventional threshold peri-
metry. Ophthalmology 2005; 112: 848–854.
44. Chu PH, Chan HH & Leat SJ. Effects of unsteady fixation on
multifocal electroretinogram (mfERG). Graefes Arch Clin
Exp Ophthalmol 2006; 244: 1273–1282.
45. Zhang B, Stevenson SS, Cheng H, et al. Effects of fixation
instability on multifocal VEP (mfVEP) responses in amblyo-
pes. J Vis 2008; 8: 16.1–14.
46. Shah VA & Chalam KV. Values for macular perimetry using
the MP-1 microperimeter in normal participants. Ophthal-
mic Res 2009; 41: 9–13.
47. Bedell HE & Flom MC. Bilateral oculomotor abnormalities
in strabismic amblyopes: evidence for a common central
mechanism. Doc Ophthalmol 1985; 59: 309–321.
48. Chan HL & Mohidin N. Variation of multifocal electroreti-
nogram with axial length. Ophthalmic Physiol Opt 2003; 23:
133–140.
49. Kawabata H & Adachi-Usami E. Multifocal electroretino-
gram in myopia. Invest Ophthalmol Vis Sci 1997; 38: 2844–
2851.
50. Brown B & Yap MK. Contrast and luminance as parameters
defining the output of the VERIS topographical ERG.
Ophthalmic Physiol Opt 1996; 16: 42–48.
51. Hess RF, Pointer JS, Simmers A & Bex P. Border distinctness
in amblyopia. Vision Res 2003; 43: 2255–2264.
52. Simmers AJ, Bex PJ & Hess RF. Perceived blur in amblyopia.
Invest Ophthalmol Vis Sci 2003; 44: 1395–1400.
53. Chan HL & Siu AW. Effect of optical defocus on multifocal
ERG responses. Clin Exp Optom 2003; 86: 317–322.
54. Repka MX, Kraker RT, Tamkins SM, Suh DW, Sala NA &
Beck RW. Retinal nerve fiber layer thickness in amblyopic
eyes. Am J Ophthalmol 2009; 148: 143–147.
55. Huynh SC, Samarawickrama C, Wang XY, et al.Macular
and nerve fiber layer thickness in amblyopia: the Sydney
Childhood Eye Study. Ophthalmology 2009; 116: 1604–1609.
Ophthalmic & Physiological Optics 33 (2013) 138–149 © 2013 The College of Optometrists 149
B Brown et al. mfERG in amblyopes with LGN deficits


![Frege, Gottlob - On Sense and Nominatum [Translated by Herbert Feigl]1892](https://img.pdfslide.us/doc/110x75/547f11cab379594e2b8b567b/frege-gottlob-on-sense-and-nominatum-translated-by-herbert-feigl1892.jpg)