Embed Size (px)
Citation preview
Paper Number 09
Assessment of material strain limits for defining plastic regions in concrete structures
A.F. Walker & R.P. Dhakal University of Canterbury, Christchurch, New Zealand.
2008 NZSEE Conference
ABSTRACT: The New Zealand Structural Loadings Standard, until its latest revision, used the structural ductility factor as a measure of the deformation demand of all potential plastic hinges in a structure. In the new version of New Zealand Standard for Earthquake Actions (NZS 1170.5:2004) the detailing of potential plastic regions is determined according to the local deformation demand in these regions. The change has been prompted by evidence that the structural ductility factor gives a poor indication of the demand on individual plastic regions. This new approach has also been adopted by the revised New Zealand Concrete Structures Standard (NZS 3101:2006) which classifies potential plastic regions into three categories (namely ductile, limited ductile and nominally ductile) based upon their inelastic deformation demand specified in terms of material strain limits. The material strain limits currently set in NZS 3101:2006 for the three categories of plastic regions are based on limited experimental evidence and need a closer revision. This paper tries to obtain more justifiable values of material strain limits based on experimental data. In this research, reversed cyclic loading tests of beams are conducted to compensate for a lack of data in the nominally ductile range of detailing. Based on the results of the tests conducted, curvature limits for nominally ductile plastic hinges are derived. Combining the experimental results collected from literature and the tests conducted in this project, updated material strain limits for the three categories of plastic regions are proposed. To unify the design process for all types of plastic regions, curvature limits for nominally ductile plastic hinges are also proposed as the multiple of first yield curvature (similar to the existing approach for the other two categories of plastic regions) rather than the existing approach of specifying allowable compressive (concrete) and tensile (rebar) strain limits for nominally ductile plastic regions. To further simplify the process, the representative value of first yield curvature is approximated as two times the yielding strain to the beam height ratio, thereby relieving the designers from having to conduct section analysis to estimate neutral axis depth.
1 INTRODUCTION
The previous version of New Zealand Loadings Standard (NZS 4203:1992) defined the loads and forces to be used in the design of structures for dead, live, wind, snow and seismic loading, and the requirements for detailing of potential plastic regions were left to the appropriate materials standard. In the previous version of the New Zealand Concrete Structures Standard (NZS 3101:1995); the minimum detailing requirements for potential plastic regions were largely based on the structural displacement ductility factor, µ. This factor has been shown to be a poor indicator of the level of inelastic deformation on individual plastic regions (Fenwick and Dhakal, 2007a).
The revised New Zealand Standard for Earthquake actions (NZS 1170.5:2004) has recognised this inadequacy and requires that the detailing of potential plastic regions be based on the expected inelastic deformation in individual plastic regions. The demand is specified as material strains in the plastic region. For columns, beams and walls in flexure the material strains are given in the form of curvature, while for shear links in eccentrically braced frames or reinforced concrete coupling beams the material strains are based on shear deformation.
2
Subsequently, the latest revision of the New Zealand Concrete Structures Standard (NZS 3101:2006) has adopted the approach prescribed by NZS 1170.5:2004. The Concrete Structures Standard divides potential plastic regions into three categories; namely nominally ductile plastic regions (NDPR), limited ductile plastic regions (LDPR) and ductile plastic regions (DPR), based on the expected material strain they would sustain in a limit state earthquake. The limiting material strains are specified in terms of a curvature or shear deformation with no consideration given for axial strains. NZS 3101:2006 classifies structures as specified by NZS 1170.5 but does not give provisions for the design of brittle structures. It suggests that nominally ductile structures (1.0< µ <1.25) are likely to contain NDPRs and LDPRs. Similarly, limited ductile structures (1.25< µ <3.0) will likely contain LDPRs and DPRs, and ductile structures (3.0< µ <6.0) should only contain ductile plastic regions as the accuracy with which deformation demand can be predicted decreases with increasing structural ductility factor.
The capacity of a plastic hinge to sustain inelastic deformation also depends on the form of plastic hinge. Depending on the ratio of gravity induced moments to the seismic moment, two different forms of plastic hinge, namely unidirectional and reversing plastic hinge may form (Fenwick & Davidson 1987). Previous studies (Fenwick et al 1999) have shown that unidirectional plastic hinges can sustain significantly higher deformation than the reversing hinges. To account for this fact, different sets of material strain limits are specified in NZS 3101:2006 for unidirectional and reversing plastic hinges.
Limiting curvatures for limited ductile and ductile plastic regions are provided in Table 2.4 of NZS 3101:2006. The curvatures limits for these hinge regions are given in terms of the nominal curvature corresponding to first yield of the reinforcing bars. As the curvature at first yield increases with the yield stress of reinforcement and tests have shown that the ultimate curvature does not increase for fy beyond 400MPa, a yield strength factor is used to prevent excessive concrete strains for reinforcing grades higher than 400MPa. For nominally ductile beams and walls, limiting material strains for unidirectional plastic regions are given as the smaller of 0.004/c or 0.018/(d-c), where 0.004 is a limiting compressive strain in concrete and 0.018 is a limiting tensile strain in the longitudinal reinforcement. For reversing nominally ductile plastic regions the values are taken as 60% of the above. The material strain limits for nominally ductile columns are the same as those for limited ductile columns.
In order to enable safe and efficient structural design, it is desirable that the material strain limits be based on significant experimental information. At the time of publication of the design code an in-depth investigation into appropriate material strain limits had not been conducted. Following publication of the code, Fenwick and Dhakal (2007b) submitted proposed amendments to the material strain limits for ductile and limited ductile plastic regions based on experimental results found in the literature. However, there was a lack of satisfactory test results for reinforced concrete members with nominally ductile detailing.
The research described in this paper aims to fill the gap in the existing literature for nominally ductile beams. The lateral cyclic loading tests of eight nominally ductile beams are reported herein and the results are analysed to derive material strain limits for nominally ductile plastic hinges. Moreover, additional experimental results from literature are evaluated to assess the material strain limits for ductile and limited ductile plastic regions currently used in NZS 3101:2006.
2 EXPERIMENTAL DETAILS
There is a lack of information in the literature on the cyclic performance of beams with nominally ductile detailing. To enable design criteria to be established for nominally ductile plastic regions a series of beams detailed to fall into the nominally ductile category according to NZS 3101:2006 were built and tested. The tested specimens were designed to have plastic hinges which cover a wide range of the NDPR category and two different loading sequences were used; one to induce unidirectional and the other to induce reversing plastic hinges in the test beams.
3
2.1 Specimen design
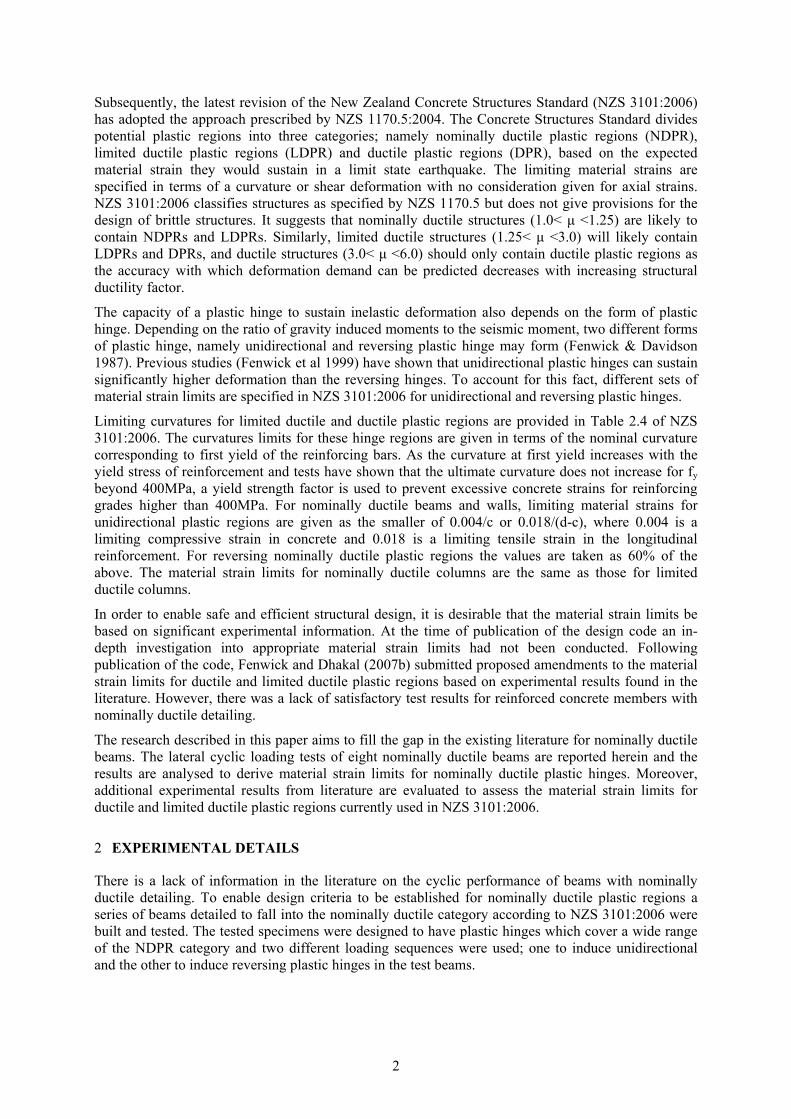
Four test units comprising eight beam specimens were constructed. Each unit had a central support block (1760mm x 1020mm x 700mm) in the middle and two test beams each of 1600mm length. The central block was mounted on a 500mm high pedestal. Each unit was secured by two rows of five 38mm diameter bolts spaced at 380 mm. The beams were supported as cantilevers and subjected to quasi-static loading via a single reversing hydraulic jack located near the end of the beam. The general arrangement of the tests is shown in Figure 1.
1760 mm1670 mm
PLAN
ELEVATION
1000
mm
700
mm
500
mm
b
Support block
Pedestal
50mm
400
mm
b
400
mm
b
Figure 1-Test setup
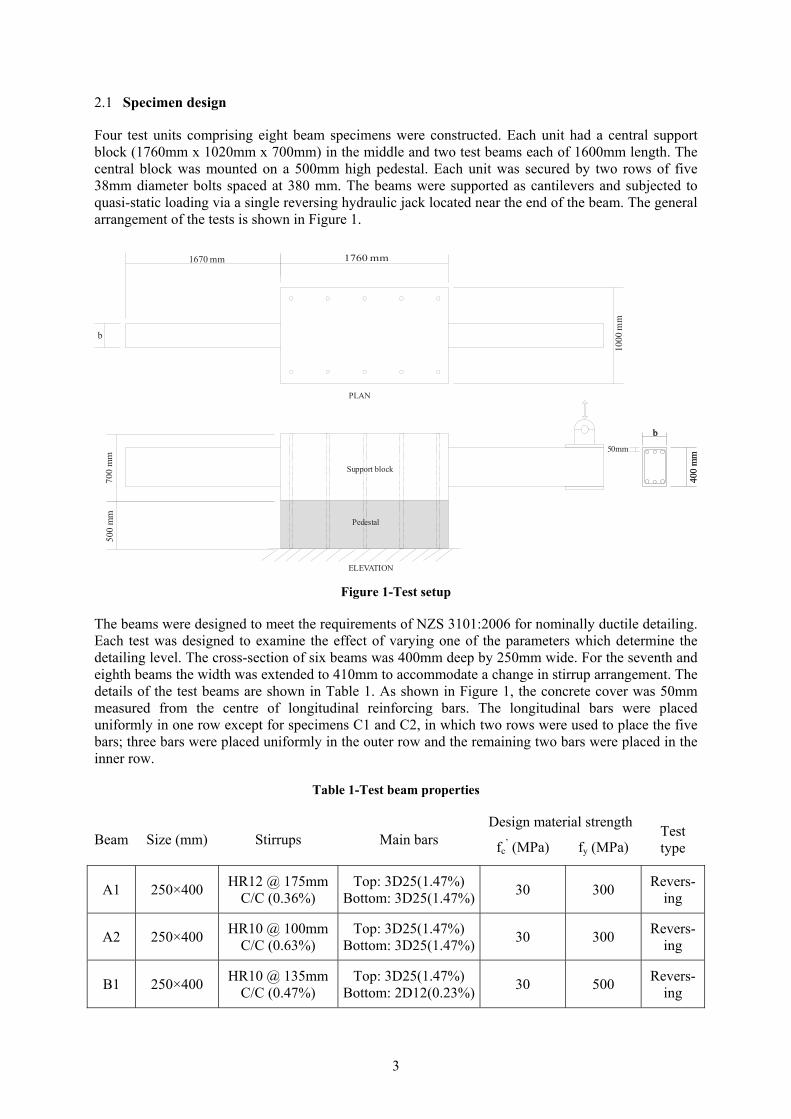
The beams were designed to meet the requirements of NZS 3101:2006 for nominally ductile detailing. Each test was designed to examine the effect of varying one of the parameters which determine the detailing level. The cross-section of six beams was 400mm deep by 250mm wide. For the seventh and eighth beams the width was extended to 410mm to accommodate a change in stirrup arrangement. The details of the test beams are shown in Table 1. As shown in Figure 1, the concrete cover was 50mm measured from the centre of longitudinal reinforcing bars. The longitudinal bars were placed uniformly in one row except for specimens C1 and C2, in which two rows were used to place the five bars; three bars were placed uniformly in the outer row and the remaining two bars were placed in the inner row.
Table 1-Test beam properties
Design material strength Beam Size (mm) Stirrups Main bars fc
’ (MPa) fy (MPa) Test type
A1 250×400 HR12 @ 175mm C/C (0.36%)
Top: 3D25(1.47%) Bottom: 3D25(1.47%) 30 300 Revers-
ing
A2 250×400 HR10 @ 100mm C/C (0.63%)
Top: 3D25(1.47%) Bottom: 3D25(1.47%) 30 300 Revers-
ing
B1 250×400 HR10 @ 135mm C/C (0.47%)
Top: 3D25(1.47%) Bottom: 2D12(0.23%) 30 500 Revers-
ing
4
B2 250×400 HR10 @ 135mm C/C (0.47%)
Top: 3D25(1.47%) Bottom: 2D12(0.23%) 30 500
Unidi-rec-
tional
C1 250×400 HR10 @ 130mm C/C (0.48%)
Top: 5D25(2.45%) Bottom: 2D16(0.40%) 30 300 Revers-
ing
C2 250×400 HR10 @ 130mm C/C (0.48%)
Top: 5D25(2.45%) Bottom: 2D16(0.40%) 30 300
Unidi-rec-
tional
D1 410×400 HR10 @ 175mm C/C (0.36%)
Top: 3D16(0.37%) Bottom: 3D16(0.37%) 30 500 Revers-
ing
D2 410×400 HR10 @ 175mm C/C (0.36%)
Top: 3D16(0.37%) Bottom: 3D16(0.37%) 30 500
Unidi-rec-
tional
The pullout of longitudinal reinforcing bars at the interface between a structural member and its supporting element can have a significant effect on the total deformation sustained by the member. Strain penetration results from the gradual transfer of longitudinal bar forces into the surrounding concrete. The loaded end of the bar experiences slip at the interface due to an accumulative strain difference between the bar and the concrete and this increases when yielding penetrates into the anchorage block. This causes a crack to form at the interface and an overall member rotation has been observed to cause 35 percent of the displacement at the end of beams (Zhao and Sritharan 2007). In the tests conducted in this project, adequate anchorage length is provided. To minimise the deflection due to yield penetration of reinforcement into the anchorage block two additional 10mm round bars were welded to each bar of flexural reinforcement in the anchorage block.
2.2 Instrumentation
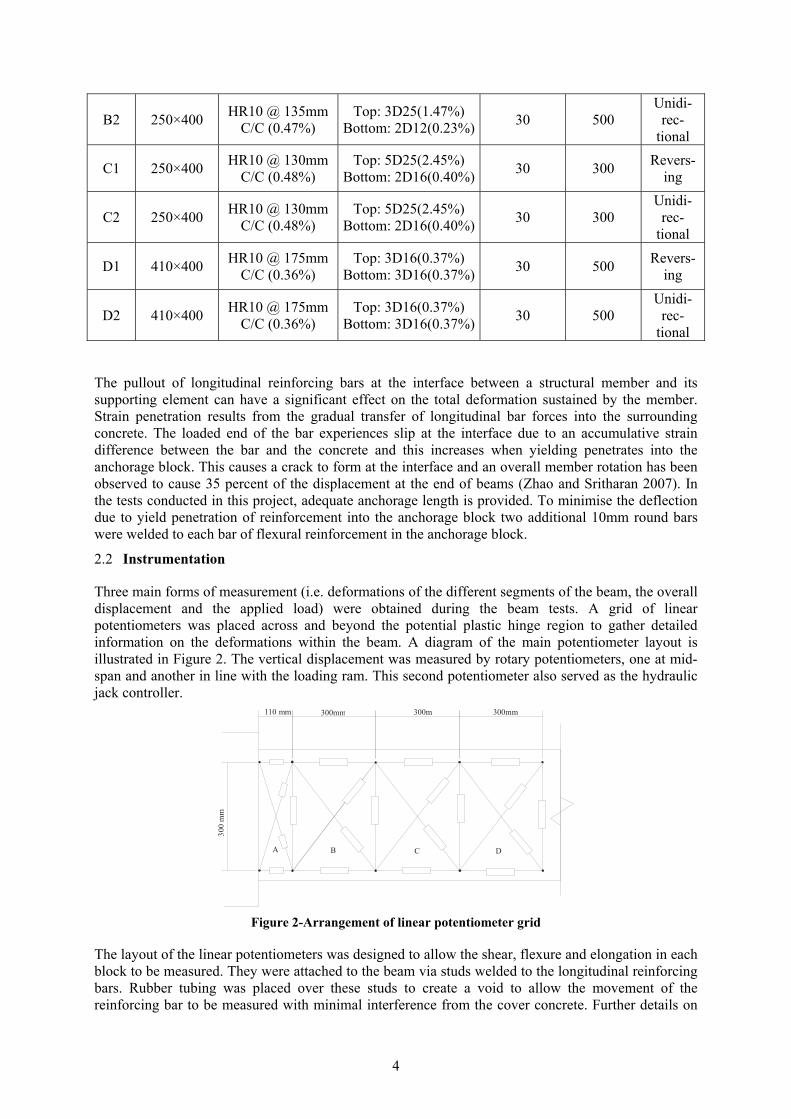
Three main forms of measurement (i.e. deformations of the different segments of the beam, the overall displacement and the applied load) were obtained during the beam tests. A grid of linear potentiometers was placed across and beyond the potential plastic hinge region to gather detailed information on the deformations within the beam. A diagram of the main potentiometer layout is illustrated in Figure 2. The vertical displacement was measured by rotary potentiometers, one at mid-span and another in line with the loading ram. This second potentiometer also served as the hydraulic jack controller.
110 mm 300mm 300m 300mm
300
mm
BA C D
Figure 2-Arrangement of linear potentiometer grid
The layout of the linear potentiometers was designed to allow the shear, flexure and elongation in each block to be measured. They were attached to the beam via studs welded to the longitudinal reinforcing bars. Rubber tubing was placed over these studs to create a void to allow the movement of the reinforcing bar to be measured with minimal interference from the cover concrete. Further details on
5
the specimen design and instrumentation planning are given elsewhere (Walker, 2008).
2.3 Loading Protocol
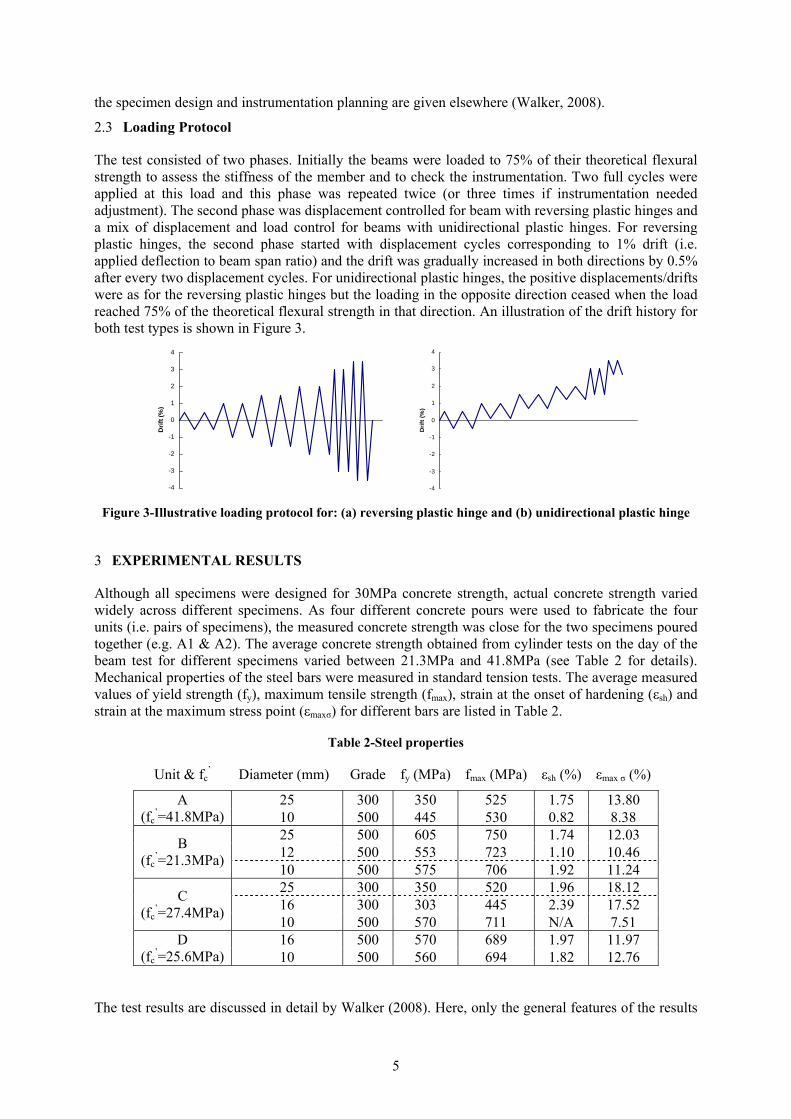
The test consisted of two phases. Initially the beams were loaded to 75% of their theoretical flexural strength to assess the stiffness of the member and to check the instrumentation. Two full cycles were applied at this load and this phase was repeated twice (or three times if instrumentation needed adjustment). The second phase was displacement controlled for beam with reversing plastic hinges and a mix of displacement and load control for beams with unidirectional plastic hinges. For reversing plastic hinges, the second phase started with displacement cycles corresponding to 1% drift (i.e. applied deflection to beam span ratio) and the drift was gradually increased in both directions by 0.5% after every two displacement cycles. For unidirectional plastic hinges, the positive displacements/drifts were as for the reversing plastic hinges but the loading in the opposite direction ceased when the load reached 75% of the theoretical flexural strength in that direction. An illustration of the drift history for both test types is shown in Figure 3.
-4
-3
-2
-1
0
1
2
3
4
Drif
t (%
)
-4
-3
-2
-1
0
1
2
3
4
Drif
t (%
)
Figure 3-Illustrative loading protocol for: (a) reversing plastic hinge and (b) unidirectional plastic hinge
3 EXPERIMENTAL RESULTS
Although all specimens were designed for 30MPa concrete strength, actual concrete strength varied widely across different specimens. As four different concrete pours were used to fabricate the four units (i.e. pairs of specimens), the measured concrete strength was close for the two specimens poured together (e.g. A1 & A2). The average concrete strength obtained from cylinder tests on the day of the beam test for different specimens varied between 21.3MPa and 41.8MPa (see Table 2 for details). Mechanical properties of the steel bars were measured in standard tension tests. The average measured values of yield strength (fy), maximum tensile strength (fmax), strain at the onset of hardening (εsh) and strain at the maximum stress point (εmaxσ) for different bars are listed in Table 2.
Table 2-Steel properties
Unit & fc’ Diameter (mm) Grade fy (MPa) fmax (MPa) εsh (%) εmax σ (%)
25 300 350 525 1.75 13.80 A (fc
’=41.8MPa) 10 500 445 530 0.82 8.38 25 500 605 750 1.74 12.03 12 500 553 723 1.10 10.46 B
(fc’=21.3MPa) 10 500 575 706 1.92 11.24
25 300 350 520 1.96 18.12 16 300 303 445 2.39 17.52 C
(fc’=27.4MPa) 10 500 570 711 N/A 7.51
16 500 570 689 1.97 11.97 D (fc
’=25.6MPa) 10 500 560 694 1.82 12.76
The test results are discussed in detail by Walker (2008). Here, only the general features of the results
6
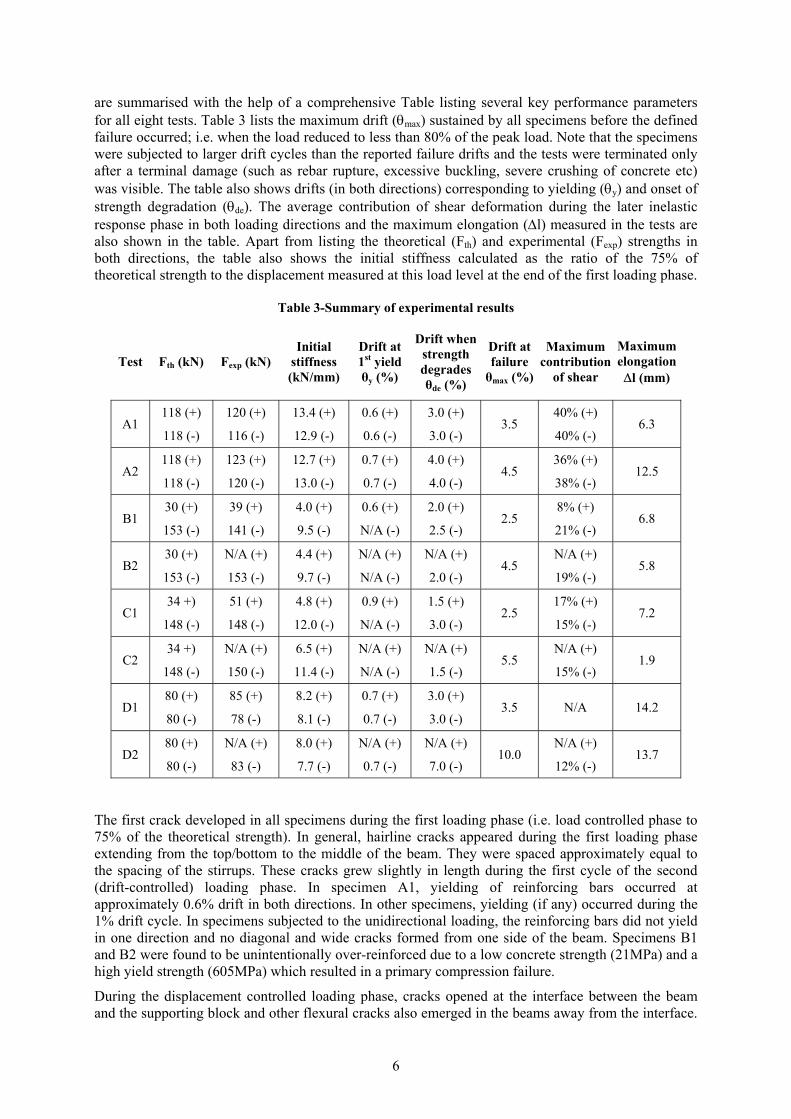
are summarised with the help of a comprehensive Table listing several key performance parameters for all eight tests. Table 3 lists the maximum drift (θmax) sustained by all specimens before the defined failure occurred; i.e. when the load reduced to less than 80% of the peak load. Note that the specimens were subjected to larger drift cycles than the reported failure drifts and the tests were terminated only after a terminal damage (such as rebar rupture, excessive buckling, severe crushing of concrete etc) was visible. The table also shows drifts (in both directions) corresponding to yielding (θy) and onset of strength degradation (θde). The average contribution of shear deformation during the later inelastic response phase in both loading directions and the maximum elongation (∆l) measured in the tests are also shown in the table. Apart from listing the theoretical (Fth) and experimental (Fexp) strengths in both directions, the table also shows the initial stiffness calculated as the ratio of the 75% of theoretical strength to the displacement measured at this load level at the end of the first loading phase.
Table 3-Summary of experimental results
Test Fth (kN) Fexp (kN) Initial
stiffness (kN/mm)
Drift at 1st yield θy (%)
Drift when strength degrades θde (%)
Drift at failure θmax (%)
Maximum contribution
of shear
Maximum elongation ∆l (mm)
A1 118 (+)
118 (-)
120 (+)
116 (-)
13.4 (+)
12.9 (-)
0.6 (+)
0.6 (-)
3.0 (+)
3.0 (-) 3.5
40% (+)
40% (-) 6.3
A2 118 (+)
118 (-)
123 (+)
120 (-)
12.7 (+)
13.0 (-)
0.7 (+)
0.7 (-)
4.0 (+)
4.0 (-) 4.5
36% (+)
38% (-) 12.5
B1 30 (+)
153 (-)
39 (+)
141 (-)
4.0 (+)
9.5 (-)
0.6 (+)
N/A (-)
2.0 (+)
2.5 (-) 2.5
8% (+)
21% (-) 6.8
B2 30 (+)
153 (-)
N/A (+)
153 (-)
4.4 (+)
9.7 (-)
N/A (+)
N/A (-)
N/A (+)
2.0 (-) 4.5
N/A (+)
19% (-) 5.8
C1 34 +)
148 (-)
51 (+)
148 (-)
4.8 (+)
12.0 (-)
0.9 (+)
N/A (-)
1.5 (+)
3.0 (-) 2.5
17% (+)
15% (-) 7.2
C2 34 +)
148 (-)
N/A (+)
150 (-)
6.5 (+)
11.4 (-)
N/A (+)
N/A (-)
N/A (+)
1.5 (-) 5.5
N/A (+)
15% (-) 1.9
D1 80 (+)
80 (-)
85 (+)
78 (-)
8.2 (+)
8.1 (-)
0.7 (+)
0.7 (-)
3.0 (+)
3.0 (-) 3.5 N/A 14.2
D2 80 (+)
80 (-)
N/A (+)
83 (-)
8.0 (+)
7.7 (-)
N/A (+)
0.7 (-)
N/A (+)
7.0 (-) 10.0
N/A (+)
12% (-) 13.7
The first crack developed in all specimens during the first loading phase (i.e. load controlled phase to 75% of the theoretical strength). In general, hairline cracks appeared during the first loading phase extending from the top/bottom to the middle of the beam. They were spaced approximately equal to the spacing of the stirrups. These cracks grew slightly in length during the first cycle of the second (drift-controlled) loading phase. In specimen A1, yielding of reinforcing bars occurred at approximately 0.6% drift in both directions. In other specimens, yielding (if any) occurred during the 1% drift cycle. In specimens subjected to the unidirectional loading, the reinforcing bars did not yield in one direction and no diagonal and wide cracks formed from one side of the beam. Specimens B1 and B2 were found to be unintentionally over-reinforced due to a low concrete strength (21MPa) and a high yield strength (605MPa) which resulted in a primary compression failure.
During the displacement controlled loading phase, cracks opened at the interface between the beam and the supporting block and other flexural cracks also emerged in the beams away from the interface.
7
At this stage, diagonal cracks could be seen in all specimens near the support block. In reversing beams (A1, A2, B1, C1 and D1) diagonal cracks appeared in both directions whereas in unidirectional beams (B2, C2 and D2) they could be seen only in one direction. These opened and closed alternately when the direction of loading was reversed and became wider as the larger drift cycles were applied. In all specimens, spalling of cover concrete was followed by the exposure of buckled reinforcing bars at one or both sides depending on the loading type (unidirectional or reversing). Tests A1, A2 and C2 were terminated after the load reduced to 60% of the peak strength due to severe damage (including buckling of rebars) and the other five tests were terminated after low cycle fatigue caused rupture of longitudinal beam bars. A plastic hinge (unidirectional or reversing depending on the type of loading) formed near the central block and during the reversed cyclic displacements, the plastic hinge elongated. This growth in the length of the beam occurred not only when a larger drift cycle was applied, but also when the same drift cycle was repeated. The total beam elongation was smaller in unidirectional plastic hinge tests that in reversing plastic hinge tests. The maximum elongation was more than 3% of the beam depth in some specimens.
-70 -60 -50 -40 -30 -20 -10 0 10 20 30 40 50 60 70Displacement (mm)
-140
-120
-100
-80
-60
-40
-20
0
20
40
60
80
100
120
140
Forc
e (k
N)
-5 -4 -3 -2 -1 0 1 2 3 4 5
Drif t (%)
Experimental resultsTheoretical strength
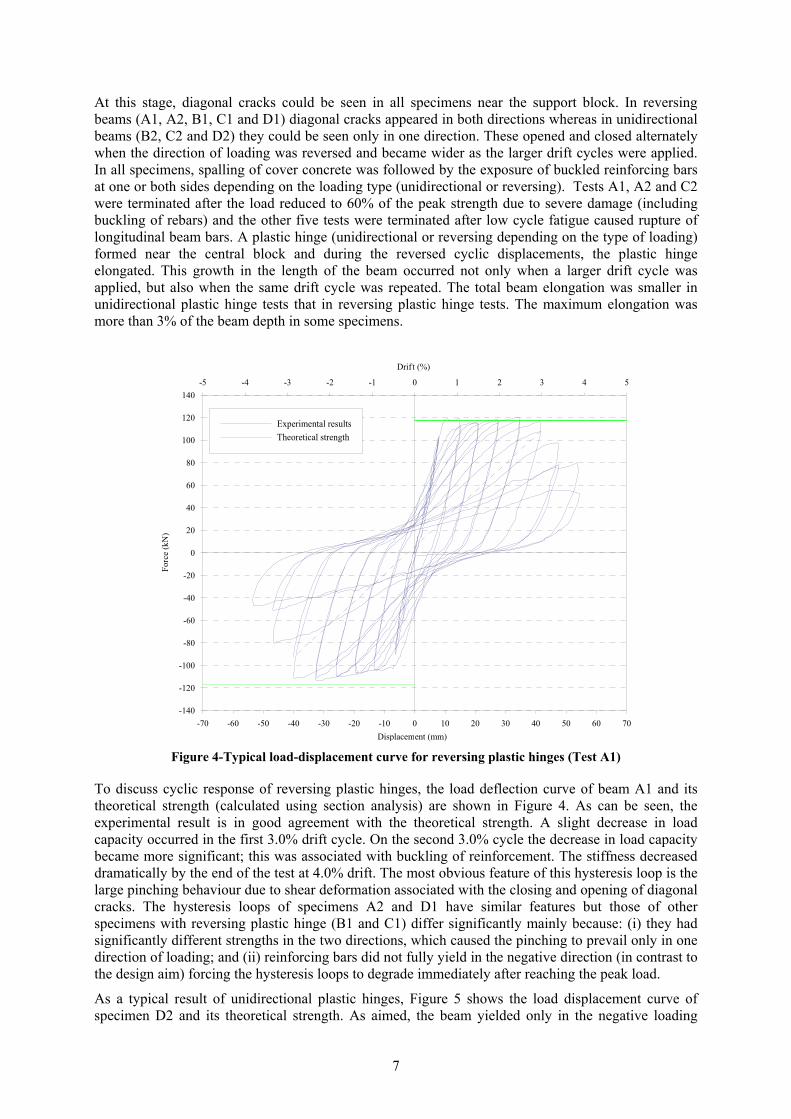
Figure 4-Typical load-displacement curve for reversing plastic hinges (Test A1)
To discuss cyclic response of reversing plastic hinges, the load deflection curve of beam A1 and its theoretical strength (calculated using section analysis) are shown in Figure 4. As can be seen, the experimental result is in good agreement with the theoretical strength. A slight decrease in load capacity occurred in the first 3.0% drift cycle. On the second 3.0% cycle the decrease in load capacity became more significant; this was associated with buckling of reinforcement. The stiffness decreased dramatically by the end of the test at 4.0% drift. The most obvious feature of this hysteresis loop is the large pinching behaviour due to shear deformation associated with the closing and opening of diagonal cracks. The hysteresis loops of specimens A2 and D1 have similar features but those of other specimens with reversing plastic hinge (B1 and C1) differ significantly mainly because: (i) they had significantly different strengths in the two directions, which caused the pinching to prevail only in one direction of loading; and (ii) reinforcing bars did not fully yield in the negative direction (in contrast to the design aim) forcing the hysteresis loops to degrade immediately after reaching the peak load.
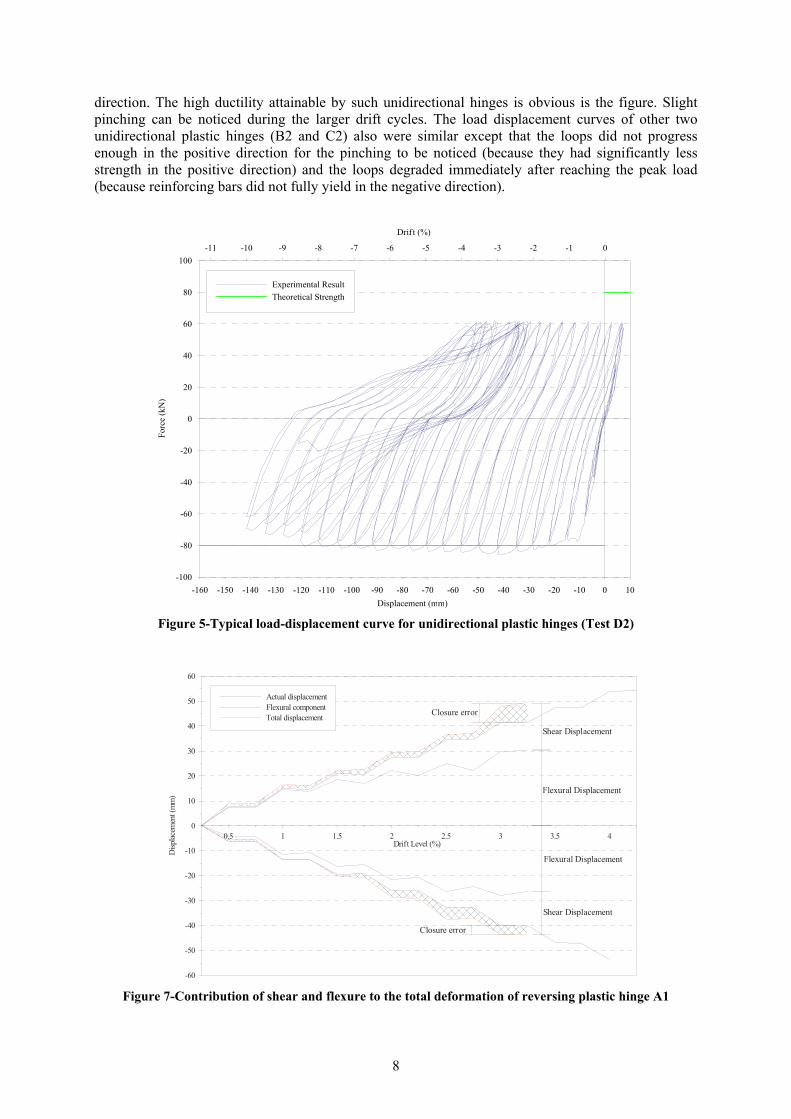
As a typical result of unidirectional plastic hinges, Figure 5 shows the load displacement curve of specimen D2 and its theoretical strength. As aimed, the beam yielded only in the negative loading
8
direction. The high ductility attainable by such unidirectional hinges is obvious is the figure. Slight pinching can be noticed during the larger drift cycles. The load displacement curves of other two unidirectional plastic hinges (B2 and C2) also were similar except that the loops did not progress enough in the positive direction for the pinching to be noticed (because they had significantly less strength in the positive direction) and the loops degraded immediately after reaching the peak load (because reinforcing bars did not fully yield in the negative direction).
-160 -150 -140 -130 -120 -110 -100 -90 -80 -70 -60 -50 -40 -30 -20 -10 0 10Displacement (mm)
-100
-80
-60
-40
-20
0
20
40
60
80
100
Forc
e (k
N)
-11 -10 -9 -8 -7 -6 -5 -4 -3 -2 -1 0
Drif t (%)
Experimental ResultTheoretical Strength
Figure 5-Typical load-displacement curve for unidirectional plastic hinges (Test D2)
-60
-50
-40
-30
-20
-10
0
10
20
30
40
50
60
Disp
lacem
ent(
mm
)
0.5 1 1.5 2 2.5 3 3.5 4Drift Level (%)
Actual displacementFlexural componentTotal displacement
Flexural Displacement
Shear Displacement
Closure error
Flexural Displacement
Shear Displacement
Closure error
Figure 7-Contribution of shear and flexure to the total deformation of reversing plastic hinge A1
9
Figure 6 shows the breakdown of the total displacement applied to specimen A1 into shear and flexural deformations; the measurement error is also estimated. As shear and flexural displacements could not be calculated once appreciable buckling occurred in the longitudinal reinforcement, the figure does not cover the whole range of applied drift. It is obvious from the figure that the total end displacement is dominated by the flexural component, which was the case in all specimens. The percentage contribution of shear deformation increased as the applied displacement increased. At larger displacement cycles (i.e. 3% drift or more) shear deformation accounted for upto 40% of the total deflection. In general, there is a decrease in the flexural displacement in the second cycle compared to the first cycle of the same drift level. As seen in the figure, contribution of shear deformation was equal in both directions of loading in other reversing beams too with the exception of B1. In specimen B1, lack of flexural diagonal cracks during negative loading resulted in significantly less shear deformation during the positive loading because shear slip along diagonal cracks did not exist at all.
-150
-140
-130
-120
-110
-100
-90
-80
-70
-60
-50
-40
-30
-20
-10
0
Disp
lacem
ent(
mm
)
0.5 1 1.5 2 2.5 3 3.5 4 4.5 5 5.5 6 6.5 7 7.5 8 8.5 9 9.5 10 10.5Drift Level (%)
Actual displacementFlexural componentTotal displacement
Flexural Displacement
Shear Displacement
Closure error
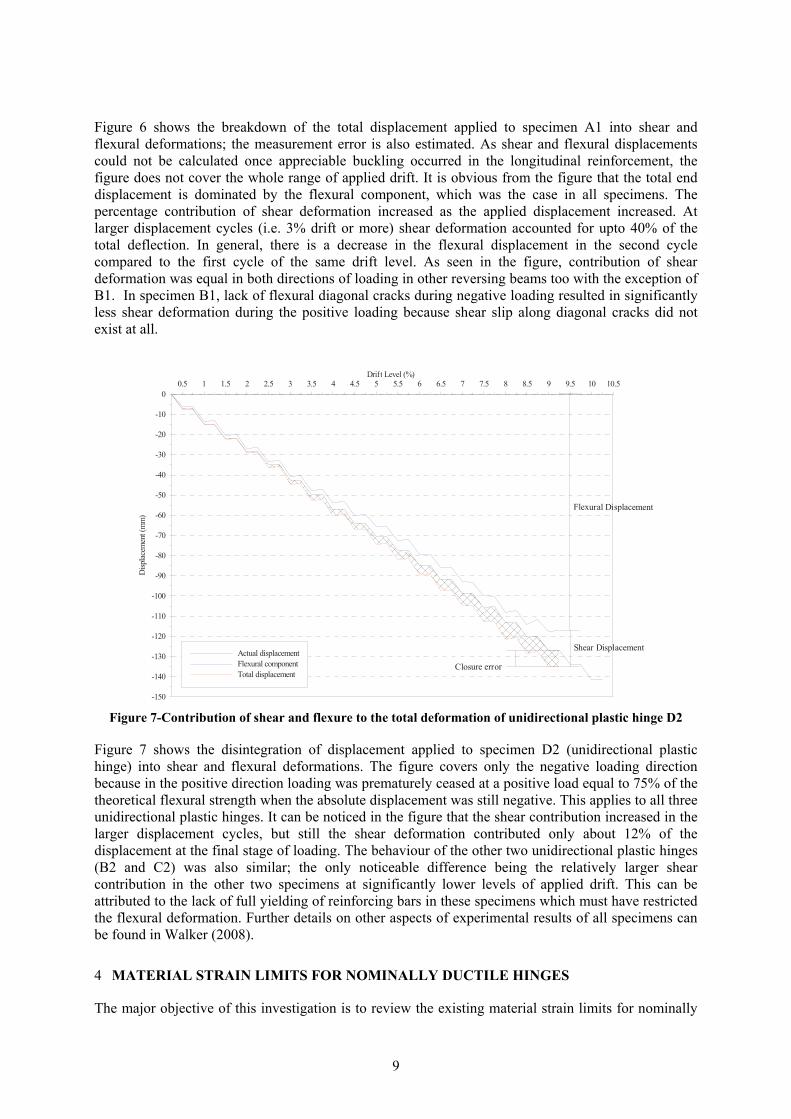
Figure 7-Contribution of shear and flexure to the total deformation of unidirectional plastic hinge D2
Figure 7 shows the disintegration of displacement applied to specimen D2 (unidirectional plastic hinge) into shear and flexural deformations. The figure covers only the negative loading direction because in the positive direction loading was prematurely ceased at a positive load equal to 75% of the theoretical flexural strength when the absolute displacement was still negative. This applies to all three unidirectional plastic hinges. It can be noticed in the figure that the shear contribution increased in the larger displacement cycles, but still the shear deformation contributed only about 12% of the displacement at the final stage of loading. The behaviour of the other two unidirectional plastic hinges (B2 and C2) was also similar; the only noticeable difference being the relatively larger shear contribution in the other two specimens at significantly lower levels of applied drift. This can be attributed to the lack of full yielding of reinforcing bars in these specimens which must have restricted the flexural deformation. Further details on other aspects of experimental results of all specimens can be found in Walker (2008).
4 MATERIAL STRAIN LIMITS FOR NOMINALLY DUCTILE HINGES
The major objective of this investigation is to review the existing material strain limits for nominally
10
ductile beams. Hence, comparisons should be made between the existing material strain limits and those obtained from the tests of the eight beams. In order to compare the existing limits and experimental results they must first be transformed to a comparable measure, which in this case is a curvature. The recommendations by Fenwick and Dhakal (2007b) limit the strain to 0.004 in compression and 0.016 in tension for unidirectional plastic hinges. These limits are reduced to 60% for reversing plastic hinges. The allowable curvature is given by dividing by the distance from the neutral axis to the strain location of interest. The neutral axis depth is calculated using basic section analysis for each individual beam.
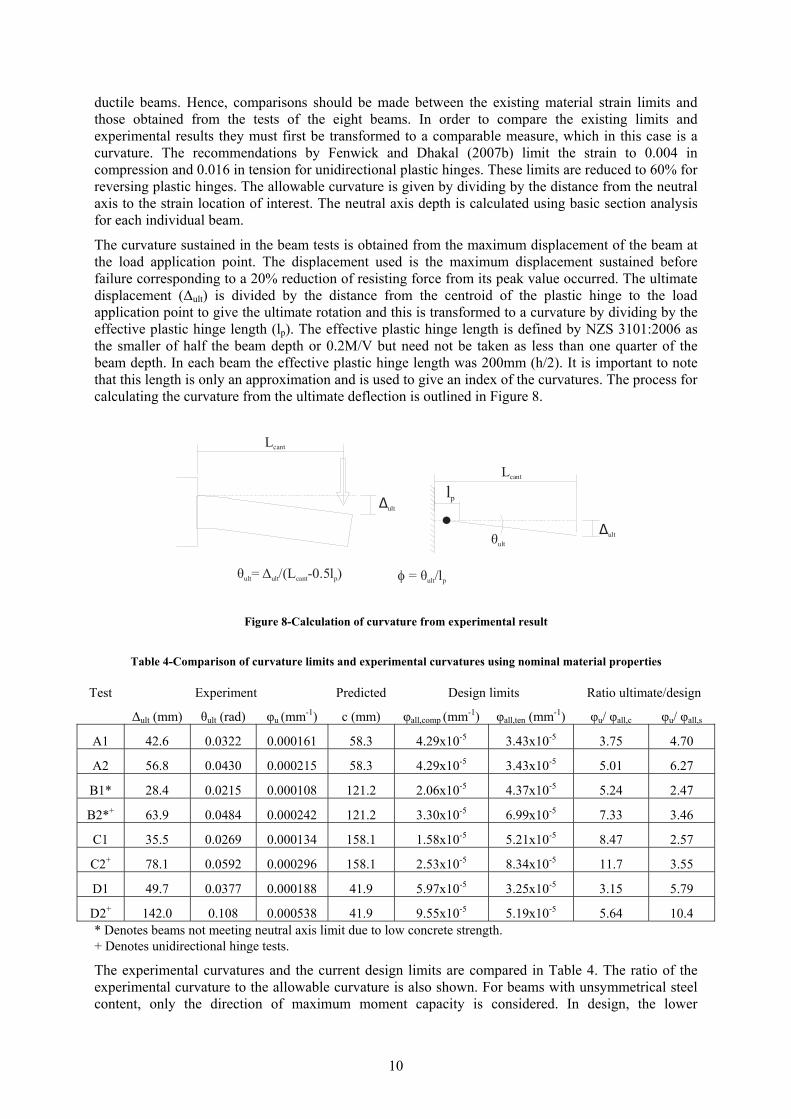
The curvature sustained in the beam tests is obtained from the maximum displacement of the beam at the load application point. The displacement used is the maximum displacement sustained before failure corresponding to a 20% reduction of resisting force from its peak value occurred. The ultimate displacement (∆ult) is divided by the distance from the centroid of the plastic hinge to the load application point to give the ultimate rotation and this is transformed to a curvature by dividing by the effective plastic hinge length (lp). The effective plastic hinge length is defined by NZS 3101:2006 as the smaller of half the beam depth or 0.2M/V but need not be taken as less than one quarter of the beam depth. In each beam the effective plastic hinge length was 200mm (h/2). It is important to note that this length is only an approximation and is used to give an index of the curvatures. The process for calculating the curvature from the ultimate deflection is outlined in Figure 8.
∆ult
Lcant
Lcant
∆ultθult
φ = θ lult/ p
lp
θ lult ult cant/(L -0.5 )p= ∆
Figure 8-Calculation of curvature from experimental result
Table 4-Comparison of curvature limits and experimental curvatures using nominal material properties
Test Experiment Predicted Design limits Ratio ultimate/design
∆ult (mm) θult (rad) φu (mm-1) c (mm) φall,comp (mm-1) φall,ten (mm-1) φu/ φall,c φu/ φall,s
A1 42.6 0.0322 0.000161 58.3 4.29x10⁻⁵ 3.43x10⁻⁵ 3.75 4.70
A2 56.8 0.0430 0.000215 58.3 4.29x10⁻⁵ 3.43x10⁻⁵ 5.01 6.27
B1* 28.4 0.0215 0.000108 121.2 2.06x10⁻⁵ 4.37x10⁻⁵ 5.24 2.47
B2*+ 63.9 0.0484 0.000242 121.2 3.30x10⁻⁵ 6.99x10⁻⁵ 7.33 3.46
C1 35.5 0.0269 0.000134 158.1 1.58x10⁻⁵ 5.21x10⁻⁵ 8.47 2.57
C2+ 78.1 0.0592 0.000296 158.1 2.53x10⁻⁵ 8.34x10⁻⁵ 11.7 3.55
D1 49.7 0.0377 0.000188 41.9 5.97x10⁻⁵ 3.25x10⁻⁵ 3.15 5.79
D2+ 142.0 0.108 0.000538 41.9 9.55x10⁻⁵ 5.19x10⁻⁵ 5.64 10.4 * Denotes beams not meeting neutral axis limit due to low concrete strength. + Denotes unidirectional hinge tests.
The experimental curvatures and the current design limits are compared in Table 4. The ratio of the experimental curvature to the allowable curvature is also shown. For beams with unsymmetrical steel content, only the direction of maximum moment capacity is considered. In design, the lower
11
characteristic material strengths are used. Thus the calculation of the neutral axis depth uses the lower characteristic values rather than the measured values of fy and fc’ when calculating the experimental curvatures and design limits.
For all beams the ratio of experimental ultimate curvature to the design limit is greater than unity. This is not surprising because the limits were set conservatively as little experimental data was available at the time. The ratio is greater for unidirectional tests than for reversing tests in all cases, indicating an excessive conservatism with the unidirectional limits. The results shown in Table 4 indicate that the unidirectional plastic hinges are able to sustain in excess of twice the rotation sustained by corresponding reversing plastic hinges. The ratio of unidirectional to reversing rotation ranged from 2.2 to 2.9 for the three beams tested in this project, which indicates that the current provisions of NZS 3101:2006 (which assume a ratio of 2.0) are conservative. The governing (i.e. lowest) strain (i.e. compressive or tensile) varied between the beams. However, the two units where the concrete compression governed (B and C) were the units with the lowest concrete strength and exhibited only limited or no yielding of the reinforcing bars.
It is evident that the ratio of ultimate curvature to design curvature is particularly high for the limiting concrete strain in the unidirectional tests. For the worst unidirectional case (D2), the ultimate curvature corresponds to a compressive strain of 0.0225; this is more than 5 times the limiting compressive strain (0.004) currently recommended by NZS 3101:2006. Similarly, in all cases the ratio of ultimate to design curvature corresponding to the limiting steel strain is greater than 2.0. These values show that the values currently used in NZS 3101:2006 are overly conservative.
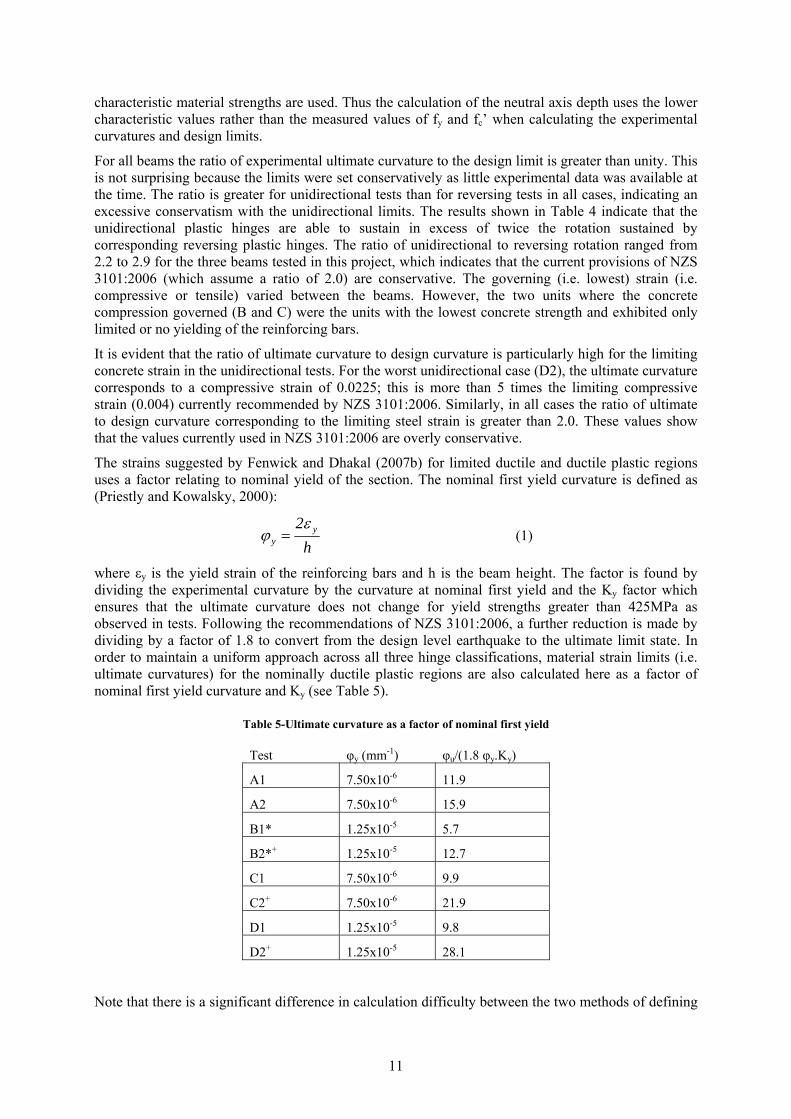
The strains suggested by Fenwick and Dhakal (2007b) for limited ductile and ductile plastic regions uses a factor relating to nominal yield of the section. The nominal first yield curvature is defined as (Priestly and Kowalsky, 2000):
h2 y
y
εϕ = (1)
where εy is the yield strain of the reinforcing bars and h is the beam height. The factor is found by dividing the experimental curvature by the curvature at nominal first yield and the Ky factor which ensures that the ultimate curvature does not change for yield strengths greater than 425MPa as observed in tests. Following the recommendations of NZS 3101:2006, a further reduction is made by dividing by a factor of 1.8 to convert from the design level earthquake to the ultimate limit state. In order to maintain a uniform approach across all three hinge classifications, material strain limits (i.e. ultimate curvatures) for the nominally ductile plastic regions are also calculated here as a factor of nominal first yield curvature and Ky (see Table 5).
Table 5-Ultimate curvature as a factor of nominal first yield
Test φy (mm-1) φu/(1.8 φy.Ky)
A1 7.50x10⁻⁶ 11.9
A2 7.50x10⁻⁶ 15.9
B1* 1.25x10-5 5.7
B2*+ 1.25x10⁻⁵ 12.7
C1 7.50x10⁻⁶ 9.9
C2+ 7.50x10⁻⁶ 21.9
D1 1.25x10⁻⁵ 9.8
D2+ 1.25x10⁻⁵ 28.1
Note that there is a significant difference in calculation difficulty between the two methods of defining
12
the curvature limits (i.e. multiple of first yield curvature and limiting compressive or tensile strains). Deriving the allowable curvature from the strain limitation requires the relatively complex calculation of the neutral axis depth. The alternative is calculating a limiting curvature based on a multiple of the curvature at first yield which only requires a simple calculation of φy using Equation 1. Considering the latter approach is already used for ductile and limited ductile hinges, preference is given to this method when determining the limits for nominally ductile hinges, too.
5 RECOMMENDED MATERIAL STRAIN LIMITS FOR DIFFERENT PLASTIC REGIONS
The NZ Loadings Standard for Earthquake actions (NZS 1170.5:2004) requires appropriate material strain limits to be set for all three classification of plastic region; ductile, limited ductile and nominally ductile. Fenwick and Dhakal (2007b) attempted to increase the confidence with which the material strain limits are set by expanding on the limited database of experiments used at the time of writing the Standard. However, this work was limited by time constraints to readily available literature. No information was obtained for limited ductile or nominally ductile beams. There was also a lack of tests relating to unidirectional plastic hinges. The experimental component of this project dealt with the gap in the literature for tests detailed as nominally ductile beams. This section of the paper reviews the material strain limits proposed by Fenwick and Dhakal (2007b). Additional test results from the literature are added to the database of tests for determining material strain limits. From test results published in the literature and the experimental results of this project, material strain limits are proposed for all forms of potential plastic region.
To gain information for beam plastic hinges Fenwick and Dhakal reviewed results of 37 beam tests. Of these 19 were classified as containing ductile detailing and 18 tests were discarded as they contained details not representative of current practice. In this project, thirteen additional tests including the beams tested as part of this project are included and the updated database is statistically analysed. The additional tests were taken from Fang et al. (1993) and Fang et al. (1994). For columns, no suitable additional tests could be obtained from the literature, and the limiting curvatures calculated by Fenwick and Dhakal (2007b) using 17 test results are adopted without any alteration here.
Two different sets of wall tests were examined by Fenwick and Dhakal, namely thin singly reinforced walls and ductile walls with two layers of reinforcement. The singly reinforced walls were regarded as having limited ductility while the walls with two layers of reinforcing fell into the ductile category. Ultimate curvature values were determined from the results of 20 thin singly reinforced walls. Two additional tests by Salonikios (2001) are incorporated into the database and the results are reanalysed to derive the curvature limits for singly reinforced (i.e. limited ductile) walls. Fenwick and Dhakal also examined results of tests on seven doubly reinforced walls. One additional doubly reinforced wall test has been incorporated into the database from the work by Greifenhagen and Lestuzzi (2005).
It was found that the addition of a boundary element at each end of a wall should increase the axial strain level and hence the curvature that can be sustained. Fenwick and Dhakal (2007b) suggest that on this basis the curvature limit for such walls could be expected to approach the corresponding limit for columns provided the boundary element resists the majority of the compression force in the wall and the boundary element satisfies the appropriate confinement requirements for columns.
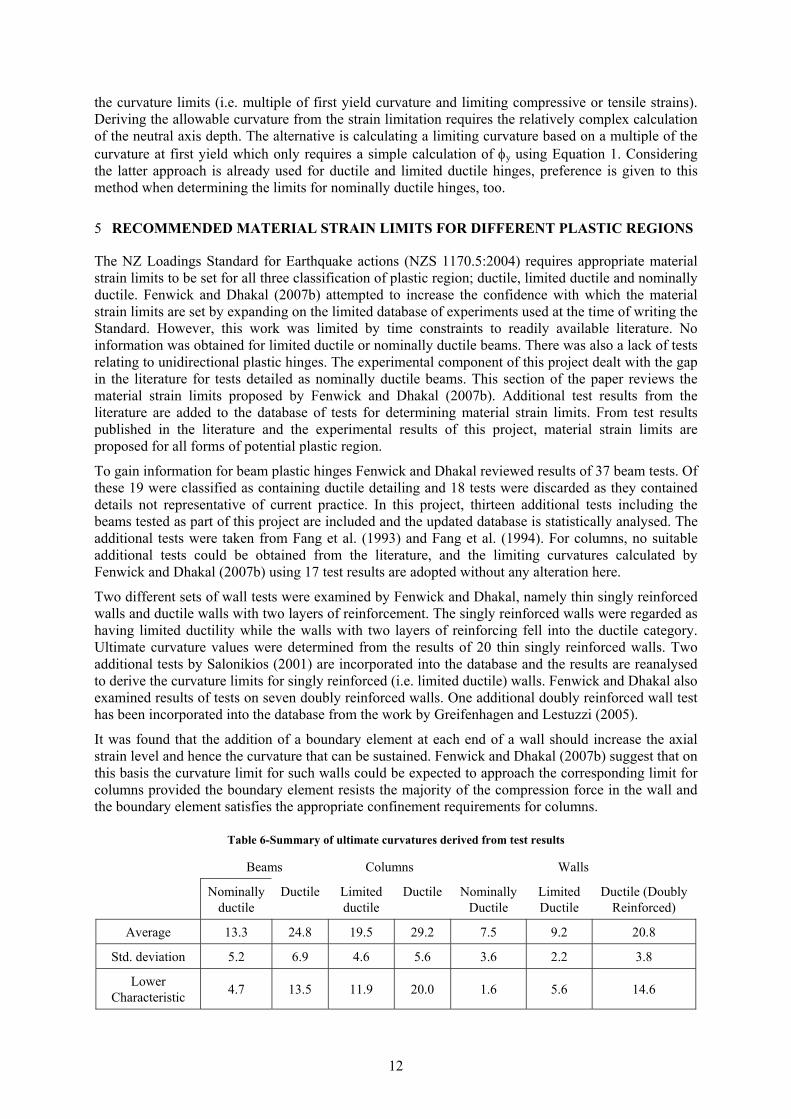
Table 6-Summary of ultimate curvatures derived from test results
Beams Columns Walls
Nominally ductile
Ductile Limited ductile
Ductile Nominally Ductile
Limited Ductile
Ductile (Doubly Reinforced)
Average 13.3 24.8 19.5 29.2 7.5 9.2 20.8
Std. deviation 5.2 6.9 4.6 5.6 3.6 2.2 3.8
Lower Characteristic 4.7 13.5 11.9 20.0 1.6 5.6 14.6
13
Number of units 6 25 7 9 5 17 8
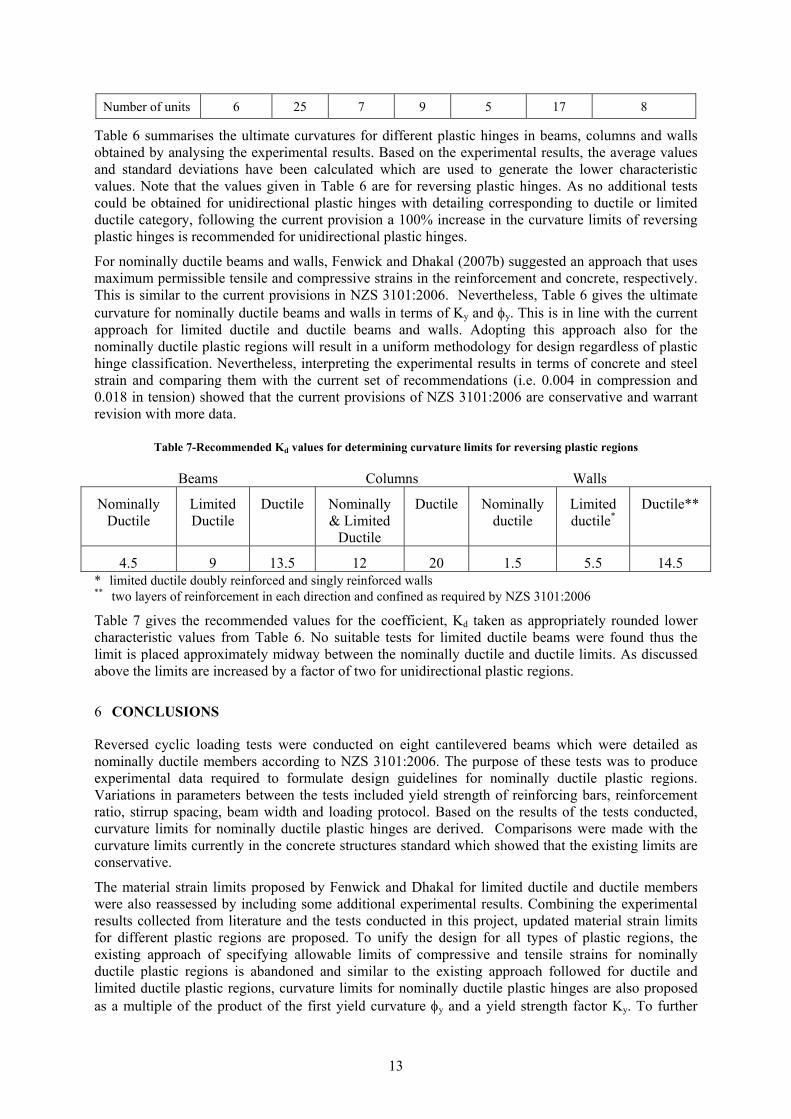
Table 6 summarises the ultimate curvatures for different plastic hinges in beams, columns and walls obtained by analysing the experimental results. Based on the experimental results, the average values and standard deviations have been calculated which are used to generate the lower characteristic values. Note that the values given in Table 6 are for reversing plastic hinges. As no additional tests could be obtained for unidirectional plastic hinges with detailing corresponding to ductile or limited ductile category, following the current provision a 100% increase in the curvature limits of reversing plastic hinges is recommended for unidirectional plastic hinges.
For nominally ductile beams and walls, Fenwick and Dhakal (2007b) suggested an approach that uses maximum permissible tensile and compressive strains in the reinforcement and concrete, respectively. This is similar to the current provisions in NZS 3101:2006. Nevertheless, Table 6 gives the ultimate curvature for nominally ductile beams and walls in terms of Ky and φy. This is in line with the current approach for limited ductile and ductile beams and walls. Adopting this approach also for the nominally ductile plastic regions will result in a uniform methodology for design regardless of plastic hinge classification. Nevertheless, interpreting the experimental results in terms of concrete and steel strain and comparing them with the current set of recommendations (i.e. 0.004 in compression and 0.018 in tension) showed that the current provisions of NZS 3101:2006 are conservative and warrant revision with more data.
Table 7-Recommended Kd values for determining curvature limits for reversing plastic regions
Beams Columns Walls
Nominally Ductile
Limited Ductile
Ductile Nominally & Limited
Ductile
Ductile Nominally ductile
Limited ductile*
Ductile**
4.5 9 13.5 12 20 1.5 5.5 14.5 * limited ductile doubly reinforced and singly reinforced walls ** two layers of reinforcement in each direction and confined as required by NZS 3101:2006
Table 7 gives the recommended values for the coefficient, Kd taken as appropriately rounded lower characteristic values from Table 6. No suitable tests for limited ductile beams were found thus the limit is placed approximately midway between the nominally ductile and ductile limits. As discussed above the limits are increased by a factor of two for unidirectional plastic regions.
6 CONCLUSIONS
Reversed cyclic loading tests were conducted on eight cantilevered beams which were detailed as nominally ductile members according to NZS 3101:2006. The purpose of these tests was to produce experimental data required to formulate design guidelines for nominally ductile plastic regions. Variations in parameters between the tests included yield strength of reinforcing bars, reinforcement ratio, stirrup spacing, beam width and loading protocol. Based on the results of the tests conducted, curvature limits for nominally ductile plastic hinges are derived. Comparisons were made with the curvature limits currently in the concrete structures standard which showed that the existing limits are conservative.
The material strain limits proposed by Fenwick and Dhakal for limited ductile and ductile members were also reassessed by including some additional experimental results. Combining the experimental results collected from literature and the tests conducted in this project, updated material strain limits for different plastic regions are proposed. To unify the design for all types of plastic regions, the existing approach of specifying allowable limits of compressive and tensile strains for nominally ductile plastic regions is abandoned and similar to the existing approach followed for ductile and limited ductile plastic regions, curvature limits for nominally ductile plastic hinges are also proposed as a multiple of the product of the first yield curvature φy and a yield strength factor Ky. To further
14
simplify the process, an approximate value calculated as two times the yielding strain to the beam height ratio is used as an indicative figure for the first yield curvature. This relieves the designers from having to conduct section analysis to estimate neutral axis depth which is otherwise required to calculate the exact value of the first yield curvature.
Although there is now a reasonable range of data for the setting of the material strain limits, an increased number of test results would increase the confidence with which these limits are set. In particular the degree of scatter of the nominally ductile beam tests could be obtained with several more tests detailed to the appropriate specifications. The increase on deformation capacity of unidirectional plastic hinges has been conservatively set as twice the capacity of reversing plastic hinges. The tests carried out in this research indicate that this value could be increased. A series of tests examining the difference between reversing and unidirectional plastic hinges for all levels of detailing could increase the efficiency of this value.
ACKNOWLEDGEMENTS
This research was funded by Earthquake Commission through the biennial project UNI/516. The authors wish to thank EQC for the financial support, without which the study would not have been possible. The authors would also like to thank Prof Richard Fenwick for his valuable suggestion and guidance through this research.
References: Fang I.K, Yen S.T, Wang C.S and Hong K.L, 1993, Cyclic Behaviour of Moderately Deep HSC Beams, Journal
of Structural Engineering, Vol. 119, No. 3, pp 2573-2591.
Fang I.K, Wang C.S and Hong K.L, 1994, Cyclic Behaviour of High Strength Concrete Short Beams with Lower Amount of Flexural Reinforcement, ACI Structural Journal, Vol. 91, No. 1, pp 10-18.
Fenwick R.C. and Davidson B, 1987, Moment Redistribution in Seismic Resistant Concrete Frames, Proceedings of the Pacific Conference for Earthquake Engineering, Wairakei, NZ, Vol 1, pp 95-106.
Fenwick R.C, Dely R and Davidson B, 1999, Ductility Demand for Uni-directional and Reversing Plastic Hinges in Ductile Moment Resisting Frames, Bulletin of the New Zealand Society for Earthquake Engineering, Vol. 32, No. 1, pp 1-12.
Fenwick R.C and Dhakal R.P, 2007a, Material Strains and Relevance to Seismic Design, SESOC Journal, Vol. 20, No. 1, pp 5-12.
Fenwick R.C and Dhakal R.P, 2007b, Material Strain Limits for Seismic Design of Concrete Structures, SESOC Journal, Vol. 20, No. 1, pp 14-28.
Greifenhagen C. and Lestuzzi P, 2005, Static Cyclic Tests on Lightly Reinforced Concrete Shear Walls, Engineering Structures, Vol. 27, No. 11, pp1703-1712.
Priestley M.J.N and Kowalsky M.J, 2000, Direct Displacement Based Design of Concrete Buildings, Bulletin of the New Zealand Society for Earthquake Engineering, Vol. 33, No. 4, pp 421-444.
Salonikios T.N, 2001, Shear Strength and Deformation Patterns of R/C Walls with Aspect Ratio 1.0 and 1.5 Designed to Eurocode 8, Engineering Structures, Vol.24, No. 1, pp 39-49.
SANZ, Concrete Structures Standard, NZS 3101:1995, Standards Association, Wellington, NZ.
SANZ, Concrete Structures Standard, NZS 3101:2006, Standards Association, Wellington, NZ.
SANZ, General Structural Design and Design Loadings for Buildings Standard, NZS 4203:1992, Standards Association, Wellington, NZ.
SANZ, Structural Design Actions, Part 5: Earthquake Actions, New Zealand, NZS 1170.5:2004, Standards Association, Wellington, NZ.
Walker A.W, 2008, Assessment of Material Strain Limits for Defining Different Forms of Plastic Regions in Concrete Structures, Masters Thesis, University of Canterbury, Christchurch, NZ.
Zhao J and Sritharan S, 2007, Modelling of Strain Penetration Effects in Fibre-Based Analysis of Reinforced Concrete Structures, ACI Structural Journal, Vol. 104, No. 2, pp 133-141.

15