Embed Size (px)
Citation preview
13 December 2014
1 of 29
Background to the PFRA European Overview – UC10508
The individual Member State Reports reflect the situation as reported
by the Member States to the European Commission in 2014
The situation in the MSs may have altered since then
Assessment of Flood Hazard and Flood Risk Maps
Member State Report: SK - Slovakia
Date that the assessment was completed: 13 December 2014
Information reported and assessed
The schemas for electronically reporting/making information available to the Commission were filled in
with a detailed level of information. Slovakia made available links to its national flood risk and flood
hazard maps for its 2 units of management. Detailed summaries were also provided on the methods
used to prepare the maps and specific details of national maps for visualisation at the European level
were also reported. No links to other relevant information on the preparation of the maps were
provided.
This report is structured according to a questionnaire that was completed for all Member States that
reported on their flood hazard and risk maps. Questions 2 and 3 of the questionnaire were answered
on the basis of a qualitative check of a subset of the Member State’s flood hazard and flood risk maps
located on national servers and/or web pages. All other questions (question 1 and questions 4 to 11)
were answered on the basis of an assessment of numeric and summary information reported by the
Member State on the methods used in the preparation of their maps. The report does not include in-
depth assessment of national background methodological reports which may have been referenced in
the Member State’s reports and/or provided with their electronic reports.
This report includes information on what the Member State has included/considered or not
included/considered in its flood risk and hazard maps and their development. This is a presentation of
the facts on the electronic information reported to WISE by Member States and does not discuss
which elements are mandatory according to the Directive and which are optional.
Main outcomes of the assessment
a) Good practices adopted: Same UoM were used as those for river basin management
planning. All APSFRs were included in the FHRM schema. The legend of the flood hazard
and flood risk maps is self-explanatory; it is easy to work with the maps.
b) Weaknesses: All floods are assessed in total i.e. there is no difference made on the maps
between flood sources and flood mechanisms. The indication of consequences of floods on
the status of water bodies are missing. Information about impacts on cultural heritage is also
missing. No information on areas vulnerable to floods with a high content of transported
sediment and debris flows was provided.
The SK Authorities subsequently stated that the mathematical models used for the
preparation of the maps integrated all the relevant flood sources, mechanisms and
characteristics that had been identified in the preliminary flood risk assessment.
c) Lessons to be learnt: The application of a map scale more detailed than 1:50,000 should be
reconsidered in future.
d) Questions seeking clarification from Member State:

13 December 2014
2 of 29
• Why is information on impacts on local governance and public administration,
emergency response, education, health and social work facilities (such as hospitals)
not explicitly provided in the map even though this information was used within the
methodology to determine, for each flood scenario, the type of economic activity
affected?
• Why is information on property not provided on the flood risk map?
• Why are the consequences on the status of water bodies missing?
• Why is information about impacts on cultural heritage missing on the flood risk map?
• Why is no information provided on areas vulnerable to floods with a high content of
transported sediment and debris flows?
After the assessment of the flood risk and hazard maps was completed, the SK authorities responded
to the above questions, providing the following information.
The maps do show areas of civic amenities (local governance and public administration, emergency
response, education, health and social work facilities (such as hospitals)), urban areas used for living
and manufacturing areas (i.e. information on property). However, it is acknowledged that the visibility
in the portal is poor. The colours used to depict these areas are not clear at the most detailed scale of
the maps.
Separate modelling of flood impacts on status/potential of water bodies was not made due to the
position of the Water Framework Directive in Article 4.6 “Temporary deterioration in the status of
bodies of water shall not be in breach of the requirements of this Directive if this is the result of
circumstances of natural cause or force majeure which are exceptional or could not reasonably have
been foreseen, in particular extreme floods and prolonged droughts, or the result of circumstances
due to accidents which could not reasonably have been foreseen”.
A geodatabase of cultural heritage was not available in the Slovak Republic at the time of the
assessments. The background geodatabase includes data of historical buildings, but does not include
a definition of historical significance.
An evaluation of areas vulnerable to floods with a high content of transported sediments and debris
flows was done based on expert judgement on a background geodatabase and no territories (gravel
and timer stocks) were identified as relevant within the PFRA and relevant for mapping in overlapping
geographical areas.
13 December 2014
3 of 29
Mapping of areas of potential significant flood risk
Question 1: What are the reasons reported in the FHRM schema for the non-inclusion of some
APSFRs, elements or aspects in the flood hazard and flood risk maps?
All APSFRs were included in the FHRM schema. Information on impacts on local governance
and public administration, emergency response, education, health and social work facilities
(such as hospitals) was not explicitly provided in the map even though this information was
used within the methodology to determine, for each flood scenario, the type of economic
activity affected. Information on property was not provided. The consequences on the status
of water bodies are missing. Information about impacts on cultural heritage are missing. No
information on areas vulnerable to floods with a high content of transported sediment and
debris flows was provided. All floods were assessed together; no difference is shown on the
maps between flood sources and flood mechanisms.
Subsequent to the assessment, the SK authorities provided a reaction to the above
paragraph, which is shown under part d) of the main outcomes of the assessment (above).
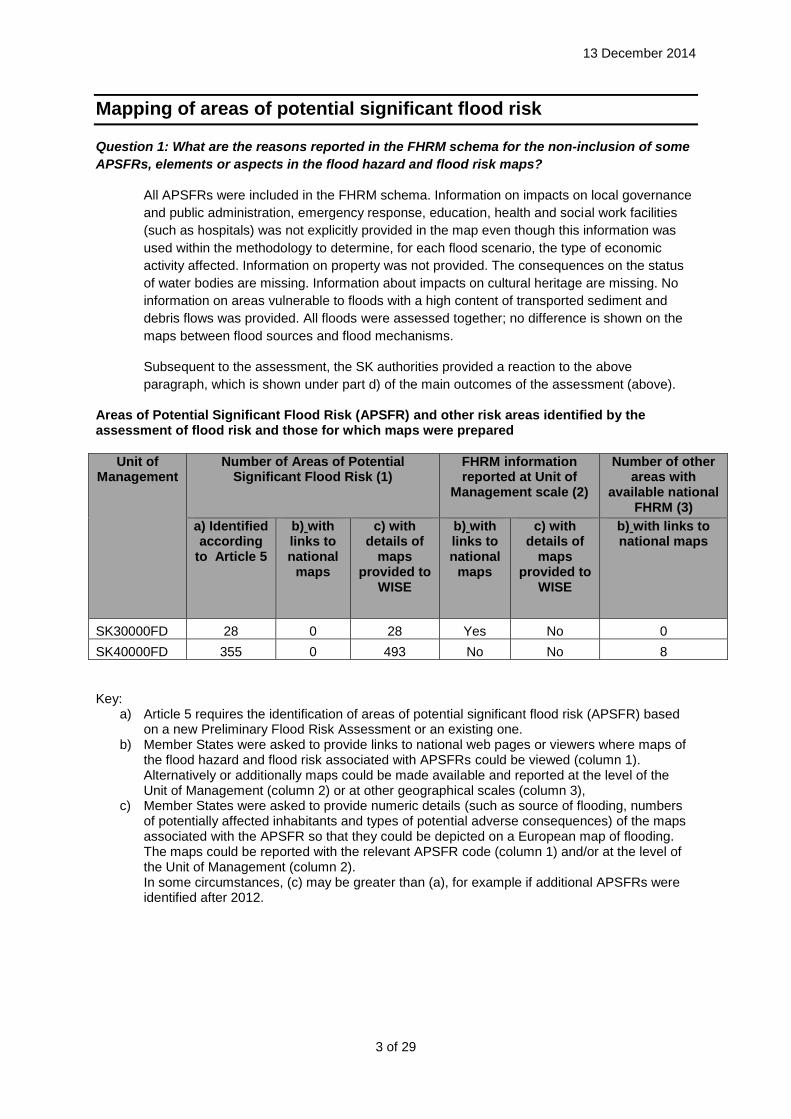
Areas of Potential Significant Flood Risk (APSFR) and other risk areas identified by the assessment of flood risk and those for which maps were prepared
Unit of Management
Number of Areas of Potential Significant Flood Risk (1)
FHRM information reported at Unit of
Management scale (2)
Number of other areas with
available national FHRM (3)
a) Identified according
to Article 5
b) with links to national
maps
c) with details of
maps provided to
WISE
b) with links to national
maps
c) with details of
maps provided to
WISE
b) with links to national maps
SK30000FD 28 0 28 Yes No 0
SK40000FD 355 0 493 No No 8
Key: a) Article 5 requires the identification of areas of potential significant flood risk (APSFR) based
on a new Preliminary Flood Risk Assessment or an existing one. b) Member States were asked to provide links to national web pages or viewers where maps of
the flood hazard and flood risk associated with APSFRs could be viewed (column 1). Alternatively or additionally maps could be made available and reported at the level of the Unit of Management (column 2) or at other geographical scales (column 3),
c) Member States were asked to provide numeric details (such as source of flooding, numbers of potentially affected inhabitants and types of potential adverse consequences) of the maps associated with the APSFR so that they could be depicted on a European map of flooding. The maps could be reported with the relevant APSFR code (column 1) and/or at the level of the Unit of Management (column 2). In some circumstances, (c) may be greater than (a), for example if additional APSFRs were identified after 2012.
13 December 2014
4 of 29
Content of flood hazard and flood risk maps
Note: Not all of the maps prepared by Member States have been examined. Instead a subset was selected and reviewed by designated assessors.
The maps for checking were selected on the basis of information provided by Member States with their Preliminary Flood Risk Assessments (PFRAs) in 2012 (where available) and the screening of the maps made available in the “LinkToMS” schema. The aim was to select a sufficient number of maps to reflect:
Potential differences in methodologies, presentation and visualisation of maps between the Units of Management (UoM) within a Member State. Some Member States have a strong national approach, in others there are differences between administrative regions;
Differences in sources of floods included in hazard and risk maps. Some APSFRs and UoM are associated with more than one source of flooding whereas others are not. The aim was to check maps associated with all possible types of flood associated with a Member State. For those Member States applying Article 4 and Article 13.1.a the selection of relevant flood types can be informed from the reporting of APSFR in March 2012;
Differences in the Articles applied across a Member State and within UoMs. Whilst some Member States have applied only one Article across their whole territory and for all flood types, others have applied different Articles within a UoM and also according to flood types.
The application of Article 13.1.b and Article 13.2 by some Member States in at least some of their UoMs. In these cases Member States may have provided UoM codes, other area codes or both: in these cases it was the flood maps associated with the areas that were checked. The objective was to check examples of maps within the linked areas in relation to all potential and relevant sources of flooding and that may have been mapped.”
Links to national web pages where examples of national maps can be viewed are given below.
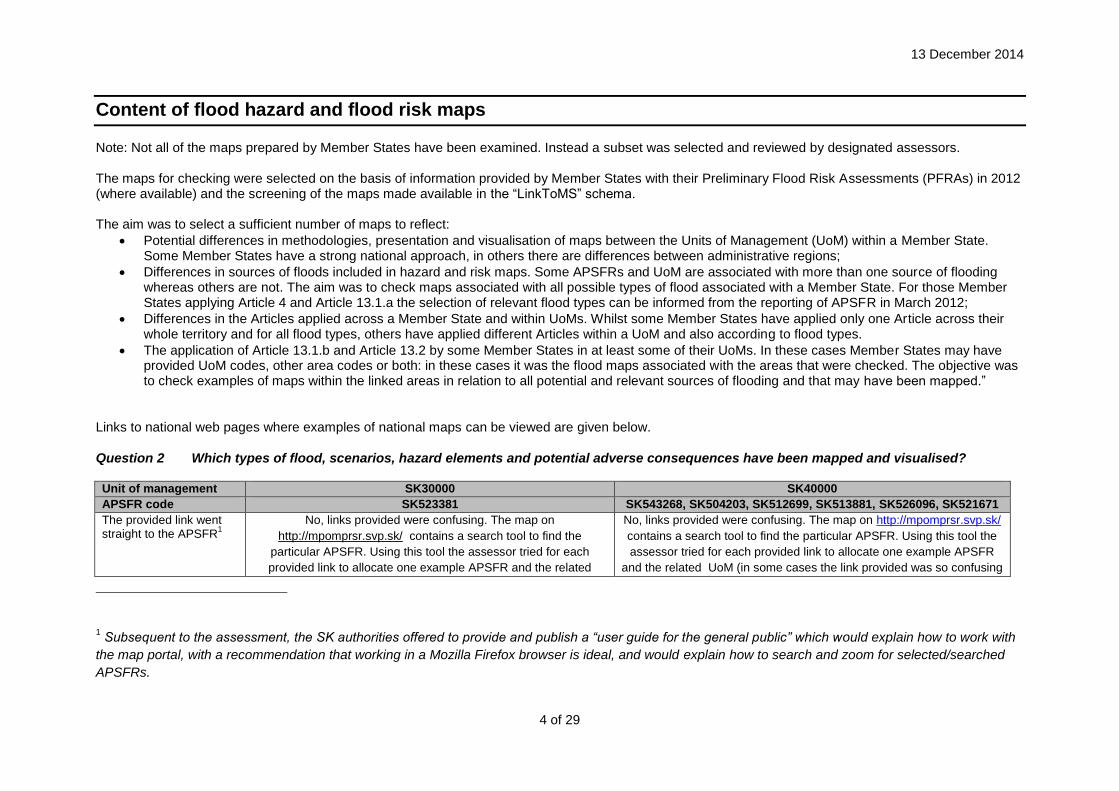
Question 2 Which types of flood, scenarios, hazard elements and potential adverse consequences have been mapped and visualised?
Unit of management SK30000 SK40000
APSFR code SK523381 SK543268, SK504203, SK512699, SK513881, SK526096, SK521671
The provided link went straight to the APSFR
1
No, links provided were confusing. The map on
http://mpomprsr.svp.sk/ contains a search tool to find the
particular APSFR. Using this tool the assessor tried for each
provided link to allocate one example APSFR and the related
No, links provided were confusing. The map on http://mpomprsr.svp.sk/
contains a search tool to find the particular APSFR. Using this tool the
assessor tried for each provided link to allocate one example APSFR
and the related UoM (in some cases the link provided was so confusing
1 Subsequent to the assessment, the SK authorities offered to provide and publish a “user guide for the general public” which would explain how to work with
the map portal, with a recommendation that working in a Mozilla Firefox browser is ideal, and would explain how to search and zoom for selected/searched
APSFRs.
13 December 2014
5 of 29
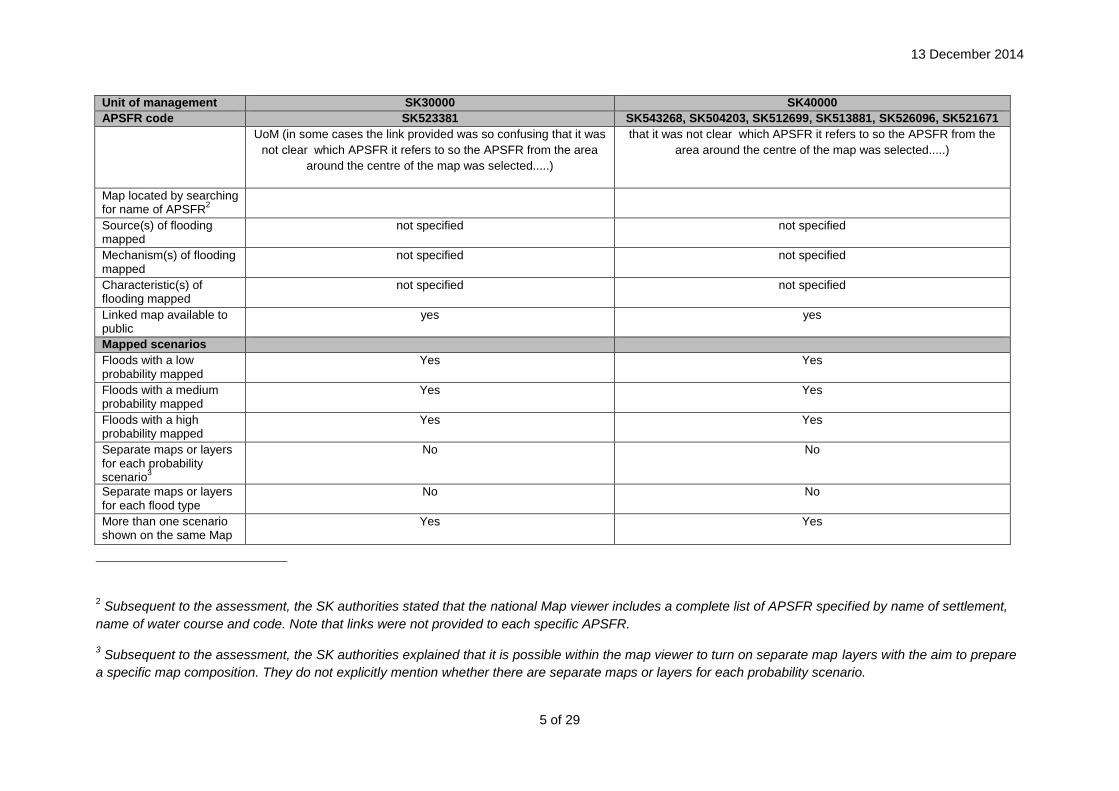
Unit of management SK30000 SK40000
APSFR code SK523381 SK543268, SK504203, SK512699, SK513881, SK526096, SK521671
UoM (in some cases the link provided was so confusing that it was
not clear which APSFR it refers to so the APSFR from the area
around the centre of the map was selected.....)
that it was not clear which APSFR it refers to so the APSFR from the
area around the centre of the map was selected.....)
Map located by searching for name of APSFR
2
Source(s) of flooding mapped
not specified not specified
Mechanism(s) of flooding mapped
not specified not specified
Characteristic(s) of flooding mapped
not specified not specified
Linked map available to public
yes yes
Mapped scenarios
Floods with a low probability mapped
Yes Yes
Floods with a medium probability mapped
Yes Yes
Floods with a high probability mapped
Yes Yes
Separate maps or layers for each probability scenario
3
No No
Separate maps or layers for each flood type
No No
More than one scenario shown on the same Map
Yes Yes
2 Subsequent to the assessment, the SK authorities stated that the national Map viewer includes a complete list of APSFR specified by name of settlement,
name of water course and code. Note that links were not provided to each specific APSFR.
3 Subsequent to the assessment, the SK authorities explained that it is possible within the map viewer to turn on separate map layers with the aim to prepare
a specific map composition. They do not explicitly mention whether there are separate maps or layers for each probability scenario.
13 December 2014
6 of 29
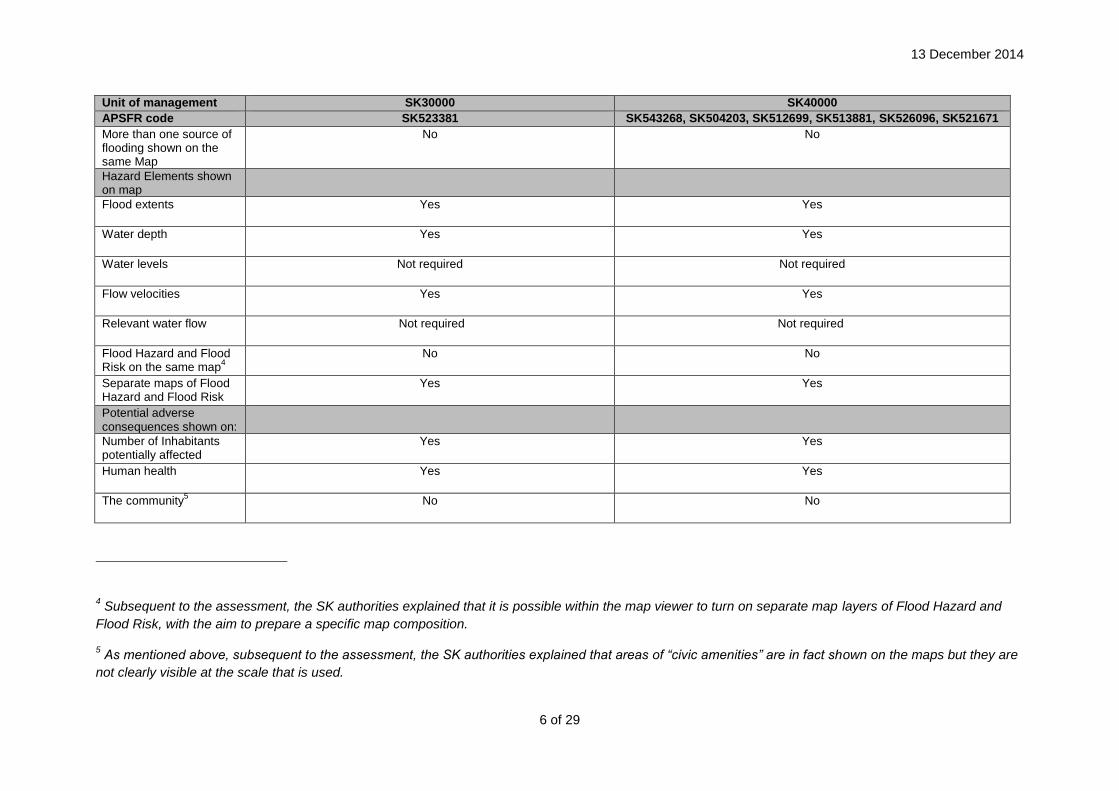
Unit of management SK30000 SK40000
APSFR code SK523381 SK543268, SK504203, SK512699, SK513881, SK526096, SK521671
More than one source of flooding shown on the same Map
No No
Hazard Elements shown on map
Flood extents Yes Yes
Water depth Yes Yes
Water levels Not required Not required
Flow velocities Yes Yes
Relevant water flow Not required Not required
Flood Hazard and Flood Risk on the same map
4
No No
Separate maps of Flood Hazard and Flood Risk
Yes Yes
Potential adverse consequences shown on:
Number of Inhabitants potentially affected
Yes Yes
Human health Yes Yes
The community5 No No
4 Subsequent to the assessment, the SK authorities explained that it is possible within the map viewer to turn on separate map layers of Flood Hazard and
Flood Risk, with the aim to prepare a specific map composition.
5 As mentioned above, subsequent to the assessment, the SK authorities explained that areas of “civic amenities” are in fact shown on the maps but they are
not clearly visible at the scale that is used.
13 December 2014
7 of 29
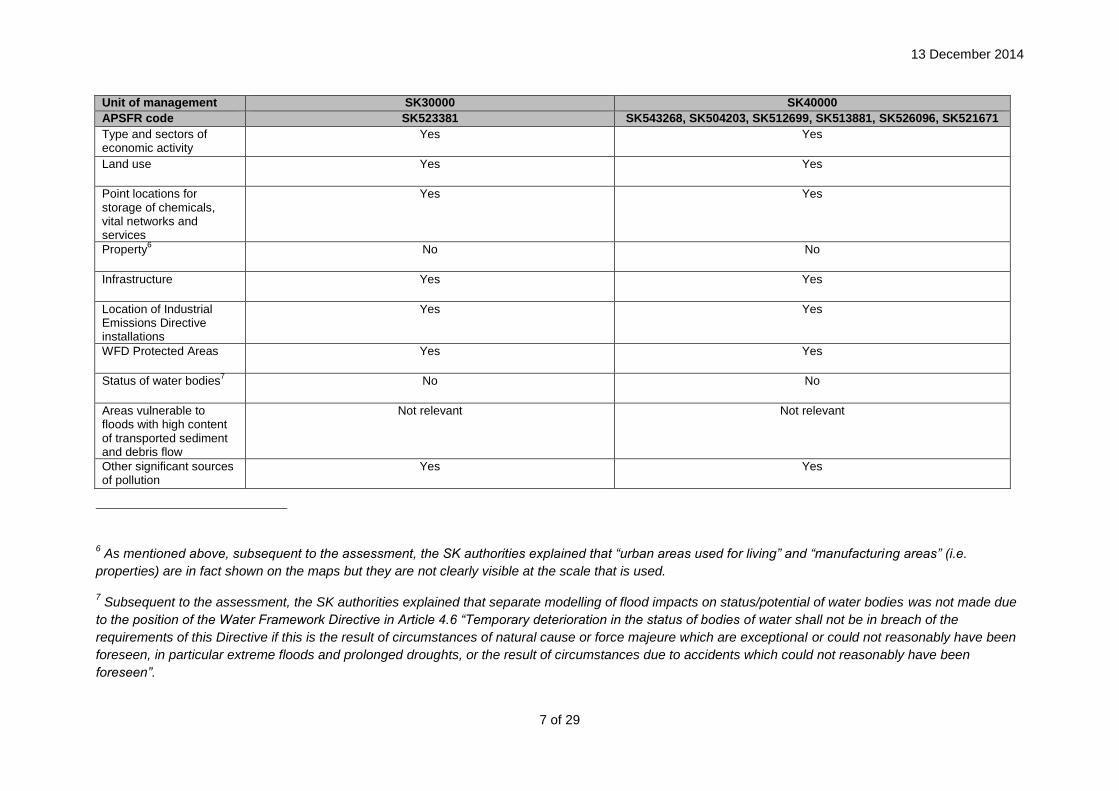
Unit of management SK30000 SK40000
APSFR code SK523381 SK543268, SK504203, SK512699, SK513881, SK526096, SK521671
Type and sectors of economic activity
Yes Yes
Land use Yes Yes
Point locations for storage of chemicals, vital networks and services
Yes Yes
Property6 No No
Infrastructure Yes Yes
Location of Industrial Emissions Directive installations
Yes Yes
WFD Protected Areas Yes Yes
Status of water bodies7 No No
Areas vulnerable to floods with high content of transported sediment and debris flow
Not relevant Not relevant
Other significant sources of pollution
Yes Yes
6 As mentioned above, subsequent to the assessment, the SK authorities explained that “urban areas used for living” and “manufacturing areas” (i.e.
properties) are in fact shown on the maps but they are not clearly visible at the scale that is used.
7 Subsequent to the assessment, the SK authorities explained that separate modelling of flood impacts on status/potential of water bodies was not made due
to the position of the Water Framework Directive in Article 4.6 “Temporary deterioration in the status of bodies of water shall not be in breach of the
requirements of this Directive if this is the result of circumstances of natural cause or force majeure which are exceptional or could not reasonably have been
foreseen, in particular extreme floods and prolonged droughts, or the result of circumstances due to accidents which could not reasonably have been
foreseen”.
13 December 2014
8 of 29
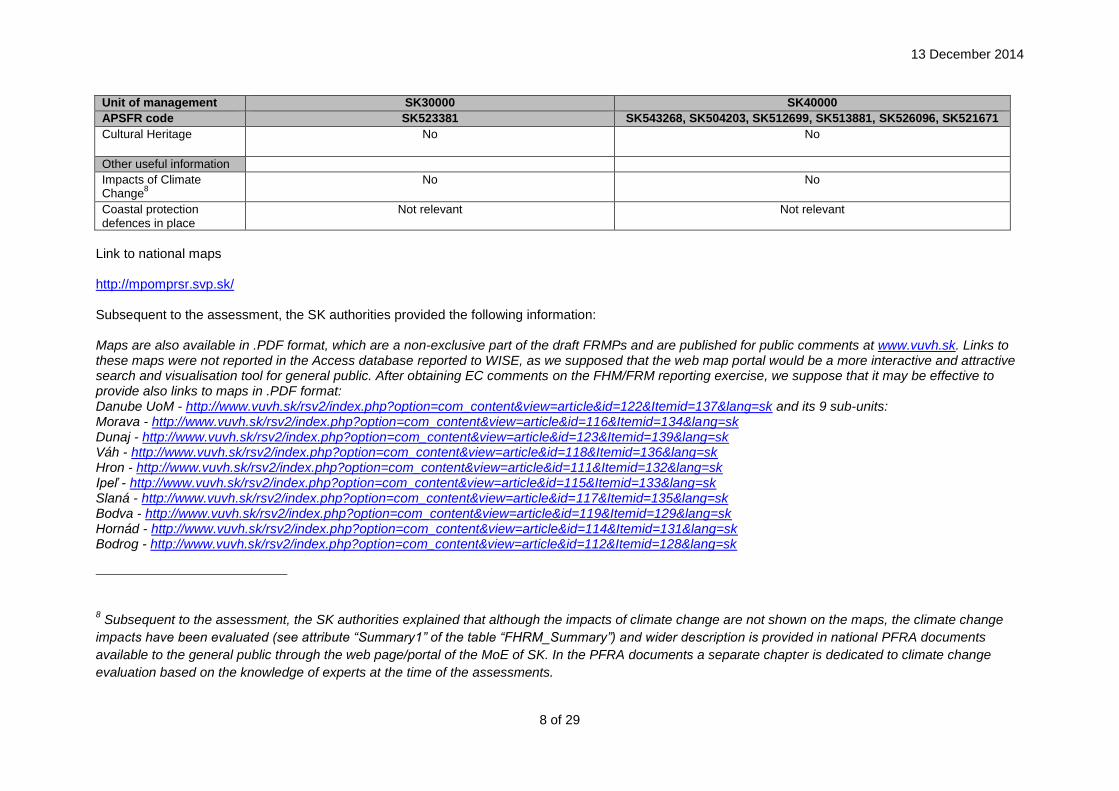
Unit of management SK30000 SK40000
APSFR code SK523381 SK543268, SK504203, SK512699, SK513881, SK526096, SK521671
Cultural Heritage No No
Other useful information
Impacts of Climate Change
8
No No
Coastal protection defences in place
Not relevant Not relevant
Link to national maps http://mpomprsr.svp.sk/ Subsequent to the assessment, the SK authorities provided the following information: Maps are also available in .PDF format, which are a non-exclusive part of the draft FRMPs and are published for public comments at www.vuvh.sk. Links to these maps were not reported in the Access database reported to WISE, as we supposed that the web map portal would be a more interactive and attractive search and visualisation tool for general public. After obtaining EC comments on the FHM/FRM reporting exercise, we suppose that it may be effective to provide also links to maps in .PDF format: Danube UoM - http://www.vuvh.sk/rsv2/index.php?option=com_content&view=article&id=122&Itemid=137&lang=sk and its 9 sub-units: Morava - http://www.vuvh.sk/rsv2/index.php?option=com_content&view=article&id=116&Itemid=134&lang=sk Dunaj - http://www.vuvh.sk/rsv2/index.php?option=com_content&view=article&id=123&Itemid=139&lang=sk Váh - http://www.vuvh.sk/rsv2/index.php?option=com_content&view=article&id=118&Itemid=136&lang=sk Hron - http://www.vuvh.sk/rsv2/index.php?option=com_content&view=article&id=111&Itemid=132&lang=sk Ipeľ - http://www.vuvh.sk/rsv2/index.php?option=com_content&view=article&id=115&Itemid=133&lang=sk Slaná - http://www.vuvh.sk/rsv2/index.php?option=com_content&view=article&id=117&Itemid=135&lang=sk Bodva - http://www.vuvh.sk/rsv2/index.php?option=com_content&view=article&id=119&Itemid=129&lang=sk Hornád - http://www.vuvh.sk/rsv2/index.php?option=com_content&view=article&id=114&Itemid=131&lang=sk Bodrog - http://www.vuvh.sk/rsv2/index.php?option=com_content&view=article&id=112&Itemid=128&lang=sk
8 Subsequent to the assessment, the SK authorities explained that although the impacts of climate change are not shown on the maps, the climate change
impacts have been evaluated (see attribute “Summary1” of the table “FHRM_Summary”) and wider description is provided in national PFRA documents
available to the general public through the web page/portal of the MoE of SK. In the PFRA documents a separate chapter is dedicated to climate change
evaluation based on the knowledge of experts at the time of the assessments.
13 December 2014
9 of 29
Vistula UoM - http://www.vuvh.sk/rsv2/index.php?option=com_content&view=article&id=121&Itemid=138&lang=sk and its 1 sub-units: Dunajec a Poprad - http://www.vuvh.sk/rsv2/index.php?option=com_content&view=article&id=113&Itemid=130&lang=sk

13 December 2014
10 of 29
Contextual information provided with maps
Question 3 What contextual information was generally provided with the maps?
Unit of Management SK30000 SK40000
APSFR code SK523381 SK543268, SK504203, SK512699, SK513881, SK526096, SK521671
Title: brief description of the map Yes Yes
Explanation to the public on how to understand and interpret the flood maps Yes Yes
Responsible authority (organisation responsible for the development and publishing of the maps, with contact details)
Yes Yes
Date of preparation / publication Yes Yes
Legend (textual description of symbols, colours, line features, etc.) Yes Yes
Purpose of development and intended use Yes Yes
Method of development9 No No
Limitations of map and / or assessment of uncertainty No No
Disclaimer (to enforce explanatory information and limitations, and provide legal protection to the responsible authority against adverse consequences of misuse)
Yes Yes
North and scale: preferably using scale bar as this allows for changes in page size Yes Yes
Scope and detail of the explanatory information: should be appropriate to the intended audience Yes Yes
Intended audience & complexity: Maps intended for public use should be simple and self-explanatory and include a clear legend, such that as little supporting or explanatory information as possible is required for correct interpretation.
Yes Yes
9 Subsequent to the assessment, the SK authorities explained that the detailed methodology was not made available to the public because it was considered
to be too technical and would therefore be confusing to the general public.

13 December 2014
11 of 29
Summary of findings from questions 2 and 3.
The flood risk and hazard maps are publicly available on http://mpomprsr.svp.sk/. There are
separate map layers for hazard maps and for risk maps. The map can be zoomed from
1:50,000 to 1:2,000,000 and it contains a search tool to find the particular APSFR for which
the hazard and risk information is available. The same approach was used for all UoMs The
hazard maps show five scenarios (Q5, Q10, Q50, Q100, Q1000) on the same map (clickable
– the user can select the number of the scenario(s)). For each scenario water depth, flood
extent and flow velocity can be viewed.
The risk maps contain information about:
Indicative number of inhabitants potentially affected which is based on the ratio of the
inundated and total area;
Economic activity in potentially affected area (residence areas, infrastructure,
industry, recreation, agriculture, forestry, boring rig, water tank, granary/silo,
stockyard);
Locations for abstraction of water used for drinking water supply and reservoirs used
for drinking water supply;
Significant pollution sources including Seveso areas and dumping sites;
Location of bathing waters and recreational areas;
Location of power generation and transport;
Location of transport infrastructure; and
Location of potentially affected WFD protected areas including Natura 2000 sites.
The legend of the map is self-explanatory; no further special explanation to the public on how
to understand and interpret the flood maps was provided. Use of a scale bar allows for
changes in page size. A disclaimer is given providing copyright to the responsible authorities.
Information about organisations responsible for the development and publishing of the maps
and the date of preparation / publication with contact details is provided in the Copyright
section. In the legend the textual description of symbols, colours, line features is provided. In
general, maps are simple and self-explanatory and include a clear legend.
The following gaps were identified:
Information on impacts on local governance and public administration, emergency
response, education, health and social work facilities (such as hospitals) is not
explicitly provided in the map even though this information was used within the
methodology to determine, for each flood scenario, the type of economic activity
affected;
Information on property is not provided;
The consequences on the status of water bodies are missing;
Information about impacts on cultural heritage are missing; and
No information on areas vulnerable to floods with a high content of transported
sediment and debris flows is provided.
After the assessment of the flood risk and hazard maps was completed, the SK authorities provided
the following information.
The maps do show areas of civic amenities (local governance and public administration, emergency
response, education, health and social work facilities (such as hospitals)), urban areas used for living
and manufacturing areas (i.e. information on property). However, it is acknowledged that the visibility

13 December 2014
12 of 29
in the portal is poor. The colours used to depict these areas are not clear at the most detailed scale of
the maps.
Separate modelling of flood impacts on status/potential of water bodies was not made due to the
position of the Water Framework Directive in Article 4.6 “Temporary deterioration in the status of
bodies of water shall not be in breach of the requirements of this Directive if this is the result of
circumstances of natural cause or force majeure which are exceptional or could not reasonably have
been foreseen, in particular extreme floods and prolonged droughts, or the result of circumstances
due to accidents which could not reasonably have been foreseen”.
A geodatabase of cultural heritage was not available in the Slovak Republic at the time of the
assessments. The background geodatabase includes data of historical buildings, but does not include
a definition of historical significance.
An evaluation of areas vulnerable to floods with a high content of transported sediments and debris
flows was done based on expert judgement on a background geodatabase and no territories (gravel
and timer stocks) were identified as relevant within the PFRA and relevant for mapping in overlapping
geographical areas.
13 December 2014
13 of 29
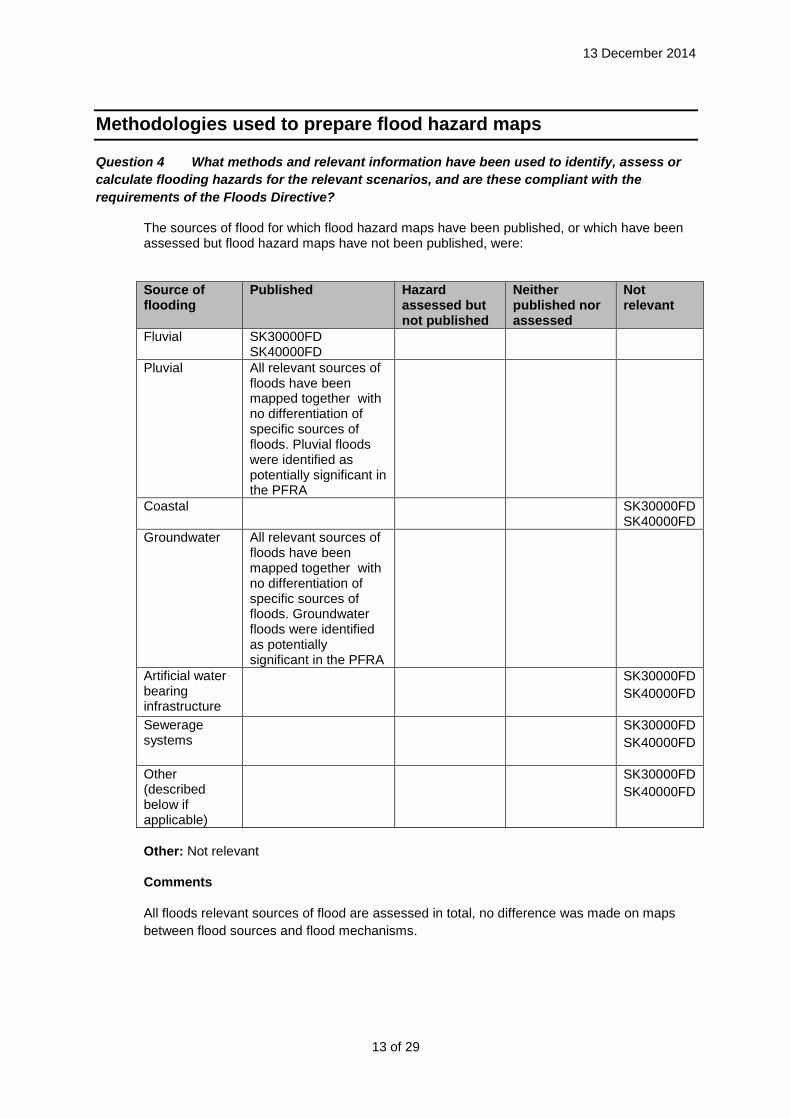
Methodologies used to prepare flood hazard maps
Question 4 What methods and relevant information have been used to identify, assess or
calculate flooding hazards for the relevant scenarios, and are these compliant with the
requirements of the Floods Directive?
The sources of flood for which flood hazard maps have been published, or which have been assessed but flood hazard maps have not been published, were:
Source of flooding
Published Hazard assessed but not published
Neither published nor assessed
Not relevant
Fluvial SK30000FD SK40000FD
Pluvial All relevant sources of floods have been mapped together with no differentiation of specific sources of floods. Pluvial floods were identified as potentially significant in the PFRA
Coastal SK30000FD SK40000FD
Groundwater All relevant sources of floods have been mapped together with no differentiation of specific sources of floods. Groundwater floods were identified as potentially significant in the PFRA
Artificial water bearing infrastructure
SK30000FD
SK40000FD
Sewerage systems
SK30000FD
SK40000FD
Other (described below if applicable)
SK30000FD
SK40000FD
Other: Not relevant
Comments
All floods relevant sources of flood are assessed in total, no difference was made on maps
between flood sources and flood mechanisms.
13 December 2014
14 of 29
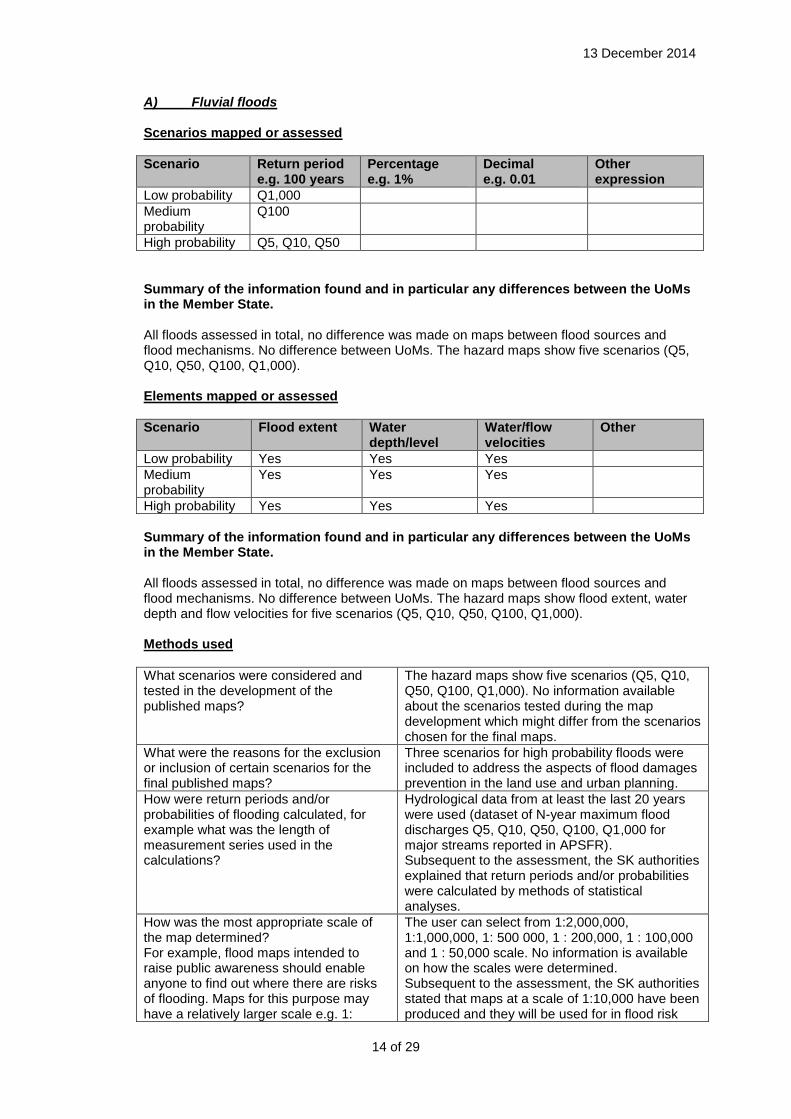
A) Fluvial floods
Scenarios mapped or assessed
Scenario Return period e.g. 100 years
Percentage e.g. 1%
Decimal e.g. 0.01
Other expression
Low probability Q1,000
Medium probability
Q100
High probability Q5, Q10, Q50
Summary of the information found and in particular any differences between the UoMs in the Member State. All floods assessed in total, no difference was made on maps between flood sources and flood mechanisms. No difference between UoMs. The hazard maps show five scenarios (Q5, Q10, Q50, Q100, Q1,000). Elements mapped or assessed
Scenario Flood extent Water depth/level
Water/flow velocities
Other
Low probability Yes Yes Yes
Medium probability
Yes Yes Yes
High probability Yes Yes Yes
Summary of the information found and in particular any differences between the UoMs in the Member State. All floods assessed in total, no difference was made on maps between flood sources and flood mechanisms. No difference between UoMs. The hazard maps show flood extent, water depth and flow velocities for five scenarios (Q5, Q10, Q50, Q100, Q1,000). Methods used
What scenarios were considered and tested in the development of the published maps?
The hazard maps show five scenarios (Q5, Q10, Q50, Q100, Q1,000). No information available about the scenarios tested during the map development which might differ from the scenarios chosen for the final maps.
What were the reasons for the exclusion or inclusion of certain scenarios for the final published maps?
Three scenarios for high probability floods were included to address the aspects of flood damages prevention in the land use and urban planning.
How were return periods and/or probabilities of flooding calculated, for example what was the length of measurement series used in the calculations?
Hydrological data from at least the last 20 years were used (dataset of N-year maximum flood discharges Q5, Q10, Q50, Q100, Q1,000 for major streams reported in APSFR). Subsequent to the assessment, the SK authorities explained that return periods and/or probabilities were calculated by methods of statistical analyses.
How was the most appropriate scale of the map determined? For example, flood maps intended to raise public awareness should enable anyone to find out where there are risks of flooding. Maps for this purpose may have a relatively larger scale e.g. 1:
The user can select from 1:2,000,000, 1:1,000,000, 1: 500 000, 1 : 200,000, 1 : 100,000 and 1 : 50,000 scale. No information is available on how the scales were determined. Subsequent to the assessment, the SK authorities stated that maps at a scale of 1:10,000 have been produced and they will be used for in flood risk
13 December 2014
15 of 29
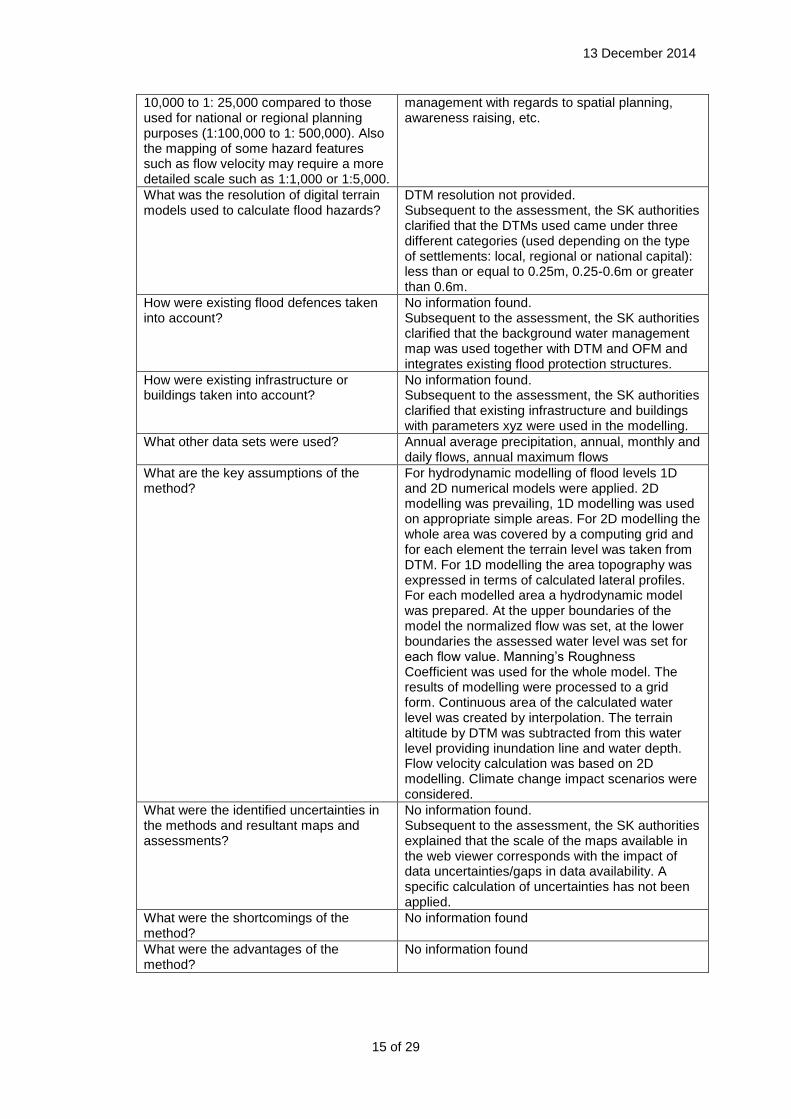
10,000 to 1: 25,000 compared to those used for national or regional planning purposes (1:100,000 to 1: 500,000). Also the mapping of some hazard features such as flow velocity may require a more detailed scale such as 1:1,000 or 1:5,000.
management with regards to spatial planning, awareness raising, etc.
What was the resolution of digital terrain models used to calculate flood hazards?
DTM resolution not provided. Subsequent to the assessment, the SK authorities clarified that the DTMs used came under three different categories (used depending on the type of settlements: local, regional or national capital): less than or equal to 0.25m, 0.25-0.6m or greater than 0.6m.
How were existing flood defences taken into account?
No information found. Subsequent to the assessment, the SK authorities clarified that the background water management map was used together with DTM and OFM and integrates existing flood protection structures.
How were existing infrastructure or buildings taken into account?
No information found. Subsequent to the assessment, the SK authorities clarified that existing infrastructure and buildings with parameters xyz were used in the modelling.
What other data sets were used? Annual average precipitation, annual, monthly and daily flows, annual maximum flows
What are the key assumptions of the method?
For hydrodynamic modelling of flood levels 1D and 2D numerical models were applied. 2D modelling was prevailing, 1D modelling was used on appropriate simple areas. For 2D modelling the whole area was covered by a computing grid and for each element the terrain level was taken from DTM. For 1D modelling the area topography was expressed in terms of calculated lateral profiles. For each modelled area a hydrodynamic model was prepared. At the upper boundaries of the model the normalized flow was set, at the lower boundaries the assessed water level was set for each flow value. Manning’s Roughness Coefficient was used for the whole model. The results of modelling were processed to a grid form. Continuous area of the calculated water level was created by interpolation. The terrain altitude by DTM was subtracted from this water level providing inundation line and water depth. Flow velocity calculation was based on 2D modelling. Climate change impact scenarios were considered.
What were the identified uncertainties in the methods and resultant maps and assessments?
No information found. Subsequent to the assessment, the SK authorities explained that the scale of the maps available in the web viewer corresponds with the impact of data uncertainties/gaps in data availability. A specific calculation of uncertainties has not been applied.
What were the shortcomings of the method?
No information found
What were the advantages of the method?
No information found
13 December 2014
16 of 29
B) Pluvial floods
Note: All floods assessed in total, no difference on maps made between flood sources and flood mechanisms. Subsequent to the assessment, the SK authorities explained that the delineated areas of fluvial floods include areas where floods are caused by other sources of flooding. This is in order to ensure the clarity of the maps.
C) Coastal floods
Note: Not relevant.
D) Groundwater floods
Note: All floods assessed in total, no difference on maps made between flood sources and flood mechanisms. Subsequent to the assessment, the SK authorities explained that the delineated areas of fluvial floods include areas where floods are caused by other sources of flooding. This is in order to ensure the clarity of the maps. E) Floods from Artificial Water Bearing Infrastructure
Note: Not relevant. F) Floods from sewerage systems
Note: Not relevant. G). Other types of floods
Note: Not relevant.
13 December 2014
17 of 29
Methodologies used to prepare flood risk maps
Question 5 What methods and relevant information have been used to prepare flood risk
maps? Which potential adverse consequences are reported and how have they been identified
and presented in flood risk maps?
a) Risk to human health
Indicative number of inhabitants potentially affected is based on the ratio of the inundated and total area. It is presented on the map as the ratio of affected inhabitants to the total number of inhabitants in the basic residence unit.
b) Risk to economic activity
The type of economic activities on the areas potentially affected by floods was determined based on the available GIS database. A wide variety of objects were applied (administration, cultural, transport, industrial, energy, recreational, health). No further methodological details provided. Risk is indicated on the map by areas of economic activities and by storage areas in the inundation area.
c) Risk to Installations covered by the requirements of the Industrial Emissions
Directive (IED) or previously under the IPPC Directive
The number of affected installations was determined as the intersection of the installations geodatabase and the inundation area. The risk is presented on the map by indicating SEVESO areas, storage areas, significant pollution sources and environmental loads. The number of affected installations which might cause accidental pollution in case of flooding was determined as the intersection of the geodatabase of these installations and the inundation area. No further explanation provided
d) Risk to WFD protected areas
Number of affected protected areas was determined as the intersection of the geodatabase of protected areas and the inundation area. The map shows the protected areas overlaps with inundation areas.
e) Other consequences considered
None identified.
13 December 2014
18 of 29
Justification for applying Article 6.6
Question 6 What are the justifications for applying Article 6.6 (coastal areas), if applied,
and how has it been determined that an adequate level of protection is in place against coastal
floods?
Article 6(6) has not been applied in any UoM in Slovakia, as there are no coastlines.
Justification for applying Article 6.7
Question 7 What are the justifications for applying Article 6.7 (groundwater floods), if
applied?
Article 6(7) has not been applied in any UoM in Slovakia.

13 December 2014
19 of 29
Application of Article 13.1.b in accordance with requirements of the
Floods Directive
Question 8 Have the flood hazard maps and flood risk maps been prepared in accordance
with the relevant provisions of the Floods Directive where Article 13.1.b has been applied?
The Slovak Republic officially informed the European Commission in letter No. CZA 1347/2014 of 25
th April 2014 that flood hazard maps and flood risk maps were developed for
29 areas in compliance with Article 13.1.b (APSFR Codes: SK524140; SK524395; SK524778; SK525120; SK524565; SK525006; SK525146; SK524981; SK525235; SK525405; SK524140; SK521663; SK522155; SK521639; SK521817; SK522082; SK522031; SK521345; SK582514; SK599981; SK521558; SK521736; SK521299; SK522261; SK521388; SK522104; SK521973; SK559687; SK580252). The SK authorities state that all of those areas are presented in a map viewer with all attributes according to Article 6 of the Flood Directive. The maps developed for these areas have not been assessed.
13 December 2014
20 of 29
Compliance of the use of Article 13.2 with the requirements of
Article 6
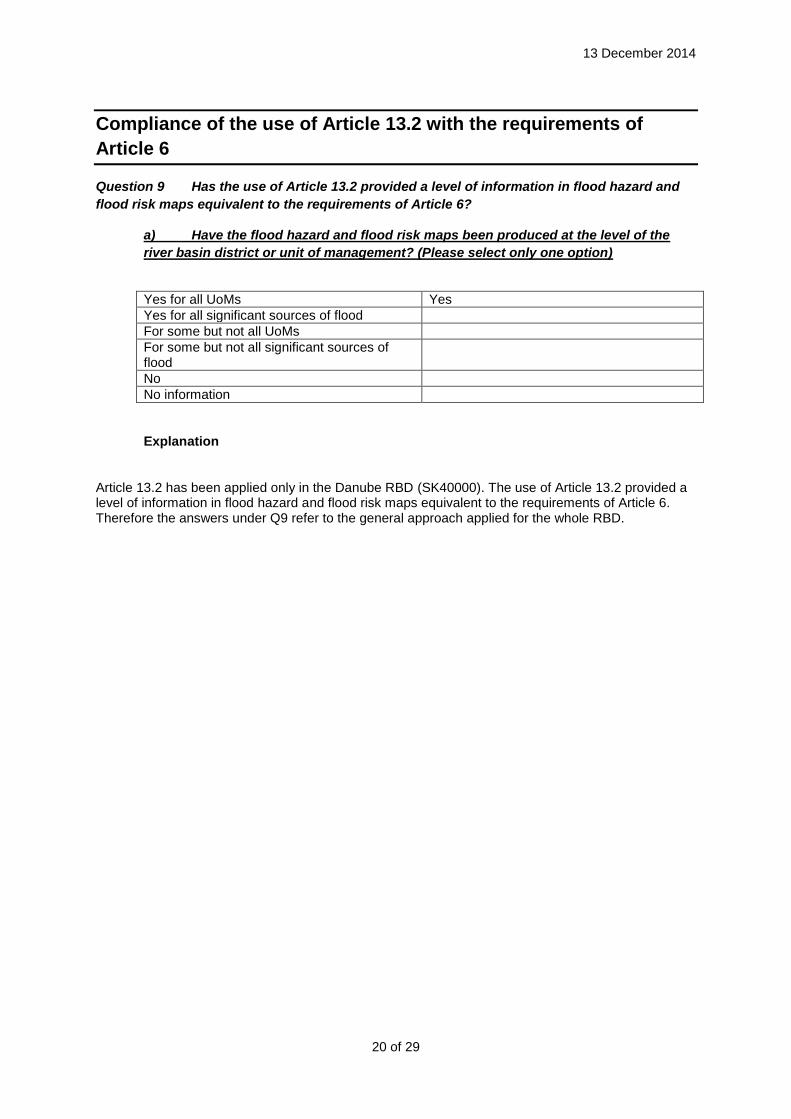
Question 9 Has the use of Article 13.2 provided a level of information in flood hazard and
flood risk maps equivalent to the requirements of Article 6?
a) Have the flood hazard and flood risk maps been produced at the level of the
river basin district or unit of management? (Please select only one option)
Yes for all UoMs Yes
Yes for all significant sources of flood
For some but not all UoMs
For some but not all significant sources of flood
No
No information
Explanation
Article 13.2 has been applied only in the Danube RBD (SK40000). The use of Article 13.2 provided a level of information in flood hazard and flood risk maps equivalent to the requirements of Article 6. Therefore the answers under Q9 refer to the general approach applied for the whole RBD.
13 December 2014
21 of 29
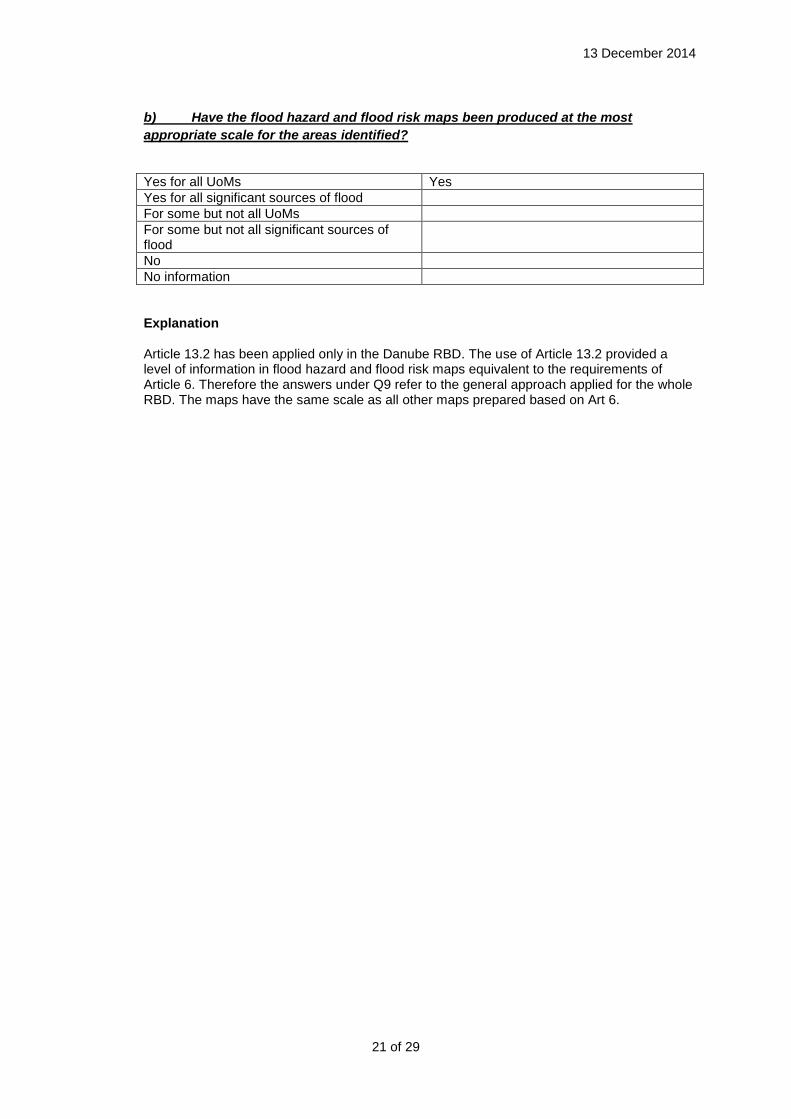
b) Have the flood hazard and flood risk maps been produced at the most
appropriate scale for the areas identified?
Yes for all UoMs Yes
Yes for all significant sources of flood
For some but not all UoMs
For some but not all significant sources of flood
No
No information
Explanation Article 13.2 has been applied only in the Danube RBD. The use of Article 13.2 provided a level of information in flood hazard and flood risk maps equivalent to the requirements of Article 6. Therefore the answers under Q9 refer to the general approach applied for the whole RBD. The maps have the same scale as all other maps prepared based on Art 6.
13 December 2014
22 of 29
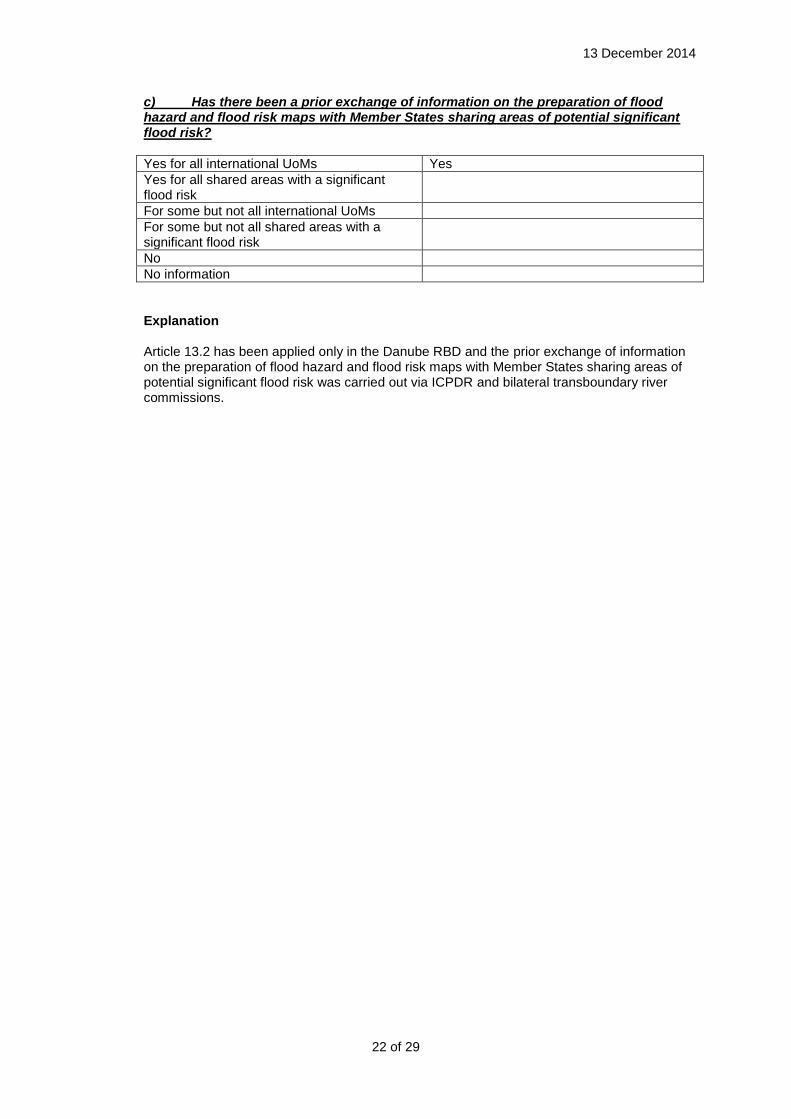
c) Has there been a prior exchange of information on the preparation of flood hazard and flood risk maps with Member States sharing areas of potential significant flood risk?
Yes for all international UoMs Yes
Yes for all shared areas with a significant flood risk
For some but not all international UoMs
For some but not all shared areas with a significant flood risk
No
No information
Explanation
Article 13.2 has been applied only in the Danube RBD and the prior exchange of information on the preparation of flood hazard and flood risk maps with Member States sharing areas of potential significant flood risk was carried out via ICPDR and bilateral transboundary river commissions.
13 December 2014
23 of 29
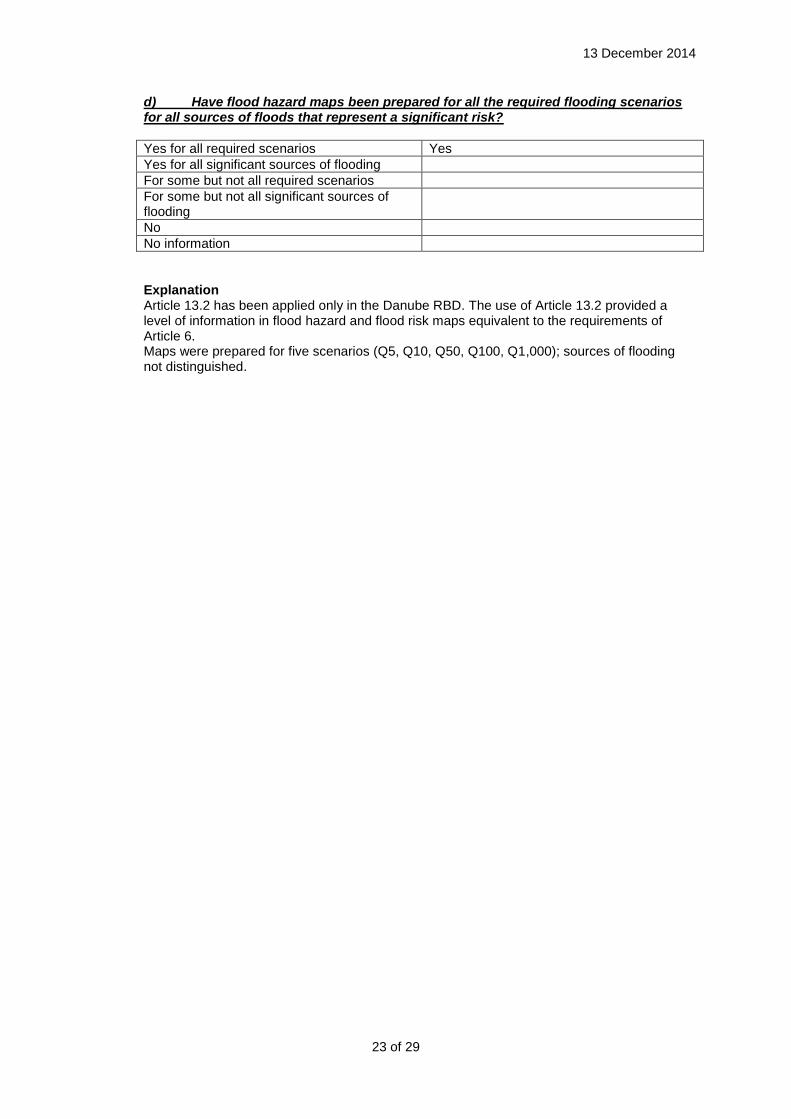
d) Have flood hazard maps been prepared for all the required flooding scenarios for all sources of floods that represent a significant risk?
Yes for all required scenarios Yes
Yes for all significant sources of flooding
For some but not all required scenarios
For some but not all significant sources of flooding
No
No information
Explanation Article 13.2 has been applied only in the Danube RBD. The use of Article 13.2 provided a level of information in flood hazard and flood risk maps equivalent to the requirements of Article 6. Maps were prepared for five scenarios (Q5, Q10, Q50, Q100, Q1,000); sources of flooding not distinguished.
13 December 2014
24 of 29
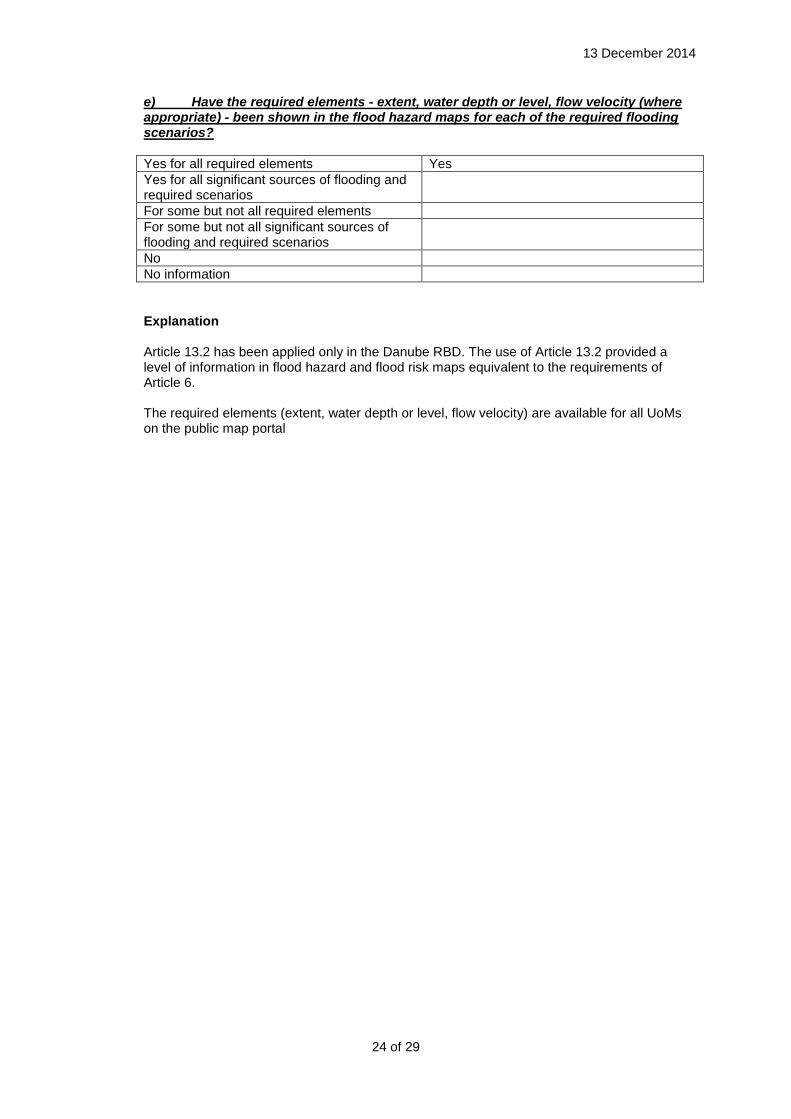
e) Have the required elements - extent, water depth or level, flow velocity (where appropriate) - been shown in the flood hazard maps for each of the required flooding scenarios?
Yes for all required elements Yes
Yes for all significant sources of flooding and required scenarios
For some but not all required elements
For some but not all significant sources of flooding and required scenarios
No
No information
Explanation
Article 13.2 has been applied only in the Danube RBD. The use of Article 13.2 provided a level of information in flood hazard and flood risk maps equivalent to the requirements of Article 6. The required elements (extent, water depth or level, flow velocity) are available for all UoMs on the public map portal
13 December 2014
25 of 29
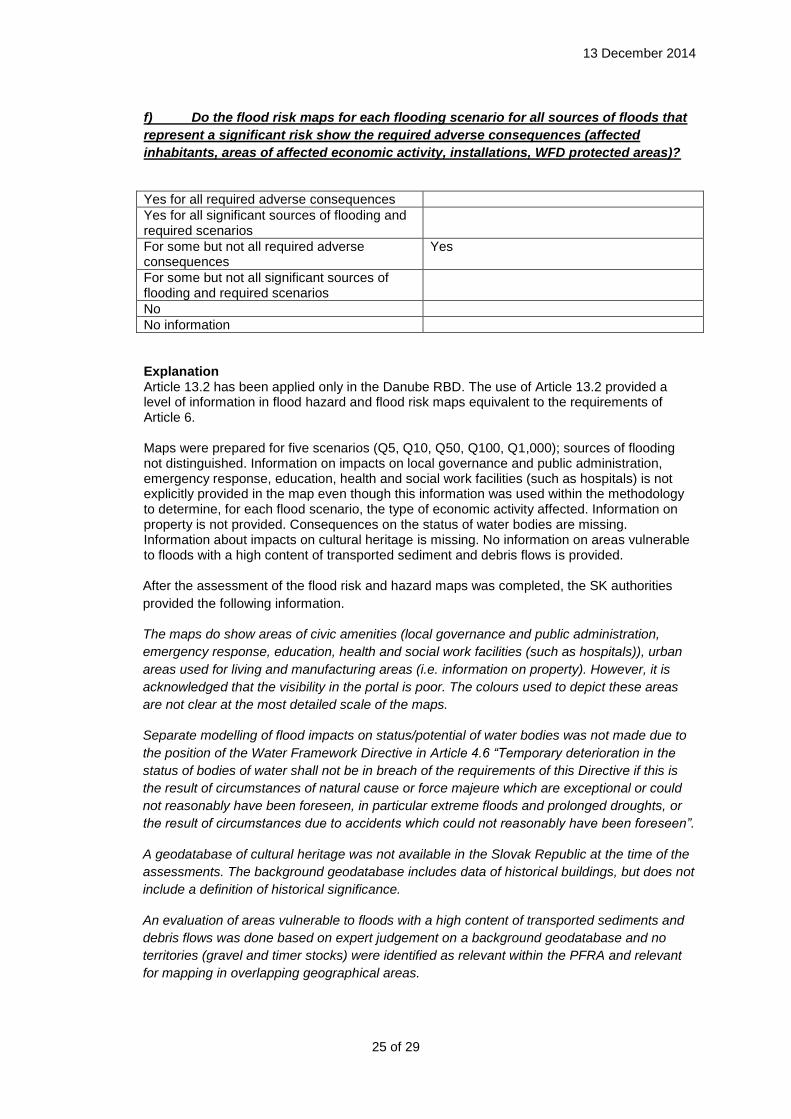
f) Do the flood risk maps for each flooding scenario for all sources of floods that
represent a significant risk show the required adverse consequences (affected
inhabitants, areas of affected economic activity, installations, WFD protected areas)?
Yes for all required adverse consequences
Yes for all significant sources of flooding and required scenarios
For some but not all required adverse consequences
Yes
For some but not all significant sources of flooding and required scenarios
No
No information
Explanation Article 13.2 has been applied only in the Danube RBD. The use of Article 13.2 provided a level of information in flood hazard and flood risk maps equivalent to the requirements of Article 6. Maps were prepared for five scenarios (Q5, Q10, Q50, Q100, Q1,000); sources of flooding not distinguished. Information on impacts on local governance and public administration, emergency response, education, health and social work facilities (such as hospitals) is not explicitly provided in the map even though this information was used within the methodology to determine, for each flood scenario, the type of economic activity affected. Information on property is not provided. Consequences on the status of water bodies are missing. Information about impacts on cultural heritage is missing. No information on areas vulnerable to floods with a high content of transported sediment and debris flows is provided. After the assessment of the flood risk and hazard maps was completed, the SK authorities
provided the following information.
The maps do show areas of civic amenities (local governance and public administration,
emergency response, education, health and social work facilities (such as hospitals)), urban
areas used for living and manufacturing areas (i.e. information on property). However, it is
acknowledged that the visibility in the portal is poor. The colours used to depict these areas
are not clear at the most detailed scale of the maps.
Separate modelling of flood impacts on status/potential of water bodies was not made due to
the position of the Water Framework Directive in Article 4.6 “Temporary deterioration in the
status of bodies of water shall not be in breach of the requirements of this Directive if this is
the result of circumstances of natural cause or force majeure which are exceptional or could
not reasonably have been foreseen, in particular extreme floods and prolonged droughts, or
the result of circumstances due to accidents which could not reasonably have been foreseen”.
A geodatabase of cultural heritage was not available in the Slovak Republic at the time of the
assessments. The background geodatabase includes data of historical buildings, but does not
include a definition of historical significance.
An evaluation of areas vulnerable to floods with a high content of transported sediments and
debris flows was done based on expert judgement on a background geodatabase and no
territories (gravel and timer stocks) were identified as relevant within the PFRA and relevant
for mapping in overlapping geographical areas.
13 December 2014
26 of 29
g) Has Article 6.6 been applied and maps produced for an extreme flooding event
scenario in coastal waters where there is an adequate level of protection in place?
Note: not relevant.
h) Has Article 6.7 been applied and maps produced for an extreme flooding event
scenario for groundwater?
Note: Article 6.7 was not applied.
i) Have the flood hazard and flood risk maps been made available to the public
Yes. APSFRs are linked on the public map using the local names. Information in WISE about the application of Article 13.2 refers to the APSFR codes. Because the complete table of links and APSFR name-codes is not available, the presence of all the pertinent APSFRs cannot be confirmed.
13 December 2014
27 of 29
Information exchanged between Member States and the
preparation of coherent maps in international RBDs or UoMs
Question 10 How has it been ensured that there was prior information exchange on the
production of maps between Member States sharing international RBDs or UoMs, and how
was it ensured that coherent maps were produced between the relevant Member States?
The number of cross border Units of Management with shared flood risk areas in this
Member State
No information found. Subsequent to the assessment, the SK authorities explained that no APSFRs with transboundary impacts have been identified. This was confirmed during negotiations of the bilateral trans-boundary river commissions and was reported within the ICPDR data templates. Summary of the information reported and in particular any differences between UoMs
in the Member State.
Prior information exchange on the production of maps between Member States sharing international RBDs or UoMs, and making sure that coherent maps were produced between the relevant Member States was achieved: In the Vistula RBD via bilateral Commission with Poland; In the Danube RBD via ICPDR and also via the bilateral Commissions.

13 December 2014
28 of 29
Consideration of climate change impacts in the preparation of the
maps
Question 11 How has climate change been taken into account when the flood hazard
scenarios were identified?
Climate change has been taken into account Yes
For which sources of flooding No information found
For low probability scenario To explore the climate change impacts the analysis of hydrological regime on a long term basis was carried out and indication of significant discharge changes was investigated. For different areas both decreases and increases in trends were detected. It is not clear if this was done for all scenarios.
For medium probability scenario To explore the climate change impacts the
analysis of hydrological regime on a long
term basis was carried out and indication of
significant discharge changes was
investigated. For different areas both
decreases and increases in trends were
detected. It is not clear if this was done for all
scenarios.
For high probability scenario To explore the climate change impacts the
analysis of hydrological regime on a long
term basis was carried out and indication of
significant discharge changes was
investigated. For different areas both
decreases and increases in trends were
detected. It is not clear if this was done for all
scenarios.
Climate change trend scenarios have been obtained from the IPCC or other international sources
No
Climate change trend scenarios have been obtained from the national research programmes
Yes
Flood hazard scenarios are based on modelling of changes in flood hazard in relation to climate change
No
Flood hazard scenarios included trend analysis of historical data of hydrological and meteorological observations
Yes
Flood hazard scenarios included a statistical assessment of historical climate data
Yes
Summary of how climate change has been taken into account in the production of
flood hazard maps, and highlight any differences between UoMs in the Member State
To explore the climate change impacts the analysis of hydrological regime on a long term basis was carried out and indication of significant discharge changes were investigated. For

13 December 2014
29 of 29
different areas both decreases and increases in trends were detected. It is not clear if this was done for all scenarios. This data is integrated in the hazard data shown at maps.