Embed Size (px)
DESCRIPTION
aaa
Citation preview

Available online at www.sciencedirect.com
www.elsevier.com/locate/toxinvit
Toxicology in Vitro 22 (2008) 610–617
Assessment of drug–drug interaction for silymarin
Johannes Doehmer a,*, Bernhard Tewes a, Kai-Uwe Klein a, Kristin Gritzko a,Holger Muschick a, Ulrich Mengs b
a GenPharmTox Biotech AG, Fraunhofer Str. 9, D-82152 Planegg/Martinsried, Germanyb Madaus GmbH, Colonia-Allee 15, D-51067 Cologne, Germany
Received 29 May 2007; accepted 30 November 2007Available online 8 December 2007
Abstract
Silymarin was assessed for drug–drug interaction by permeability studies with Caco-2 cells, for cytochrome P450 induction withhuman primary hepatocytes and for cytochrome P450 inhibition with human liver microsomes. Studies with Caco-2 cells revealed nointerference of silymarin with the permeability of nifedipine. Silymarin did not induce cytochromes P450 2C9 and 3A4 at concentrationsof 0.1; 1; and 100 lM, measured as silibinin. The inhibitory effect was tested on the nine major cytochromes P450 1A2, 2A6, 2B6, 2C8,2C9, 2C19, 2D6, 2E1, and 3A4 at concentrations of 1 and 100 lM silymarin. At 1 lM concentration no or negligible inhibition of cyto-chromes P450 1A2, 2A6, 2B6, 2C8, 2C9, and 2E1, minor inhibition of 3A4 (<20%), and moderate inhibition of 2C19 and 2D6 (<40%)were observed. Inhibition constant Ki of silymarin was determined for cytochromes P450 3A4 with 12 lM, 2C19 with 2 lM, and 2D6with 12 lM. Only at the high concentration of 100 lM silymarin, inhibition at >50% of the cytochromes P450 2B6, 2C8, 2C9, 2C19, 2D6,and 3A4 was observed, and no or moderate inhibition was for the cytochromes P450 1A2, 2A6, and 2E1. However, in view of the clin-ically relevant plasma concentration of approx. 0.2 lM measured as silibinin, it is evident that there is no drug–drug interaction problemwith silymarin.� 2007 Published by Elsevier Ltd.
Keywords: Silymarin; Silibinin; Cytochrome P450; Induction; Inhibition; Caco-2; Drug–drug interaction
1. Introduction
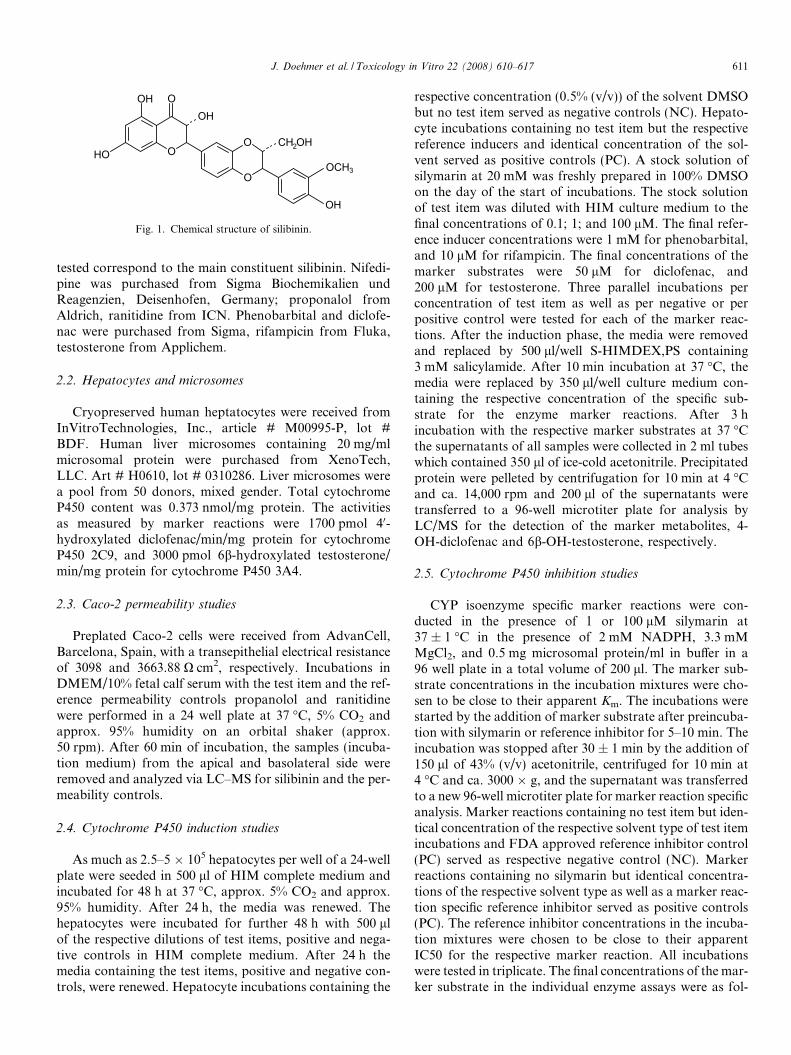
Silymarin, a flavonoid complex, is the main constituentwith 70–80% of the extract from seeds of the milk thistle(Silybum marianum) and has been used for decades as aherbal remedy and as a hepatoprotectant in therapy ofacute and chronic liver diseases (Flora et al., 1998; Gazaket al., 2007). Silymarin consists predominantly of up to60% of silibinin (Fig. 1), but also contains silycristin, silydi-anin, isosilibinin and other closely related flavonolignans(Weyhenmeyer et al., 1992).
Recently, inhibition studies with silymarin or silibininon cytochromes P450 gave hints for potential drug–druginteraction particularly for the inhibition of oxidation of
0887-2333/$ - see front matter � 2007 Published by Elsevier Ltd.
doi:10.1016/j.tiv.2007.11.020
* Corresponding author. Tel.: +49 89 895559 0; fax: +49 89 895559 18.E-mail address: [email protected] (J. Doehmer).
nifedipine (Beckmann-Knopp et al., 2000; Zuber et al.,2002; Sridar et al., 2004).
To assess the potential of silymarin for drug–drug inter-action several in vitro studies were performed, i.e. interfer-ence of silymarin with nifedipine permeability in Caco-2cells, induction of cytochromes P450 2C9 and 3A4 bysilymarin in human primary hepatocytes, and for cyto-chrome P450 inhibition in human liver microsomes. Guide-lines were observed in the design and performance of thesestudies (Committee for Proprietary Medicinal Products,1997; Guidance for Industry, 2006; BfArM, 2004).
2. Materials and methods
2.1. Chemicals
Silymarin (batch # 91258) was provided by MadausGmbH, Cologne, Germany. All silymarin concentrations
O
O
O
O
OHOH
OCH3
OH
CH OH2HO
Fig. 1. Chemical structure of silibinin.
J. Doehmer et al. / Toxicology in Vitro 22 (2008) 610–617 611
tested correspond to the main constituent silibinin. Nifedi-pine was purchased from Sigma Biochemikalien undReagenzien, Deisenhofen, Germany; proponalol fromAldrich, ranitidine from ICN. Phenobarbital and diclofe-nac were purchased from Sigma, rifampicin from Fluka,testosterone from Applichem.
2.2. Hepatocytes and microsomes
Cryopreserved human heptatocytes were received fromInVitroTechnologies, Inc., article # M00995-P, lot #BDF. Human liver microsomes containing 20 mg/mlmicrosomal protein were purchased from XenoTech,LLC. Art # H0610, lot # 0310286. Liver microsomes werea pool from 50 donors, mixed gender. Total cytochromeP450 content was 0.373 nmol/mg protein. The activitiesas measured by marker reactions were 1700 pmol 40-hydroxylated diclofenac/min/mg protein for cytochromeP450 2C9, and 3000 pmol 6b-hydroxylated testosterone/min/mg protein for cytochrome P450 3A4.
2.3. Caco-2 permeability studies
Preplated Caco-2 cells were received from AdvanCell,Barcelona, Spain, with a transepithelial electrical resistanceof 3098 and 3663.88 X cm2, respectively. Incubations inDMEM/10% fetal calf serum with the test item and the ref-erence permeability controls propanolol and ranitidinewere performed in a 24 well plate at 37 �C, 5% CO2 andapprox. 95% humidity on an orbital shaker (approx.50 rpm). After 60 min of incubation, the samples (incuba-tion medium) from the apical and basolateral side wereremoved and analyzed via LC–MS for silibinin and the per-meability controls.
2.4. Cytochrome P450 induction studies
As much as 2.5–5 � 105 hepatocytes per well of a 24-wellplate were seeded in 500 ll of HIM complete medium andincubated for 48 h at 37 �C, approx. 5% CO2 and approx.95% humidity. After 24 h, the media was renewed. Thehepatocytes were incubated for further 48 h with 500 llof the respective dilutions of test items, positive and nega-tive controls in HIM complete medium. After 24 h themedia containing the test items, positive and negative con-trols, were renewed. Hepatocyte incubations containing the
respective concentration (0.5% (v/v)) of the solvent DMSObut no test item served as negative controls (NC). Hepato-cyte incubations containing no test item but the respectivereference inducers and identical concentration of the sol-vent served as positive controls (PC). A stock solution ofsilymarin at 20 mM was freshly prepared in 100% DMSOon the day of the start of incubations. The stock solutionof test item was diluted with HIM culture medium to thefinal concentrations of 0.1; 1; and 100 lM. The final refer-ence inducer concentrations were 1 mM for phenobarbital,and 10 lM for rifampicin. The final concentrations of themarker substrates were 50 lM for diclofenac, and200 lM for testosterone. Three parallel incubations perconcentration of test item as well as per negative or perpositive control were tested for each of the marker reac-tions. After the induction phase, the media were removedand replaced by 500 ll/well S-HIMDEX,PS containing3 mM salicylamide. After 10 min incubation at 37 �C, themedia were replaced by 350 ll/well culture medium con-taining the respective concentration of the specific sub-strate for the enzyme marker reactions. After 3 hincubation with the respective marker substrates at 37 �Cthe supernatants of all samples were collected in 2 ml tubeswhich contained 350 ll of ice-cold acetonitrile. Precipitatedprotein were pelleted by centrifugation for 10 min at 4 �Cand ca. 14,000 rpm and 200 ll of the supernatants weretransferred to a 96-well microtiter plate for analysis byLC/MS for the detection of the marker metabolites, 4-OH-diclofenac and 6b-OH-testosterone, respectively.
2.5. Cytochrome P450 inhibition studies
CYP isoenzyme specific marker reactions were con-ducted in the presence of 1 or 100 lM silymarin at37 ± 1 �C in the presence of 2 mM NADPH, 3.3 mMMgCl2, and 0.5 mg microsomal protein/ml in buffer in a96 well plate in a total volume of 200 ll. The marker sub-strate concentrations in the incubation mixtures were cho-sen to be close to their apparent Km. The incubations werestarted by the addition of marker substrate after preincuba-tion with silymarin or reference inhibitor for 5–10 min. Theincubation was stopped after 30 ± 1 min by the addition of150 ll of 43% (v/v) acetonitrile, centrifuged for 10 min at4 �C and ca. 3000 � g, and the supernatant was transferredto a new 96-well microtiter plate for marker reaction specificanalysis. Marker reactions containing no test item but iden-tical concentration of the respective solvent type of test itemincubations and FDA approved reference inhibitor control(PC) served as respective negative control (NC). Markerreactions containing no silymarin but identical concentra-tions of the respective solvent type as well as a marker reac-tion specific reference inhibitor served as positive controls(PC). The reference inhibitor concentrations in the incuba-tion mixtures were chosen to be close to their apparentIC50 for the respective marker reaction. All incubationswere tested in triplicate. The final concentrations of the mar-ker substrate in the individual enzyme assays were as fol-

612 J. Doehmer et al. / Toxicology in Vitro 22 (2008) 610–617
lows: 5 lM 7-ethoxyresorfin for CYP1A2; 5 lM coumarinfor CYP2A6; 200 lM S-mephenytoin for CYP2B6; 10 lMpaclitaxel for CYP2C8; 10 lM diclofenac for CYP2C9;50 lM S-mephenytoin for CYP2C19; 20 lM bufuralol forCYP2D6; 50 lM chlorzoxazone for CYP2E1; and 100 lMtestosterone for CYP3A4. The final concentrations of thereference inhibitors were as follows: 25 lM furafylline forCYP1A2; 0.75 lM 8-methoxypsoralen for CYP2A6;75 lM triethylenethiophosparamide for CYP2B6; 25 lMketoconazole for CYP2C8; 2 lM sulfaphenazole forCYP2C9; 7.5 lM omeprazole for CYP2C19; 0.3 lM quini-dine for CYP2D6; 30 lM diethyldithiocarbamate forCYP2E1; and 0.15 lM ketoconazole for CYP3A4.
2.6. Ki determination for cytochromes P450 2C19, 2D6, and
3A4
For further characterization of the inhibition of the S-mephenytoin 40-hydroxylation (marker reaction forCYP2C19), bufuralol-hydroxylation (marker reaction forCYP2D6), and testosterone 6b-hydroxylation (markerreaction for CYP3A4) by four different concentrations ofsilymarin: 0.1; 1; 10; and 100 mM (corresponding to themain constituent silibinin) and six different concentrationsof the respective marker substrates: 25; 50; 125; 250; 500;and 1000 lM S-mephenytoin; 10; 20; 50; 100; 200; and400 lM bufuralol; 50; 100; 250; 500; 1000; and 2000 lMtestosterone were chosen for the determination of the Ki
values. Incubation conditions were the same as describedfor the inhibition studies.
2.7. Analytics
Formation of resorufin was measured photometrically at590 nm with Fluoroskan Ascent (Labsystems). Formationof all other marker substrate metabolites was measuredby LC/MS (AgilentSeries 1100 (Agilent or Waters AllianceHT2790)/ Quattro Micro (Waters)). The marker metabolite7-hydroxycoumarin for cytochrome P450 2A6 was chro-matographed on Luna 3u C18 (Phenomenex) at 30 �C with100% water (mobile Phase A), 100% acetonitrile (mobilePhase B), 2% formic acid in water (mobile Phase C) at aflow rate of 0.4 ml/min, and detected in ESI+ mode withtransition (m/z) of 163.0 > 107.0. The marker metabolitesnirvanol for cytochrome P450 2B6 and 40-hydroxymephe-nytoin for cytochrome P450 2C19, were chromatographedon Luna 3u C18 (Phenomenex) at 30 �C with 100% water(mobile Phase A), 100% acetonitrile (mobile Phase B), 2%formic acid in water (mobile Phase C) at a flow rate of0.4 ml/min, and detected in ESI+ mode with transition(m/z) of 205.0 > 134.0 for nirvanol and with transition
reaction velocity ¼ dilution factor� concentration of me
incubation time ðminÞ � protein concentra
(m/z) of 235.0 > 150.2. The marker metabolite 6a-hydroxy-paclitaxel for cytochrome P450 2C8 was chromatographedon Luna 3u C18 (Phenomenex) at 30 �C with 100% water(mobile Phase A), 100% acetonitrile (mobile Phase B), 2%formic acid in water (mobile Phase C) at a flow rate of0.4 ml/min, and detected in ESI+ mode with transition(m/z) of 870.2 > 524.9. The marker metabolite 40-hydrox-ydiclofenac for cytochrome P450 2C6 was chromato-graphed on Luna 3u C18 (Phenomenex) at 30 �C with100% water (mobile Phase A), 100% acetonitrile (mobilePhase B), 2% formic acid in water (mobile Phase C) at aflow rate of 0.4 ml/min, and detected in ESI� mode withSIR (m/z) of 265.9. The marker metabolite hydroxybufura-lol for cytochrome P450 2D6 was chromatographed onLuna 3u C18 (Phenomenex) at 30 �C with 100% water(mobile Phase A), 100% acetonitrile (mobile Phase B), 2%formic acid in water (mobile Phase C) at a flow rate of0.4 ml/min, and detected in ESI+ mode with transition(m/z) of 278.2 > 186.1. The marker metabolite 6-hydroxy-chlorzoxazone for cytochrome P450 2E1 was chromato-graphed on Luna 3 u C8 (Phenomenex) at 30 �C withwater: acetonitrile (75:25), 0.375% H3PO4 (mobile Phase),at a flow rate of 0.5 ml/min, and detected by absorptionat 298 nm. The marker metabolite 6b-hydroxytestosteronefor cytochrome P450 3A4 was chromatographed on LunaC8 (Phenomenex) at 30 �C with 100% water (mobile PhaseA), 100% acetonitrile (mobile Phase B), 2% formic acid inwater (mobile Phase C) at a flow rate of 0.4 ml/min, anddetected in ESI+ mode with transition (m/z) of305.0 > 287.0.
2.8. Data analysis
Data analysis of the CYP inhibition experiment was per-formed using standard software: ‘‘MS-EXCEL” by Micro-soft, Inc., ‘‘SigmaPlot 8.02 for Windows”, ‘‘EnzymeKinetics 1.1 Module for Sigma Plot 2001” by SPSS, Inc.,‘‘MassLynxTM Vers. 3.5” and ‘‘QuanLynxTM” by Waters,Ltd. The calibration curves were determined by calculationof the regression line (y = ax + y0, least squares, weighted1/y), and these calculations were performed using standardsoftware: ‘‘Sigma Plot 8.02 for Windows” by SPSS, Inc. Thecorrelation coefficient, y-intercept, slope, and the data plotare reported. From the measured signals (e.g. peak areas)the reaction velocities for each concentration of marker sub-strate and test item were determined (see Formula (1)) usingthe reference metabolite calibration curves. As the sampleswere stopped by the addition of 150 ll acetonitrile to200 ll incubation mix, the dilution factor of 1.75 was usedto adjust the concentrations of the test item samples to thecalibration samples.
tabolite ðlMÞtionðmg=mlÞ � 1000
ð1Þ

Inhibitory Effect of Silymarin
60
80
100
[%]
1 M 100 Mµ µ
J. Doehmer et al. / Toxicology in Vitro 22 (2008) 610–617 613
The resulting data were fitted using the ‘‘Enzyme Kinetics1.1 Module for Sigma Plot 2001” (SPSS, Inc.) to competi-tive, non-competitive, uncompetitive, and mixed as well asfull and partial inhibition models. The fits were rankedaccording to R2. Additionally, the AICc, Sy.x, and conver-gence for each fitting model are listed in Tables 3–5.
The Michaelis-Menten-, Lineweaver-Burk-, Eadie-Hof-stee-, and Dixon-plots for the model with the highest R2
that pass the Convergence criterion were generated. Theseparameters, the plots as well as the resulting apparent Ki
are reported (Figs. 4–6).
-20
0
20
40
1A2 2A6 2B6 2C8 2C9 2C19 2D6 2E1 3A4
Cytochrome P450 Isoenzyme
Inhi
bitio
n
Fig. 3. Inhibitory effects of silymarin on the major drug relatedcytochromes P450.
3. Results
The Caco-2 cell permeability study revealed that silyma-rin, measured for its major constituent silibinin, may be clas-sified as to be of moderate permeability with an apparentpermeability coefficient (Papp) of 5.52 � 10�6 cm/s (Table1). To assess for permeability interference, the permeability
Table 1Caco-2 permeability of silymarin and control compounds
Sample Mean Papp ± SD (10�6 cm/s) Permeability
Silibinin 5.52 ± 1.07 MediumPropranolol 38.98 ± 0.71 HighRanitidine 0.05a Low
a Single value.
Permeability of nifedipine in presence of silymarin
0.00
10.00
20.00
30.00
40.00
50.00
60.00
70.00
80.00
Sil 0 M Sil 10 M Sil 50 M
Pap
p [1
0^-6
cm
/s]
µ µ µ
Fig. 2. Permeability of nifedipine in the presence and absence ofsilymarin.
Table 2Summary of cytochrome P450 induction
Sample Concentration (lM) Fold induction of cytochrome P450
2C9 3A4
PCa –a 1.8 6.2NC – 1.0 1.0Silymarin 0.1b 0.8 1.0Silymarin 1b 0.7 0.9Silymarin 100b –c 0.3
a PC: CYP2C9: phenobarbital 1 mM CYP3A4: rifampicin 10 lM.b Silymarin concentrations belong to the main constituent silbinin.c No marker metabolite could be detected and therefore no enzyme
activity could be determined.
of nifedipine in Caco-2 cells was determined in the absenceand presence of 10 and 50 lM silymarin (Fig. 2). Nifedipinein the absence of silymarin had an apparent permeabilitycoefficient (Papp) of about 60 � 10�6 cm/s, and thusappeared to be highly permeable. Permeability of nifedipine
Michaelis-Menten
[Substrate] ( M)0 200 400 600 800 1000 1200
0
20
40
60
80
100
120 I =0 I = 0.1I = 1 I = 10I = 100
Eadie-Hofstee
Rate (pmol/mg/min)/[Substrate] ( M)0.0 0.2 0.4 0.6 0.8 1.0 1.2 1.4 1.6 1.8
0
20
40
60
80
100
120I = 0I = 0.1I = 1I = 10I = 100
µ
µ
Fig. 4. Inhibition of cytochrome P450 2C19 by silymarin with S-mephenytoin as substrate: (A) Michaelis-Menten plot; (B) Eadie-Hofsteeplot.

Michaelis-Menten
[Substrate] ( M)0 500 1000 1500 2000 2500
0
1000
2000
3000
4000
5000
6000
7000
Eadie-Hofstee7000
µ
I = 0I = 0.1I = 1I = 10I = 100
614 J. Doehmer et al. / Toxicology in Vitro 22 (2008) 610–617
did not change in the presence of 10 or 50 lM silymarin(Fig. 2).
The induction study on human primary hepatocyteswith 1 and 100 lM silymarin did not indicate any inductionof CYP2C9 or CYP3A4 (Table 2).
The inhibition study on human liver microsomes did notindicate interference of 1 lM silymarin with the markerreactions for the cytochromes P450 1A2, 2A6, 2B6, 2C8,2C9, 2E1, and only minor or moderate inhibition withcytochromes P450 2C19, 2D6, and 3A4 (Fig. 3).
To substantiate the finding on minor or moderate inhi-bition of the cytochromes P450 2C19, 2D6, and 3A4, adetailed enzyme kinetic study was performed (Figs. 4–6)yielding inhibition constants Ki for cytochromes P4502C19 with 2 lM, 2D6 with 12 lM, and 3A4 with 12 lM(Tables 3–5).
Inhibition ranging only between 50% and 100% wasobserved in the presence of 100 lM silymarin for all cyto-chromes P450 tested, except for cytochromes P450 2A6 and2E1 (Fig. 3).
Michaelis-Menten
[Substrate] ( M)
0 100 200 300 400 5000
20
40
60
80
100
120
140
160
180
200
Eadie-Hofstee
Rate (pmol/mg/min)/[Substrate] ( M)0 2 4 6 8
0
20
40
60
80
100
120
140
160
180
200
I = 0I = 0.1I = 1I = 10I = 100
I = 0I = 0.1I = 1I = 10I = 100
µ
µ
Fig. 5. Inhibition of cytochrome P450 2D6 by silymarin with bufuralol assubstrate: (A) Michaelis-Menten plot; (B) Eadie-Hofstee plot.
Rate (pmol/mg/min)/[Substrate] ( M)0 20 40 60 80 100 120
0
1000
2000
3000
4000
5000
6000
I = 0I = 0.1I = 1I = 10I = 100
µ
Fig. 6. Inhibition of cytochrome P450 3A4 by silymarin with testosteroneas substrate: (A) Michaelis-Menten plot; (B) Eadie-Hofstee plot.
4. Discussion
Flavonoids are widely distributed in plants and are reg-ularly consumed as vegetables, fruits, and beverages suchas tea and red wine. It is well known that flavonoids mayinterfere with the metabolism of drugs by induction or inhi-bition of cytochromes P450 (Ubeda et al., 1995; Dai et al.,1997; Fuhr, 1998). Thus, silymarin as a complex mixture offlavonoids may potentially cause drug–drug interaction.
Although the long term administration of silymarin isconsidered safe with no or minimal adverse effects (Sridaret al., 2004), inhibitory effects of silymarin on cytochromesP450 indicated a potential for drug interaction (Beckmann-Knopp et al., 2000; Sridar et al., 2004). To substantiatethese findings, the potential of silymarin to interfere withdrugs was investigated in vitro on uptake, and inductionand inhibition of cytochromes P450.
The interference in uptake of silymarin with nifedipinefrom the gut was considered in a clinical trial (Fuhr et al.,
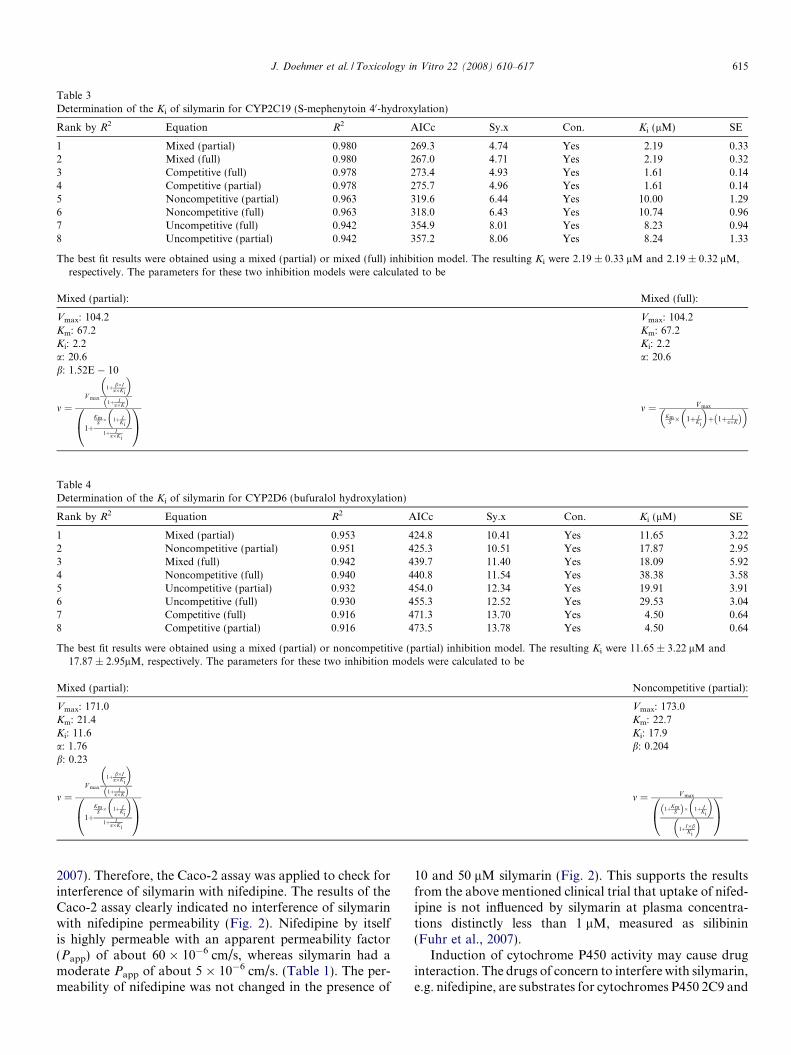
Table 3Determination of the Ki of silymarin for CYP2C19 (S-mephenytoin 40-hydroxylation)
Rank by R2 Equation R2 AICc Sy.x Con. Ki (lM) SE
1 Mixed (partial) 0.980 269.3 4.74 Yes 2.19 0.332 Mixed (full) 0.980 267.0 4.71 Yes 2.19 0.323 Competitive (full) 0.978 273.4 4.93 Yes 1.61 0.144 Competitive (partial) 0.978 275.7 4.96 Yes 1.61 0.145 Noncompetitive (partial) 0.963 319.6 6.44 Yes 10.00 1.296 Noncompetitive (full) 0.963 318.0 6.43 Yes 10.74 0.967 Uncompetitive (full) 0.942 354.9 8.01 Yes 8.23 0.948 Uncompetitive (partial) 0.942 357.2 8.06 Yes 8.24 1.33
The best fit results were obtained using a mixed (partial) or mixed (full) inhibition model. The resulting Ki were 2.19 ± 0.33 lM and 2.19 ± 0.32 lM,respectively. The parameters for these two inhibition models were calculated to be
Mixed (partial): Mixed (full):
Vmax: 104.2 Vmax: 104.2Km: 67.2 Km: 67.2Ki: 2.2 Ki: 2.2a: 20.6 a: 20.6b: 1.52E � 10
m ¼V max
1þ b�Ia�Ki
� �
1þ Ia�Kð Þ
1þKm
S � 1þ IKi
� �
1þ Ia�Ki
0@
1A
m ¼ V max
KmS � 1þ I
Ki
� �þ 1þ I
a�Kð Þ� �
Table 4Determination of the Ki of silymarin for CYP2D6 (bufuralol hydroxylation)
Rank by R2 Equation R2 AICc Sy.x Con. Ki (lM) SE
1 Mixed (partial) 0.953 424.8 10.41 Yes 11.65 3.222 Noncompetitive (partial) 0.951 425.3 10.51 Yes 17.87 2.953 Mixed (full) 0.942 439.7 11.40 Yes 18.09 5.924 Noncompetitive (full) 0.940 440.8 11.54 Yes 38.38 3.585 Uncompetitive (partial) 0.932 454.0 12.34 Yes 19.91 3.916 Uncompetitive (full) 0.930 455.3 12.52 Yes 29.53 3.047 Competitive (full) 0.916 471.3 13.70 Yes 4.50 0.648 Competitive (partial) 0.916 473.5 13.78 Yes 4.50 0.64
The best fit results were obtained using a mixed (partial) or noncompetitive (partial) inhibition model. The resulting Ki were 11.65 ± 3.22 lM and17.87 ± 2.95lM, respectively. The parameters for these two inhibition models were calculated to be
Mixed (partial): Noncompetitive (partial):
Vmax: 171.0 Vmax: 173.0Km: 21.4 Km: 22.7Ki: 11.6 Ki: 17.9a: 1.76 b: 0.204b: 0.23
m ¼V max
1þ b�Ia�Ki
� �
1þ Ia�Kð Þ
1þKm
S � 1þ IKi
� �
1þ Ia�Ki
0@
1A
m ¼ V max
1þKmSð Þ� 1þ I
Ki
� �
1þI�bKi
� �0@
1A
J. Doehmer et al. / Toxicology in Vitro 22 (2008) 610–617 615
2007). Therefore, the Caco-2 assay was applied to check forinterference of silymarin with nifedipine. The results of theCaco-2 assay clearly indicated no interference of silymarinwith nifedipine permeability (Fig. 2). Nifedipine by itselfis highly permeable with an apparent permeability factor(Papp) of about 60 � 10�6 cm/s, whereas silymarin had amoderate Papp of about 5 � 10�6 cm/s. (Table 1). The per-meability of nifedipine was not changed in the presence of
10 and 50 lM silymarin (Fig. 2). This supports the resultsfrom the above mentioned clinical trial that uptake of nifed-ipine is not influenced by silymarin at plasma concentra-tions distinctly less than 1 lM, measured as silibinin(Fuhr et al., 2007).
Induction of cytochrome P450 activity may cause druginteraction. The drugs of concern to interfere with silymarin,e.g. nifedipine, are substrates for cytochromes P450 2C9 and

Table 5Determination of the Ki of silymarin for CYP3A4 (testosterone 6b-hydroxylation)
Rank by R2 Equation R2 AICc Sy.x Con. Ki (lM) SE
1 Mixed (partial) 0.952 969.0 405.94 Yes 12.01 4.612 Mixed (full) 0.952 966.6 403.26 Yes 12.01 4.533 Noncompetitive (partial) 0.951 969.8 411.21 Yes 24.40 3.964 Noncompetitive (full) 0.951 967.5 408.53 Yes 24.40 2.155 Uncompetitive (full) 0.942 980.4 442.87 Yes 20.59 1.986 Uncompetitive (partial) 0.942 982.7 445.77 Yes 20.59 3.557 Competitive (partial) 0.884 1038.2 630.77 Yes 1.89 0.438 Competitive (full) 0.884 1035.9 626.66 Yes 1.89 0.42
The best fit results were obtained using a mixed (partial) or mixed (full) inhibition model. The resulting Ki were 12.01 ± 4.61 lM and 12.01 ± 4.53 lM,respectively. The parameters for these two inhibition models were calculated to be
Mixed (partial): Mixed (full):
Vmax: 5781.4 Vmax: 5781.5Km: 55.3 Km: 55.3Ki: 12.0 Ki: 12.0a: 2.4 a: 2.4b: 9.33E � 11
m ¼V max
1þ b�Ia�Ki
� �
1þ Ia�Kð Þ
1þKm
S � 1þ IKi
� �
1þ Ia�Ki
0@
1A
m ¼ V max
KmS � 1þ I
Ki
� �þ 1þ I
a�Kð Þ� �
616 J. Doehmer et al. / Toxicology in Vitro 22 (2008) 610–617
3A4. This was tested for silymarin at concentrations of 0.1; 1;and 100 lM for cytochromes P450 2C9 and 3A4. No induc-tion was detected for these cytochromes P450 (Table 2).Thus, cytochrome P450 induction at least for these cyto-chromes P450 as a cause for drug interaction can be ruledout for the concentrations tested. In addition, the results ofthe induction experiments suggest that the higher concentra-tions of silymarin actually decrease cytochrome P450 2C9and 3A4 activities. Thus, even higher concentrations than100 lM of silymarin which may be discussed for hepatic orbiliary concentrations of up to 200 lM (Beckmann-Knoppet al., 2000) are unlikely to cause induction.
Inhibition studies for silymarin were carried out for themost relevant drug related cytochromes P450, i.e. cyto-chromes P450 1A2, 2A6, 2B6, 2C8, 2C9, 2C19, 2D6,2E1, and 3A4. At a concentration of 1 lM silymarin noor negligible inhibition was observed, except for the cyto-chromes P450 2C19, 2D6, and 3A4 (Fig. 3), which were
Table 6Inhibition by silymarin or silibinin of cytochrome P450 isoforms (CYP) in co
CYP Own data Beckmann-Knopp e
1A2 No inhib.1 No inhib.2A6 No inhib.1 IC50: 541–688 lM2B6 No inhib.1 n.d.2C8 No inhib.1 n.d.2C9 No inhib.1 Ki: 18–19 lM2C19 Ki: 2.2 lM IC50: 309–424 lM2D6 Ki: 11.6 lM Ki: 112–135 lM2E1 No inhib.1 IC50: 460–799 lM3A4 Ki: 12.0 lM Ki: 9–12 lM
No inhib.1: at 1 lM silymarin; no inhib.2: up to 100 lM silibinin; n.d.: not do
submitted to a more detailed kinetic studies for the deter-mination of their Ki values to study the moderate inhibitionof these cytochromes P450 in more detail (Figs. 4–6; Tables4–6). All these results might be of clinical relevance as theapplied concentration of 1 lM is close to the maximumplasma concentrations of silibinin recently measured in aclinical trial and in human pharmacokinetic studies (Wey-henmeyer et al., 1992; Fuhr et al., 2007).
The Ki values determined for the cytochromes P4502C19, 2D6, and 3A4 compare favorably with those previ-ously reported (Table 6). The inhibition kinetics shown asEadie-Hofstee diagrams suggest a concentration dependentmixed-partial type of inhibition (Figs. 4–6). All Ki valuesare well above clinically relevant plasma concentrationsof silbinin, and therefore, concerns because of mecha-nism-based inhibition for cytochrome P450 2C9 and 3A4as raised by Sridar et al., 2004 may be considered to beof no relevance.
mparison with published data
t al. Zuber et al. Sridar et al.
n.d. n.d.n.d. n.d.n.d. No inhib.2
n.d. n.d.n.d. Ki: 5 lMn.d. n.d.Ki: 8.2 lM No inhib.2
Ki: 28.7 lM No inhib.2
Ki: 4.9–10 lM Ki: 32–166 lM
ne.

J. Doehmer et al. / Toxicology in Vitro 22 (2008) 610–617 617
Inhibition studies with 100 lM silymarin revealed negli-ble inhibition of the cytochromes P450 2A6, and 2E1, amoderate inhibition of 50% of cytochrome P450 1A2,and extensive inhibition of more than 80% for cytochromesP450 2B6, 2C8, 2C9, 2C19, 2D6, and 3A4. However, theconcentration of silymarin applied was more than 100-foldover the maximum plasma concentration under therapeuticcondition, and therefore the observed inhibitions are of noclinical relevance.
When comparing the inhibition results reported here,with those reported previously (Beckmann-Knopp et al.,2000; Sridar et al., 2004) several discrepancies were obvi-ous. Most of all, none of these reports covered a concentra-tion of silymarin or silibinin as low as 1 lM. The inhibitionstudies presented by Beckmann-Knopp et al., 2000, cov-ered a concentration range of 3.7–300 lM. According tothe studies presented by Sridar et al., 2004, the concentra-tion range tested was 5–50 lM silibinin for cytochromeP450 2C9 and 25–250 lM for cytochrome P450 3A4, whichis in any case far above the observed maximum plasmaconcentration in patients, which is less than 1 lM, andare therefore of no clinical relevance. Furthermore, Sridaret al., 2004 reported no inhibition of cytochromes P450 2B6and 2D6 by silibinin at concentrations of up to 100 lM.This discrepancy might be explained by the applied test sys-tems. Sridar et al., 2004 made use of purified and reconsti-tuted cytochromes P450, whereas a certified and highlycontrolled preparation of human liver microsomes wasused in our studies. Particularly for cytochromes P4502D6, the validity of our results is supported by our detailedkinetic studies (Figs. 4–6). The lack of an inhibitory effecton cytochrome P450 2E1 confirms results of previous stud-ies (Miguez et al., 1994; Beckmann-Knopp et al., 2000; Sri-dar et al., 2004).
Inhibition of CYP3A4 by silymarin was recently studiedin a clinical trial conducted at the University of Cologne(Fuhr et al., 2007). In a controlled, open cross-over trialwith 16 male volunteers, the CYP3A4 substrate nifedipine(Adalat�) was given orally with or without pre-treatmentby administration of silymarin (Legalon�). The relativebioavailability for the AUC of nifedipine in the presenceof silymarin compared with nifedipine alone was 1.13(90% confidence interval: 0.97–1.32). This result supportsour general assumption that inhibition studies with 1 lMsilymarin are of clinical relevance, in this case particularlyfor cytochrome P450 3A4, where only a minor inhibitionwas observed for 1 lM silymarin (Fig. 3).
Intentionally, all studies were performed with a standard-ized silymarin extract to be as close as possible to the clini-cally applied form of silymarin. The same accounts for thechosen concentrations. In conclusion, results on cyto-chrome P450 inhibition studies with silymarin may indicatedrug interaction, but clinically relevant concentrationsshould be considered for assessment of drug interaction.
Conflict of interest statement
All studies were funded by Madaus GmbH, Cologne,Germany. However, the experiments were designed andcarried out independently by GenPharmTox Biotech AG,without the influence of the sponsor, and observing GLPregulations.
Acknowledgements
The technical assistance by Birgit Ammermann and Na-dine Herrmann is appreciated. These studies were spon-sored by Madaus GmbH, Cologne, Germany.
References
Beckmann-Knopp, S., Rietbrock, S., Weyhenmeyer, R., Bocker, R.K.,Beckurts, T., Lang, W., Hunz, M., Fuhr, U., 2000. Inhibitory effects ofsilibinin on cytochrome P450 enzymes in human liver microsomes.Pharmacol. Toxicol. 86, 250–256.
BfArM: Erlauterungen zum Vorgehen bei der Beurteilung von in vitroUntersuchungen pharmakokinetischer Interaktionen mit Phytophar-maka, 2004.
Committee for Proprietary Medicinal Products: Note for Guidance on theInvestigation of Drug Interactions (CPMP/EWP/560/95). The Euro-pean Agency for the Evaluation of Medicinal Products, HumanMedicines Evaluation Unit. London, 17 December 1997.
Dai, R., Jacobson, K.A., Robinson, R.C., Friedman, F.K., 1997.Differential effects of flavonoids on testosterone-metabolizing cyto-chrome P450s. Life Sci. 61, PL75–PL80.
Flora, K., Hahn, M., Rosen, H., Benner, K., 1998. Milk thistle (Silybum
marianum) for the therapy of liver disease. Am. J. Gastroenterol. 93,139–143.
Fuhr, U., 1998. Drug interactions with grapefruit juice: extent, probablemechanism, and clinical relevance. Drug Safety 18, 251–272.
Fuhr, U., Beckmann-Knopp, S., Jetter, A., Luck, H., Mengs, U., 2007.The effect of silymarin on oral nifedipine pharmacokinetics. PlantaMed. Online first, doi:10.1055/s-2007-990256.
Gazak, R., Walterova, D., Kren, V., 2007. Silybin and silymarin-new andemerging applications in medicine. Curr. Med. Chem. 14, 315–338.
Guidance for Industry, 2006. Drug Interaction Studies – Study design, DataAnalysis, and Implications for Dosing and Labeling. US Departmentof Health and Human Services, Food and Drug Administration.
Miguez, M.P., Anundi, I., Sainz-Pardo, L.A., Lindros, K.O., 1994.Hepatoprotective mechanism of silymarin: no evidence for involve-ment of cytochrome P450 2E1. Chem. Biol. Interact. 91, 51–63.
Sridar, C., Goosen, T.C., Kent, U.M., Williams, J.A., Hollenberg, P.F.,2004. Silybin inactivates cytochromes P450 3A4 and 2C9 and inhibitsmajor hepatic glucuronosyltransferases. Drug Metab. Dispos. 32, 587–594.
Ubeda, A., Esteve, M.L., Alcaraz, M.J., Cheeseman, K.H., Slater, T.F.,1995. Effects of flavonoids on cytochrome P-450 from rat livermicrosomes: Inhibition of enzyme activities and protection againstperoxidative damage. Phytother. Res. 9, 416–420.
Weyhenmeyer, R., Mascher, H., Birkmayer, J., 1992. Study on dose-linearity of the pharmacokinetics of silibinin diastereomers using a newstereospecific assay. Int. J. Clin. Pharmacol. Ther. Toxicol. 30, 134–138.
Zuber, R., Mdriansky, M., Dvorak, Z., Rohovsky, P., Ulrichova, J.,Slimanke, V., Anzenbacher, P., 2002. Effect of silybin and its congenerson human liver microsomal cytochrome P450 activities. Phytother Res.16, 632–638.