Embed Size (px)
Citation preview
Abstract--This study investigates the current water demand and
supply situation in Mandalay city in 2014 and evaluates the changes
of water demand and supply due to completion of future project
scenarios for 2015 to 2030. The Water Evaluation and Planning
(WEAP) model was used to assess present and future domestic water
allocation for Mandalay city till 2030. The current water demand and
supply for domestic need was firstly analyzed. In Mandalay city, the
water supplied to demand site was mostly contributed by
groundwater and a little demand was met by Sedawgyi dam and
Ayeyarwaddy river. Required data was collected from Mandalay
City Development Committee (MCDC) and Irrigation Department.
The collected data was given as input to the WEAP model and the
model generated water demand, supply delivered and unmet demand
of reference scenario based on current account year. The model
results revealed that two townships were met with the required
demand and three townships were facing water shortage all year
round. So, new water resources may be vitally needed to balance the
unmet demand. According to proposed plan from MCDC, two new
infrastructure completion of Ayeyarwaddy river and Dotehtawaddy
river pumping projects were considered for future scenarios to reduce
the unmet demand.
Keywords—future project scenarios, Water Evaluation and
Planning (WEAP) Model, domestic water allocation, reference
scenario, unmet demand
I. INTRODUCTION
Water allocation is the process of sharing limited natural
resources between different regions and competing users. In
simple term, it is the mechanism for determining who can take
water, how much they can take, from which location and for
what purposes. As water scarcity has increased globally, water
allocation plans and agreements have taken on increasing
significance in resolving international, regional and local
conflicts over access to water. While objectives and
approaches have been evolved over time, water resources
allocation has fundamentally remained the process of
determining how much water is available for human use and
how that water should be shared between competing users.
Today, water shortage is one the real challenges facing
many countries in the world. In Myanmar, the process of
population growth, urbanization and industrialization are
occurring at an ever increasing phase at every year. These
processes result in increased demand for water use in the
Kaung Myat, Mandalay Technological University, Republic of the Union
of Myanmar, [email protected]
Nilar Aye, Mandalay Technological University, Republic of the Union of
Myanmar, [email protected]
sector of domestic water supply, industry, agriculture and
hydropower generation. Thus, the water allocation criteria and
water resources development projects are undertaken to
address this requirements. According to report from Asian
Development Bank, total water withdraw from available water
resources in Myanmar are around 89% for agriculture, 10% is
for municipalities and 1% is for industries. Approximately
91% of the total water withdraw comes from surface water and
9% from groundwater. Groundwater is mostly used for
domestic purpose.
As the difference between water resources and demand is
ever increasing, the government is facing with the increasingly
difficult task of allocating the available water resources among
the competing demands. In the face of growing competition,
the water allocation has evolved to be a complex process.
Simulation and optimization modeling techniques can help to
analyze this complex process and develop sustainable water
allocation solutions. Over the years, a number of computer-
based tools that employ simulation and optimization
techniques have been developed. Among them, Water
Evaluation and Planning Model (WEAP) developed by
Stockholm Environment Institute, has been used worldwide in
order to perform allocation, scenario analyses and reporting
data tool for water resources management.
II. BACKGROUND STUDY AREA
Mandalay city is located in the central region of Myanmar
at 21° 58' N 96° 04' E. It is also the second largest city and the
last royal capital of Myanmar. It is located 445 miles north of
Yangon and bordered by the Ayeyarwaddy river at the west.
The city has an estimated population of 1.21 million and is the
capital of Mandalay Region. Mandalay is the main
commercial, educational, health and economic hub of Upper
Myanmar and considered as the centre of Buddhism in
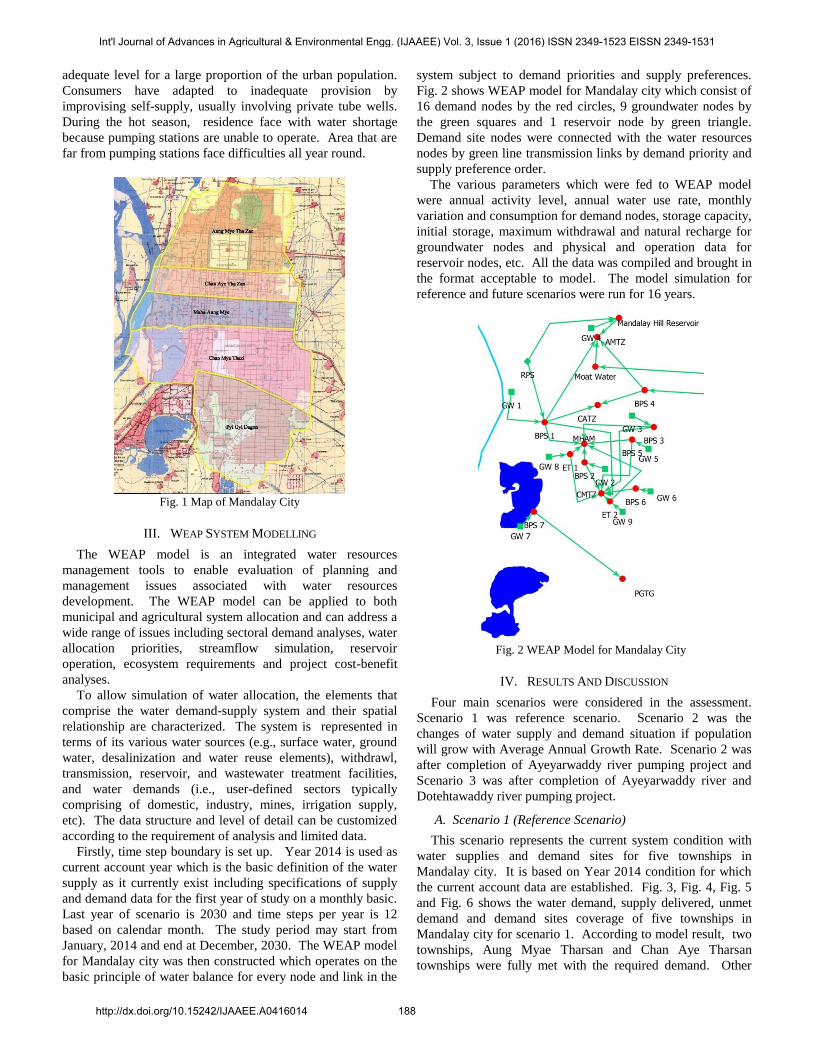
Myanmar. Mandalay city downtown area consists of five
townships as shown in Fig 1.
In Mandalay city municipal area, water is supplied by a
network of piped water supply system from tube wells, river
pumping and reservoirs. Presently, piped water supply is
being provided to Aung Myae Tharsan, Chan Aye Tharsan,
Maha Aung Myae, Chan Mya Tharzi and a small part of Pyi
Gyi Tagon township. As a whole, overall population accessed
to piped water supply in Mandalay city is 72.9% of total city
population. Piped water supply system is available only during
particular times of the day in the different townships and
intermittently supply in almost zone. In general, citywide
infrastructure networks and municipal services do not reach at
Assessment of Current and Future Domestic
Water Allocation for Mandalay City
1Kaung Myat, and
2Nilar Aye
Int'l Journal of Advances in Agricultural & Environmental Engg. (IJAAEE) Vol. 3, Issue 1 (2016) ISSN 2349-1523 EISSN 2349-1531
http://dx.doi.org/10.15242/IJAAEE.A0416014 187
adequate level for a large proportion of the urban population.
Consumers have adapted to inadequate provision by
improvising self-supply, usually involving private tube wells.
During the hot season, residence face with water shortage
because pumping stations are unable to operate. Area that are
far from pumping stations face difficulties all year round.
Fig. 1 Map of Mandalay City
III. WEAP SYSTEM MODELLING
The WEAP model is an integrated water resources
management tools to enable evaluation of planning and
management issues associated with water resources
development. The WEAP model can be applied to both
municipal and agricultural system allocation and can address a
wide range of issues including sectoral demand analyses, water
allocation priorities, streamflow simulation, reservoir
operation, ecosystem requirements and project cost-benefit
analyses.
To allow simulation of water allocation, the elements that
comprise the water demand-supply system and their spatial
relationship are characterized. The system is represented in
terms of its various water sources (e.g., surface water, ground
water, desalinization and water reuse elements), withdrawl,
transmission, reservoir, and wastewater treatment facilities,
and water demands (i.e., user-defined sectors typically
comprising of domestic, industry, mines, irrigation supply,
etc). The data structure and level of detail can be customized
according to the requirement of analysis and limited data.
Firstly, time step boundary is set up. Year 2014 is used as
current account year which is the basic definition of the water
supply as it currently exist including specifications of supply
and demand data for the first year of study on a monthly basic.
Last year of scenario is 2030 and time steps per year is 12
based on calendar month. The study period may start from
January, 2014 and end at December, 2030. The WEAP model
for Mandalay city was then constructed which operates on the
basic principle of water balance for every node and link in the
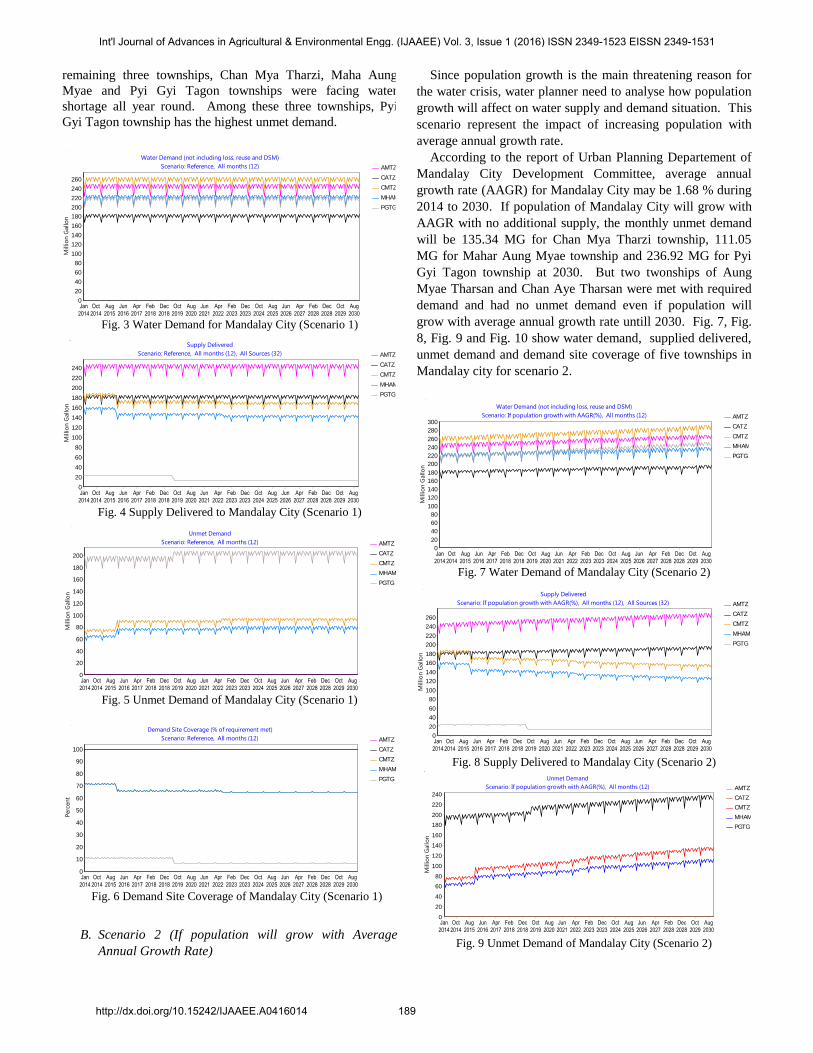
system subject to demand priorities and supply preferences.
Fig. 2 shows WEAP model for Mandalay city which consist of
16 demand nodes by the red circles, 9 groundwater nodes by
the green squares and 1 reservoir node by green triangle.
Demand site nodes were connected with the water resources
nodes by green line transmission links by demand priority and
supply preference order.
The various parameters which were fed to WEAP model
were annual activity level, annual water use rate, monthly
variation and consumption for demand nodes, storage capacity,
initial storage, maximum withdrawal and natural recharge for
groundwater nodes and physical and operation data for
reservoir nodes, etc. All the data was compiled and brought in
the format acceptable to model. The model simulation for
reference and future scenarios were run for 16 years.
Fig. 2 WEAP Model for Mandalay City
IV. RESULTS AND DISCUSSION
Four main scenarios were considered in the assessment.
Scenario 1 was reference scenario. Scenario 2 was the
changes of water supply and demand situation if population
will grow with Average Annual Growth Rate. Scenario 2 was
after completion of Ayeyarwaddy river pumping project and
Scenario 3 was after completion of Ayeyarwaddy river and
Dotehtawaddy river pumping project.
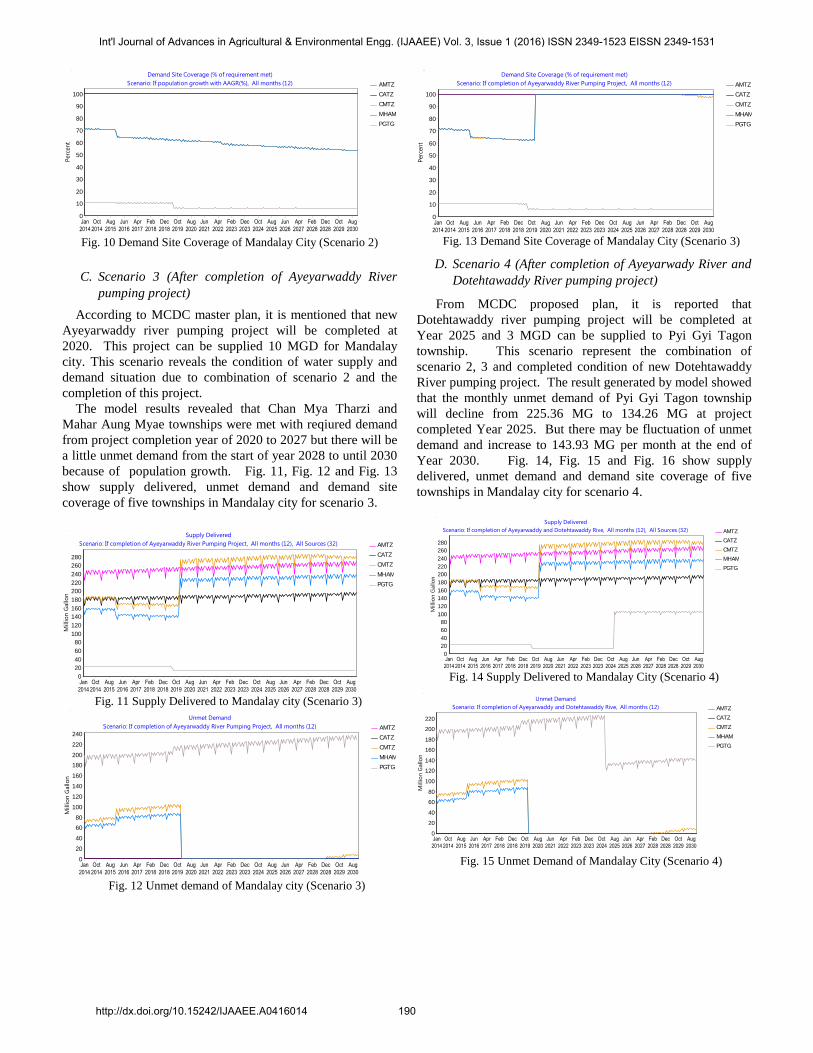
A. Scenario 1 (Reference Scenario)
This scenario represents the current system condition with
water supplies and demand sites for five townships in
Mandalay city. It is based on Year 2014 condition for which
the current account data are established. Fig. 3, Fig. 4, Fig. 5
and Fig. 6 shows the water demand, supply delivered, unmet
demand and demand sites coverage of five townships in
Mandalay city for scenario 1. According to model result, two
townships, Aung Myae Tharsan and Chan Aye Tharsan
townships were fully met with the required demand. Other
Int'l Journal of Advances in Agricultural & Environmental Engg. (IJAAEE) Vol. 3, Issue 1 (2016) ISSN 2349-1523 EISSN 2349-1531
http://dx.doi.org/10.15242/IJAAEE.A0416014 188
remaining three townships, Chan Mya Tharzi, Maha Aung
Myae and Pyi Gyi Tagon townships were facing water
shortage all year round. Among these three townships, Pyi
Gyi Tagon township has the highest unmet demand.
AMTZ
CATZ
CMTZ
MHAM
PGTG
Water Demand (not including loss, reuse and DSM)
Scenario: Reference, All months (12)
Jan
2014
Oct
2014
Aug
2015
Jun
2016
Apr
2017
Feb
2018
Dec
2018
Oct
2019
Aug
2020
Jun
2021
Apr
2022
Feb
2023
Dec
2023
Oct
2024
Aug
2025
Jun
2026
Apr
2027
Feb
2028
Dec
2028
Oct
2029
Aug
2030
Millio
n G
allo
n
260
240
220
200
180
160
140
120
100
80
60
40
20
0
Fig. 3 Water Demand for Mandalay City (Scenario 1)
AMTZ
CATZ
CMTZ
MHAM
PGTG
Supply Delivered
Scenario: Reference, All months (12), All Sources (32)
Jan
2014
Oct
2014
Aug
2015
Jun
2016
Apr
2017
Feb
2018
Dec
2018
Oct
2019
Aug
2020
Jun
2021
Apr
2022
Feb
2023
Dec
2023
Oct
2024
Aug
2025
Jun
2026
Apr
2027
Feb
2028
Dec
2028
Oct
2029
Aug
2030
Millio
n G
allo
n
240
220
200
180
160
140
120
100
80
60
40
20
0
Fig. 4 Supply Delivered to Mandalay City (Scenario 1)
AMTZ
CATZ
CMTZ
MHAM
PGTG
Unmet Demand
Scenario: Reference, All months (12)
Jan
2014
Oct
2014
Aug
2015
Jun
2016
Apr
2017
Feb
2018
Dec
2018
Oct
2019
Aug
2020
Jun
2021
Apr
2022
Feb
2023
Dec
2023
Oct
2024
Aug
2025
Jun
2026
Apr
2027
Feb
2028
Dec
2028
Oct
2029
Aug
2030
Millio
n G
allo
n
200
180
160
140
120
100
80
60
40
20
0
Fig. 5 Unmet Demand of Mandalay City (Scenario 1)
AMTZ
CATZ
CMTZ
MHAM
PGTG
Demand Site Coverage (% of requirement met)
Scenario: Reference, All months (12)
Jan
2014
Oct
2014
Aug
2015
Jun
2016
Apr
2017
Feb
2018
Dec
2018
Oct
2019
Aug
2020
Jun
2021
Apr
2022
Feb
2023
Dec
2023
Oct
2024
Aug
2025
Jun
2026
Apr
2027
Feb
2028
Dec
2028
Oct
2029
Aug
2030
Perc
en
t
100
90
80
70
60
50
40
30
20
10
0
Fig. 6 Demand Site Coverage of Mandalay City (Scenario 1)
B. Scenario 2 (If population will grow with Average
Annual Growth Rate)
Since population growth is the main threatening reason for
the water crisis, water planner need to analyse how population
growth will affect on water supply and demand situation. This
scenario represent the impact of increasing population with
average annual growth rate.
According to the report of Urban Planning Departement of
Mandalay City Development Committee, average annual
growth rate (AAGR) for Mandalay City may be 1.68 % during
2014 to 2030. If population of Mandalay City will grow with
AAGR with no additional supply, the monthly unmet demand
will be 135.34 MG for Chan Mya Tharzi township, 111.05
MG for Mahar Aung Myae township and 236.92 MG for Pyi
Gyi Tagon township at 2030. But two twonships of Aung
Myae Tharsan and Chan Aye Tharsan were met with required
demand and had no unmet demand even if population will
grow with average annual growth rate untill 2030. Fig. 7, Fig.
8, Fig. 9 and Fig. 10 show water demand, supplied delivered,
unmet demand and demand site coverage of five townships in
Mandalay city for scenario 2.
AMTZ
CATZ
CMTZ
MHAM
PGTG
Water Demand (not including loss, reuse and DSM)
Scenario: If population growth with AAGR(%), All months (12)
Jan
2014
Oct
2014
Aug
2015
Jun
2016
Apr
2017
Feb
2018
Dec
2018
Oct
2019
Aug
2020
Jun
2021
Apr
2022
Feb
2023
Dec
2023
Oct
2024
Aug
2025
Jun
2026
Apr
2027
Feb
2028
Dec
2028
Oct
2029
Aug
2030
Millio
n G
allo
n300
280
260
240
220
200
180
160
140
120
100
80
60
40
20
0
Fig. 7 Water Demand of Mandalay City (Scenario 2)
AMTZ
CATZ
CMTZ
MHAM
PGTG
Supply Delivered
Scenario: If population growth with AAGR(%), All months (12), All Sources (32)
Jan
2014
Oct
2014
Aug
2015
Jun
2016
Apr
2017
Feb
2018
Dec
2018
Oct
2019
Aug
2020
Jun
2021
Apr
2022
Feb
2023
Dec
2023
Oct
2024
Aug
2025
Jun
2026
Apr
2027
Feb
2028
Dec
2028
Oct
2029
Aug
2030
Millio
n G
allo
n
260
240
220
200
180
160
140
120
100
80
60
40
20
0
Fig. 8 Supply Delivered to Mandalay City (Scenario 2)
AMTZ
CATZ
CMTZ
MHAM
PGTG
Unmet Demand
Scenario: If population growth with AAGR(%), All months (12)
Jan
2014
Oct
2014
Aug
2015
Jun
2016
Apr
2017
Feb
2018
Dec
2018
Oct
2019
Aug
2020
Jun
2021
Apr
2022
Feb
2023
Dec
2023
Oct
2024
Aug
2025
Jun
2026
Apr
2027
Feb
2028
Dec
2028
Oct
2029
Aug
2030
Millio
n G
allo
n
240
220
200
180
160
140
120
100
80
60
40
20
0
Fig. 9 Unmet Demand of Mandalay City (Scenario 2)
Int'l Journal of Advances in Agricultural & Environmental Engg. (IJAAEE) Vol. 3, Issue 1 (2016) ISSN 2349-1523 EISSN 2349-1531
http://dx.doi.org/10.15242/IJAAEE.A0416014 189
AMTZ
CATZ
CMTZ
MHAM
PGTG
Demand Site Coverage (% of requirement met)
Scenario: If population growth with AAGR(%), All months (12)
Jan
2014
Oct
2014
Aug
2015
Jun
2016
Apr
2017
Feb
2018
Dec
2018
Oct
2019
Aug
2020
Jun
2021
Apr
2022
Feb
2023
Dec
2023
Oct
2024
Aug
2025
Jun
2026
Apr
2027
Feb
2028
Dec
2028
Oct
2029
Aug
2030
Perc
en
t
100
90
80
70
60
50
40
30
20
10
0
Fig. 10 Demand Site Coverage of Mandalay City (Scenario 2)
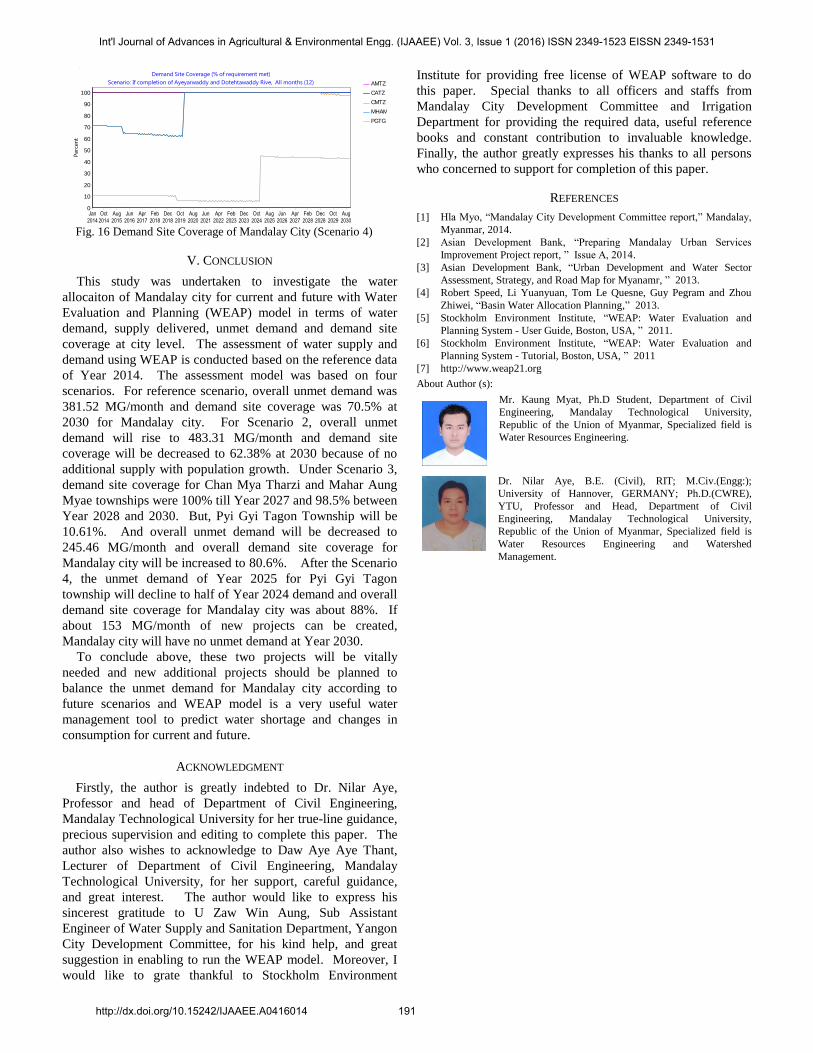
C. Scenario 3 (After completion of Ayeyarwaddy River
pumping project)
According to MCDC master plan, it is mentioned that new
Ayeyarwaddy river pumping project will be completed at
2020. This project can be supplied 10 MGD for Mandalay
city. This scenario reveals the condition of water supply and
demand situation due to combination of scenario 2 and the
completion of this project.
The model results revealed that Chan Mya Tharzi and
Mahar Aung Myae townships were met with reqiured demand
from project completion year of 2020 to 2027 but there will be
a little unmet demand from the start of year 2028 to until 2030
because of population growth. Fig. 11, Fig. 12 and Fig. 13
show supply delivered, unmet demand and demand site
coverage of five townships in Mandalay city for scenario 3.
AMTZ
CATZ
CMTZ
MHAM
PGTG
Supply Delivered
Scenario: If completion of Ayeyarwaddy River Pumping Project, All months (12), All Sources (32)
Jan
2014
Oct
2014
Aug
2015
Jun
2016
Apr
2017
Feb
2018
Dec
2018
Oct
2019
Aug
2020
Jun
2021
Apr
2022
Feb
2023
Dec
2023
Oct
2024
Aug
2025
Jun
2026
Apr
2027
Feb
2028
Dec
2028
Oct
2029
Aug
2030
Millio
n G
allo
n
280
260
240
220
200
180
160
140
120
100
80
60
40
20
0
Fig. 11 Supply Delivered to Mandalay city (Scenario 3)
AMTZ
CATZ
CMTZ
MHAM
PGTG
Unmet Demand
Scenario: If completion of Ayeyarwaddy River Pumping Project, All months (12)
Jan
2014
Oct
2014
Aug
2015
Jun
2016
Apr
2017
Feb
2018
Dec
2018
Oct
2019
Aug
2020
Jun
2021
Apr
2022
Feb
2023
Dec
2023
Oct
2024
Aug
2025
Jun
2026
Apr
2027
Feb
2028
Dec
2028
Oct
2029
Aug
2030
Millio
n G
allo
n
240
220
200
180
160
140
120
100
80
60
40
20
0
Fig. 12 Unmet demand of Mandalay city (Scenario 3)
AMTZ
CATZ
CMTZ
MHAM
PGTG
Demand Site Coverage (% of requirement met)
Scenario: If completion of Ayeyarwaddy River Pumping Project, All months (12)
Jan
2014
Oct
2014
Aug
2015
Jun
2016
Apr
2017
Feb
2018
Dec
2018
Oct
2019
Aug
2020
Jun
2021
Apr
2022
Feb
2023
Dec
2023
Oct
2024
Aug
2025
Jun
2026
Apr
2027
Feb
2028
Dec
2028
Oct
2029
Aug
2030
Perc
en
t
100
90
80
70
60
50
40
30
20
10
0
Fig. 13 Demand Site Coverage of Mandalay City (Scenario 3)
D. Scenario 4 (After completion of Ayeyarwady River and
Dotehtawaddy River pumping project)
From MCDC proposed plan, it is reported that
Dotehtawaddy river pumping project will be completed at
Year 2025 and 3 MGD can be supplied to Pyi Gyi Tagon
township. This scenario represent the combination of
scenario 2, 3 and completed condition of new Dotehtawaddy
River pumping project. The result generated by model showed
that the monthly unmet demand of Pyi Gyi Tagon township
will decline from 225.36 MG to 134.26 MG at project
completed Year 2025. But there may be fluctuation of unmet
demand and increase to 143.93 MG per month at the end of
Year 2030. Fig. 14, Fig. 15 and Fig. 16 show supply
delivered, unmet demand and demand site coverage of five
townships in Mandalay city for scenario 4.
AMTZ
CATZ
CMTZ
MHAM
PGTG
Supply Delivered
Scenario: If completion of Ayeyarwaddy and Dotehtawaddy Rive, All months (12), All Sources (32)
Jan
2014
Oct
2014
Aug
2015
Jun
2016
Apr
2017
Feb
2018
Dec
2018
Oct
2019
Aug
2020
Jun
2021
Apr
2022
Feb
2023
Dec
2023
Oct
2024
Aug
2025
Jun
2026
Apr
2027
Feb
2028
Dec
2028
Oct
2029
Aug
2030
Millio
n G
allo
n
280
260
240
220
200
180
160
140
120
100
80
60
40
20
0
Fig. 14 Supply Delivered to Mandalay City (Scenario 4)
AMTZ
CATZ
CMTZ
MHAM
PGTG
Unmet Demand
Scenario: If completion of Ayeyarwaddy and Dotehtawaddy Rive, All months (12)
Jan
2014
Oct
2014
Aug
2015
Jun
2016
Apr
2017
Feb
2018
Dec
2018
Oct
2019
Aug
2020
Jun
2021
Apr
2022
Feb
2023
Dec
2023
Oct
2024
Aug
2025
Jun
2026
Apr
2027
Feb
2028
Dec
2028
Oct
2029
Aug
2030
Millio
n G
allo
n
220
200
180
160
140
120
100
80
60
40
20
0
Fig. 15 Unmet Demand of Mandalay City (Scenario 4)
Int'l Journal of Advances in Agricultural & Environmental Engg. (IJAAEE) Vol. 3, Issue 1 (2016) ISSN 2349-1523 EISSN 2349-1531
http://dx.doi.org/10.15242/IJAAEE.A0416014 190
AMTZ
CATZ
CMTZ
MHAM
PGTG
Demand Site Coverage (% of requirement met)
Scenario: If completion of Ayeyarwaddy and Dotehtawaddy Rive, All months (12)
Jan
2014
Oct
2014
Aug
2015
Jun
2016
Apr
2017
Feb
2018
Dec
2018
Oct
2019
Aug
2020
Jun
2021
Apr
2022
Feb
2023
Dec
2023
Oct
2024
Aug
2025
Jun
2026
Apr
2027
Feb
2028
Dec
2028
Oct
2029
Aug
2030
Perc
en
t
100
90
80
70
60
50
40
30
20
10
0
Fig. 16 Demand Site Coverage of Mandalay City (Scenario 4)
V. CONCLUSION
This study was undertaken to investigate the water
allocaiton of Mandalay city for current and future with Water
Evaluation and Planning (WEAP) model in terms of water
demand, supply delivered, unmet demand and demand site
coverage at city level. The assessment of water supply and
demand using WEAP is conducted based on the reference data
of Year 2014. The assessment model was based on four
scenarios. For reference scenario, overall unmet demand was
381.52 MG/month and demand site coverage was 70.5% at
2030 for Mandalay city. For Scenario 2, overall unmet
demand will rise to 483.31 MG/month and demand site
coverage will be decreased to 62.38% at 2030 because of no
additional supply with population growth. Under Scenario 3,
demand site coverage for Chan Mya Tharzi and Mahar Aung
Myae townships were 100% till Year 2027 and 98.5% between
Year 2028 and 2030. But, Pyi Gyi Tagon Township will be
10.61%. And overall unmet demand will be decreased to
245.46 MG/month and overall demand site coverage for
Mandalay city will be increased to 80.6%. After the Scenario
4, the unmet demand of Year 2025 for Pyi Gyi Tagon
township will decline to half of Year 2024 demand and overall
demand site coverage for Mandalay city was about 88%. If
about 153 MG/month of new projects can be created,
Mandalay city will have no unmet demand at Year 2030.
To conclude above, these two projects will be vitally
needed and new additional projects should be planned to
balance the unmet demand for Mandalay city according to
future scenarios and WEAP model is a very useful water
management tool to predict water shortage and changes in
consumption for current and future.
ACKNOWLEDGMENT
Firstly, the author is greatly indebted to Dr. Nilar Aye,
Professor and head of Department of Civil Engineering,
Mandalay Technological University for her true-line guidance,
precious supervision and editing to complete this paper. The
author also wishes to acknowledge to Daw Aye Aye Thant,
Lecturer of Department of Civil Engineering, Mandalay
Technological University, for her support, careful guidance,
and great interest. The author would like to express his
sincerest gratitude to U Zaw Win Aung, Sub Assistant
Engineer of Water Supply and Sanitation Department, Yangon
City Development Committee, for his kind help, and great
suggestion in enabling to run the WEAP model. Moreover, I
would like to grate thankful to Stockholm Environment
Institute for providing free license of WEAP software to do
this paper. Special thanks to all officers and staffs from
Mandalay City Development Committee and Irrigation
Department for providing the required data, useful reference
books and constant contribution to invaluable knowledge.
Finally, the author greatly expresses his thanks to all persons
who concerned to support for completion of this paper.
REFERENCES
[1] Hla Myo, “Mandalay City Development Committee report,” Mandalay,
Myanmar, 2014.
[2] Asian Development Bank, “Preparing Mandalay Urban Services
Improvement Project report, ” Issue A, 2014.
[3] Asian Development Bank, “Urban Development and Water Sector
Assessment, Strategy, and Road Map for Myanamr, ” 2013.
[4] Robert Speed, Li Yuanyuan, Tom Le Quesne, Guy Pegram and Zhou
Zhiwei, “Basin Water Allocation Planning,” 2013.
[5] Stockholm Environment Institute, “WEAP: Water Evaluation and
Planning System - User Guide, Boston, USA, ” 2011.
[6] Stockholm Environment Institute, “WEAP: Water Evaluation and
Planning System - Tutorial, Boston, USA, ” 2011
[7] http://www.weap21.org
About Author (s):
Mr. Kaung Myat, Ph.D Student, Department of Civil
Engineering, Mandalay Technological University,
Republic of the Union of Myanmar, Specialized field is
Water Resources Engineering.
Dr. Nilar Aye, B.E. (Civil), RIT; M.Civ.(Engg:);
University of Hannover, GERMANY; Ph.D.(CWRE),
YTU, Professor and Head, Department of Civil
Engineering, Mandalay Technological University,
Republic of the Union of Myanmar, Specialized field is
Water Resources Engineering and Watershed
Management.
Int'l Journal of Advances in Agricultural & Environmental Engg. (IJAAEE) Vol. 3, Issue 1 (2016) ISSN 2349-1523 EISSN 2349-1531
http://dx.doi.org/10.15242/IJAAEE.A0416014 191