Embed Size (px)
Citation preview
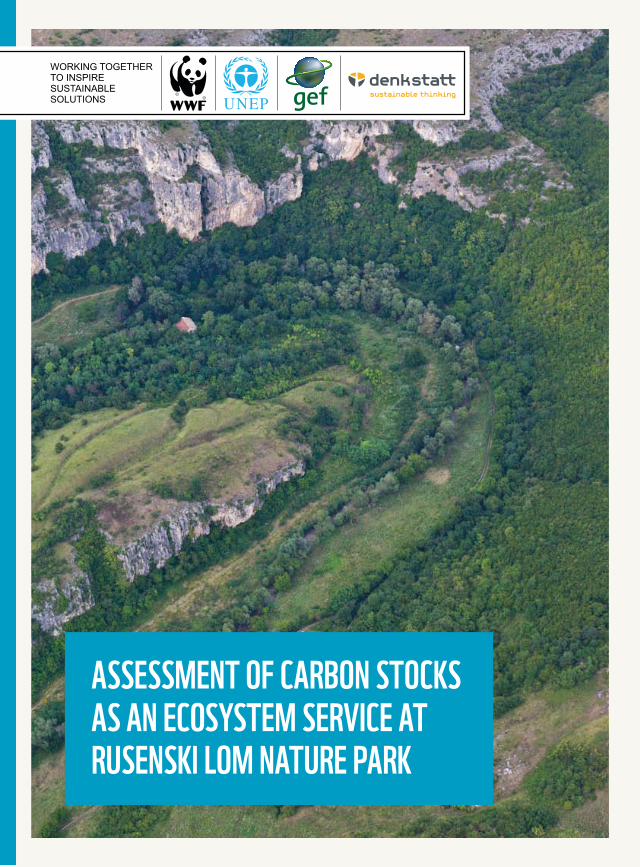
Assessment of cArbon stocks As An ecosystem service At rusenski Lom nAture PArk
WORKING TOGETHER TO INSPIRE SUSTAINABLE SOLUTIONS
Carbon stocks – Rusenski Lom | 2012
Authors: Rashid Rashid, Petar SeizovEditor: Maya TodorovaTranslation: Boriana CruzDesign concept: Boyan Petkov, Ina KalchevaPrinted at Geosoft EOOD
Cover photo: © Alexander Ivanov© Text 2012 WWF Danube-Carpathian ProgrammeAll rights reserved This study was prepared as part of the project PROMOTING PAYMENTS FOR ECOSYSTEM SERVICES
AND RELATED SUSTAINABLE FINANCING SCHEMES IN THE DANUBE BASIN.
This project promotes and supports land managers who help us sustain the benefi ts that we all get from nature.
The project is implemented by the WWF Danube-Carpathian Programme with the financial support of the GEF
through UNEP and the European Commission.
About denkstattdenkstatt is a leading consulting company in the field of sustainable development and environmental management in Central and Eastern Europe. denkstatt helps its customers to reduce their impact on the environment while maintaining economic viability, to implement innovative solutions that meet the challenges of sustainable development and to strengthen their competitiveness. The work of the company speeds up the transition to a sustainable economy.
WWF-DCPOOttakringer Straße 114-1161160 Vienna, AustriaPhone: +43 1 524 54 70Fax: +43 1 524 54 [email protected], www.panda.org/dcpo
WWF-Bulgaria38 Ivan Vazov Street, app. 2-4Phone: +359 2 950 50 40, +359 2 950 50 41Fax: +359 2 981 66 [email protected], wwf.bg
WWF-RomâniaStr. Ioan Caragea Voda nr. 26A, 010537,sector 1, BucurestiPhone: +40 21 317 49 96Fax: +40 21 317 49 [email protected], wwf.ro
Carbon stocks – Rusenski Lom | 2012
contents
1 foreword
2 bAckground
3 Project subject, scoPe And goAL3.1 Subject
3.2 Scope
3.3 Goal
4 methodoLogy4.1 Calculation of the carbon stocks
4.2 Assessment of the economic value of the sink capacity
5 resuLts5.1 Carbon stock and CO2 emissions
5.2 Assessment of the potential emission savings on the basis of the envisaged
nature protection measures
5.3 Economic evaluation of the carbon stock
5.4 Conclusions
1
3
55
5
5
66
7
1414
15
17
18
Carbon stocks – Rusenski Lom | 2012
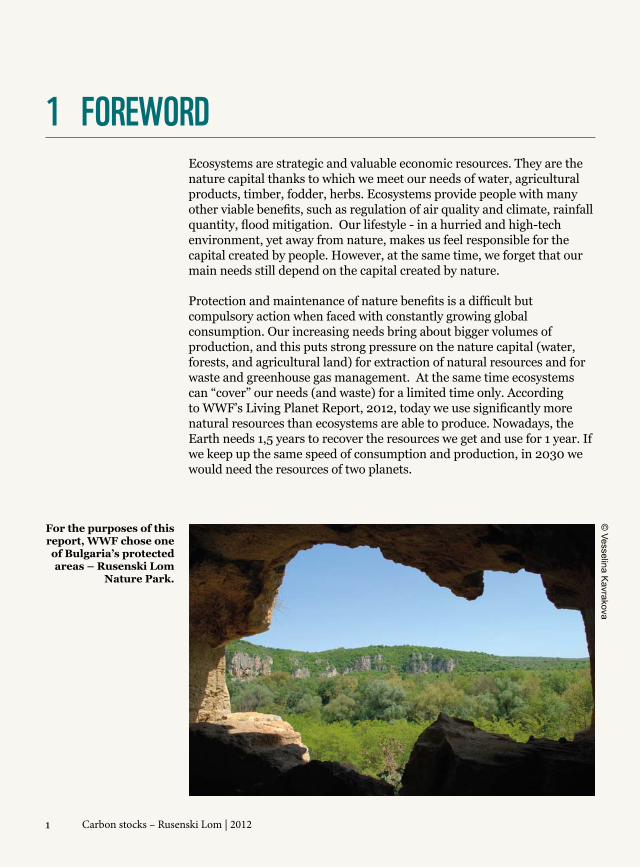
1 foreword Ecosystems are strategic and valuable economic resources. They are the nature capital thanks to which we meet our needs of water, agricultural products, timber, fodder, herbs. Ecosystems provide people with many other viable benefits, such as regulation of air quality and climate, rainfall quantity, flood mitigation. Our lifestyle - in a hurried and high-tech environment, yet away from nature, makes us feel responsible for the capital created by people. However, at the same time, we forget that our main needs still depend on the capital created by nature.
Protection and maintenance of nature benefits is a difficult but compulsory action when faced with constantly growing global consumption. Our increasing needs bring about bigger volumes of production, and this puts strong pressure on the nature capital (water, forests, and agricultural land) for extraction of natural resources and for waste and greenhouse gas management. At the same time ecosystems can “cover” our needs (and waste) for a limited time only. According to WWF’s Living Planet Report, 2012, today we use significantly more natural resources than ecosystems are able to produce. Nowadays, the Earth needs 1,5 years to recover the resources we get and use for 1 year. If we keep up the same speed of consumption and production, in 2030 we would need the resources of two planets.
For the purposes of this report, WWF chose one of Bulgaria’s protected areas – Rusenski Lom
Nature Park.
© Vesselina K
avrakova
1
Carbon stocks – Rusenski Lom | 2012
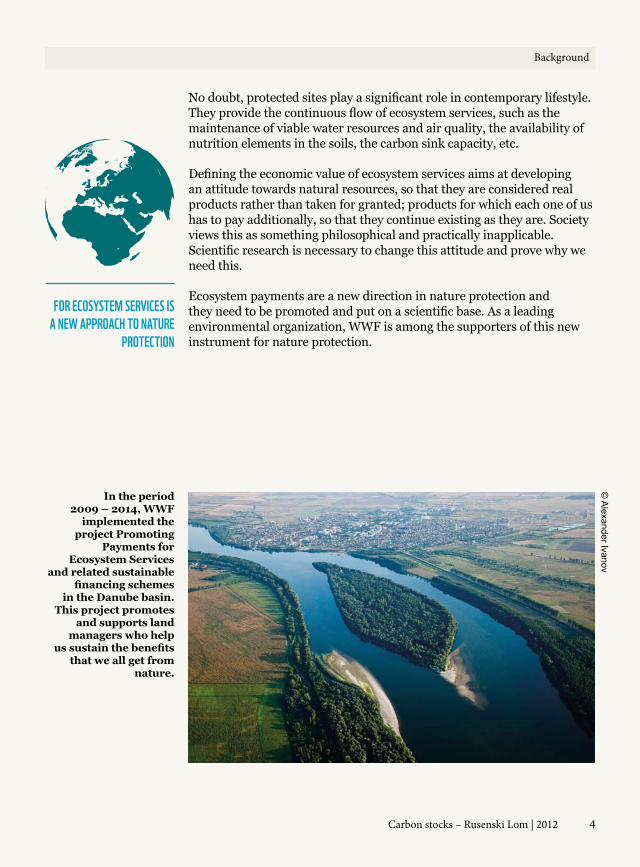
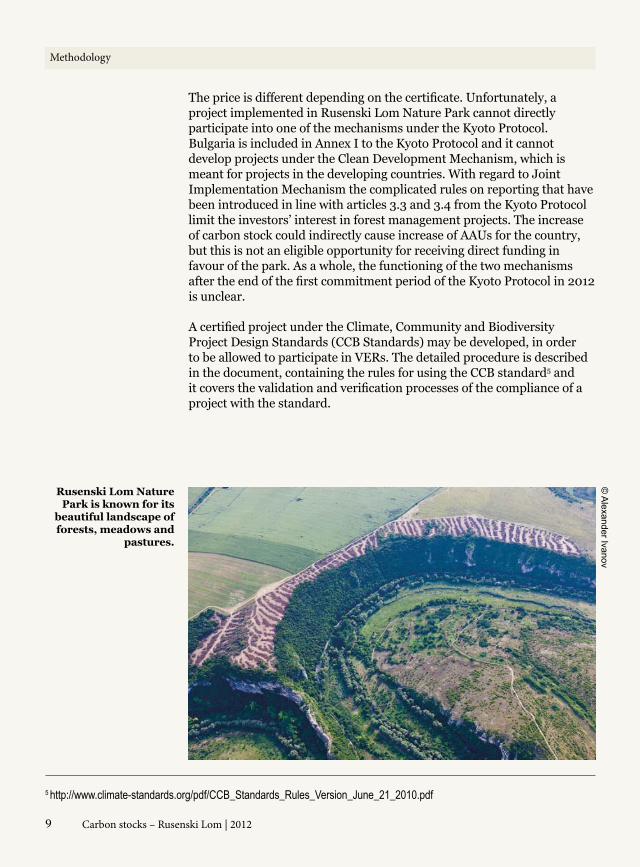
Rusenski Lom Nature Park is located near the city of Ruse in the canyon-like relief of Rusenski Lom River, the last main tributary of the Danube River in Bulgaria. The Park is situated on an area of 3408 ha and spreads over the municipalities of Ivanovo, Vetovo and Tsar Kaloyan. Rusenski Lom Nature Park is famous for its beautiful landscape. It is called “a mountain in the plain” and it is known for its incredible diversity of orchids, birds, bats and butterflies. It is also famous for its rich cultural and historical heritage. The archeological reserve Ivanovo Rock Churches, declared a world heritage site by UNESCO, and the medieval fortified town of Cherven are located there.
Maya Todorova
Project Manager Payments for ecosystem services in the Danube River Basin, WWF
The current report demonstrates just a small part of the benefits that Bulgarian nature provides. We chose a protected area (Rusenski Lom Nature Park) and calculated the value of one of its benefits (carbon sink and storage). The benefits of Rusenski Lom Nature Park have many more aspects and have been shown by other WWF studies to amount to about 230,000 EUR per year (excl. the value of game and stored carbon). The report shows how much and in what way the carbon sink capacity of this protected area can be increased, which in turn would bring social and economic benefits. But we should not forget that ecosystems are a living and sensitive system, and the protection of one function (the economic benefit) needs to be balanced and not at the expense of other functions.
2
Foreword
Carbon stocks – Rusenski Lom | 2012
2 bAckground Natural resources offer various and multiple benefits to society. Some of these benefits are obvious to everyone, and they affect directly our economic situation, while others are not so obvious or are perceived as something granted by Nature. These “granted” benefits are the so called ecosystem services, which are not part of the modern economic system and are defined as non-market resources.
One ecosystem service, provided for free to mankind by forest ecosystems, is the capacity of forests to hold/store carbon. According to the Intergovernmental Panel on Climate Change (IPCC) the anthropogenic impact causes increased concentration of greenhouse gases, such as carbon dioxide, nitrous oxide, methane etc. in the atmosphere, and thus gradual warming of our planet. Therefore, by using CO2 from the atmosphere for their life needs, the so called “carbon sinks” regulate carbon concentration, and this in turn mitigates the effects of climate change.
When it come to carbon sink capacity, it is important to distinguish between forests developing under different conditions (related to climate, ecology, soil, etc.). It is not appropriate to compare high productive seed forests, such as the forests in the Rhodopi mountain in Bulgaria, with low productive sprout oak forests, such as the forests in Rusenski Lom Nature Park. The comparison is possible only when all conditions are equal.
Forests are among the most important carbon sinks, but when it comes to special use forests like those in Rusenski Lom Nature Park, the priorities need to be set with view to their nature protection qualities, which does not always mean high carbon sink capacity. Forest management measures, in order to maintain the conservation quality and thus improve the carbon sink capacity, are a better solution in the long run, instead of targeted increase of forests’ carbon stocks at any cost.
3
cArbon sinking is A free service offered to
mAnkind by forests
Carbon stocks – Rusenski Lom | 2012
No doubt, protected sites play a significant role in contemporary lifestyle. They provide the continuous flow of ecosystem services, such as the maintenance of viable water resources and air quality, the availability of nutrition elements in the soils, the carbon sink capacity, etc.
Defining the economic value of ecosystem services aims at developing an attitude towards natural resources, so that they are considered real products rather than taken for granted; products for which each one of us has to pay additionally, so that they continue existing as they are. Society views this as something philosophical and practically inapplicable. Scientific research is necessary to change this attitude and prove why we need this.
Ecosystem payments are a new direction in nature protection and they need to be promoted and put on a scientific base. As a leading environmental organization, WWF is among the supporters of this new instrument for nature protection.
4
for ecosystem services is A new APProAch to nAture
Protection
Background
© A
lexander Ivanov
In the period 2009 – 2014, WWF
implemented the project Promoting
Payments for Ecosystem Services
and related sustainable financing schemes
in the Danube basin. This project promotes
and supports land managers who help
us sustain the benefits that we all get from
nature.
Carbon stocks – Rusenski Lom | 2012
3 Project subject, scoPe And goAL3.1 subjectThe subject of research under this project is the territory of Rusenski Lom Nature Park. The territory of the park consists of afforested areas, meadows and grazing lands. The calculations are based on the park’s total afforested area of 2399.7 ha, 1831.44 ha of which are occupied by local species (cerris oak, oriental hornbeam, etc.), and 568.3 ha by non-native species – robinia pseudoacacia, honeylocust, Euro-American poplars, querus ribra, ailanthus altissima and native species though not typical for the park’s region species – Scots pine and European black pine. The area occupied by meadows and grazing lands is 438.6 ha.
3.2 scoPe
The research is limited to calculation of organic carbon stocks, stored on the territory of Rusenski Lom Nature Park. The carbon is stored in the following components of the forest ecosystems:
• biomass (above-ground and underground),
• litter layer forest floor,
• dead wood,
• soil resources.
With view to meadows and grazing lands, the calculations cover only the organic carbon stored in the soil.
3.3 goALProject goals are:
1. Calculation of the carbon stocks of the various territories of Rusenski Lom Nature Park by type – forests, meadows and grazing lands;
2. Assigning an economic value to the saved carbon emissions;
3. Setting a scenario for changing the carbon stocks depending on way forest ecosystems are managed at Rusenski Lom Nature Park.
5
Carbon stocks – Rusenski Lom | 2012 6
4 methodoLogy 4.1 cALcuLAtion of the cArbon stocksThe methodology used is based on the principles set in the guidelines of IPCC1, Part LULUCF – Land use, land-use change and forestry.
The determination of the total amount of organic carbon is done by summing up the amounts of carbon for the separate parts (sinks) of a forest ecosystem. The methodology distinguishes the following forest ecosystem sinks:
• Live biomass – underground and above-ground
It includes all live flora in the forest ecosystem. Underground biomass includes the root system of the tree species, and the above-ground biomass – stalks, branches and foliage mass.
• Litter layer of the forest floor
It is composed of fallen and/or decaying leaves and branches (duff) in the forest.
• Deadwood
It includes standing dead trees, as well as waste2.
• Soil resources
Soils accumulate large quantities of carbon. About 90 % of the organic carbon is found in the 0—40 cm layer. Therefore the calculations of the carbon stock in the soil include only this soil layer.
Formula 3.2.3 from the Methodology (IPCC Good Practice Guidance for LULUCF, p. 3.24) is used to calculate the organic carbon values in the live biomass. The carbon in the litter layer on the forest floor, the deadwood and the soils is calculated on the basis of the so called referent values.
1 The Intergovernmental Panel on Climate Change is the leading international body for assessment of climate change. It was established by the United Nations Environmental Programme and the World Meteorological Organisation in 1988 to provide clear scientific vision of the current condition of the climate change related knowledge and the potential environmental damage and social and economic consequences. 2 Waste – whole dead trees and fallen logs and branches.
Carbon stocks – Rusenski Lom | 2012
The referent values are numerical expressions of the quantity of organic carbon per unit of volume/area/mass. The choice of the referent values affects directly the precision of the calculations. It is recommended to use specific national, regional and local referent values. The national referent values have been used in the calculations for Rusenski Lom Nature Park.
4.2 Assessment of the economic vALue of the sink cAPAcitySink or sequestration capacity is one of the ecosystem services, provided to us by the natural ecosystems. Assigning an economic value to ecosystem service allows for a comparison to other products and services of modern economy.
There exist a number of methods for assessment of the economic value of the ecosystem services. The most relevant ones for this specific case are the following:
1. Avoided Damage Method
2. Contingent Valuation Method
3. Alternative Cost Method to Reduce Emissions
4. Revealed Preference Method for Reducing Emissions
5. Market Method
6. Replacement Cost Method
7. Marginal Social Opportunity Cost
For lack of detailed data the economic assessment has been made by using only two methods – Market method and Alternative Cost Method to Reduce Emissions.
Methodology
7
Carbon stocks – Rusenski Lom | 2012 8
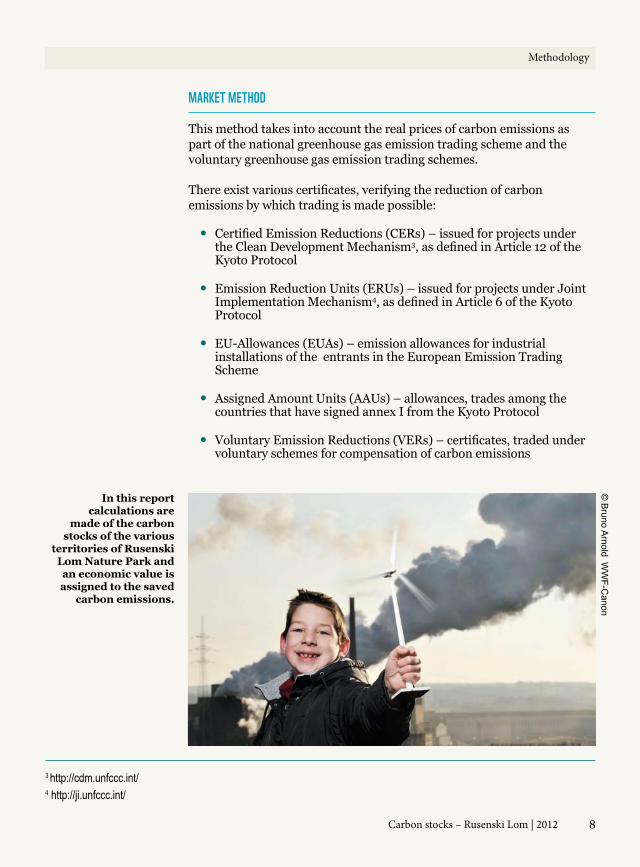
mArket method
This method takes into account the real prices of carbon emissions as part of the national greenhouse gas emission trading scheme and the voluntary greenhouse gas emission trading schemes.
There exist various certificates, verifying the reduction of carbon emissions by which trading is made possible:
• Certified Emission Reductions (CERs) – issued for projects under the Clean Development Mechanism3, as defined in Article 12 of the Kyoto Protocol
• Emission Reduction Units (ERUs) – issued for projects under Joint Implementation Mechanism4, as defined in Article 6 of the Kyoto Protocol
• EU-Allowances (EUAs) – emission allowances for industrial installations of the entrants in the European Emission Trading Scheme
• Assigned Amount Units (AAUs) – allowances, trades among the countries that have signed annex I from the Kyoto Protocol
• Voluntary Emission Reductions (VERs) – certificates, traded under voluntary schemes for compensation of carbon emissions
3 http://cdm.unfccc.int/ 4 http://ji.unfccc.int/
© B
runo Arnold W
WF-C
anon
In this report calculations are
made of the carbon stocks of the various
territories of Rusenski Lom Nature Park and an economic value is assigned to the saved
carbon emissions.
Methodology
Carbon stocks – Rusenski Lom | 20129
The price is different depending on the certificate. Unfortunately, a project implemented in Rusenski Lom Nature Park cannot directly participate into one of the mechanisms under the Kyoto Protocol. Bulgaria is included in Annex I to the Kyoto Protocol and it cannot develop projects under the Clean Development Mechanism, which is meant for projects in the developing countries. With regard to Joint Implementation Mechanism the complicated rules on reporting that have been introduced in line with articles 3.3 and 3.4 from the Kyoto Protocol limit the investors’ interest in forest management projects. The increase of carbon stock could indirectly cause increase of AAUs for the country, but this is not an eligible opportunity for receiving direct funding in favour of the park. As a whole, the functioning of the two mechanisms after the end of the first commitment period of the Kyoto Protocol in 2012 is unclear.
A certified project under the Climate, Community and Biodiversity Project Design Standards (CCB Standards) may be developed, in order to be allowed to participate in VERs. The detailed procedure is described in the document, containing the rules for using the CCB standard5 and it covers the validation and verification processes of the compliance of a project with the standard.
5 http://www.climate-standards.org/pdf/CCB_Standards_Rules_Version_June_21_2010.pdf
Rusenski Lom Nature Park is known for its
beautiful landscape of forests, meadows and
pastures.
© A
lexander Ivanov
Methodology

Carbon stocks – Rusenski Lom | 2012 10
The validation process consists of the following steps:
1. Preparation of documentation that describes how the project meets the requirements of the CCB Standards.
2. Engagement of a qualified auditor.
3. Publication and dissemination of the project design documentation (PDD) for public comment.
4. Validation audit site visit.
5. Preparation by the auditor of a Draft CCB Validation Report.
6. Revision of the project design to address any identified deficiencies.
7. Preparation by the auditor of the Final CCB Validation Report and CCB Validation Statement
8. Publication of the revised PDD, Final CCB Validation Report, CCB Validation Statement and the project’s CCB Status on the CCBA website.
After the project is validated and successfully implemented according to the approved documentation it should be verified. The verification process consists of the following steps:
1. Publication and dissemination of climate, community and biodiversity monitoring plans and reports.
2. Preparation of documentation that describes how the project met the requirements of the CCB Standards.
3. Engagement of a qualified auditor.
4. Publication and dissemination of the project implementation report for public comment.
5. Verification audit site visit.
6. Preparation by the auditor of a Draft CCB Verification Report.
7. Response to deficiencies identified in the Draft CCB Verification Report.
8. Preparation by the auditor of the Final CCB Verification Report and CCB Verification Statement.
9. Posting of the Final CCB Verification Report, CCB Verification Statement and the project’s CCB status to the CCBA website.
Methodology
Carbon stocks – Rusenski Lom | 2012
A detailed list and information on the verified projects can be found on the CCBA’s website6.
Assigning economic value to the carbon emissions can be done on the basis of the average price of EUA (certificates under the European Emissions Trading Scheme), ERU (certificates under Joint Implementation Mechanism) and CER (certificates under Clean Development Mechanism), since the official trading is done through them. According to the data of one of the largest climate exchanges for the ERU and CER certificates - BlueNext7, the average price in 2012 is about 4 EUR/t, which is a serious decrease compared to 2011, when the certificates were traded at 12 EUR/t. The average price for the EUA certificates is about 8 EUR/t, which is a significant decrease compared to 16 EUR/t at the beginning of 2011.
With VER certificates (certificates traded under the voluntary carbon emissions compensation scheme), the trading is not done through centralised exchanges, and it’s quite difficult to state a price per tonne of emissions, as it largely depends on the platform used in the respective country, but it is possible that the price of the voluntary VER certificates exceeds significantly the prices of the other certificates. Currently, the voluntary emissions compensation scheme Climate Austria8 trades 1 t at 20 EUR.
Since it is quite unclear how the mechanism with ERU and CER certificates will continue functioning after the end of the commitment period under the Kyoto Protocol, and for the purposes of the comparison we have chosen an average price of 8 EUR/t, which is equal to the price of the EUA certificates. The assessment is relatively conservative due to the higher price per emissions tonne in the voluntary schemes and the expectations for increase of the EUA certificates price.
6 http://www.climate-standards.org/projects/ 7 http://www.bluenext.eu/8 https://www.climateaustria.at
11
Methodology
Carbon stocks – Rusenski Lom | 2012
ALternAtive cost method to reduce emissions
This method takes into account the investments, required for reduction of greenhouse gas emissions in a given industry or economic sector. A typical example are the investments in installations for CO2 sequestration, higher energy efficiency, hydroelectric power stations, etc.
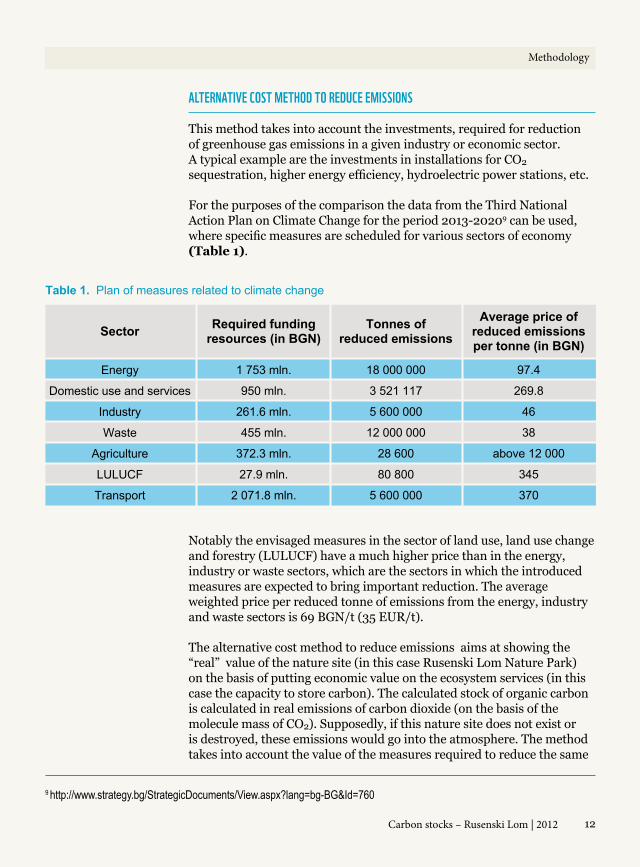
For the purposes of the comparison the data from the Third National Action Plan on Climate Change for the period 2013-20209 can be used, where specific measures are scheduled for various sectors of economy (Table 1).
12
Sector Required fundingresources (in BGN)
Tonnes ofreduced emissions
Average price ofreduced emissionsper tonne (in BGN)
Energy
Domestic use and services
Industry
Waste
Agriculture
LULUCF
Transport
1 753 mln.
950 mln.
261.6 mln.
455 mln.
372.3 mln.
27.9 mln.
2 071.8 mln.
18 000 000
3 521 117
5 600 000
12 000 000
28 600
80 800
5 600 000
97.4
269.8
46
38
above 12 000
345
370
Table 1. Plan of measures related to climate change
Notably the envisaged measures in the sector of land use, land use change and forestry (LULUCF) have a much higher price than in the energy, industry or waste sectors, which are the sectors in which the introduced measures are expected to bring important reduction. The average weighted price per reduced tonne of emissions from the energy, industry and waste sectors is 69 BGN/t (35 EUR/t).
The alternative cost method to reduce emissions aims at showing the “real” value of the nature site (in this case Rusenski Lom Nature Park) on the basis of putting economic value on the ecosystem services (in this case the capacity to store carbon). The calculated stock of organic carbon is calculated in real emissions of carbon dioxide (on the basis of the molecule mass of CO2). Supposedly, if this nature site does not exist or is destroyed, these emissions would go into the atmosphere. The method takes into account the value of the measures required to reduce the same
9 http://www.strategy.bg/StrategicDocuments/View.aspx?lang=bg-BG&Id=760
Methodology
Carbon stocks – Rusenski Lom | 2012
amount of carbon dioxide emissions (stored in the nature site), but from another sector of economy, i.e. if we destroy the nature site, the subject of study, or if it simply doesn’t exist, how much we should pay in order to reduce equal amount of carbon emissions through measures in other economic sector.
Let’s assume that in order to reduce equal amount of possible emissions of Rusenski Lom Nature Park, we’d need to invest in the transformation of petrol cars by mounting LPG- or CNG-fuelling units. Taking into account the cost of such transformation we compare the emissions that could be saved. The result we obtain is a value in currency units per tonne of carbon dioxide savings (BGN/tonne).
The comparison with mounting LPG- or CNG-fuelling units to petrol cars is chosen for its widespread practice in Bulgaria and thus being an easy-to-grasp example. Let’s imagine that a petrol car should drive 500 km. The CO2 emissions during such a trip are equal to 94.5 kg10. The same trip made by a CNG car would set off 78 kg of emissions. The method takes into account the difference in the emissions savings by assigning value to them based on the investments required for reduction, i.e. the cost of mounting a gas fuelling unit. In this particular case after assessing the emission savings as a result from forest management measures, we estimate the amount that needs to be invested in gas fuelling units for cars in order to achieve the same effect by emission „sinking“ by the forest. The result would allow us to decide on the more cost-effective measure.
10 The accounts are based on data for a VW Caddy car.
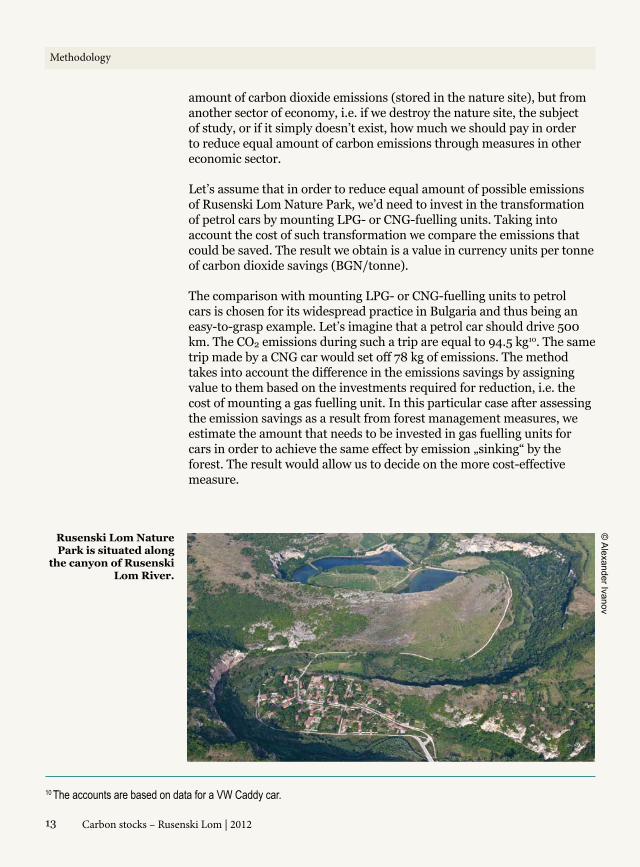
Rusenski Lom Nature Park is situated along
the canyon of Rusenski Lom River.
© A
lexander Ivanov
13
Methodology
Carbon stocks – Rusenski Lom | 2012
5.1 cArbon stock And co2 emissions Data on the forest plantations from the forest management plans in the period 1990-2012 has been used in the calculation of the organic carbon stocks from Rusenki Lom Nature Park. The required data relates to biomass stock, area of plantations, density and age of tree species by type. Other necessary data include timber thickness and the proportion between the above-ground and underground mass of the trees.
The results distributed along the different sinks of the forest ecosystems, the meadows and the grazing lands in the territory of Rusenski Lom Nature Park are the following:
Live biomAss
The calculated total biomass based on the data from the project under the Forest Management Plan of Rusenski Lom Nature Park amounts to 206 745 m3. This is equal to 83 464 t of organic carbon, accumulated in the above-ground and undeground biomass of the forest ecosystems in Rusenski Lom Nature Park. Furthermore, it is equal to 306 035 t eqCO2.
deAdwood And Litter LAyer of the forest fLoor
The organic carbon amounts to 18 836 t or 69 065 t eqCO2, and in the deadwood are stored 4 173 t organic carbon or 15 302 t eqCO2. The calculations are based on referent values of the content of carbon in the litter layer of the forest floor (5.38 tC/ha) and in deadwood (5% of live biomass).
soiLs
Organic carbon stored in the forest soils amounts to 181 279 t. This is equal to 664 691 t eqCO2. The calculations are based on referent values for chernozemic soils by horizons, as follows: 0-5 cm – 19.73 tCa/ha; 5-10 cm – 16.86 tCa/ha; 10-20 cm – 20.63 tCa/ha; 20-40 cm – 18.73 tCa/ha.
5 resuLts
the totAL Amount of orgAnic cArbon from
the entire territory of rusenski Lom nAture PArk
is equAL to 321 064 t.
the totAL cArbon emissions equivALent for
the entire territory of rusenski Lom nAture PArk
Amounts to 1 177 232 t.
14
Carbon stocks – Rusenski Lom | 2012
meAdows And grAzing LAnds
The calculations for meadows and grazing lands are based on referent values for chernozemic soils. The total amount of the organic carbon stored in the meadows and the grazing lands amounts to 33 311 t, and the equivalent carbon emissions are 122 139 t.
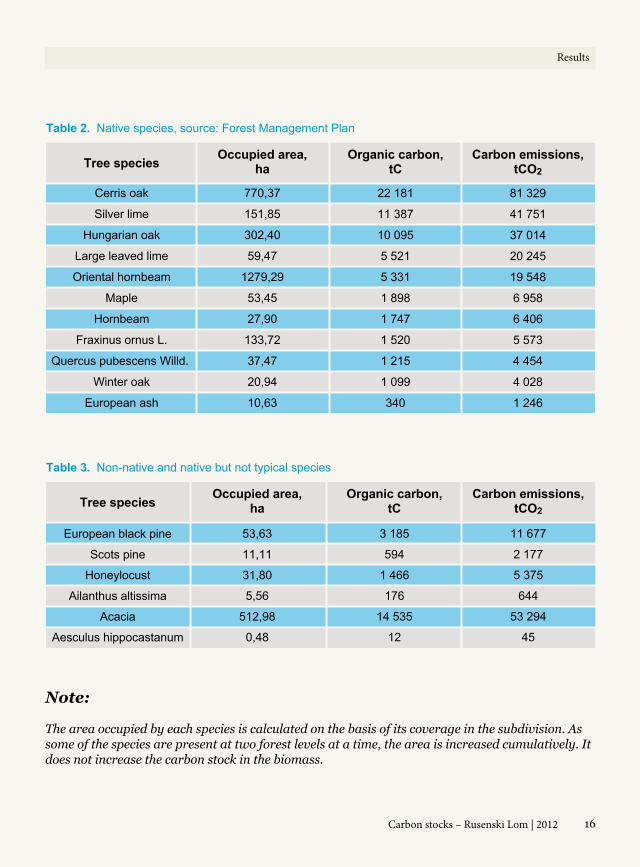
5.2 Assessment of the PotentiAL emission sAvings on the bAsis of the envisAged nAture Protection meAsures On the basis of the measures envisaged in the Forest Management Plan (2000– 2012) of Rusenski Lom Nature Park assessment of the potential emission savings has been made. The available information has allowed for assessment of only one measure – afforestation with typical native species. For this purpose we have made a replacement of all forest areas, occupied by non-native species (mainly acacia and ailanthus altissima) and native but not typical species (mainly European black pine and Scots pine) with typical native species from Table 2.
The calculations are based only on the data from the forest ecosystems in Rusenski Lom Nature Park, as the area occupied by native but not typical and non-native species (see Table 3) is directly replaced by the species from Table 2. The replacement is done by an average mixed forest at the average age of 40 years. Thus, real data for species that have reached the age of 40 years under equal ecological, climate and edaphic environmental factors have been used in the calculations instead of standard growth factors. An assumption has been made that the replaced species are almost 40 years old, which will practically happen in 40 years time. The use of long-term measures in the forest management undertakings is necessary due to the character of the nature sites.
As a result from the application of this measure of replacement with native species on the area occupied by native but not typical and non-native species, the carbon sink capacity of the forest ecosystems has increased by 67 492 t carbon emissions equivalent for 40 year period (16 873 t for 10 year period11).
11 The result for the 10-year period is calculated in the same way as for the 40-year period, and it is divided by 4. This is made with the aim to facilitate the comparison with other services and products, for which 40-year period is not relevant. Actually the tree does not grow uniformly during its entire life cycle. The different tree species have different growth trend. There are fast growing trees, which have intensive growth during the first 10-30 years (poplars and willows), but with slow growing trees (oaks) the growth trend is characterized by its smoothness. The calculation of intensity of accumulation of organic carbon in the tree species is not included in this project.
Results
15
Carbon stocks – Rusenski Lom | 2012
Tree species Occupied area,ha
Organic carbon,tC
Carbon emissions,tCO2
Cerris oak
Silver lime
Hungarian oak
Large leaved lime
Oriental hornbeam
Maple
Hornbeam
Fraxinus ornus L.
Quercus pubescens Willd.
Winter oak
European ash
770,37
151,85
302,40
59,47
1279,29
53,45
27,90
133,72
37,47
20,94
10,63
22 181
11 387
10 095
5 521
5 331
1 898
1 747
1 520
1 215
1 099
340
81 329
41 751
37 014
20 245
19 548
6 958
6 406
5 573
4 454
4 028
1 246
Table 2. Native species, source: Forest Management Plan
European black pine
Scots pine
Honeylocust
Ailanthus altissima
Acacia
Aesculus hippocastanum
53,63
11,11
31,80
5,56
512,98
0,48
3 185
594
1 466
176
14 535
12
11 677
2 177
5 375
644
53 294
45
Table 3. Non-native and native but not typical species
Tree species Occupied area,ha
Organic carbon,tC
Carbon emissions,tCO2
Note:
The area occupied by each species is calculated on the basis of its coverage in the subdivision. As some of the species are present at two forest levels at a time, the area is increased cumulatively. It does not increase the carbon stock in the biomass.
Results
16
Carbon stocks – Rusenski Lom | 2012
5.3 economic evALuAtion of the cArbon stock
mArket method
At an average price of carbon emissions equivalent of 8 EUR/t the total value of the emission savings from the application of the envisaged measures for a period of 10 years is equal to 134 854 EUR.
ALternAtive cost method to reduce emissions
The calculation by this method is made on the basis of 2 values: the average value of the measures from the National Action Plan on Climate Change for the period 2013—2020 and the necessary expenses for mounting LPG- or CNG-fuelling units to petrol cars in order to achieve emission reduction equivalent to the additional stock from the application of measures in Rusenski Lom Nature Park.
The economic assessment of the potential emission savings or the increased sink capacity, calculated on a basis of 35 EUR/t (National Action Plan on Climate Change for 2013—2020) – average value (see Table 1), amounts to 590 556 EUR for a 10-year period.
On the basis of data from an automobile manufacturer on the emissions of CO2/km for one and the same car model (VW Caddy), respectively using petrol, LPG or CNG, 11% reduction for LPG and 17% reduction for CNG. The calculation of the total savings is made for a 10-year period at an average annual mileage of 12 000 km and a price for mounting an LPG- or CNG-fuelling unit of 1000 and 1500 BGN respectively. An average price of the CO2 emissions reduction is calculated at 420 BGN/t for the cars, where petrol is replaced by LPG and 380 BGN/t when replaced by CNG.
In this comparison the total value of the increased carbon stock amounting to 16 873 eqCO2 for a 10-year period is equal to 3 452 284 EUR, if the same result needs to be achieved by the replacement of the used transport fuel at an average price of 400 BGN/t.
17
Results
Carbon stocks – Rusenski Lom | 2012
5.4 concLusionsThe increase of carbon sink capacity of the forest ecosystems as a result of the applied measure of afforestation with native species is proved by the calculations on the basis of the available data for the stock of biomass in the forest plantations of Rusenski Lom Nature Park. This data is specific for the place and the result may be different for another area, where artificial plantations have better growth dynamics than the native species. This in no case means that afforestation of the forests with non-native species with high sink capacity should be prioritised. Local species have their advantages and evaluation based only on the sink capacity of a certain territory, does not give a complete idea of the value of the ecosystem service, which this territory offers to mankind.
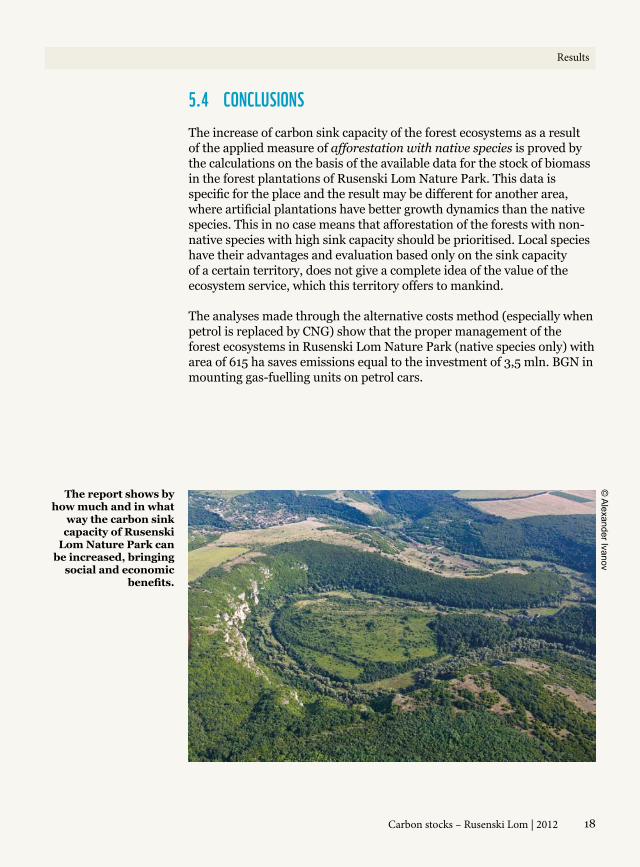
The analyses made through the alternative costs method (especially when petrol is replaced by CNG) show that the proper management of the forest ecosystems in Rusenski Lom Nature Park (native species only) with area of 615 ha saves emissions equal to the investment of 3,5 mln. BGN in mounting gas-fuelling units on petrol cars.
The report shows by how much and in what
way the carbon sink capacity of Rusenski
Lom Nature Park can be increased, bringing
social and economic benefits.
© A
lexander Ivanov
18
Results
Carbon stocks – Rusenski Lom | 2012
Recommendations:
If all forest management measures are assessed, including rejected or unplanned ones in the corresponding forest management plans, their potential impact on the sink capacity of the forest ecosystems can be established. For this purpose soil, leave and wood samples need to be taken from the surveyed forest ecosystems and a database with all past periods data needs to be created.
Assessment of FSC certified forests would contribute to a more complete idea of the sink capacity of a given exemplary forest ecosystem, since the FSC certification contributes to responsible management of the forests. FSC considers forests a complex system, whose mission is to achieve balance among all functions – nature protective, social, recreational, timber harvest, carbon sink, etc. For example many of the forest voluntary schemes for emissions trading require forest ecosystems to be certified under FSC.
To obtain best results and truthful data, it is necessary to consider test areas, on which monitoring will be performed over many years. WWF can initiate a project on a national scale for assessing all forest management measures and analysing their impact on the proposed ecosystem services.
In order to be able to determine more realistically the value of the ecosystem services offered by a nature park, we recommend the assessment to be based on more than one methods, such as Contingent Valuation Method, Replacement Cost Method, Marginal Social Opportunity Cost.
19
Results
Carbon stocks – Rusenski Lom | 2012
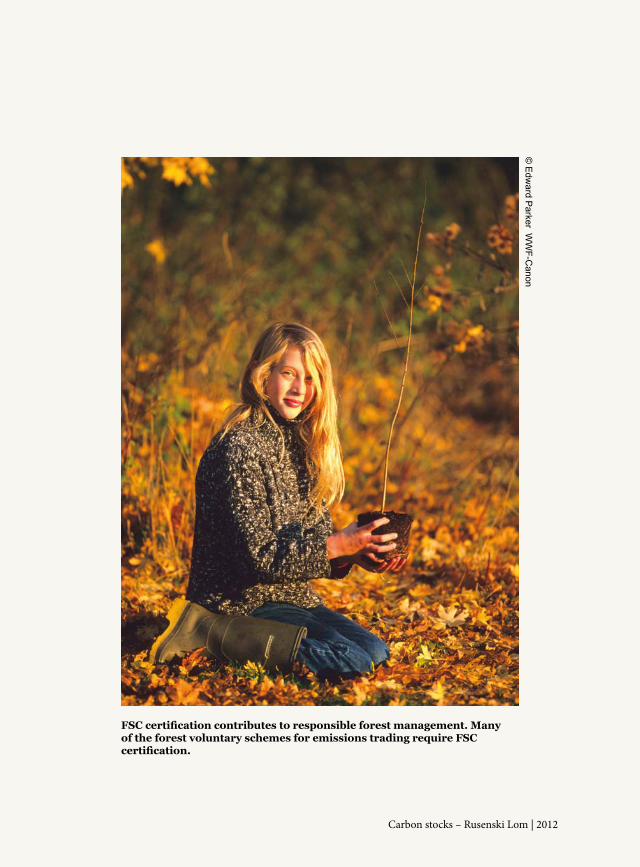
FSC certification contributes to responsible forest management. Many of the forest voluntary schemes for emissions trading require FSC certification.
© E
dward P
arker WW
F-Canon
•Assessment of cArbon stocks
wwf in numbers
www.PAndA.org/dcPo
WWF has more than 5,000 staff worldwide
WWF, a leading organization since 1961
WWF works in more than 100 countries, on 6 continents
We have more than 5 million Supporters
5 000 +
1961
100 +
5 м
engLish
To stop the degradation of the planet’s natural environment andto build a future in which humans live in harmony with nature.
Why we are here.
www.panda.org/dcpo
![Ecosystem carbon stocks of mangroves across broad ... · Introduction Mangroves provide many ecosystem services that directly benefit biodiversity and human soci-ety [1–3]. Mangroves](https://img.pdfslide.us/doc/110x75/5fcb7a9d68debf2fd338ae6c/ecosystem-carbon-stocks-of-mangroves-across-broad-introduction-mangroves-provide.jpg)