Embed Size (px)
Citation preview

March 8, 2001A. R. Raffray, et al., Assessment of Carbon and Tungsten Dry Chamber Walls under IFE Energy Depositions
Assessment of Carbon and Tungsten Dry ChamberWalls under IFE Energy Depositions
A. R. Raffray, M. S. Tillack, X. Wang, M. ZaghloulUniversity of California, San Diego
ARIES MeetingLivermore
March 8-9, 2001
March 8, 2001A. R. Raffray, et al., Assessment of Carbon and Tungsten Dry Chamber Walls under IFE Energy Depositions
Outline of Presentation
• Thermal analysis– Consider C and W– Refined mesh for more accurate energy deposition calculations– Use material properties as a f(T), in particular k(T)– Inclusion of sublimation– Refined mesh for more accurate fiber analysis– Sensitivity analysis (total energy, ion energy deposition calculations)
• Lifetime issue– Identify possible erosion mechanisms– Assess relevance and order of magnitude for IFE application
• Concluding remarks– Status based on analysis– Remaining issues
March 8, 2001A. R. Raffray, et al., Assessment of Carbon and Tungsten Dry Chamber Walls under IFE Energy Depositions
Lifetime is a Key Dry Chamber Wall Issue
• Material Option (C, W, SiC ...)• Material Configuration to Help Accommodate Energy Deposition• Protective Chamber Gas, e.g. Xe
- Effect on target injection- Effect on laser- UW has performed detailed comparative studies for different
materials and gas pressures (R. Peterson/D. Haynes)
• GoalDry wall material configuration(s) which canaccommodate energy deposition and provide requiredlifetime without any protective gas in chamber
March 8, 2001A. R. Raffray, et al., Assessment of Carbon and Tungsten Dry Chamber Walls under IFE Energy Depositions
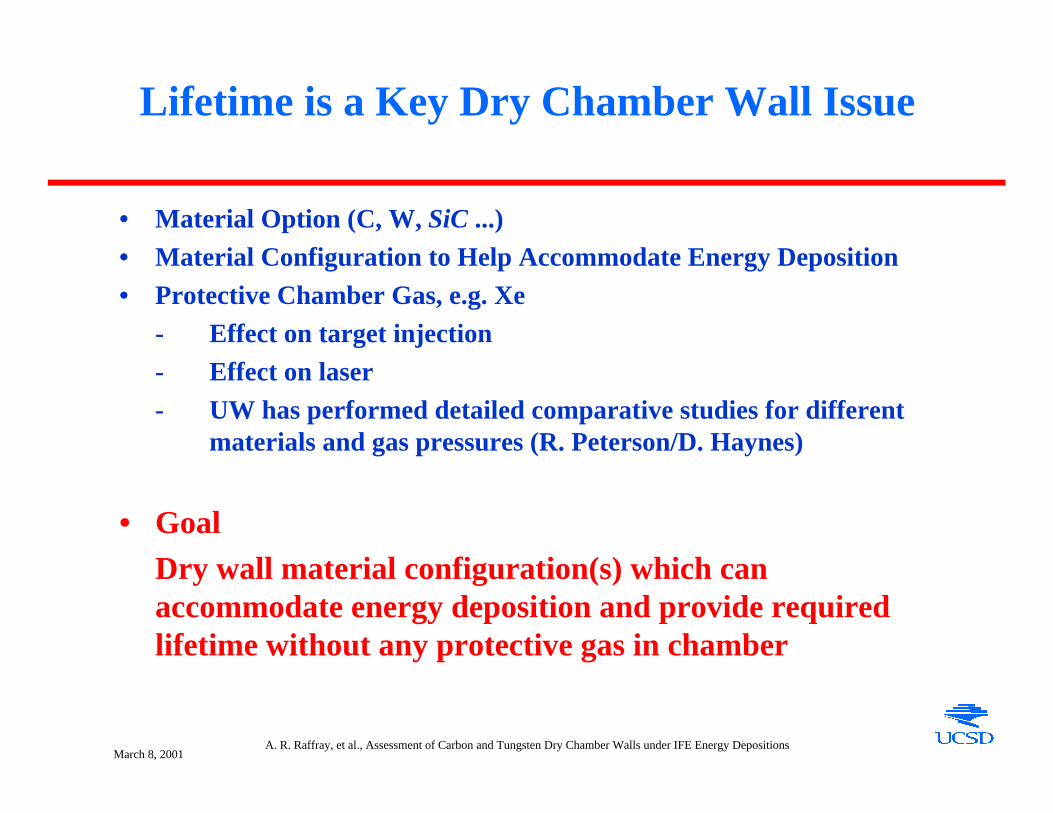
X-ray and Charged Particles SpectraNRL Direct-Drive Target
1. X-ray (2.14 MJ)
2. Debris ions (24.9 MJ)
3. Fast burn ions (18.1 MJ)(from J. Perkins, LLNL)
3
1
2

March 8, 2001A. R. Raffray, et al., Assessment of Carbon and Tungsten Dry Chamber Walls under IFE Energy Depositions
Energy Deposition Calculations
E j (ri ) = E j (r1) −d E j ( x)
d xi =1i∑ i ∆Ei
• X-ray energy deposition through attenuation calculation
• Ion energy deposition dependent on energy level- Electronic stopping power + Nuclear stopping power
- Model uses spectra to follow ions at each energy level though the material slab until all energy is deposited
• 1-D radial geometry- Very fine mesh at wall surface
- No protective gas

March 8, 2001A. R. Raffray, et al., Assessment of Carbon and Tungsten Dry Chamber Walls under IFE Energy Depositions
Ion Energy Deposition Calculations
Electronic stopping power
- Bethe model forE >1 MeV/amu
- Lindhard model forE < 1 MeV/amu
Nuclear stopping power
- Important at low energy (~keV/amu)
Example case for 4He
This analysis(Mohajerzadeh& Selvakumar,J. Appl. Phys.,1997)
Moses & Peterson(Laser and ParticleBeams,1994)
Bethe
March 8, 2001A. R. Raffray, et al., Assessment of Carbon and Tungsten Dry Chamber Walls under IFE Energy Depositions
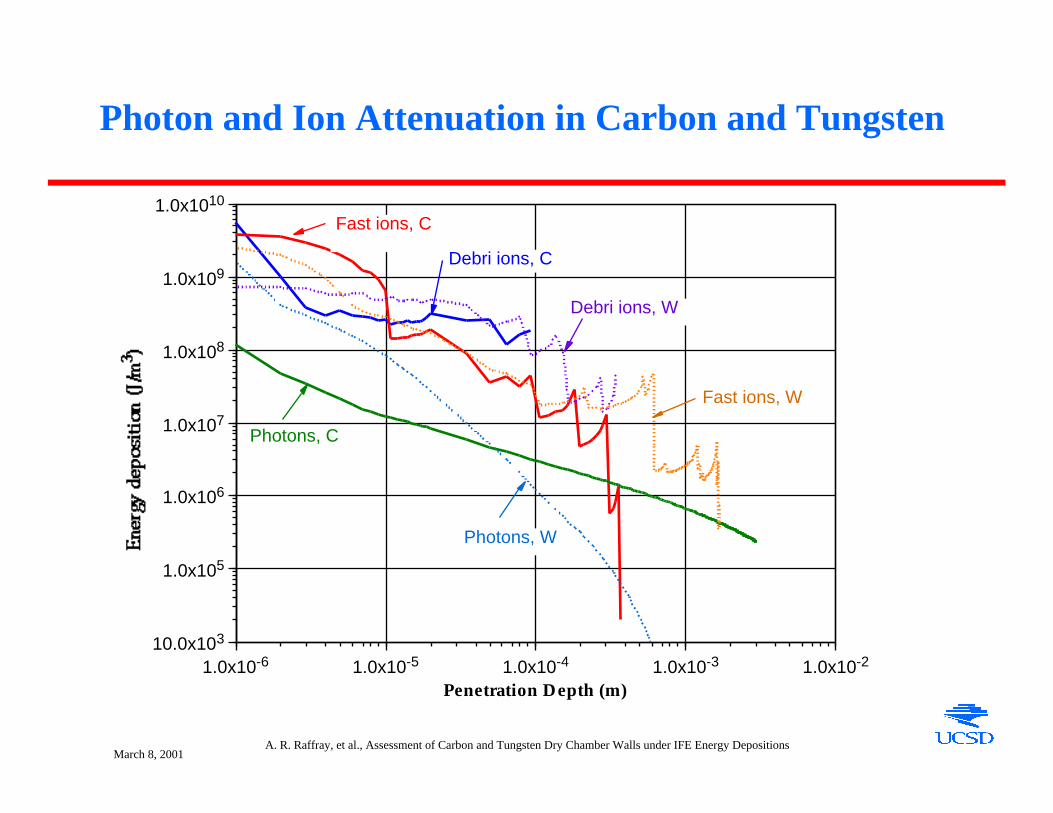
Photon and Ion Attenuation in Carbon and Tungsten
10.0x10³
1.0x10⁵
1.0x10⁶
1.0x10⁷
1.0x10⁸
1.0x10⁹
1.0x10¹⁰
1.0x10⁻⁶ 1.0x10⁻⁵ 1.0x10⁻⁴ 1.0x10⁻³ 1.0x10⁻²
Penetration Depth (m)
Photons, C
Photons, W
Fast ions, C
Fast ions, W
Debri ions, C
Debri ions, W

March 8, 2001A. R. Raffray, et al., Assessment of Carbon and Tungsten Dry Chamber Walls under IFE Energy Depositions
Temporal Distribution of Energy Distributionfrom Photons and Ions Taken into Account
Time(ns)
Fu
sion
Pow
er(T
W )
23 24 25 26 27 28 29 30
10-3
10-2
10-1
100
101
102
103
104
105
106
NRL-DD-43
X-rayEmissionfrom115MJNRLLaserTarget
From R. Peterson and D. Haynes’s presentation At ARIES meeting September 2000.
Example Photon Temporal Distribution
Temporal Distribution for Ions Based onGiven Spectrum and 6.5 m Chamber
0.0E+00
1.0E+13
2.0E+13
3.0E+13
4.0E+13
5.0E+13
6.0E+13
Th
erm
al P
ower
(W
)
0.0E+00 1.0E-06 2.0E-06 3.0E-06 4.0E-06 5.0E-06
Time (s)
Time-of-Flight Ion Power Spread
C12(KE)
He4(KE)
He4(PB)
P(BP)
T(BP)
D(BP)
P(KE)
T(KE)
D(KE)
DebrisIons
Time10ns 0.2 s 1 s 2.5 s
FastIons
Pho
tonsEnergy
Deposition
• Dramatic decrease in the maximum surface temperature when including temporal distributionof energy deposition- e.g. Tmax for carbon reduced from ~6000°C to
~1400°C for a case with constant kcarbon (400 W/m-K)and without protective gas, presented at the Dec. 2000 ARIES meeting
March 8, 2001A. R. Raffray, et al., Assessment of Carbon and Tungsten Dry Chamber Walls under IFE Energy Depositions
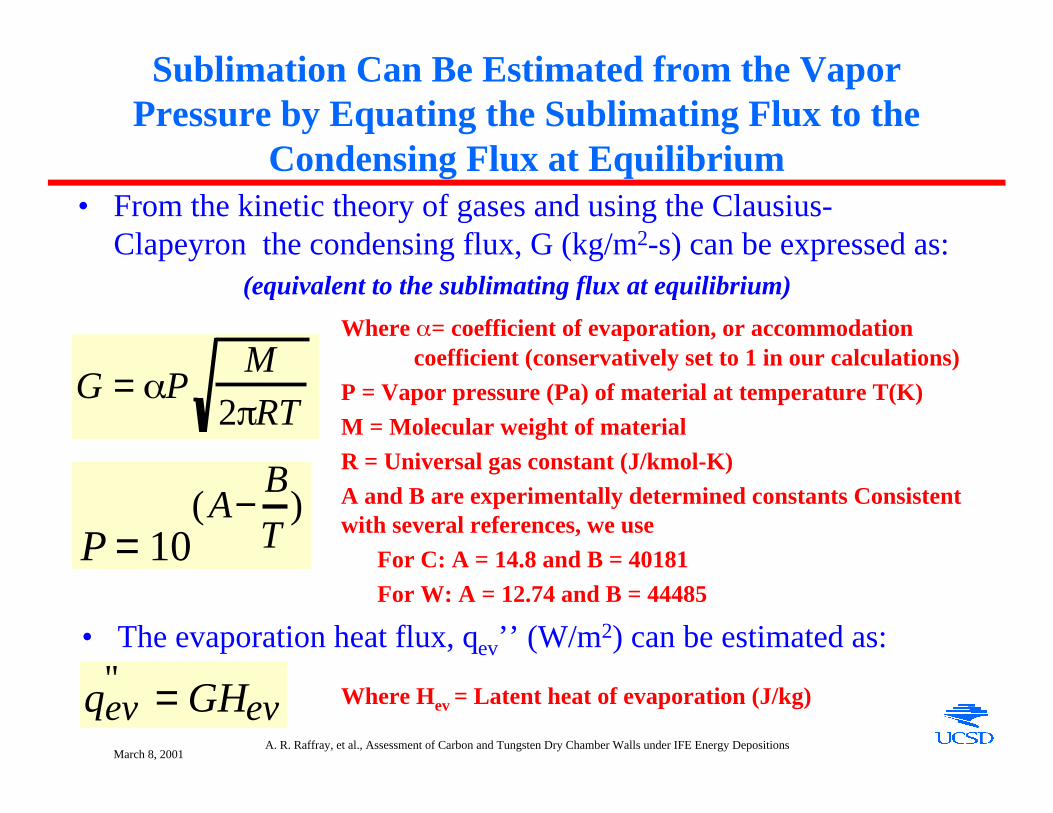
Sublimation Can Be Estimated from the VaporPressure by Equating the Sublimating Flux to the
Condensing Flux at Equilibrium• From the kinetic theory of gases and using the Clausius-
Clapeyron the condensing flux, G (kg/m2-s) can be expressed as:(equivalent to the sublimating flux at equilibrium)
G = PM
2 RT
P = 10(A−
B
T)
Where = coefficient of evaporation, or accommodation coefficient (conservatively set to 1 in our calculations)
P = Vapor pressure (Pa) of material at temperature T(K)
M = Molecular weight of material
R = Universal gas constant (J/kmol-K)
A and B are experimentally determined constants Consistentwith several references, we use
For C: A = 14.8 and B = 40181
For W: A = 12.74 and B = 44485
qev'' = GHev Where Hev = Latent heat of evaporation (J/kg)
• The evaporation heat flux, qev’’ (W/m2) can be estimated as:

March 8, 2001A. R. Raffray, et al., Assessment of Carbon and Tungsten Dry Chamber Walls under IFE Energy Depositions
Sublimation is a Temperature-Dependent ProcessIncreasing Markedly at the Sublimation Point
0.0x100
2.0x10⁸
4.0x10⁸
6.0x10⁸
8.0x10⁸
1.0x10⁹
1.2x10⁹
1.4x10⁹
1500 2000 2500 3000 3500 4000Surface temperature (°C)
1.1x10⁻²
9.3x10⁻³
7.3x10⁻³
5.5x10⁻³
3.7x10⁻³
1.8x10⁻³
0 0.0x100
1.0x10⁶
2.0x10⁶
3.0x10⁶
4.0x10⁶
5.0x10⁶
6.0x10⁶
7.0x10⁶
8.0x10⁶
1.5x10³ 2.0x10³ 2.5x10³ 3.0x10³ 3.5x10³ 4.0x10³ 4.5x10³
W surface temperature (°C)
8.8x10⁻⁵
7.7x10⁻⁵
6.6x10⁻⁵
5.5x10⁻⁵
4.4x10⁻⁵
3.3x10⁻⁵
2.2x10⁻⁵
1.1x10⁻⁵
0
Carbon Latent heat of evaporation = 5.99 x10⁷ J/kg
Sublimation point ~ 3367 °C
Tungsten Latent heat of evaporation = 4.8 x10⁶ J/kg
Melting point ~ 3410 °C
Use evaporation heat flux as a f(T) as surface boundary conditionsto include evaporation/sublimation effect in ANSYS calculations

March 8, 2001A. R. Raffray, et al., Assessment of Carbon and Tungsten Dry Chamber Walls under IFE Energy Depositions
Consider Temperature-Dependent Properties forCarbon and Tungsten
• C thermal conductivity as afunction of temperature for 1dpa case (see figure)
• C specific heat = 1900 J/kg-K
• W thermal conductivity andspecific heat as a function oftemperature from ITERmaterial handbook (seeARIES web site)
Calculated thermal conductivity of neutronirradiated MKC-1PH CFC
(L. L. Snead, T. D. Burchell, Carbon ExtendedAbstracts, 774-775, 1995)
March 8, 2001A. R. Raffray, et al., Assessment of Carbon and Tungsten Dry Chamber Walls under IFE Energy Depositions
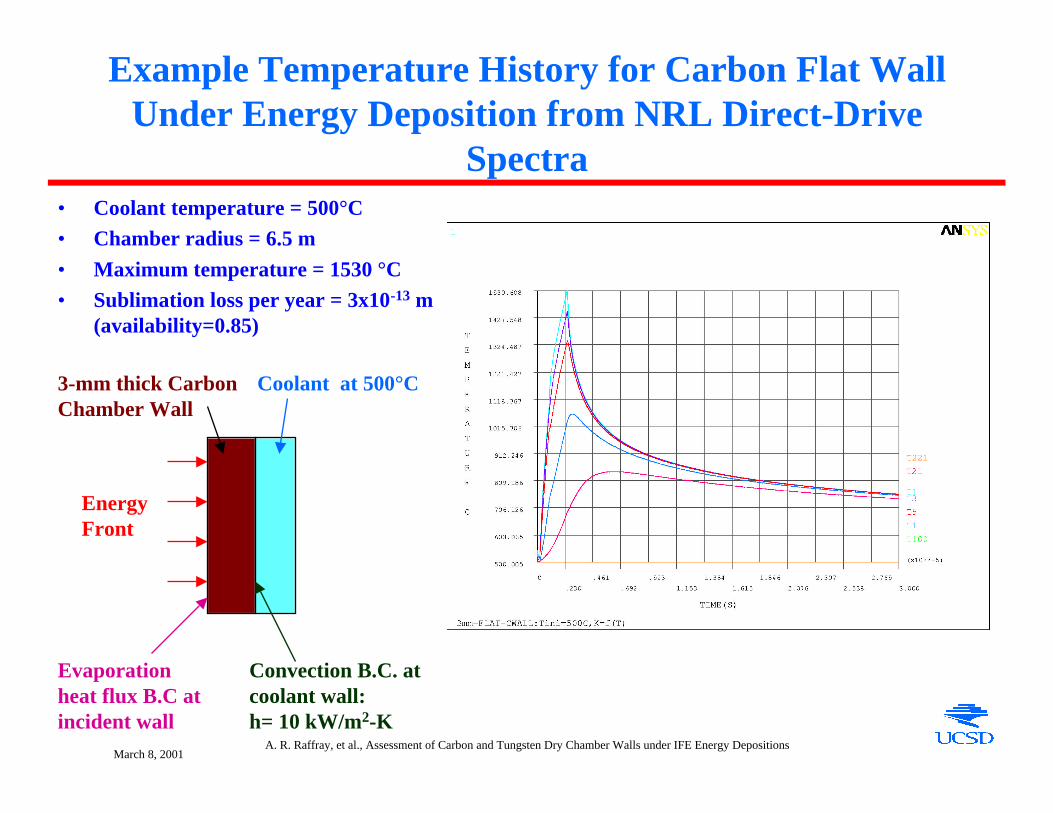
Example Temperature History for Carbon Flat WallUnder Energy Deposition from NRL Direct-Drive
Spectra• Coolant temperature = 500°C• Chamber radius = 6.5 m
• Maximum temperature = 1530 °C• Sublimation loss per year = 3x10-13 m
(availability=0.85)
Coolant at 500°C3-mm thick CarbonChamber Wall
EnergyFront
Evaporationheat flux B.C atincident wall
Convection B.C. atcoolant wall:h= 10 kW/m2-K

March 8, 2001A. R. Raffray, et al., Assessment of Carbon and Tungsten Dry Chamber Walls under IFE Energy Depositions
Summary of Thermal and Sublimation LossResults for Carbon Flat Wall
Coolant Temp. Energy Deposition Maximum Temp. Sublimation Loss Sublimation Loss (°C) Multiplier (°C) per Shot (m) per Year (m)*
500 1 1530 1.75x10⁻²¹ 3.31x10⁻¹³
800 1 1787 1.19x10⁻¹⁸ 2.25x10⁻¹⁰
1000 1 1972 5.3x10⁻¹⁷ 1.0x10⁻⁸
500 2 2474 6.96x10⁻¹⁴ 1.32x10⁻⁵
500 3 3429 4.09x10⁻¹⁰ 7.73x10⁻²
* Shot frequency = 6; Plant availability = 0.85
• Encouraging results: sublimation only takes off when energy deposition isincreased by a factor of 2-3
• Margin for setting coolant temperature and chamber wall radius, and accounting for uncertainties
March 8, 2001A. R. Raffray, et al., Assessment of Carbon and Tungsten Dry Chamber Walls under IFE Energy Depositions
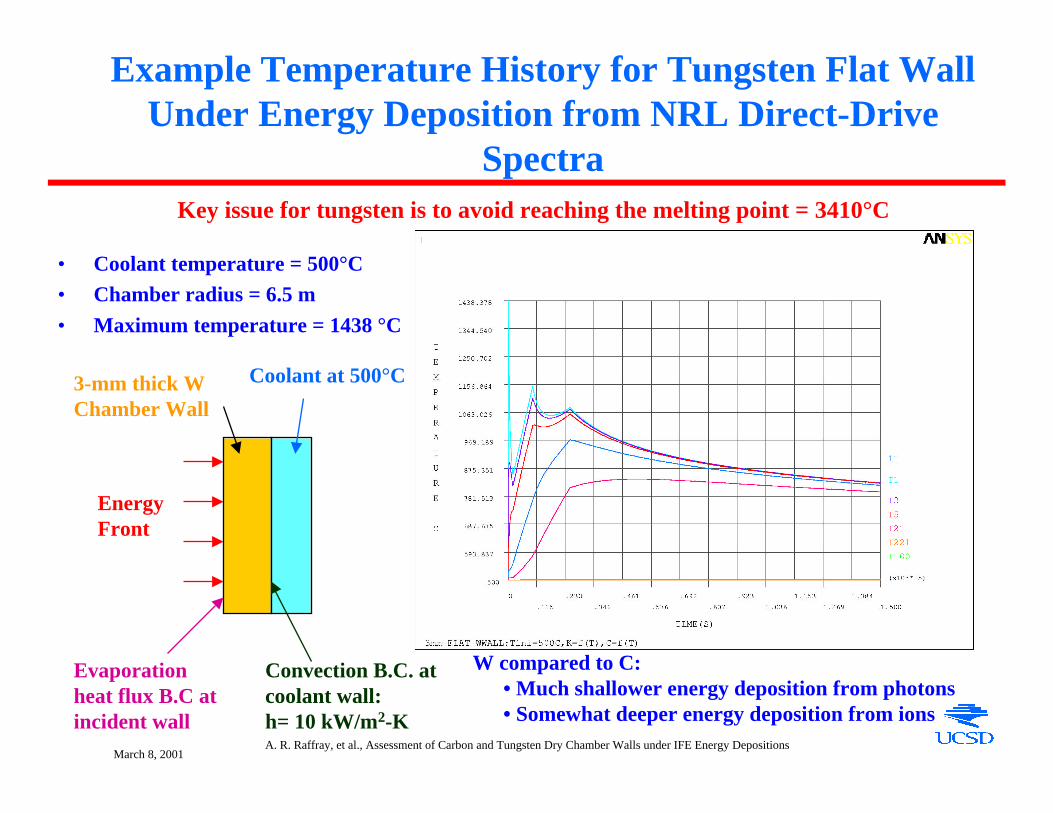
Example Temperature History for Tungsten Flat WallUnder Energy Deposition from NRL Direct-Drive
Spectra
• Coolant temperature = 500°C• Chamber radius = 6.5 m
• Maximum temperature = 1438 °C
Coolant at 500°C3-mm thick WChamber Wall
EnergyFront
Evaporationheat flux B.C atincident wall
Convection B.C. atcoolant wall:h= 10 kW/m2-K
Key issue for tungsten is to avoid reaching the melting point = 3410°C
W compared to C:• Much shallower energy deposition from photons • Somewhat deeper energy deposition from ions

March 8, 2001A. R. Raffray, et al., Assessment of Carbon and Tungsten Dry Chamber Walls under IFE Energy Depositions
Example Temperature History for Tungsten Flat Wall Under 5 xEnergy Deposition from NRL Direct-Drive Spectra
• Illustrate melting process from W; melting point = 3410°C• Include phase change in ANSYS by increasing enthalpy at melting point to
account for latent heat of fusion (= 220 kJ/kg for W)• Melt layer thickness ~ 1.2 m Separation = 1 m

March 8, 2001A. R. Raffray, et al., Assessment of Carbon and Tungsten Dry Chamber Walls under IFE Energy Depositions
Summary of Thermal Results for Tungsten FlatWall
Coolant Temp. Energy Deposition Maximum Temp.
(°C) Multiplier (°C)
500 1 1438
800 1 1710
1000 1 1972
500 2 2390
500 3 3207
500 5 5300
• Encouraging results: melting point (3410°C) is not reached even when energy deposition is increased by a factor of 3
• Some margin for setting coolant temperature and chamber wall radius, and accounting for uncertainties

March 8, 2001A. R. Raffray, et al., Assessment of Carbon and Tungsten Dry Chamber Walls under IFE Energy Depositions
Consider Engineered Surface Configuration forImproved Thermal Performance
• Porous Media- Fiber diameter ~ diffusion
characteristic length for 1 µs
- Increase incident surface areaper unit cell seeing energydeposition
ESLI Fiber-Infiltrated Substrate
Large fiber L/d ratio ~100
L
A incident
ϕncident
ϕfiber= ϕincident sin θ

March 8, 2001A. R. Raffray, et al., Assessment of Carbon and Tungsten Dry Chamber Walls under IFE Energy Depositions
Modeling Porous Fiber Configuration
y
y
Probability for energy front to contact fiber:
over second unit cell, P2 = (1-P1 ) d/(y-d)over third unit cell, P3 = (1-P1-P2 ) d/(y-2d), etc...
yeff =yP1+2yP2+3yP3...+nyPn
over first unit cell, P1 = d/y
up to Pn=(1-P1-P2-...Pn-1) d/(y-(n-1)d)where n=y/d
EnergyFront
High PorosityCarbonFiber Surface
L
d
yeff
Energy Deposition
Distan
ce from tip
of fib
er
For =0.9 and d=10 m, y=28 m, yeff = 54 m
Fiber Density, = d2/4y2
For =0.8 and d=10 m, y=19.8 m, yeff = 29.6 m
March 8, 2001A. R. Raffray, et al., Assessment of Carbon and Tungsten Dry Chamber Walls under IFE Energy Depositions
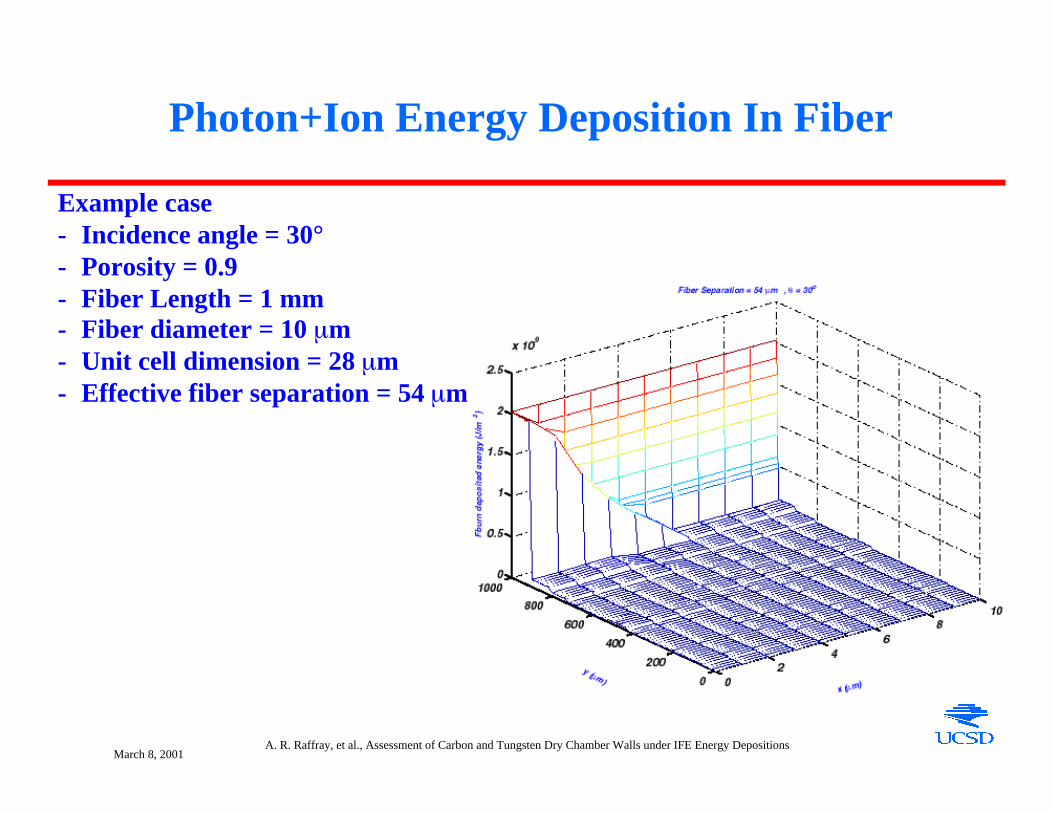
Photon+Ion Energy Deposition In Fiber
Example case- Incidence angle = 30°- Porosity = 0.9- Fiber Length = 1 mm- Fiber diameter = 10 m- Unit cell dimension = 28 m- Effective fiber separation = 54 m
March 8, 2001A. R. Raffray, et al., Assessment of Carbon and Tungsten Dry Chamber Walls under IFE Energy Depositions
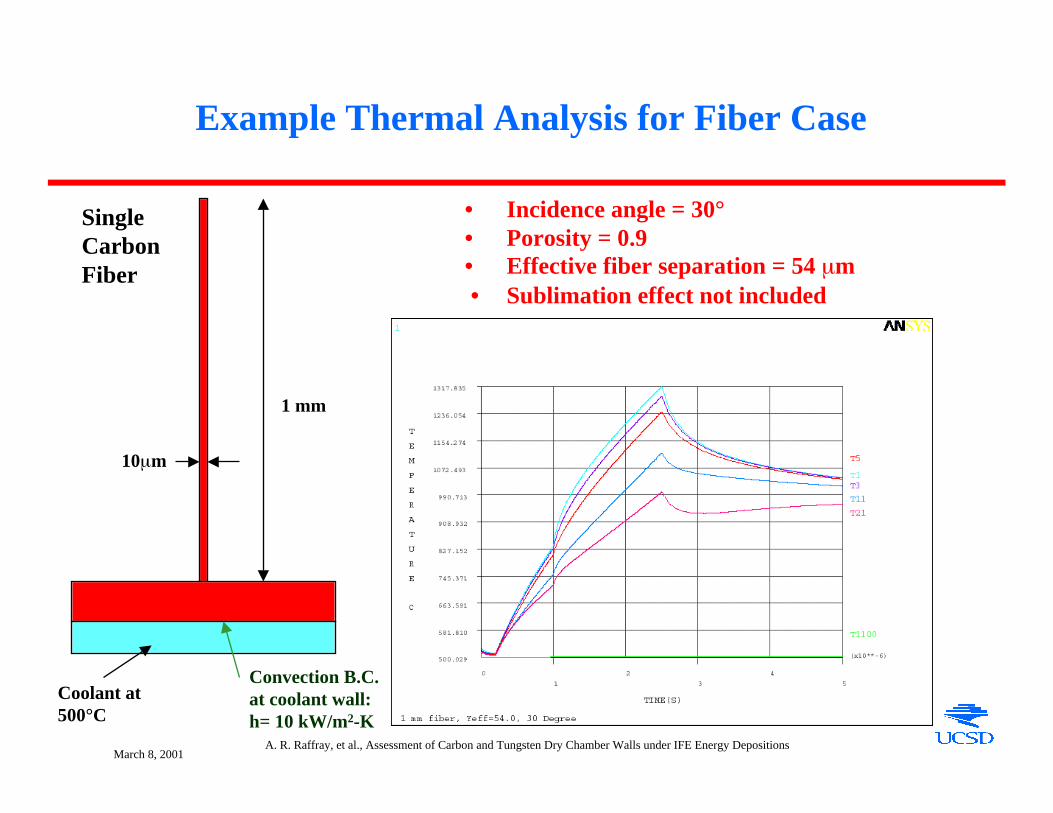
Example Thermal Analysis for Fiber Case
SingleCarbonFiber
10 m
Coolant at500°C
1 mm
• Incidence angle = 30°• Porosity = 0.9• Effective fiber separation = 54 m • Sublimation effect not included
Convection B.C.at coolant wall:h= 10 kW/m2-K
March 8, 2001A. R. Raffray, et al., Assessment of Carbon and Tungsten Dry Chamber Walls under IFE Energy Depositions
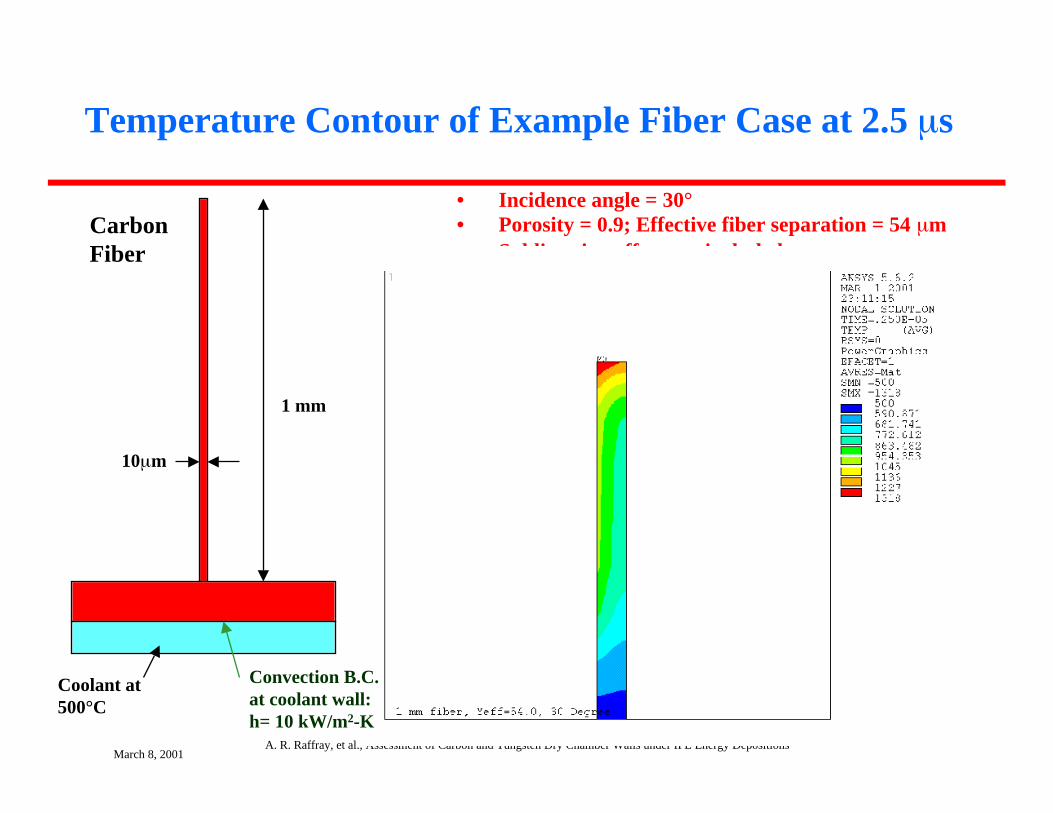
Temperature Contour of Example Fiber Case at 2.5 s
Tip ofCarbonFiber
10 m
Coolant at500°C
1 mm
• Incidence angle = 30°• Porosity = 0.9; Effective fiber separation = 54 m• Sublimation effect not included• Maximum temperature = 1318 °C
CarbonFiber
Convection B.C.at coolant wall:h= 10 kW/m2-K

March 8, 2001A. R. Raffray, et al., Assessment of Carbon and Tungsten Dry Chamber Walls under IFE Energy Depositions
Summary of Thermal Results for Carbon FibrousWall
Porosity Fiber Effective Incidence Maximum Temp.Separation ( m) Angle (°) (°C)
0.8 29.6 5 654
0.8 29.6 30 1317
0.8 29.6 45 1624
0.9 54 30 1318
C flat wall as comparison: 1530
• Initial results indicate that for shallow angle of incidence the fiber configurationperform better than a flat plate and would provide more margin
• Statistical treatment of incidence angle and fiber separation would give a better understanding
Coolant temperature = 500 °CEnergy deposition multiplier = 1
March 8, 2001A. R. Raffray, et al., Assessment of Carbon and Tungsten Dry Chamber Walls under IFE Energy Depositions
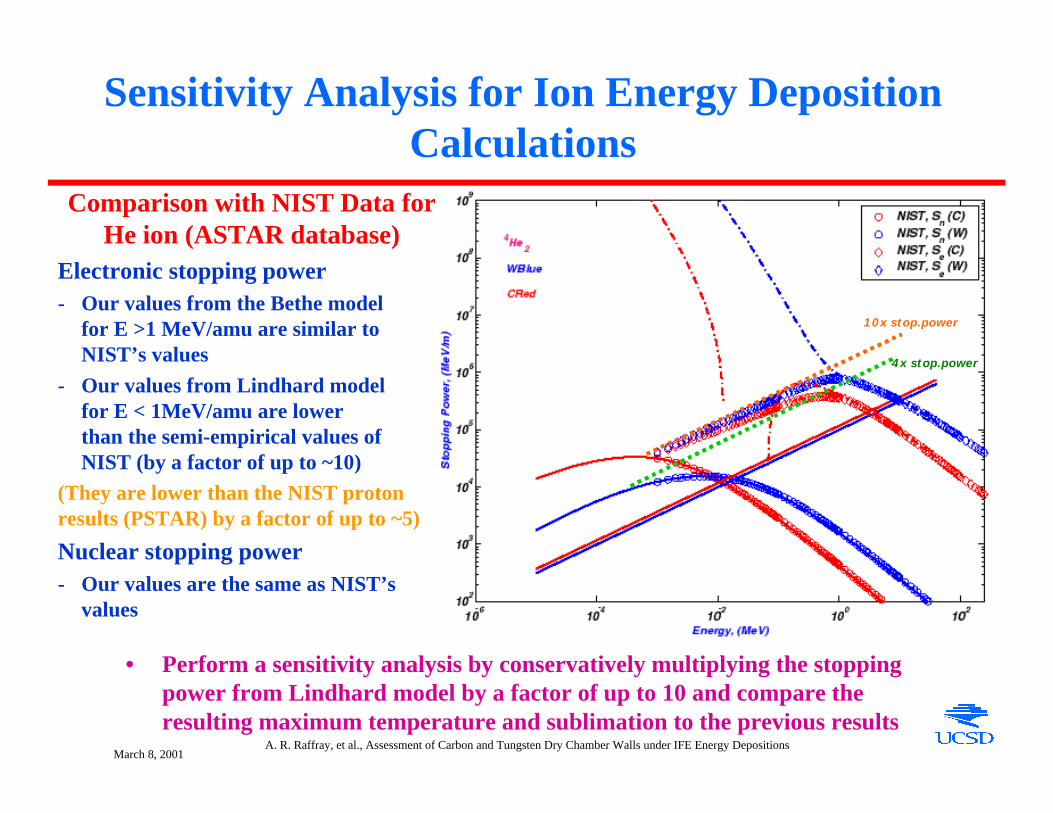
Sensitivity Analysis for Ion Energy DepositionCalculations
Comparison with NIST Data forHe ion (ASTAR database)
Electronic stopping power- Our values from the Bethe model
for E >1 MeV/amu are similar to NIST’s values
- Our values from Lindhard model for E < 1MeV/amu are lower than the semi-empirical values of NIST (by a factor of up to ~10)
(They are lower than the NIST protonresults (PSTAR) by a factor of up to ~5)
Nuclear stopping power- Our values are the same as NIST’s
values
• Perform a sensitivity analysis by conservatively multiplying the stopping power from Lindhard model by a factor of up to 10 and compare the resulting maximum temperature and sublimation to the previous results
4x stop.power
10x stop.power

March 8, 2001A. R. Raffray, et al., Assessment of Carbon and Tungsten Dry Chamber Walls under IFE Energy Depositions
Maximum Temperature History for Carbon Flat Wall fora case with 4 x Stopping Power of Lindhard Model
• The increase in stopping power results in higher ion energy deposition close to the surface and higher temperature
March 8, 2001A. R. Raffray, et al., Assessment of Carbon and Tungsten Dry Chamber Walls under IFE Energy Depositions
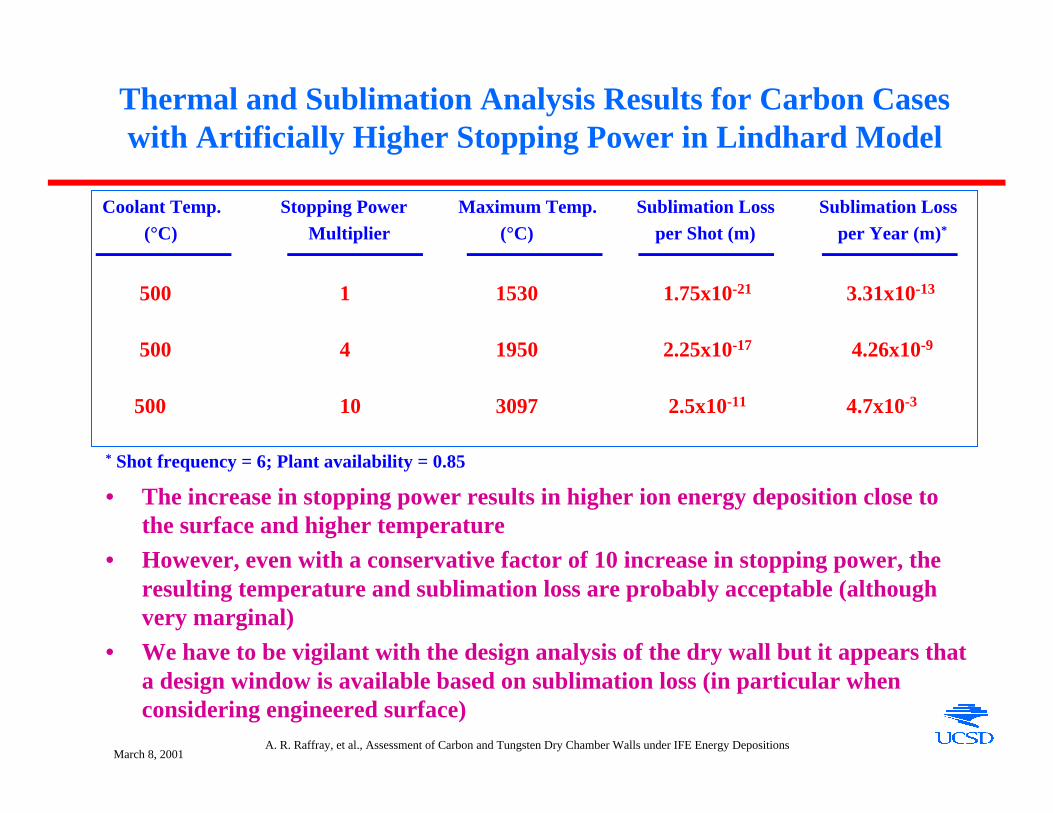
Thermal and Sublimation Analysis Results for Carbon Caseswith Artificially Higher Stopping Power in Lindhard Model
Coolant Temp. Stopping Power Maximum Temp. Sublimation Loss Sublimation Loss (°C) Multiplier (°C) per Shot (m) per Year (m)*
500 1 1530 1.75x10⁻²¹ 3.31x10⁻¹³
500 4 1950 2.25x10⁻¹⁷ 4.26x10⁻⁹
500 10 3097 2.5x10⁻¹¹ 4.7x10⁻³
* Shot frequency = 6; Plant availability = 0.85
• The increase in stopping power results in higher ion energy deposition close to the surface and higher temperature
• However, even with a conservative factor of 10 increase in stopping power, the resulting temperature and sublimation loss are probably acceptable (although very marginal)
• We have to be vigilant with the design analysis of the dry wall but it appears that a design window is available based on sublimation loss (in particular when considering engineered surface)

March 8, 2001A. R. Raffray, et al., Assessment of Carbon and Tungsten Dry Chamber Walls under IFE Energy Depositions
Chamber Wall Erosion Lifetime for Dry Wall ConceptsPotentially Dependent on a Number of Phenomena
• Main mass transfer mechanismsfor carbon (in addition to sublimation)– Physical Sputtering
– Chemical Sputtering
– Radiation Enhanced Sublimation (RES)
– Other (including macroscopic erosion dueto thermo-mechanical effects under highlypulsed, irradiated conditions)
– Condensation/redeposition
• Key parameters– Ion energy
– Ion flux
– Temperature
– Angle of incidence
– Surface characteristics (e.g.contaminants/dopants,smoothness..)
• Need to assess importance of different masstransfer mechanisms for IFE chamber conditions
March 8, 2001A. R. Raffray, et al., Assessment of Carbon and Tungsten Dry Chamber Walls under IFE Energy Depositions
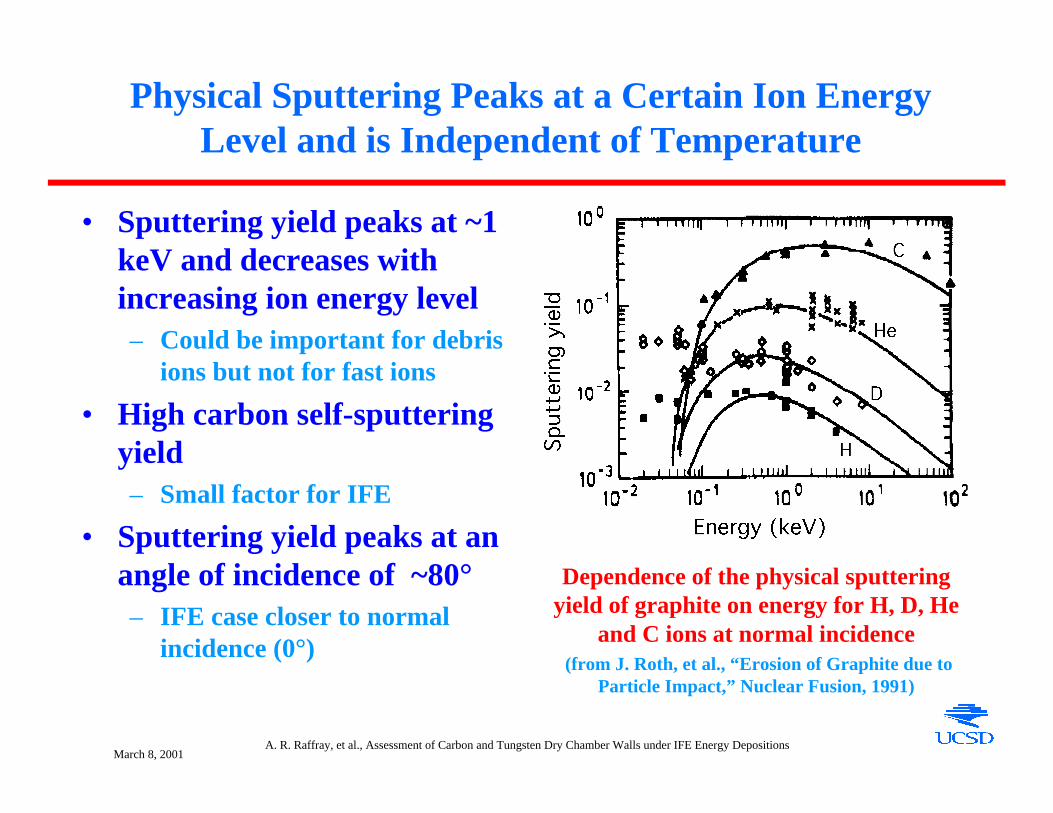
Physical Sputtering Peaks at a Certain Ion EnergyLevel and is Independent of Temperature
• Sputtering yield peaks at ~1keV and decreases withincreasing ion energy level– Could be important for debris
ions but not for fast ions
• High carbon self-sputteringyield– Small factor for IFE
• Sputtering yield peaks at anangle of incidence of ~80°– IFE case closer to normal
incidence (0°)
Dependence of the physical sputteringyield of graphite on energy for H, D, He
and C ions at normal incidence (from J. Roth, et al., “Erosion of Graphite due to
Particle Impact,” Nuclear Fusion, 1991)
March 8, 2001A. R. Raffray, et al., Assessment of Carbon and Tungsten Dry Chamber Walls under IFE Energy Depositions
Chemical Sputtering Depends Strongly on Temperatureand to a Lesser Extent on Ion Energy Level
• Chemical sputtering is linked with formation of volatilemolecules such as CO, CO2 and/or CxHy
• Chemical sputtering yield peaks at ion energy level of~0.5 keV and temperature of ~800K
– Should not be a major factor for IFE

March 8, 2001A. R. Raffray, et al., Assessment of Carbon and Tungsten Dry Chamber Walls under IFE Energy Depositions
Radiation Enhanced Sublimation Observed inCarbon-Based Materials
●
●
● ●
●
◆
◆
◆
◆ ◆
◆
■
■
■
■ ■
■
▲
▲
▲
▲
▲ ▲
1.0x10⁻³
1.0x10⁻²
1.0x10⁻¹
1.0x100
1.0x101 1.0x10² 1.0x10³ 1.0x10⁴ 1.0x10⁵ 1.0x10⁶
Ion energy (eV)
He (1870K)
D (1870K)
H (1870K)
H (1500K)
Hypothesis• Vacancy-interstitial pairs created by nuclear collisions• Diffusing interstitials reach the surface and sublimate thermally with low binding energy
• Process increases dramatically with temperature • Peaks with ion energies of ~1 keV (from J. Roth, et al., “Erosion of Graphite due to Particle Impact,” Nuclear Fusion, 1991)
March 8, 2001A. R. Raffray, et al., Assessment of Carbon and Tungsten Dry Chamber Walls under IFE Energy Depositions
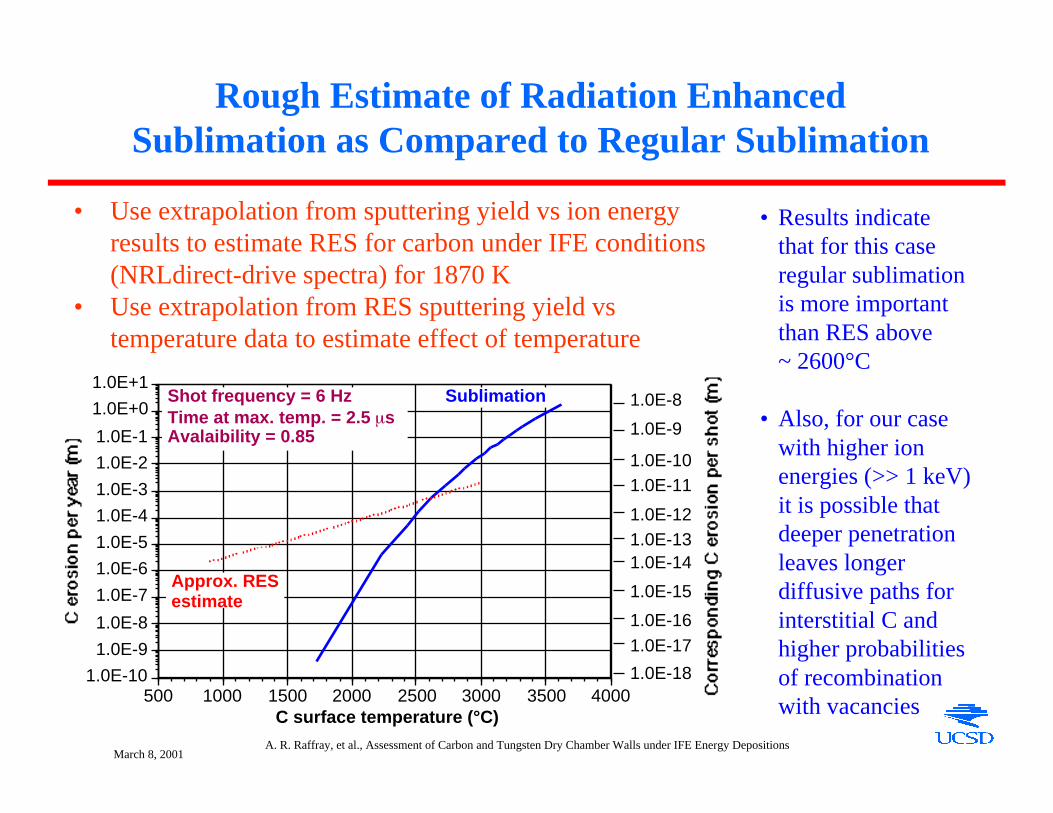
Rough Estimate of Radiation EnhancedSublimation as Compared to Regular Sublimation
• Use extrapolation from sputtering yield vs ion energy results to estimate RES for carbon under IFE conditions (NRLdirect-drive spectra) for 1870 K
• Use extrapolation from RES sputtering yield vs temperature data to estimate effect of temperature
1.0E-10
1.0E-9
1.0E-8
1.0E-7
1.0E-6
1.0E-5
1.0E-4
1.0E-3
1.0E-2
1.0E-1
1.0E+0
1.0E+1
500 1000 1500 2000 2500 3000 3500 4000C surface temperature (°C)
Sublimation
Approx. RESestimate
Shot frequency = 6 HzTime at max. temp. = 2.5 sAvalaibility = 0.85
1.0E-10
1.0E-9
1.0E-12
1.0E-11
1.0E-13
1.0E-15
1.0E-14
1.0E-8
1.0E-16
1.0E-18
1.0E-17
• Results indicate that for this case regular sublimationis more important than RES above~ 2600°C
• Also, for our case with higher ion energies (>> 1 keV)it is possible that deeper penetrationleaves longer diffusive paths for interstitial C and higher probabilitiesof recombination with vacancies

March 8, 2001A. R. Raffray, et al., Assessment of Carbon and Tungsten Dry Chamber Walls under IFE Energy Depositions
Carbon Dry Wall Lifetime as a Function ofSputtering Yield
• A reasonable lifetime limit should be a few mm per year(?),less than 10-10 m a shot
• Depending on the chamber radius, an overall average sputtering yield of 1 could be accommodated, much larger than what is expected - e.g., RES estimate for C under IFE
conditions (NRLdirect-drive spectra) for 1870 K corresponds toan average sputtering yield of 0.05
• It would be prudent to have measures for (infrequent) in-situ coating of chamber wall to guard against unforeseen local losses
1x10⁻⁶
1x10⁻⁵
1x10⁻⁴
1x10⁻³
1x10⁻²
1x10⁻¹
1x100
0.001 0.01 0.1 1Sputtering yield (atoms/ion)
Chamber radius = 3 m
Chamber radius = 6.5 m
10-11
10-10
10-13
10-12
10-14
Shot frequency 6 HzAvailability = 0.85Total number of ions per shot = 1x10²¹ 10-9

March 8, 2001A. R. Raffray, et al., Assessment of Carbon and Tungsten Dry Chamber Walls under IFE Energy Depositions
Conclusions: Cautious Optimism for IFEDry Chamber Wall Without Protective Gas
• Analysis results indicate that a design window exists for flat wall for reasonablechamber radius
– Fine mesh provides more accurate results for energy deposition and thermal analyses
– Sensitivity studies indicate that substantially higher heat deposition (2-3 times) could beaccommodated for both C and W armor
– However, uncertainty in ion energy deposition calculations could reduce this margin
– Fiber surface would provide additional margins depending on angle of incidence (inparticular for shallow angle of incidence)
• No data is available for C sputtering and RES under high energy ion fluxes andhigh temperature. However, based on existing data and extrapolation:
– It appears that carbon sputtering would not be a problem since it peaks at energy ~ 1keV, lower than most IFE ions
– RES would be lower than regular sublimation for NRL-type direct drive spectra– Also, it is speculated that higher energy ions will create interstitial C and vacancies
deeper in the C material. Longer diffusive path for the interstitial to reach the surfaceprovides more chance for recombination with vacancies and lower RES
– This needs to be confirmed through R&D and analysis

March 8, 2001A. R. Raffray, et al., Assessment of Carbon and Tungsten Dry Chamber Walls under IFE Energy Depositions
Conclusions: Cautious Optimism for IFEDry Wall,
• Must separate thin armor region from structural backbone- Most issues linked with armor itself- Possibility of repairing armor (in-situ)
but Important Issues Remain
• Still many unknowns- How to understand and apply properties and parameters derived for equilibrium
conditions for highly-pulsed, irradiated IFE conditions (thin region (~10's of m) of C (or W...) which gets to high temperature (~2000 °C) in a highly cyclic manner, ~6 s-1)
- Erosion- Sublimation- and sputtering-based, but also- Macroscopic erosion (thermo-mechanical + irradiation effects on armor under IFE operating
conditions)- Tritium inventory in carbon armor under high-temperature cyclic operation
- It is thought that any implanted tritium within the thin armor layer would diffuse out to the high temperature, high diffusivity surface region and escape
- Importance of irradiation trapping?- Co-deposition should not be a problem at high temperature but colder surfaces (e.g. in
penetration lines) could be a problem- Prudent to have more than one option in case C is unacceptable (e.g. W)
• Important not to underestimate issues and effort to resolve them- Development of material configuration and resolution of these issues will take resources
and time


![Tungsten and Selected Tungsten Compounds · Tungsten and Selected Tungsten Compounds Tungsten [7440-33-7] Sodium Tungstate [13472-45-2] Tungsten Trioxide [1314-35-8] Review of Toxicological](https://img.pdfslide.us/doc/110x75/5b4beb687f8b9afe4d8b49dd/tungsten-and-selected-tungsten-compounds-tungsten-and-selected-tungsten-compounds.jpg)