Embed Size (px)
Citation preview
Assessment of
BYD K11 Battery Electric Bus operation on the
Albuquerque Rapid Transit (ART) Service
Submitted by:
The Center for Transportation and the Environment
Issued: November 7, 2018 Revised: December 5, 2018
AssessmentofBYDK11BatteryElectricBusoperationontheAlbuquerqueRapidTransit(ART)ServiceAlbuquerqueRapidTransit(ART)Service
CenterforTransportation&theEnvironment Page2
Introduction
TheCityofAlbuquerque’sTransitDepartment(ABQRide)engagedtheCenterforTransportationandtheEnvironment(CTE)toconductavehicleperformanceassessmentonbusesdedicatedtoAlbuquerque’snewbusrapidtransit(BRT)service.CTEwastaskedwithevaluatingthecapabilityoftheBYDK1160-footarticulatedbusforserviceonABQRide’sBRTservicebrandedasAlbuquerqueRapidTransit(ART).Specifically,ABQRiderequestedanassessmentoffuelefficiency,dailyrange,chargingprofiles,andfuelcoststhatcanbeexpectedfromdeployingtheBYDK11busonthenewARTBRTservice.
ThisdocumentsummarizestheresultsofCTE’sscopeofwork,whichincluded:• Performancevalidationandroutemodeling,• Chargemodeling• Ratemodeling• Operationsandchargingassessment
PerformancevalidationandroutemodelingisusedtodetermineiftheselectedbusesarecapableofmeetingtheexpectedserviceforwhichABQRidepurchasedthem.Chargemodelingisusedtoestimatethechargetimerequiredforthebuses,theenergyconsumedduringcharging,andpowerdemandforcharging.Ratemodelingisusedtoestimatethecostoffuel(i.e.,electricity)neededtooperatethebuses.Theoperationsandchargingassessmentevaluatesserviceblocksandvariouschargingstrategies,includingdepotandon-routecharging,thatcouldbeusedtooperatethebusesontheblocks.Astheseassessmentsareinterrelated,theresultsarepresentedinacombinedfashion.
AssessmentofBYDK11BatteryElectricBusoperationontheAlbuquerqueRapidTransit(ART)ServiceAlbuquerqueRapidTransit(ART)Service
CenterforTransportation&theEnvironment Page3
Field Testing
SincetheBYDbusesanddepotchargersarealreadydeliveredandcommissioned,CTEchosetocollectdataonthebusesinsimulatedserviceratherthanperformcomputersimulationsoftheservice.Basedontheobservedperformanceandpastexperienceandengineeringcalculations,CTEprojectedtheperformanceofthebusunderavarietyofoperatingconditions.
CTEstaffvisitedABQRide’sDaytonabusdepotonSeptember4–7,2018.BYDstaffalsoparticipatedinthetesting.
Theweatherconditionsduringtestingrangedfrom64to80°Fahrenheitwithmostlysunnyskies.
CTEdesignedthetestplananddirectedthetest.BYDprovidedengineeringsupportandABQRideprovidedthebusesanddrivers.Thebuseswereballastedwithwaterbarrels,asneededforspecifictests,tosimulatepassengerloads.ABQRideadded18waterbarrels,weighingapproximately8,700lbs.,whichistheequivalentof58passengerswhenusingthesame150lbs.perpassengerdefinedbyFTA.
Thetestplanutilizedthreebuses:onetooperatetheBRTroutesatcurbweight,onetooperatetheBRTrouteswithballast,andonetooperateintheparkinglottotestHVACloads.ThesetestconditionsweredesignedsothatCTEcouldprojectthebusperformanceunderconditionsotherthanthosethatprevailedonthedayofthetests.
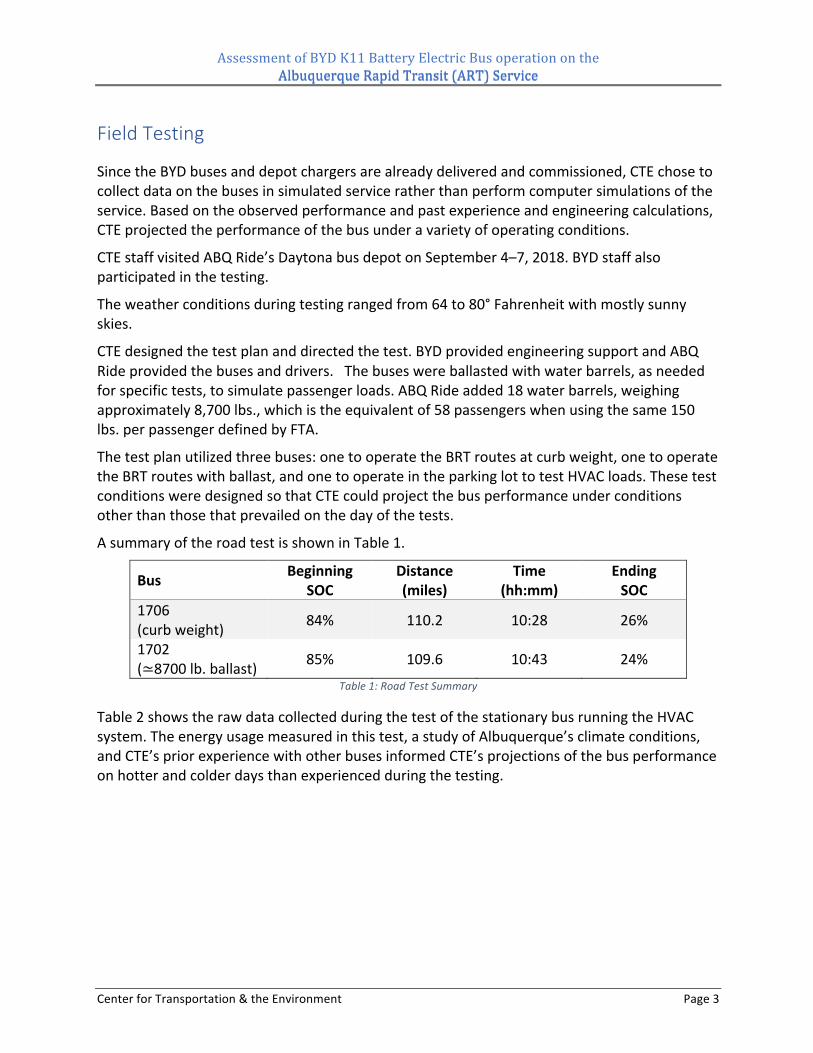
AsummaryoftheroadtestisshowninTable1.
Bus BeginningSOC
Distance(miles)
Time(hh:mm)
EndingSOC
1706(curbweight) 84% 110.2 10:28 26%
1702(≃8700lb.ballast) 85% 109.6 10:43 24%
Table1:RoadTestSummary
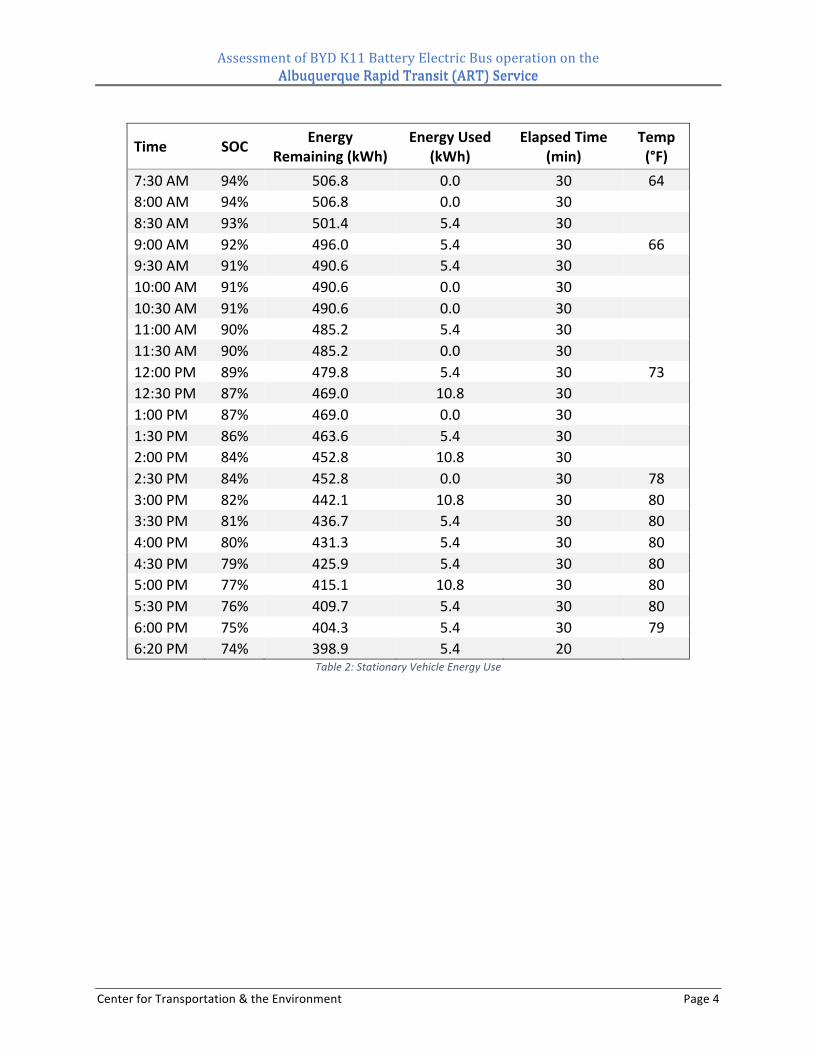
Table2showstherawdatacollectedduringthetestofthestationarybusrunningtheHVACsystem.Theenergyusagemeasuredinthistest,astudyofAlbuquerque’sclimateconditions,andCTE’spriorexperiencewithotherbusesinformedCTE’sprojectionsofthebusperformanceonhotterandcolderdaysthanexperiencedduringthetesting.
AssessmentofBYDK11BatteryElectricBusoperationontheAlbuquerqueRapidTransit(ART)ServiceAlbuquerqueRapidTransit(ART)Service
CenterforTransportation&theEnvironment Page4
Time SOC EnergyRemaining(kWh)
EnergyUsed(kWh)
ElapsedTime(min)
Temp(°F)
7:30AM 94% 506.8 0.0 30 648:00AM 94% 506.8 0.0 30 8:30AM 93% 501.4 5.4 30 9:00AM 92% 496.0 5.4 30 669:30AM 91% 490.6 5.4 30 10:00AM 91% 490.6 0.0 30 10:30AM 91% 490.6 0.0 30 11:00AM 90% 485.2 5.4 30 11:30AM 90% 485.2 0.0 30 12:00PM 89% 479.8 5.4 30 7312:30PM 87% 469.0 10.8 30 1:00PM 87% 469.0 0.0 30 1:30PM 86% 463.6 5.4 30 2:00PM 84% 452.8 10.8 30 2:30PM 84% 452.8 0.0 30 783:00PM 82% 442.1 10.8 30 803:30PM 81% 436.7 5.4 30 804:00PM 80% 431.3 5.4 30 804:30PM 79% 425.9 5.4 30 805:00PM 77% 415.1 10.8 30 805:30PM 76% 409.7 5.4 30 806:00PM 75% 404.3 5.4 30 796:20PM 74% 398.9 5.4 20 Table2:StationaryVehicleEnergyUse
AssessmentofBYDK11BatteryElectricBusoperationontheAlbuquerqueRapidTransit(ART)ServiceAlbuquerqueRapidTransit(ART)Service
CenterforTransportation&theEnvironment Page5
Performance Validation
Acommonchallengeinanybatteryelectricbusdeploymentisthelimitedenergystorageavailableascomparedtoconventionallyfueledbuses.Albuquerque’sBYDbusesweredesignedtohaveacapacityof591kWhwhenfullychargedandBYDrecommendsusing90%ofthiscapacityforservice.Serviceenergyisdefinedastheenergyavailabletopowerthepropulsionsystem,aswellastheHVACandauxiliarysystems(lighting,doors,radios,etc.).Therefore,theserviceenergyfora591kWhbatteryis532kWh.Batterycapacitymaybelowerthanthedesigncapacityduetobatterydegradation,whichisaphenomenonthatreducesthebatterycapacitythroughuseandthepassageoftime.Ifthebatterydegrades,theavailableserviceenergywillbelower.
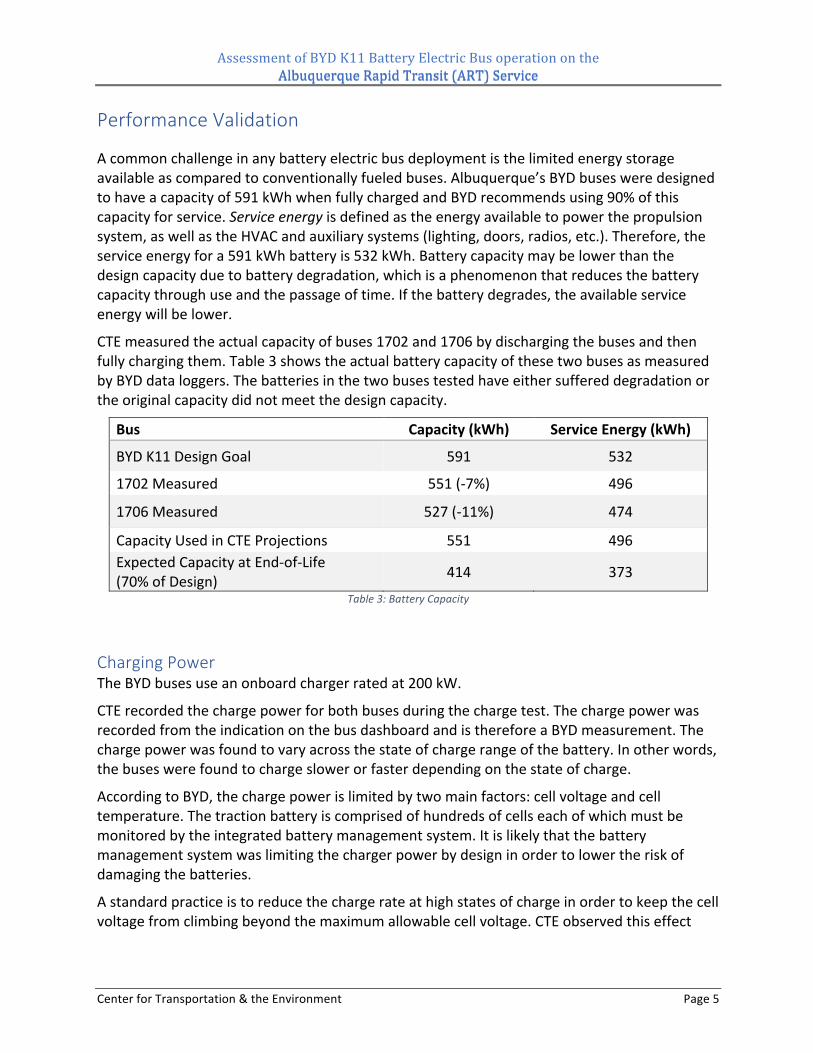
CTEmeasuredtheactualcapacityofbuses1702and1706bydischargingthebusesandthenfullychargingthem.Table3showstheactualbatterycapacityofthesetwobusesasmeasuredbyBYDdataloggers.Thebatteriesinthetwobusestestedhaveeithersuffereddegradationortheoriginalcapacitydidnotmeetthedesigncapacity.
Bus Capacity(kWh) ServiceEnergy(kWh)
BYDK11DesignGoal 591 532
1702Measured 551(-7%) 496
1706Measured 527(-11%) 474
CapacityUsedinCTEProjections 551 496ExpectedCapacityatEnd-of-Life(70%ofDesign) 414 373
Table3:BatteryCapacity
Charging Power TheBYDbusesuseanonboardchargerratedat200kW.
CTErecordedthechargepowerforbothbusesduringthechargetest.ThechargepowerwasrecordedfromtheindicationonthebusdashboardandisthereforeaBYDmeasurement.Thechargepowerwasfoundtovaryacrossthestateofchargerangeofthebattery.Inotherwords,thebuseswerefoundtochargeslowerorfasterdependingonthestateofcharge.
AccordingtoBYD,thechargepowerislimitedbytwomainfactors:cellvoltageandcelltemperature.Thetractionbatteryiscomprisedofhundredsofcellseachofwhichmustbemonitoredbytheintegratedbatterymanagementsystem.Itislikelythatthebatterymanagementsystemwaslimitingthechargerpowerbydesigninordertolowertheriskofdamagingthebatteries.
Astandardpracticeistoreducethechargerateathighstatesofchargeinordertokeepthecellvoltagefromclimbingbeyondthemaximumallowablecellvoltage.CTEobservedthiseffect

AssessmentofBYDK11BatteryElectricBusoperationontheAlbuquerqueRapidTransit(ART)ServiceAlbuquerqueRapidTransit(ART)Service
CenterforTransportation&theEnvironment Page6
duringthechargeprocessofABQRide’sBYDbuses,butthechargepoweratverylowstatesofchargewasalsolimitedandthecauseisunknown.
CTEobservedlowerchargeratesthanthechargerratingacrosstheentirerangeofstatesofcharge.Onepossibilityforthereducedperformanceisthatthebatterypacksmaythermallylimitthechargeperformance.TheARTBYDbatterypacksdonothaveanytypeofactivecoolingsysteminsteadrelyingonnaturalconvectiontorejectheat.Chargetestingaftercoldsoakingthebatteriescouldtestthistheory.CTEdoesnotcurrentlyhaveenoughinformationtoknowthereasonforthechargelimitationthatcouldbeunrelatedtothermallimitations.
TherawdataCTEcollectedforeachbusisshowninTable4andTable5.Thestate-of-chargecolumn(SOC)and“time-to-full”columnswerealsorecordedfromthebusandarethereforeBYDmeasurements.
Time ElapsedTime(hh:mm) SOC Energy
(kWh)TimetoFull(hh:mm)
Power(kW)
1:38PM 0:00 4% 22.05 2:45 1:47PM 0:09 11% 60.63 2:34 2:07PM 0:29 22% 121.26 3:27 2:20PM 0:42 27% 148.82 3:14 1252:38PM 1:00 33% 181.90 2:57 1252:51PM 1:13 38% 209.46 2:42 1253:06PM 1:28 44% 242.53 2:31 1243:19PM 1:41 49% 270.09 2:18 1243:45PM 2:07 58% 319.70 1:51 1234:03PM 2:25 65% 358.28 1:35 1234:15PM 2:37 69% 380.33 1:23 1234:31PM 2:53 75% 413.40 1:07 1224:48PM 3:10 81% 446.47 0:51 1225:03PM 3:25 87% 479.54 0:36 1225:16PM 3:38 91% 501.59 0:23 1235:30PM 3:52 96% 529.15 0:09 1235:45PM 4:07 99.5% 548.44 0:02 1235:48PM 4:10 99.5% 548.44 0:03 755:53PM 4:15 100% 551.20 Table4:Bus1702ObservedChargePower
AssessmentofBYDK11BatteryElectricBusoperationontheAlbuquerqueRapidTransit(ART)ServiceAlbuquerqueRapidTransit(ART)Service
CenterforTransportation&theEnvironment Page7
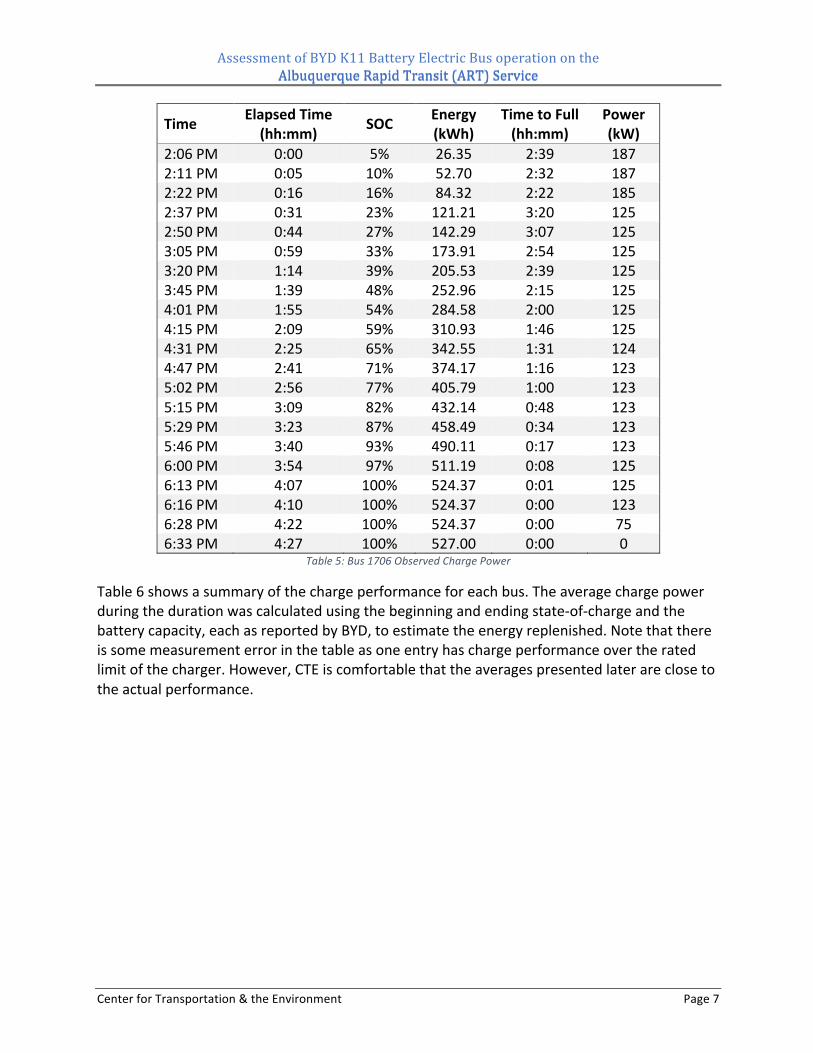
Time ElapsedTime(hh:mm) SOC Energy
(kWh)TimetoFull(hh:mm)
Power(kW)
2:06PM 0:00 5% 26.35 2:39 1872:11PM 0:05 10% 52.70 2:32 1872:22PM 0:16 16% 84.32 2:22 1852:37PM 0:31 23% 121.21 3:20 1252:50PM 0:44 27% 142.29 3:07 1253:05PM 0:59 33% 173.91 2:54 1253:20PM 1:14 39% 205.53 2:39 1253:45PM 1:39 48% 252.96 2:15 1254:01PM 1:55 54% 284.58 2:00 1254:15PM 2:09 59% 310.93 1:46 1254:31PM 2:25 65% 342.55 1:31 1244:47PM 2:41 71% 374.17 1:16 1235:02PM 2:56 77% 405.79 1:00 1235:15PM 3:09 82% 432.14 0:48 1235:29PM 3:23 87% 458.49 0:34 1235:46PM 3:40 93% 490.11 0:17 1236:00PM 3:54 97% 511.19 0:08 1256:13PM 4:07 100% 524.37 0:01 1256:16PM 4:10 100% 524.37 0:00 1236:28PM 4:22 100% 524.37 0:00 756:33PM 4:27 100% 527.00 0:00 0
Table5:Bus1706ObservedChargePower
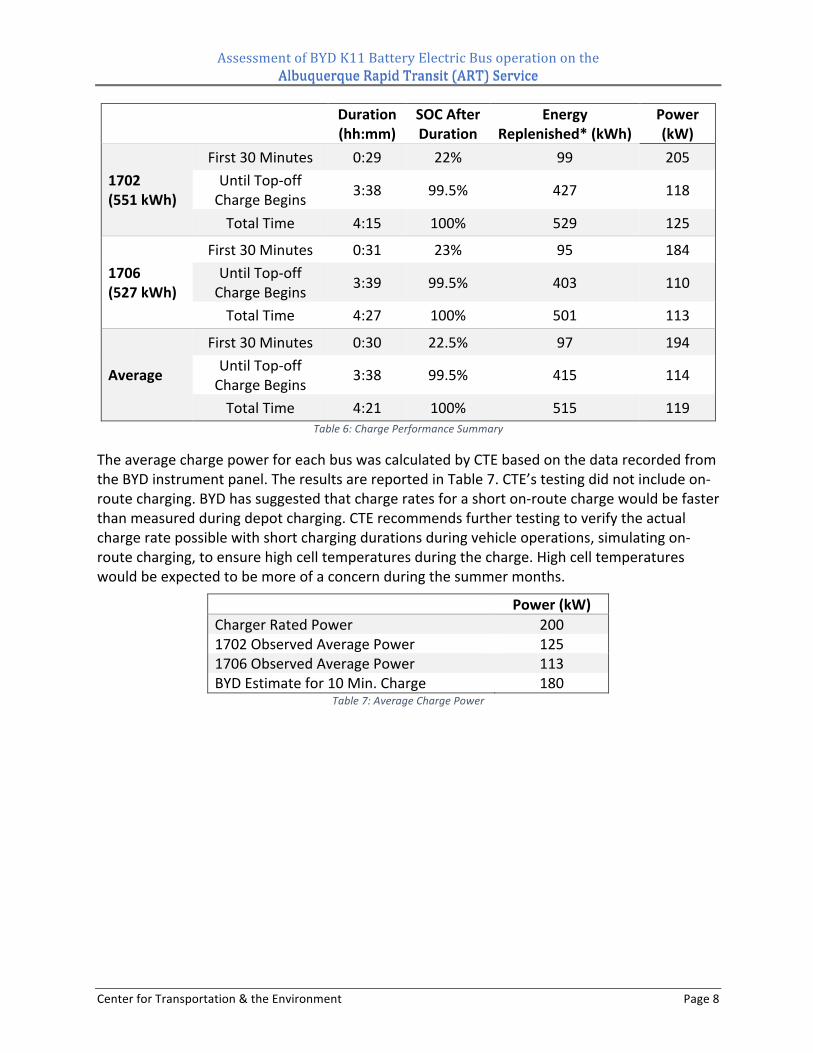
Table6showsasummaryofthechargeperformanceforeachbus.Theaveragechargepowerduringthedurationwascalculatedusingthebeginningandendingstate-of-chargeandthebatterycapacity,eachasreportedbyBYD,toestimatetheenergyreplenished.Notethatthereissomemeasurementerrorinthetableasoneentryhaschargeperformanceovertheratedlimitofthecharger.However,CTEiscomfortablethattheaveragespresentedlaterareclosetotheactualperformance.
AssessmentofBYDK11BatteryElectricBusoperationontheAlbuquerqueRapidTransit(ART)ServiceAlbuquerqueRapidTransit(ART)Service
CenterforTransportation&theEnvironment Page8
Duration(hh:mm)
SOCAfterDuration
EnergyReplenished*(kWh)
Power(kW)
1702(551kWh)
First30Minutes 0:29 22% 99 205UntilTop-offChargeBegins 3:38 99.5% 427 118
TotalTime 4:15 100% 529 125
1706(527kWh)
First30Minutes 0:31 23% 95 184UntilTop-offChargeBegins 3:39 99.5% 403 110
TotalTime 4:27 100% 501 113
Average
First30Minutes 0:30 22.5% 97 194UntilTop-offChargeBegins 3:38 99.5% 415 114
TotalTime 4:21 100% 515 119Table6:ChargePerformanceSummary
TheaveragechargepowerforeachbuswascalculatedbyCTEbasedonthedatarecordedfromtheBYDinstrumentpanel.TheresultsarereportedinTable7.CTE’stestingdidnotincludeon-routecharging.BYDhassuggestedthatchargeratesforashorton-routechargewouldbefasterthanmeasuredduringdepotcharging.CTErecommendsfurthertestingtoverifytheactualchargeratepossiblewithshortchargingdurationsduringvehicleoperations,simulatingon-routecharging,toensurehighcelltemperaturesduringthecharge.Highcelltemperatureswouldbeexpectedtobemoreofaconcernduringthesummermonths.
Power(kW)ChargerRatedPower 2001702ObservedAveragePower 1251706ObservedAveragePower 113BYDEstimatefor10Min.Charge 180
Table7:AverageChargePower
AssessmentofBYDK11BatteryElectricBusoperationontheAlbuquerqueRapidTransit(ART)ServiceAlbuquerqueRapidTransit(ART)Service
CenterforTransportation&theEnvironment Page9
Capability Analysis
Assumptions for Performance Projections
Battery Capacity Aspreviouslypresented,CTEused551kWhasthebatterycapacityforitsrangeprojectionssincethiswastheobservedcapacityon1702.ThisislowerthantheBYDdesigngoalforthebatterypack.Bus1706hadalowerobservedbatterycapacity,however,BYDinformedCTEthatbus1706requiresrepairstothebatterysystem.Thecapacityof1706isexpectedtobeatleast551kWhifBYDisabletocompletetherepair.
Inadditiontocurrentlyobservedbatterycapacity,CTEalsoanalyzesbusperformancewhenthebatteryisfullydegradedtothewarrantylevel.BYDhaswarrantedtheARTbusesto70%degradation,meaningthattheywillrepairorreplacethebatterysystemtoacapacityabovethe70%degradationminimum.Notethatdegradationisaffectedbycellmanufacturingquality,chargecycles,levelofdischarge,operatingtemperature,andthepassageoftime.Eachagencywillhaveadifferentexperiencewithdegradationanditisdifficulttopredictthetimingorlevelofdegradation.
CTEalsoanalyzedtheperformanceofthebusesat590kWhthatisnearlyatthedesigngoallevelandthusrepresentsabest-casescenario.Thisanalysisisincludedasanappendixtothisdocument.
Climate Considerations Toprojectvariancesinperformancebetweendayswithdifferentclimaticconditions,CTEmeasuredtheauxiliaryloadsaspreviouslydiscussed.Auxiliaryloadsaredefinedastheelectricalloadsonthebusunrelatedtopropellingthebus.Theseloadsincludehighvoltageloadssuchasthepowersteeringsystemandaircompressorsystemaswellaslowvoltageloadslikelighting.Thelargestauxiliaryloadistheheatingandcoolingsystemsforthebuscabin.Thisisalsotheonlyloadthatvariesseasonally.
AstudyofAlbuquerque’sclimatepatternsaswellasCTE’spreviousexperiencewithbatteryelectricbusesshowsthattheairconditioningloadsonahotdayarelikelytopresentthemostdifficultloadsforthesebuses.Inotherwords,rangeislikelytobeloweronhotsummerdaysduetothefactthatmoreenergyisrequiredtocoolthebusratherthanbeingusedtomovethebusdowntheroad.WinterheatingloadsarealsoexpectedtogreaterthanauxiliaryloadsencounteredduringCTE’stesting,butnotasbadassummerairconditioningloadsandthusarenotconsideredfurther.CTEchose99°Fasastrenuoussummertemperatureforitsanalysis.AlthoughhottertemperatureswillbeexperiencedinAlbuquerque,theytendtobebalancedbycoolermorningandeveningtemperatures.
BasedoninformationprovidedbyBYDandbasedonCTE’spriorexperiencewithmodelingsimilarsystems,CTEestimatesthestrenuouscoolingloadtobe15kWascomparedto9.5kWmeasuredduringfield-testing.Asthefieldtestwasconductedonadaywithan80°Fhigh,thestrenuous-daycoolingloadwouldrequiresignificantlymorepowerfortheairconditioning.
AssessmentofBYDK11BatteryElectricBusoperationontheAlbuquerqueRapidTransit(ART)ServiceAlbuquerqueRapidTransit(ART)Service
CenterforTransportation&theEnvironment Page10
BYD’sfeedback,utilizingloadinformationobtainedfromanotherproject’sresults,helpedtodeterminethisestimateforthecoolingloadona99°Fday.
Notes on Weight CTEfoundthedifferenceinefficiencybetweenthebusnearcurbweightandthebusloadedwithballasttosimulatepassengerloadstobewithin8%,whereasthedifferenceintemperaturebetweenthemorningandafternoonportionsofthetestresultina16%changeinefficiency.CTEisthereforeusingtheaverageofcurbweightvehicleandballastedvehicleefficiencymeasuresinitsprojections.Notethatefficiencyislikelytobemarginallylowerasweightisincreasedbeyondthetestedweight,butthatthiseffectisnotexpectedtobenearlyasdramaticaschangesinclimaticconditions.
Onefinalnoteonweight:althoughCTEdidnotseealargeefficiencydifferencebasedonweight,anecdotallytheweightedbuswasreportedtobesomewhatsluggishupthehillsthroughouttesting.Theunweightedbuswasreportedsluggishonlywhenthestateofchargedroppedappreciably.CTEdidnotfurtherinvestigatethesluggishnessbecauseitwasnotdeemedsevereandiscommontomostbatteryelectricbuseswhenheavilyloaded.
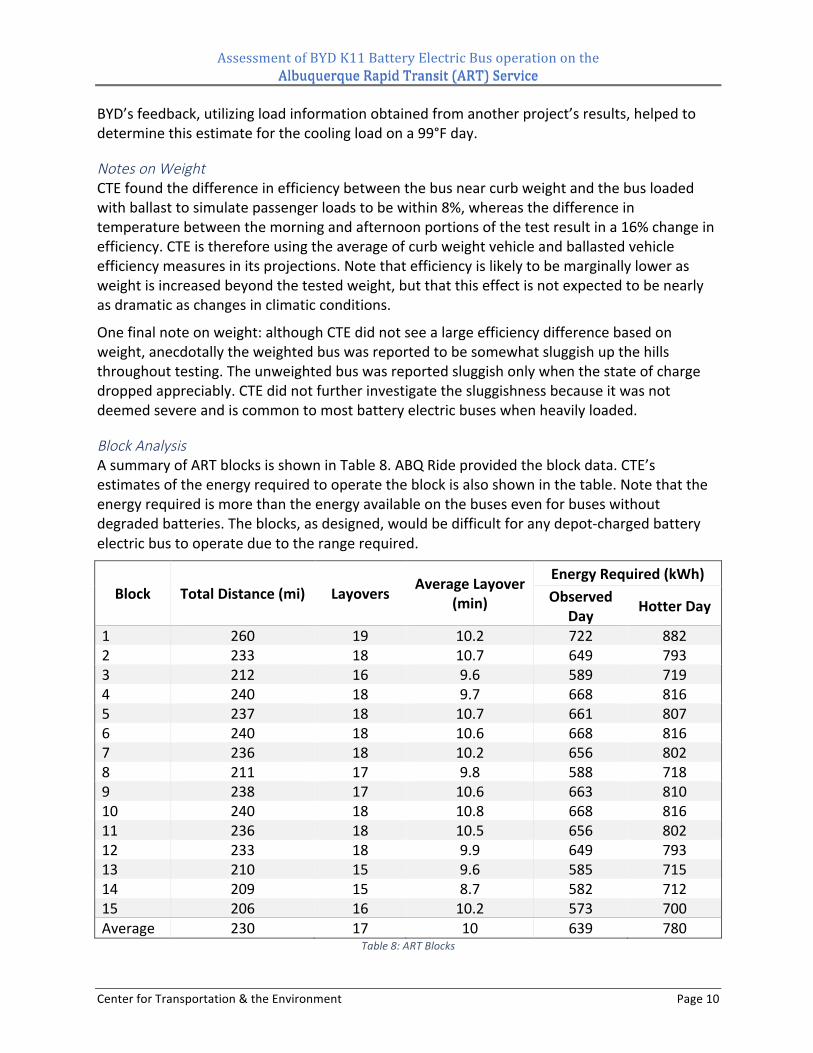
Block Analysis AsummaryofARTblocksisshowninTable8.ABQRideprovidedtheblockdata.CTE’sestimatesoftheenergyrequiredtooperatetheblockisalsoshowninthetable.Notethattheenergyrequiredismorethantheenergyavailableonthebusesevenforbuseswithoutdegradedbatteries.Theblocks,asdesigned,wouldbedifficultforanydepot-chargedbatteryelectricbustooperateduetotherangerequired.
Block TotalDistance(mi) Layovers AverageLayover(min)
EnergyRequired(kWh)Observed
Day HotterDay
1 260 19 10.2 722 8822 233 18 10.7 649 7933 212 16 9.6 589 7194 240 18 9.7 668 8165 237 18 10.7 661 8076 240 18 10.6 668 8167 236 18 10.2 656 8028 211 17 9.8 588 7189 238 17 10.6 663 81010 240 18 10.8 668 81611 236 18 10.5 656 80212 233 18 9.9 649 79313 210 15 9.6 585 71514 209 15 8.7 582 71215 206 16 10.2 573 700Average 230 17 10 639 780
Table8:ARTBlocks
AssessmentofBYDK11BatteryElectricBusoperationontheAlbuquerqueRapidTransit(ART)ServiceAlbuquerqueRapidTransit(ART)Service
CenterforTransportation&theEnvironment Page11
Depot Charging
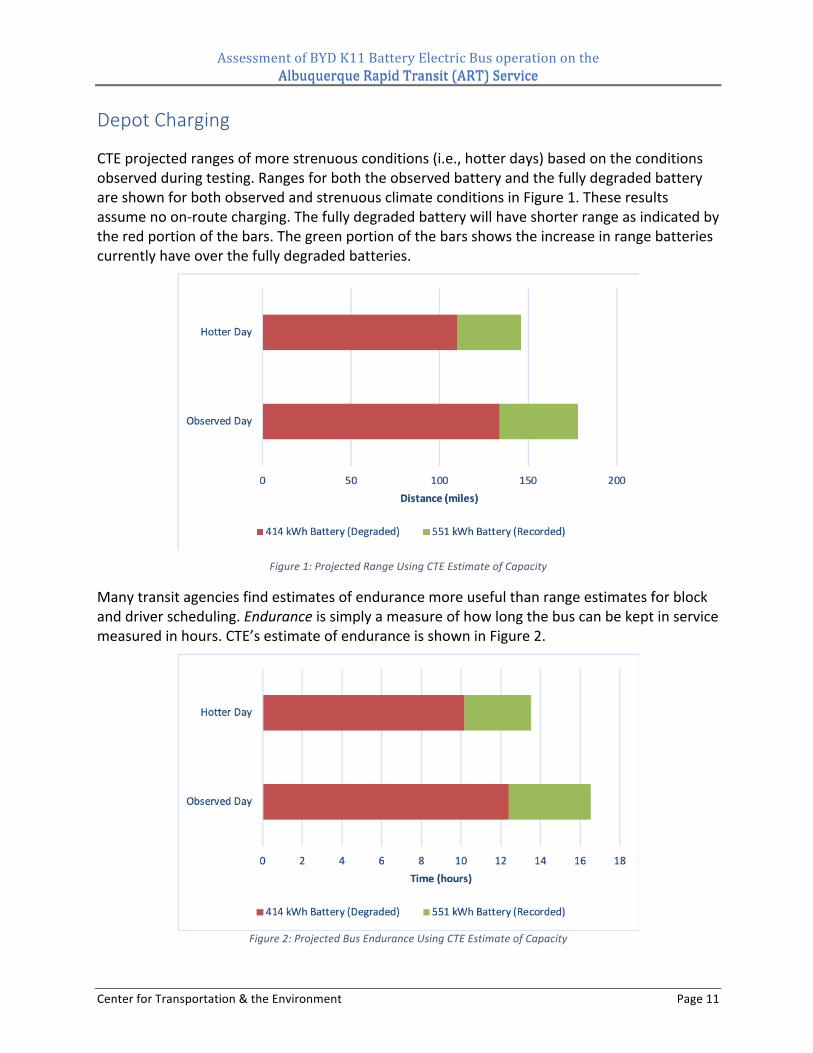
CTEprojectedrangesofmorestrenuousconditions(i.e.,hotterdays)basedontheconditionsobservedduringtesting.RangesforboththeobservedbatteryandthefullydegradedbatteryareshownforbothobservedandstrenuousclimateconditionsinFigure1.Theseresultsassumenoon-routecharging.Thefullydegradedbatterywillhaveshorterrangeasindicatedbytheredportionofthebars.Thegreenportionofthebarsshowstheincreaseinrangebatteriescurrentlyhaveoverthefullydegradedbatteries.
Figure1:ProjectedRangeUsingCTEEstimateofCapacity
Manytransitagenciesfindestimatesofendurancemoreusefulthanrangeestimatesforblockanddriverscheduling.Enduranceissimplyameasureofhowlongthebuscanbekeptinservicemeasuredinhours.CTE’sestimateofenduranceisshowninFigure2.
Figure2:ProjectedBusEnduranceUsingCTEEstimateofCapacity
AssessmentofBYDK11BatteryElectricBusoperationontheAlbuquerqueRapidTransit(ART)ServiceAlbuquerqueRapidTransit(ART)Service
CenterforTransportation&theEnvironment Page12
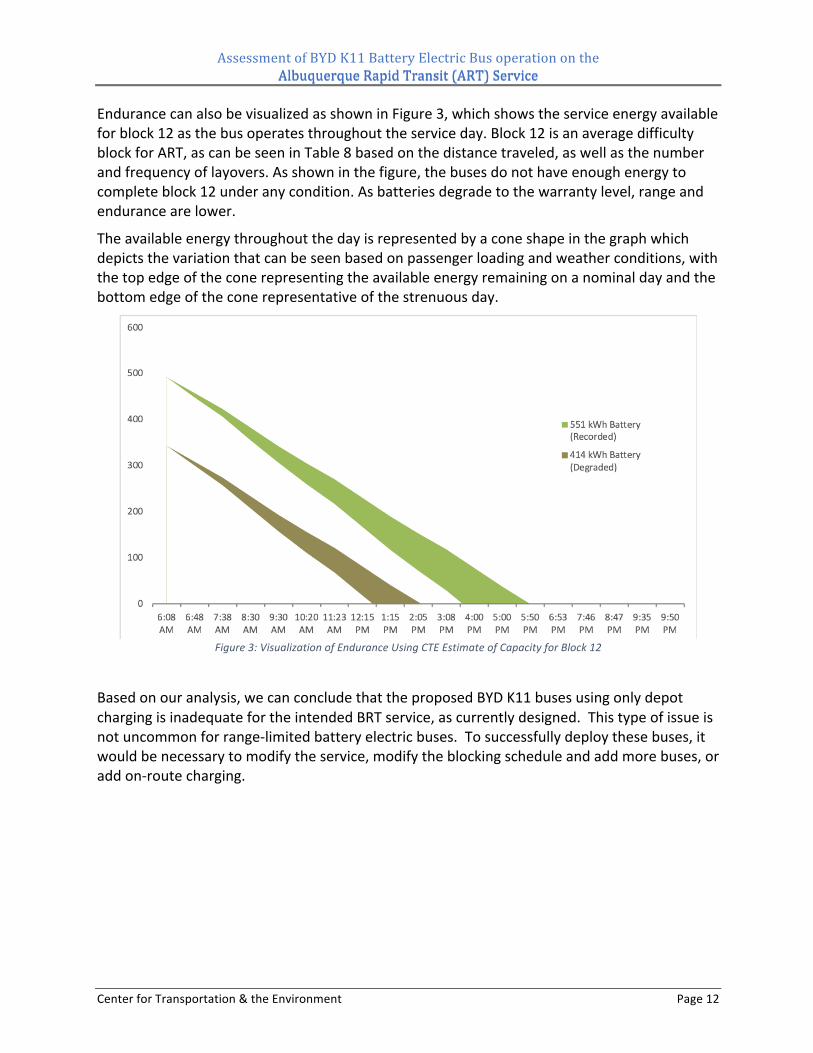
EndurancecanalsobevisualizedasshowninFigure3,whichshowstheserviceenergyavailableforblock12asthebusoperatesthroughouttheserviceday.Block12isanaveragedifficultyblockforART,ascanbeseeninTable8basedonthedistancetraveled,aswellasthenumberandfrequencyoflayovers.Asshowninthefigure,thebusesdonothaveenoughenergytocompleteblock12underanycondition.Asbatteriesdegradetothewarrantylevel,rangeandendurancearelower.
Theavailableenergythroughoutthedayisrepresentedbyaconeshapeinthegraphwhichdepictsthevariationthatcanbeseenbasedonpassengerloadingandweatherconditions,withthetopedgeoftheconerepresentingtheavailableenergyremainingonanominaldayandthebottomedgeoftheconerepresentativeofthestrenuousday.
Figure3:VisualizationofEnduranceUsingCTEEstimateofCapacityforBlock12
Basedonouranalysis,wecanconcludethattheproposedBYDK11busesusingonlydepotchargingisinadequatefortheintendedBRTservice,ascurrentlydesigned.Thistypeofissueisnotuncommonforrange-limitedbatteryelectricbuses.Tosuccessfullydeploythesebuses,itwouldbenecessarytomodifytheservice,modifytheblockingscheduleandaddmorebuses,oraddon-routecharging.
AssessmentofBYDK11BatteryElectricBusoperationontheAlbuquerqueRapidTransit(ART)ServiceAlbuquerqueRapidTransit(ART)Service
CenterforTransportation&theEnvironment Page13
On-Route Charging
SincetheBYDK11busesdeliveredtoABQRidehaveinsufficientrangeandendurancetooperatetheARTserviceblocks,CTEevaluatedanon-routechargingstrategy.
Thereareseveralchallengesthatmustbeaddressedwhenconsideringon-routecharging:
1. Chargingstationsshouldnotbeaccessibletothepublic.Theymustbelocatedindedicated,restrictedaccessareas.
2. Itisrecommendedtoonlyuseoverheadconductiveorin-groundinductive,automatedcharging.Plug-inchargingisnotrecommendedasitrequiresanindividualon-siteduringtheservicedaytoplug-inthebus,monitorthecharge,andun-plugthebus.Inadditiontolaborcosts,thechargecablingmaybeatrippinghazardtothepublicandliabilitytotheCity.
3. Peakdemandchargesfromtheelectricutilitycanmakeon-routechargingexpensive.
4. Theremaybeinsufficienttimetoaddenoughenergywhilechargingduringbuslayovers,particularlyifthebusisrunninglate.Or,abusthatisrunninglatewillstaybehindscheduleinordertoreceiveasufficientcharge.
CTEdidnotevaluateanydifficultiesthatAlbuquerquemayencounterinlocatingandoperatingthechargersinpublicareas,butCTEencouragesABQRidetoinvestigatethesechallengesfurtherbeforeembarkingonthisstrategy.
CTEdidevaluatethecostsofonroutechargingandtheresultscanbefoundintheratemodelingsection.
CTEalsoevaluatedtheavailablelayovertimeforchargingbothinan“on-time”scenarioanda“behindschedule”scenario(i.e.busesarerunningthreeminuteslate).NotethatARTwasdesignedusingbusrapidtransitprinciplesthataredesignedtokeepthesystemrunningontimesuchasbuslanes,trafficsignalpriority,andembarkationfromanydoor.
Assumptions CTEassumedthatchargerswouldbeinstalledatUTC,CUTC,andTRWENthataretheterminationpointsoftheroute.CTEfurtherassumedthatachargerwasavailableeachtimeabusarrivedatoneoftheselocationsforalayover.CTEassumedthatitwouldtakeacombinedtwominutestoplugandunplugthebusatthestationandsothistimewasexcludedfromtheavailablechargetime.
Foron-routecharging,thechargerateiscritical.BYDofferedtoaugmentovernight,plug-indepotchargingwithplug-inon-routecharging.Thus,CTEassumedthesameBYDplug-inchargersthatareinstalledinART’sdepot.CTEusedavariablechargeratedependentonstate-of-chargebecausethatistheperformanceCTEobservedandalsobecausethatmethodwasrecommendedbyBYD.Inadditiontothechargepowerobserved,CTEalsoanalyzedthechargepowerthatBYDsaystheycansustainduringaten-minutecharge.CTErecommendsthatthischargerateistestedandconfirmedbeforeacceptingthissolution.
AssessmentofBYDK11BatteryElectricBusoperationontheAlbuquerqueRapidTransit(ART)ServiceAlbuquerqueRapidTransit(ART)Service
CenterforTransportation&theEnvironment Page14
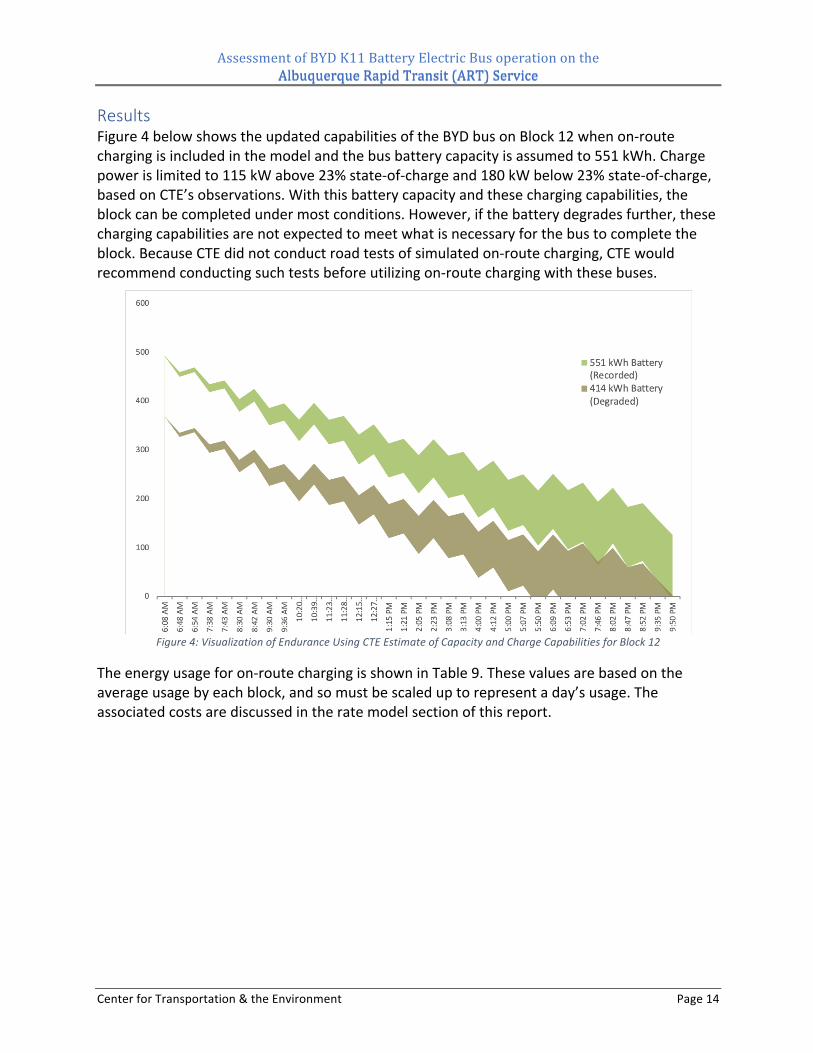
Results Figure4belowshowstheupdatedcapabilitiesoftheBYDbusonBlock12whenon-routechargingisincludedinthemodelandthebusbatterycapacityisassumedto551kWh.Chargepowerislimitedto115kWabove23%state-of-chargeand180kWbelow23%state-of-charge,basedonCTE’sobservations.Withthisbatterycapacityandthesechargingcapabilities,theblockcanbecompletedundermostconditions.However,ifthebatterydegradesfurther,thesechargingcapabilitiesarenotexpectedtomeetwhatisnecessaryforthebustocompletetheblock.BecauseCTEdidnotconductroadtestsofsimulatedon-routecharging,CTEwouldrecommendconductingsuchtestsbeforeutilizingon-routechargingwiththesebuses.
Figure4:VisualizationofEnduranceUsingCTEEstimateofCapacityandChargeCapabilitiesforBlock12
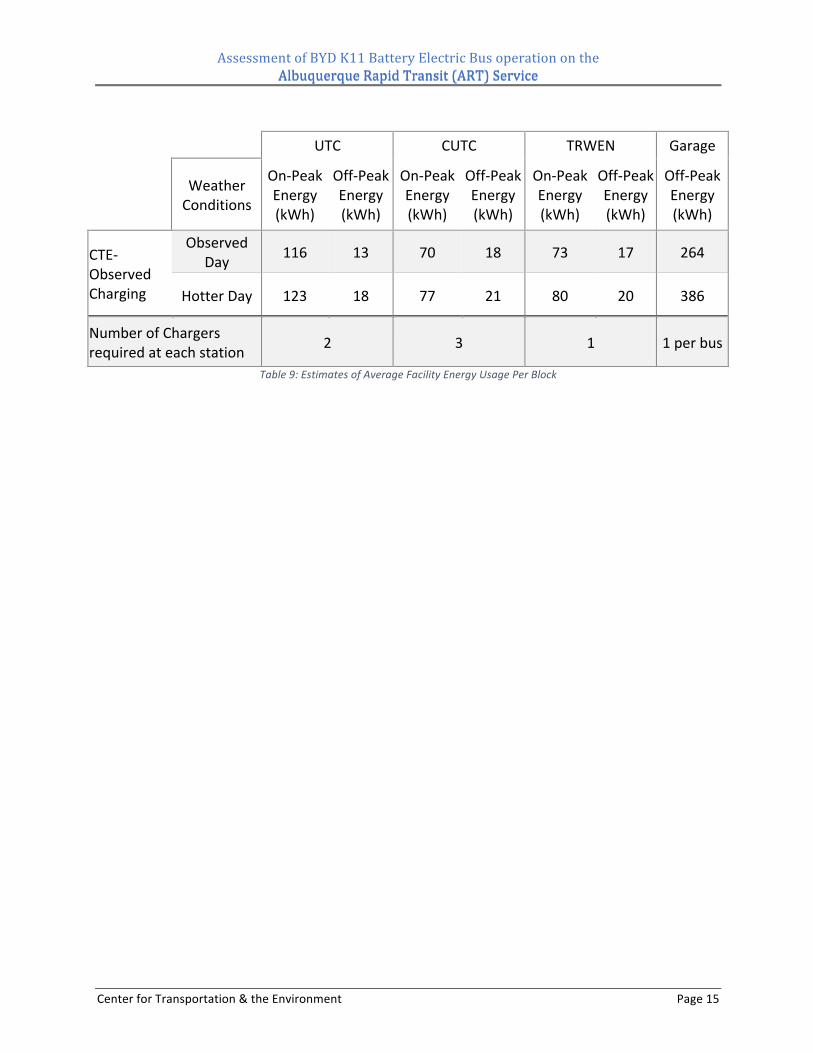
Theenergyusageforon-routechargingisshowninTable9.Thesevaluesarebasedontheaverageusagebyeachblock,andsomustbescaleduptorepresentaday’susage.Theassociatedcostsarediscussedintheratemodelsectionofthisreport.
AssessmentofBYDK11BatteryElectricBusoperationontheAlbuquerqueRapidTransit(ART)ServiceAlbuquerqueRapidTransit(ART)Service
CenterforTransportation&theEnvironment Page15
UTC CUTC TRWEN Garage
WeatherConditions
On-PeakEnergy(kWh)
Off-PeakEnergy(kWh)
On-PeakEnergy(kWh)
Off-PeakEnergy(kWh)
On-PeakEnergy(kWh)
Off-PeakEnergy(kWh)
Off-PeakEnergy(kWh)
CTE-ObservedCharging
ObservedDay 116 13 70 18 73 17 264
HotterDay 123 18 77 21 80 20 386
NumberofChargersrequiredateachstation 2 3 1 1perbus
Table9:EstimatesofAverageFacilityEnergyUsagePerBlock
AssessmentofBYDK11BatteryElectricBusoperationontheAlbuquerqueRapidTransit(ART)ServiceAlbuquerqueRapidTransit(ART)Service
CenterforTransportation&theEnvironment Page16
Rate Model
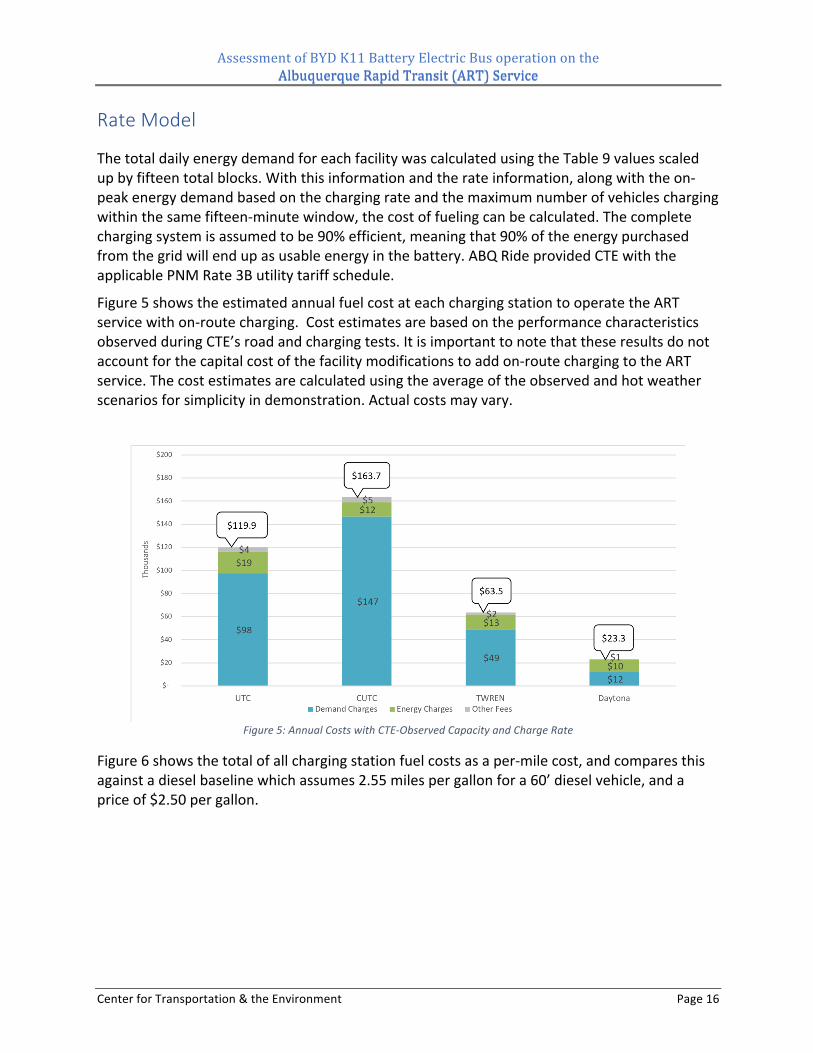
ThetotaldailyenergydemandforeachfacilitywascalculatedusingtheTable9valuesscaledupbyfifteentotalblocks.Withthisinformationandtherateinformation,alongwiththeon-peakenergydemandbasedonthechargingrateandthemaximumnumberofvehicleschargingwithinthesamefifteen-minutewindow,thecostoffuelingcanbecalculated.Thecompletechargingsystemisassumedtobe90%efficient,meaningthat90%oftheenergypurchasedfromthegridwillendupasusableenergyinthebattery.ABQRideprovidedCTEwiththeapplicablePNMRate3Butilitytariffschedule.
Figure5showstheestimatedannualfuelcostateachchargingstationtooperatetheARTservicewithon-routecharging.CostestimatesarebasedontheperformancecharacteristicsobservedduringCTE’sroadandchargingtests.Itisimportanttonotethattheseresultsdonotaccountforthecapitalcostofthefacilitymodificationstoaddon-routechargingtotheARTservice.Thecostestimatesarecalculatedusingtheaverageoftheobservedandhotweatherscenariosforsimplicityindemonstration.Actualcostsmayvary.
Figure5:AnnualCostswithCTE-ObservedCapacityandChargeRate
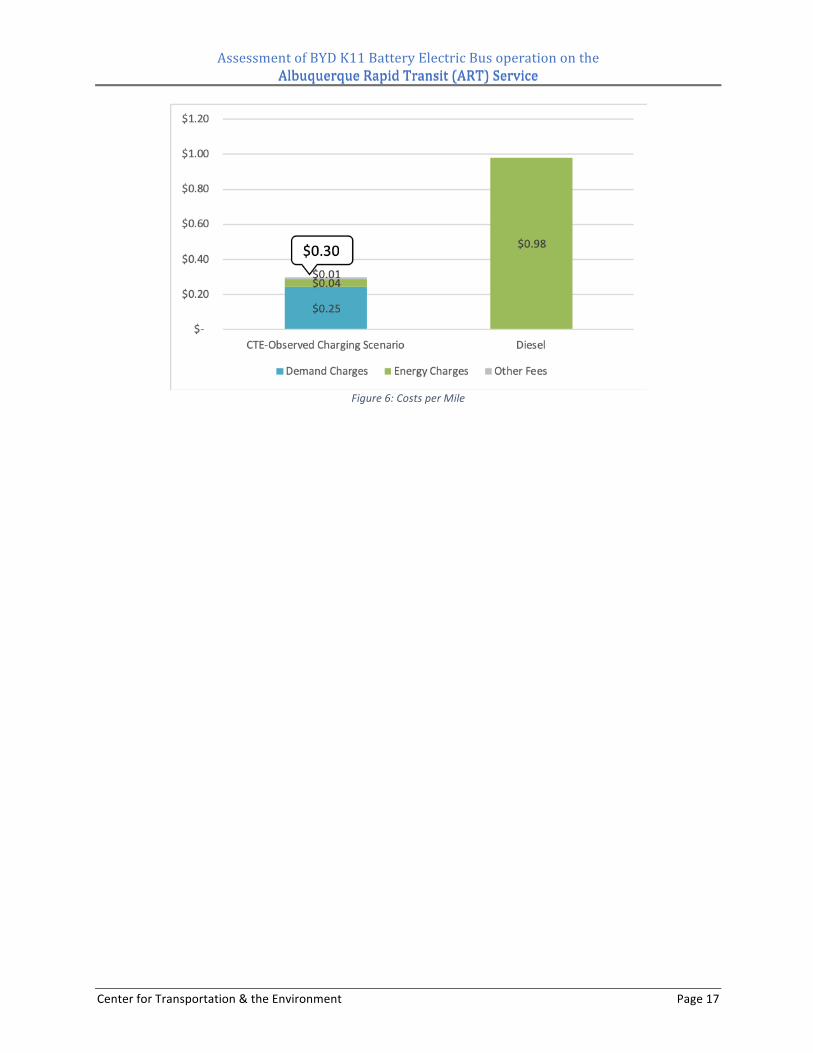
Figure6showsthetotalofallchargingstationfuelcostsasaper-milecost,andcomparesthisagainstadieselbaselinewhichassumes2.55milespergallonfora60’dieselvehicle,andapriceof$2.50pergallon.
AssessmentofBYDK11BatteryElectricBusoperationontheAlbuquerqueRapidTransit(ART)ServiceAlbuquerqueRapidTransit(ART)Service
CenterforTransportation&theEnvironment Page17
Figure6:CostsperMile
AssessmentofBYDK11BatteryElectricBusoperationontheAlbuquerqueRapidTransit(ART)ServiceAlbuquerqueRapidTransit(ART)Service
CenterforTransportation&theEnvironment Page18
Conclusions
ABQRide’soriginaldeploymentplanfortheARTBRTservicewastooperatethedeliveredBYDK11busesonallARTblocksusingovernightdepotcharging.Atthecompletionofeachblock,thebuswouldreturntoDaytonaandrechargeinpreparationforservicethenextday.Asaresultofouranalysis,CTEconcludesthatthisplanwillnotworkwiththeBYDK11busesthatweredeliveredtoABQRide,regardlessifthebuseswereatfulldesigncapacityorattheobservedcapacity.
BYDhasproposedamodifieddeploymenttoaddon-routechargingtotheARTservice.Tobeplausible,onetothreechargingstationsarerequiredateachterminationpoint;UTC,CUTC,TRWEN,aswellastheDaytonadepot.Whilethisoperationalmodelmaywork,therearerisksthatmustbeconsidered.ThedeliveredBYDK11busesarenotequippedwithoverheadorinductivechargingsystems.Asaresult,thebusesmustbechargedon-routeusingtheplug-inchargeconnector.Thiswouldrequirethatthesestationsbemannedorthatthedriverexitthebustoplugthebusin.Plug-incharginginapublicareaisnotidealduetopotentialliabilityissuesaswellasstaffingrequirements.
Consistentchargeratesduringon-routechargecyclesarecriticaltomaintainingserviceschedules.Additionaltestingisrequiredtoconfirmchargeratesduringvariousoperationalandclimaticconditionsaspassively-cooledbatterysystemsaresubjecttogreatervariationsinchargerate.Batteries,bynature,willheatupwhentheyarechargedordischarged.Thermalmanagementsystemsmaypurposefullylimitvehicleperformanceorchargeratetoprotectthebatteries.Somethermalmanagementstrategiesincludeactiveliquid-coolingsystemsthatarebetteratmaintainingbatterytemperatureinhotclimates,thusminimizingthechancethatperformanceorchargerateisdegraded.
Finally,theanalysisshowsthattheproposedBRTserviceusingtheproposedBYDK11buseswithbothdepotandon-routechargingcannotbecompletedasbatteriesdegradetowarrantylevels.Asaresult,ABQRidewillneedtomakealterationstotheblocksorserviceovertimeifthissolutionisimplemented.
IfABQRidedeterminesthattheoriginaldeploymentplanormodifieddeploymentplanareunacceptable,thereareseveralzero-emissionstrategiesthatmaybeconsidered:
1. Modifytheblockschedule2. Highercapacitybatteryelectricbuseswithfasteron-routecharging.3. Hydrogenfuelcellelectricbuses.4. CombinationStrategy
Asummarydescriptionandconsiderationforeachoptionisprovidedbelow:
Modify the Block Schedule ShorterblocksaremoresuitabletothedeliveredBYDK11buses.However,shorterblocksmayrequiremiddaycharginginadditiontoovernightcharging.Thischargingstrategycouldincurhigherelectricitycostsduetomiddaydemandcharges.Alternatively,morebusesmaybeneededtooperatetheservicewhenshorterblockingstrategiesareemployed.
AssessmentofBYDK11BatteryElectricBusoperationontheAlbuquerqueRapidTransit(ART)ServiceAlbuquerqueRapidTransit(ART)Service
CenterforTransportation&theEnvironment Page19
Higher capacity battery electric buses with overhead on-route charging TheARTBRTservicecanbeashowpieceforstate-of-theartzeroemissionbustechnology.Fixedrouteswithdedicatedroadwaysareidealforbatteryelectricbuses.Highercapacitybatteryelectricbuseswithliquid-cooledbatteriescanprovidegreaterrangewithlessimpactfromdegradation.Additionally,fasteroverheadconductivechargerscanprovidetherouteenergyrequiredinashortertime,andarealsolessimpactedbydegradation.
Hydrogen Fuel Cell Vehicles HydrogenfuelcellbuseswouldhavetherangeneededtooperateART’sblocks,andtheycanberefueledinminutes,similartoCNGbuses.However,thesebusesrequireasourceofhydrogenthatmustbemanufacturedon-siteordelivered.Eitheroptionisexpensivecomparedwithotherfuels.Hydrogenfuelinginfrastructureisexpensivebutcostsareeasilyleveragedoveralargerfleet.Thebusesthemselvesarealsomoreexpensivethananyotheroptionduetothelimitednumberofvehiclescurrentlyproduced.CTEexpectsthatbothfuelandbuscosttoshiftdownwardovertimeasthisoptionbecomesmorewidelydeployed.
Combination Strategies Acombinationoftheabovestrategiesisalsopossible.Forexample,abatteryelectricbusfleetcouldbesupplementedwithasmallnumberofconventionalbusestoavoidthenecessityofon-routechargingandprovidealternativestoservelongerblocks.

AssessmentofBYDK11BatteryElectricBusoperationontheAlbuquerqueRapidTransit(ART)ServiceAlbuquerqueRapidTransit(ART)Service
CenterforTransportation&theEnvironment PageA-1
Appendix: BYD-Proposed Scenario
DuringthecourseofCTE’sanalysis,BYDproposedtorestorebatteriestotheirfulldesigncapacityandreprogramtheirbatterymanagementsystemtoallowforahigherchargerateduringon-routecharging.SinceCTEdidnotobservetheseconditionsonthedeliveredBYDK11buses,wedidnotanalyzethoseconditionsaspartoftheprimaryassessment.However,wedidanalyzetheseconditionsforABQRideintheeventthatBYDisabletodeliverthesebusesinthefuture.Aswithanybusprocurement,CTErecommendstestingandvalidationofbusesandchargingequipmentpriortoacceptanceandplacementintopassengerservice.
CTErepeateditsanalysisofrangeandenduranceassumingabatterywithcapacityof590kWh.ThisanalysisassumesthatBYDwillbeabletorestorethebatterytoitsfulldesigncapacity.TheresultingrangeandendurancearepresentedinFigure7,Figure8,Figure9,andFigure10below.Itshouldbenotedthatthecapacityofthedegradedbatteryisunaffectedbythischange,asthewarranteddegradationis70%ofthedesignedcapacityregardlessofthisrepair.BYDalsocontendsthatthebatterieswillbeabletochargeatthefull180kWpowerlevelfor10-minutecharges,regardlessofthestateofchargethatthebusbeginsthechargeat.Theaffectthishasontheon-routechargingscenariocanbeseeninFigure10:VisualizationofEnduranceUsingBYD-ProposedCapacityandChargeCapabilitiesforBlock12.
Bus Capacity(kWh) ServiceEnergy(kWh)
BYDK11DesignGoal 591 532
BYDEstimatesafterRepair 590 531
DegradedBattery(70%ofDesign) 414 373Table10:BatteryCapacityforEstimateswithBYD'sProposedrepair
Figure7:ProjectedRangewithBYD'sProposedBatteryCapacityRepair
AssessmentofBYDK11BatteryElectricBusoperationontheAlbuquerqueRapidTransit(ART)ServiceAlbuquerqueRapidTransit(ART)Service
CenterforTransportation&theEnvironment PageA-2
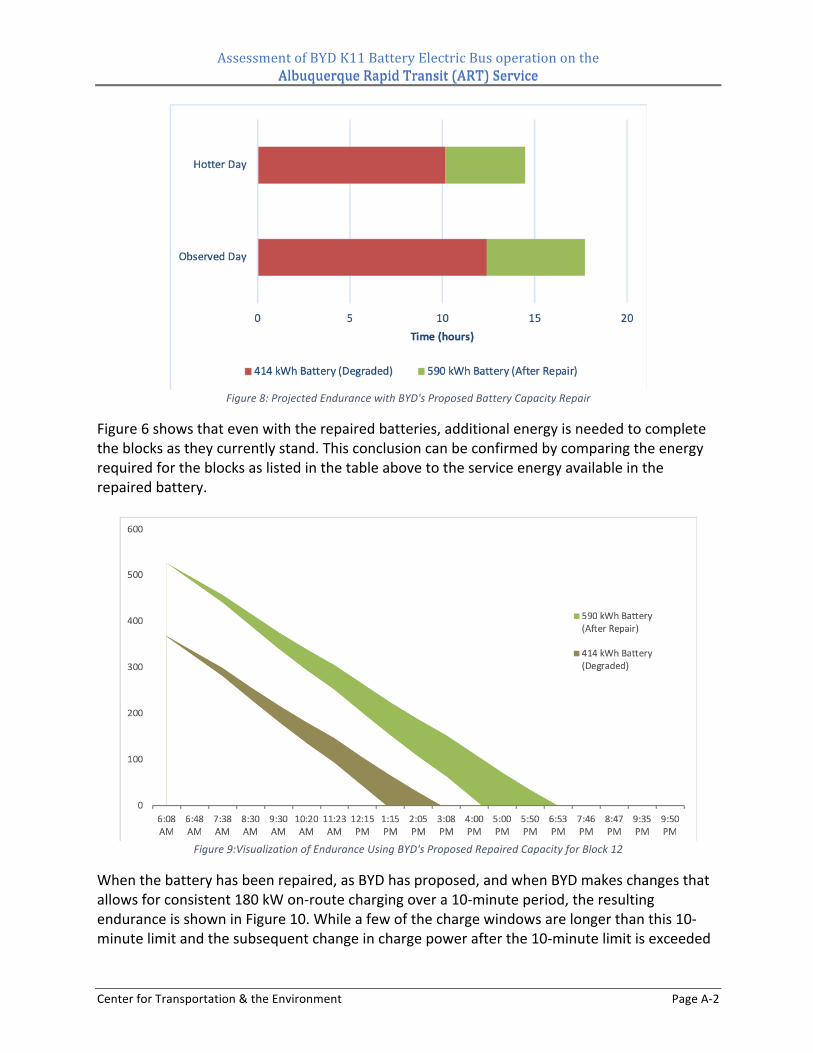
Figure8:ProjectedEndurancewithBYD'sProposedBatteryCapacityRepair
Figure6showsthatevenwiththerepairedbatteries,additionalenergyisneededtocompletetheblocksastheycurrentlystand.Thisconclusioncanbeconfirmedbycomparingtheenergyrequiredfortheblocksaslistedinthetableabovetotheserviceenergyavailableintherepairedbattery.
Figure9:VisualizationofEnduranceUsingBYD'sProposedRepairedCapacityforBlock12
Whenthebatteryhasbeenrepaired,asBYDhasproposed,andwhenBYDmakeschangesthatallowsforconsistent180kWon-routechargingovera10-minuteperiod,theresultingenduranceisshowninFigure10.Whileafewofthechargewindowsarelongerthanthis10-minutelimitandthesubsequentchangeinchargepowerafterthe10-minutelimitisexceeded
AssessmentofBYDK11BatteryElectricBusoperationontheAlbuquerqueRapidTransit(ART)ServiceAlbuquerqueRapidTransit(ART)Service
CenterforTransportation&theEnvironment PageA-3
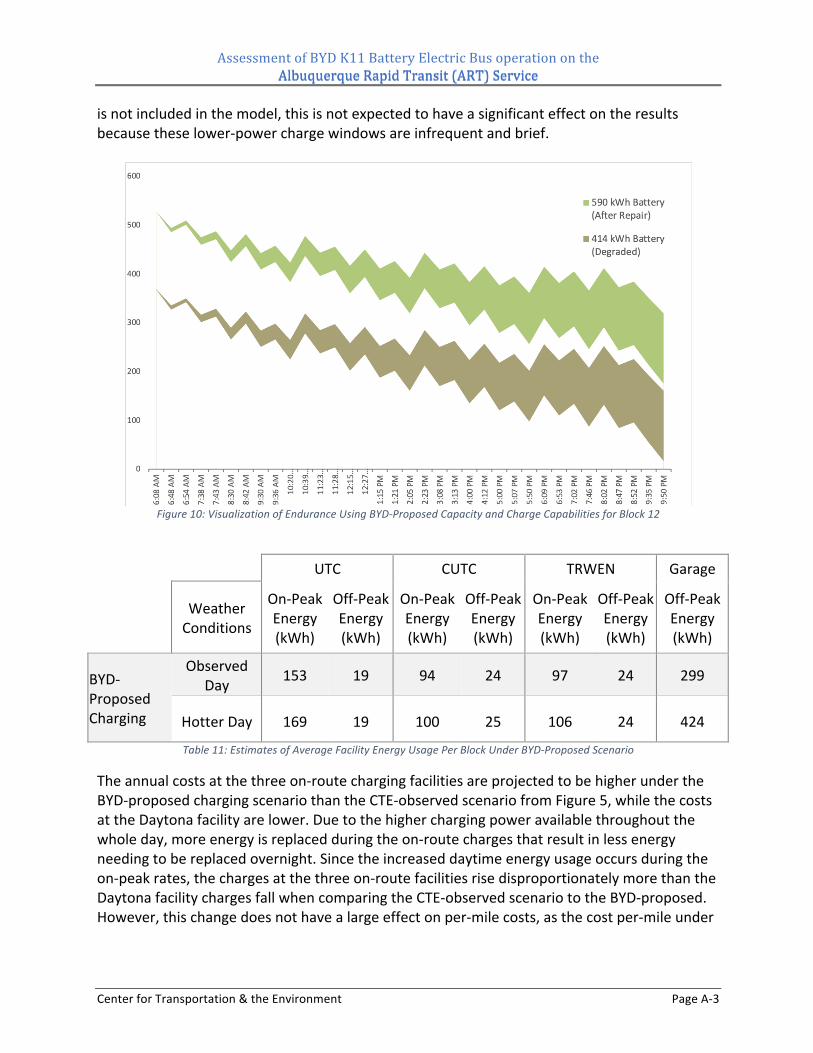
isnotincludedinthemodel,thisisnotexpectedtohaveasignificanteffectontheresultsbecausetheselower-powerchargewindowsareinfrequentandbrief.
Figure10:VisualizationofEnduranceUsingBYD-ProposedCapacityandChargeCapabilitiesforBlock12
UTC CUTC TRWEN Garage
WeatherConditions
On-PeakEnergy(kWh)
Off-PeakEnergy(kWh)
On-PeakEnergy(kWh)
Off-PeakEnergy(kWh)
On-PeakEnergy(kWh)
Off-PeakEnergy(kWh)
Off-PeakEnergy(kWh)
BYD-ProposedCharging
ObservedDay 153 19 94 24 97 24 299
HotterDay 169 19 100 25 106 24 424
Table11:EstimatesofAverageFacilityEnergyUsagePerBlockUnderBYD-ProposedScenario
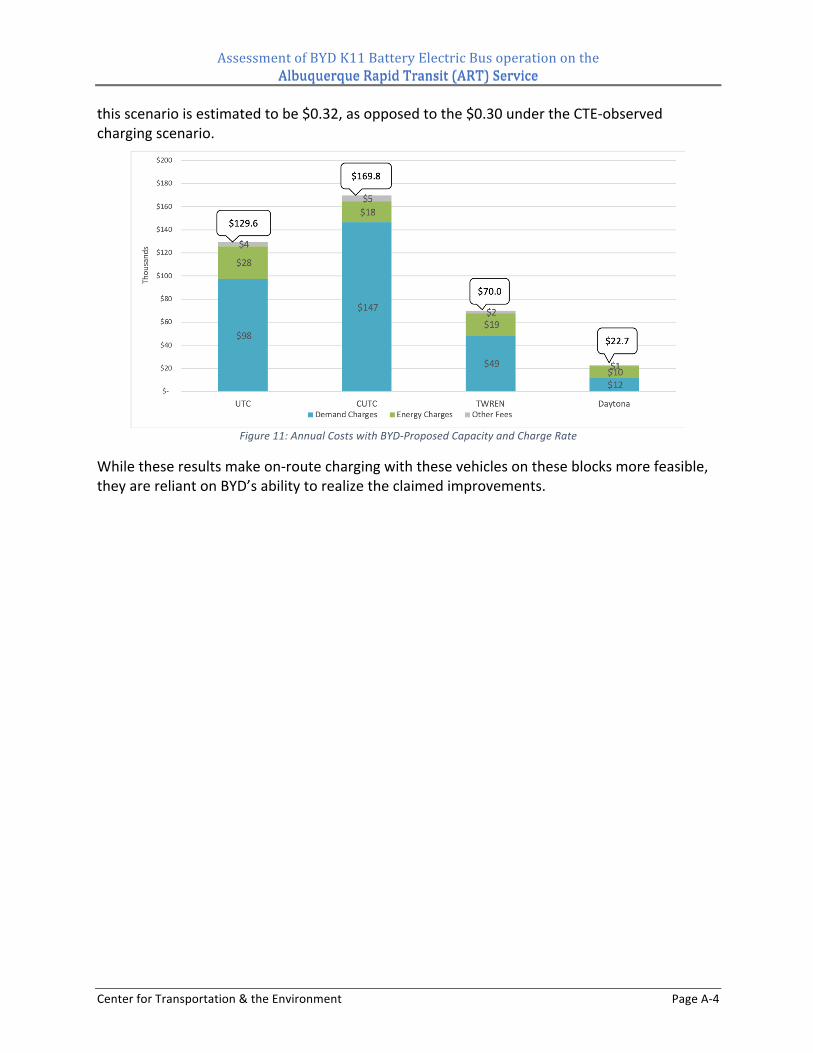
Theannualcostsatthethreeon-routechargingfacilitiesareprojectedtobehigherundertheBYD-proposedchargingscenariothantheCTE-observedscenariofromFigure5,whilethecostsattheDaytonafacilityarelower.Duetothehigherchargingpoweravailablethroughoutthewholeday,moreenergyisreplacedduringtheon-routechargesthatresultinlessenergyneedingtobereplacedovernight.Sincetheincreaseddaytimeenergyusageoccursduringtheon-peakrates,thechargesatthethreeon-routefacilitiesrisedisproportionatelymorethantheDaytonafacilitychargesfallwhencomparingtheCTE-observedscenariototheBYD-proposed.However,thischangedoesnothavealargeeffectonper-milecosts,asthecostper-mileunder
AssessmentofBYDK11BatteryElectricBusoperationontheAlbuquerqueRapidTransit(ART)ServiceAlbuquerqueRapidTransit(ART)Service
CenterforTransportation&theEnvironment PageA-4
thisscenarioisestimatedtobe$0.32,asopposedtothe$0.30undertheCTE-observedchargingscenario.
Figure11:AnnualCostswithBYD-ProposedCapacityandChargeRate
Whiletheseresultsmakeon-routechargingwiththesevehiclesontheseblocksmorefeasible,theyarereliantonBYD’sabilitytorealizetheclaimedimprovements.