Embed Size (px)
Citation preview
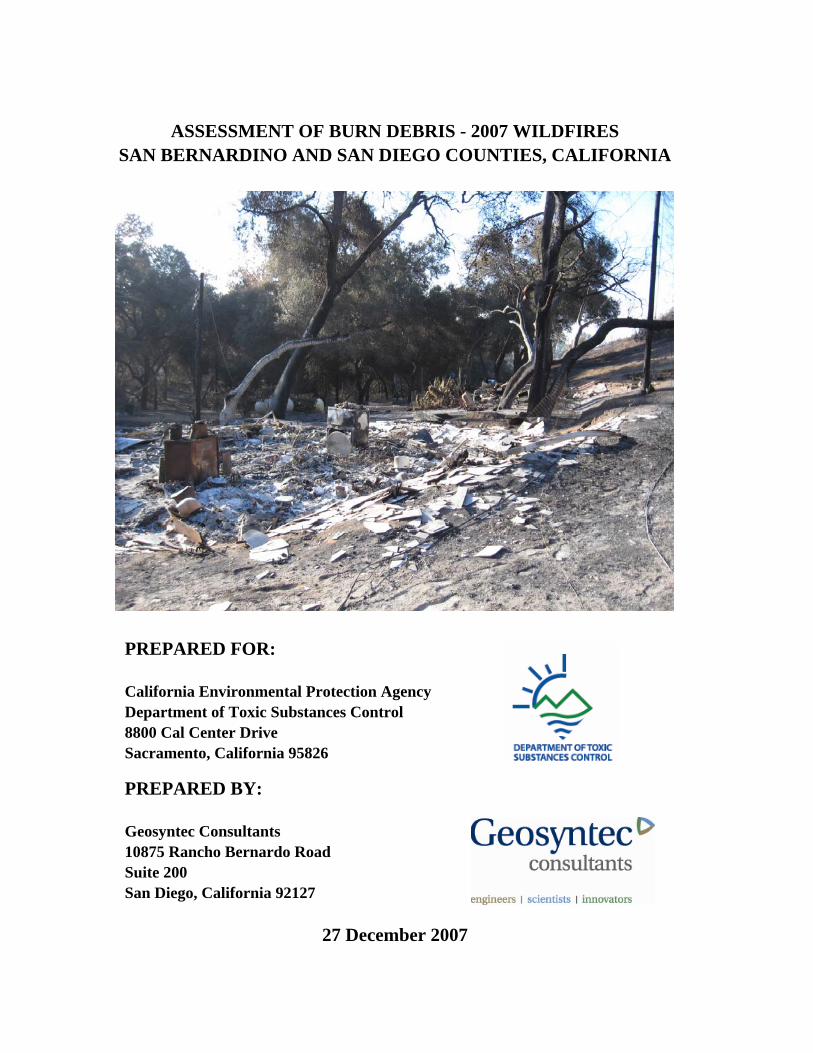
ASSESSMENT OF BURN DEBRIS - 2007 WILDFIRES SAN BERNARDINO AND SAN DIEGO COUNTIES, CALIFORNIA
PREPARED FOR: California Environmental Protection Agency Department of Toxic Substances Control 8800 Cal Center Drive Sacramento, California 95826 PREPARED BY: Geosyntec Consultants 10875 Rancho Bernardo Road Suite 200 San Diego, California 92127
27 December 2007

P:\SC0459\SamplingReport.122707.f.doc i
EXECUTIVE SUMMARY
Introduction
This report summarizes the results of the assessment of burned residential areas associated with the Slide Fire in San Bernardino County and Witch Creek Fire in San Diego County, California during October 2007 (Figures 1 and 2). Geosyntec Consultants (Geosyntec) performed this assessment on behalf of the California Environmental Protection Agency (CalEPA), Department of Toxic Substances Control (DTSC) in general accordance with the 27 November 2007 Sampling and Analysis Plan (SAP) (Geosyntec, 2007; Appendix A). The SAP was distributed to the United States Environmental Protection Agency (USEPA), DTSC, California Office of Environmental Health Hazard Assessment (OEHHA), California Office of Emergency Services (OES), San Bernardino and San Diego Counties, and the City of San Diego for review and comment.
Background
On 21 October 2007, the Governor of California proclaimed a “State of Emergency” as a result of the 2007 Southern California Wildfires which occurred throughout seven counties (Governor of the State of California, 2007). These fires burned more than 350,000 acres, destroyed more than 2,200 residential and commercial structures, and destroyed more than 2,000 vehicles in San Bernardino and San Diego Counties, alone.
Experiences from fires of a similar nature indicate that many hazardous substances may be found in burned residential areas. Some of these substances include metals from batteries, treated wood, and melted plumbing; pesticides and herbicides from lawn and garden products; polycyclic aromatic hydrocarbons (PAHs), including dioxins and furans from burned tires and plastic; asbestos from building materials; and polychlorinated biphenyls (PCBs) from appliances and automotive parts. Laboratory analysis of residential ash and burn debris following the 2003 San Diego County Wildfires indicated the presence of elevated concentrations of metals, including antimony, arsenic, copper, lead and zinc and certain PAHs. Concentrations of these constituents were present at levels exceeding statutorily-established health based criteria (Geosyntec, 2004).
The destruction left in the wake of these fires has the potential to result in widespread public exposure to toxic materials. Residents may be exposed to contaminants in burn debris and ash via dermal contact, ingestion, and inhalation exposure. With the pending winter rains comes the potential for surface water and groundwater contamination from
P:\SC0459\SamplingReport.122707.f.doc ii
the offsite migration of hazardous substances contained within the burn debris and ash. In addition, particulate matter in wind-entrained ash may also pose an inhalation risk.
Federal Environmental Management Agency (FEMA) Disaster Assistance Policy 9523.13, “Debris Removal from Private Property,” provides FEMA authority to fund debris removal from private property if debris removal is in the “public interest.” FEMA defines “public interest” as being necessary to: eliminate immediate threats to life, public health, and safety; eliminate immediate threats of significant damage to improved property; or ensure economic recovery of the affected community to the benefit of the community-at-1arge. In these situations, debris removal from private property may be considered to be in the public interest and thus may be eligible for reimbursement under the Public Assistance Program (44 CFR 206.224).
The CalEPA and its boards, departments, and offices, have made the determination that the burn debris and ash resulting from the 2007 Southern California Wildfires poses an immediate threat to public health and safety. Geosyntec understands that State, Counties of San Bernardino and San Diego, City of San Diego, and other local jurisdictions affected by the fires, are interested in demonstrating that expedited removal of residual burn debris and ash resulting from the wildfires is in the “public interest” due to immediate threats to human health, public safety, and the environment posed by hazardous constituents in the residual burn debris and ash on improved properties.
Scope of Work
Sampling data collected during this assessment were used to evaluate the presence of constituents which may pose hazards to human health, public safety, and the environment posed by hazardous constituents in the residual burn debris and ash on residential areas. To achieve the stated objectives, Geosyntec prepared and distributed a draft and final SAP to the interested regulatory agencies; collected burn debris and ash samples from 35 sites in San Bernardino County and 35 sites in San Diego County for laboratory analyses; and prepared this report.
Conclusions
The objective of this investigation was to perform a representative characterization of the residual burn debris and ash in residential areas to assess the presence of hazardous constituents at concentrations exceeding statutorily-established human health-based screening levels such as residential California Human Health Screening Levels (CHHSLs) and Preliminary Remediation Goals (PRGs). The laboratory analytical data
P:\SC0459\SamplingReport.122707.f.doc iii
document the presence of constituents in the burn debris and ash at concentrations exceeding established residential CHHSLs or PRGs.
The results of this assessment demonstrate that burn debris and ash in residential areas affected by the 2007 Southern California wildfires poses an immediate threat to public health and safety, and that expedited removal of burn debris from these areas is warranted and in the “public interest” based on the following:
• Arithmetic mean concentrations of arsenic, cadmium, copper, and lead exceed residential CHHSLs or PRGs in both areas characterized in San Bernardino and San Diego Counties.
• The geometric mean concentration of arsenic exceeds the residential CHHSL and PRG in both areas characterized in San Bernardino and San Diego Counties. The geometric mean concentration of lead also exceeds the residential CHHSL and PRG in the area characterized in San Bernardino County.
• Arithmetic and geometric mean concentrations of PAHs were below CHHSLs and PRGs, but greater than 27 percent of the samples collected in the areas characterized in San Bernardino and San Diego Counties contained one or more PAH constituents at concentrations exceeding CHHSLs or PRGs.
• Geometric mean concentrations of antimony, arsenic, barium, chromium, nickel, and zinc exceeded USEPA Region IX soil screening levels for surface water, shallow groundwater, and areas underlain by fractured rock aquifers in both areas characterized in San Bernardino and San Diego Counties. As demonstrated by the November 2007 USGS study, when mixed with rainwater to form surface water runoff, the elevated concentrations of several metals and caustic alkaline materials in the ash may adversely affect ecosystems and the quality of surface drinking water supplies.
• The results of this burn debris assessment indicated similar COCs were detected as those detected during the assessment following the 2003 San Diego County wildfires. However, the concentrations of COCs detected following the 2007 wildfires were generally lower than concentrations detected following the 2003 wildfires as a result of the statistically-based random sampling approach and purposefully avoiding samples from areas with suspected high levels of contamination (e.g., under a burned car) during the 2007 assessment. Therefore, it is possible that higher concentrations of
P:\SC0459\SamplingReport.122707.f.doc iv
COCs are present in burn debris in the areas sampled than detected during this assessment.
• Geosyntec understands that visible and retrievable household hazardous wastes were removed prior to sampling, and did not influence the results of characterizing typical residential contamination following a wildfire. However, constituents still exceeded the established screening criteria following the removal of these wastes.
• The screening criteria (residential CHHSLs and PRGs) utilized during this assessment were developed for soil and may underestimate the hazard associated with ash and burn debris which is more likely to become airborne or absorbed through the skin.
P:\SC0459\SamplingReport.122707.f.doc v
TABLE OF CONTENTS
EXECUTIVE SUMMARY ............................................................................................... i Introduction ....................................................................................................................... i Background........................................................................................................................ i Scope of Work .................................................................................................................. ii Conclusions....................................................................................................................... ii
1. INTRODUCTION ................................................................................................ 1 1.1 Background.................................................................................................. 1 1.2 Scope of Work ............................................................................................. 3
2. SITE DESCRIPTION AND BACKGROUND .................................................... 4 2.1 Description of Burned Areas ....................................................................... 4 2.2 Regulatory Guidance ................................................................................... 4 2.3 Constituents of Concern .............................................................................. 5 2.4 Sampling Areas............................................................................................ 5
2.4.1 San Bernardino County................................................................... 6 2.4.1.1 Physiographic and Geologic Setting ................................ 6 2.4.1.2 Site Features and Conditions............................................ 6
2.4.2 San Diego County ........................................................................... 6 2.4.2.1 Physiographic and Geologic Setting ................................ 6 2.4.2.2 Site Features and Conditions............................................ 7
2.5 Statistical Methods for Identifying Properties Selected for Sampling ........ 7 2.6 Sampling Locations ..................................................................................... 9
3. SITE ASSESSMENT FIELD ACTIVITIES ...................................................... 10 3.1 Sampling Methodology ............................................................................. 10 3.2 Field Documentation ................................................................................. 11 3.3 Sample Handling ....................................................................................... 12
3.3.1 Sample Labeling and Identification .............................................. 12 3.3.2 Sample Containers and Transportation ......................................... 12 3.3.3 Chain-of-Custody Procedures ....................................................... 12
3.4 Analytical Parameters................................................................................ 12 3.5 Validation of Laboratory Analytical Results............................................. 13
4. SUMMARY OF RESULTS ............................................................................... 14 4.1 Nature of Materials Sampled..................................................................... 14

P:\SC0459\SamplingReport.122707.f.doc vi
4.2 Established Screening Criteria .................................................................. 14 4.2.1 Human Health Screening Criteria ................................................. 15 4.2.2 Waste Characterization Screening Criteria ................................... 16 4.2.3 Other Screening Criteria ............................................................... 16
4.3 Laboratory Analytical Results ................................................................... 17 4.3.1 San Bernardino County................................................................. 17
4.3.1.1 Metals............................................................................. 17 4.3.1.2 Polycyclic Aromatic Hydrocarbons (PAHs).................. 24
4.3.2 San Diego County ......................................................................... 27 4.3.2.1 Metals............................................................................. 27 4.3.2.2 Polycyclic Aromatic Hydrocarbons (PAHs).................. 33
4.4 Statistical Evaluation ................................................................................. 36
5. SUMMARY OF HAZARDS ASSOCIATED WITH BURN DEBRIS ............. 37 5.1 San Bernardino County ............................................................................. 37 5.2 San Diego County...................................................................................... 38
6. CONCLUSIONS ................................................................................................ 40
7. LIMITATIONS................................................................................................... 42
8. REFERENCES ................................................................................................... 43
LIST OF TABLES
Table 1: Laboratory Analytical Matrix – San Bernardino County
Table 2: Laboratory Analytical Matrix – San Diego County
Table 3: Summary of Analytical Results – San Bernardino County
Table 4: Summary of Analytical Results – San Diego County
Table 5: Summary of Samples Exceeding Established Regulatory Criteria – San Bernardino County
Table 6: Summary of Samples Exceeding Established Regulatory Criteria – San Diego County
P:\SC0459\SamplingReport.122707.f.doc vii
LIST OF FIGURES
Figure 1: San Bernardino County Burn Areas
Figure 2: San Diego County Burn Areas
Figure 3: San Bernardino County Burn Debris Sampling Locations
Figure 4: San Diego County Burn Debris Sampling Locations
LIST OF APPENDICES
Appendix A Sampling and Analysis Plan
Appendix B Photograph Log
Appendix C Laboratory Analytical Certificates and Data Validation
Appendix D Statistical Analysis Report
P:\SC0459\SamplingReport.122707.f.doc 1
1. INTRODUCTION
This report summarizes the results of the assessment of burned residential areas associated with the Slide Fire in San Bernardino County and Witch Creek Fire in San Diego County, California during October 2007 (Figures 1 and 2). Geosyntec Consultants’ (Geosyntec) services were performed for the California Environmental Protection Agency (CalEPA), Department of Toxic Substances Control (DTSC) in general accordance with the 27 November 2007 Sampling and Analysis Plan (SAP) (Geosyntec, 2007; Appendix A). The SAP was distributed to the United States Environmental Protection Agency (USEPA), DTSC, California Office of Environmental Health Hazard Assessment (OEHHA), California Office of Emergency Services (OES), San Bernardino and San Diego Counties, and the City of San Diego for review and comment.
Data collected during this assessment will be provided to the interested agencies referenced above. This report was prepared by Ms. Jennifer Schwartz and Ms. Shana McCarthy and has been reviewed by Mr. Veryl Wittig, PG, CHG and Mr. Sam Williams, PG, CHG, all of Geosyntec, in accordance with the peer review policy of the firm.
1.1 Background
On 21 October 2007, the Governor of California proclaimed a “State of Emergency” (Executive Order EO S-13-07) as a result of the 2007 Southern California Wildfires which occurred throughout seven counties (Governor of the State of California, 2007). These fires burned more than 350,000 acres, destroyed more than 2,200 residential and commercial structures, and destroyed more than 2,000 vehicles in San Diego and San Bernardino Counties, alone.
The destruction left in the wake of these fires has the potential to result in widespread public exposure to toxic materials. Residents may be exposed to contaminants in burn debris and ash via dermal contact, ingestion, and inhalation exposure. With the pending winter rains comes the potential for surface water and groundwater contamination from the offsite migration of hazardous substances contained within the burn debris and ash. In addition, particulate matter in wind-entrained ash may also pose an inhalation risk.
Experiences from fires of a similar nature indicate that many hazardous substances may be found in burned residential areas. Some of these substances include metal residue from batteries, treated wood, and melted plumbing; pesticides and herbicides from lawn and garden products; polycyclic aromatic hydrocarbons (PAHs), including dioxins and
P:\SC0459\SamplingReport.122707.f.doc 2
furans, from burned tires and plastics; asbestos from building materials; and polychlorinated biphenyls (PCBs) from appliances and automotive parts. Laboratory analysis of burned residential ash and debris following the 2003 San Diego County Wildfires indicated the presence of elevated concentrations of certain PAHs as well as heavy metals, including antimony, arsenic, copper, lead and zinc (Geosyntec, 2004). Concentrations of these constituents were present at levels exceeding statutorily-established health based criteria. A reasonable expectation was that similar types of hazardous substances would be detected following analysis of ash and debris from the 2007 Southern California Wildfires. If so, such data would warrant removal of these materials from affected communities in an expedited manner to protect public health and safety.
An assessment of ash and burned soils from the 2007 Southern California Wildfires was performed by the USGS in November 2007. Although limited in the number of samples collected and analyzed, the USGS identified the presence of elevated concentrations of several metals and caustic alkaline materials. The USGS indicated that rain-water runoff from burned areas may adversely affect ecosystems and the quality of surface drinking water supplies, and that aquatic habitat may be affected by spikes in alkalinity as rainwater mixes with ash to form surface runoff (USGS, 2007).
Federal Environmental Management Agency (FEMA) Disaster Assistance Policy 9523.13, “Debris Removal From Private Property,” dated 18 July 2007, Sections 403(a)(3)(A) and 407 of the Stafford Act, 42 U.S.C. 5170b and 5173, respectively, provides FEMA authority to fund debris removal from private property provided that the State or local government arranges an unconditional authorization for removal of the debris, and agrees to indemnify the Federal government against any claim arising from the removal. The regulations implementing Sections 403 and 407 of the Stafford Act at 44 CFR 206.224 require that debris removal be in the “public interest” in order to be eligible for reimbursement. FEMA defines “public interest” as being necessary to: eliminate immediate threats to life, public health, and safety; eliminate immediate threats of significant damage to improved property; or ensure economic recovery of the affected community to the benefit of the community-at-1arge. In these situations, debris removal from private property may be considered to be in the public interest and thus may be eligible for reimbursement under the Public Assistance Program (44 CFR 206.224).
Geosyntec understands that State, County, and local agencies including the DTSC, Counties of San Diego and San Bernardino, and City of San Diego are interested in demonstrating that expedited removal of residual burn debris and ash resulting from the wildfires is in the “public interest” due to immediate threats to human health (primarily adult and children residents within and near the affected communities), public safety,
P:\SC0459\SamplingReport.122707.f.doc 3
and the environment (primarily water quality and air quality) posed by hazardous constituents in the residual burn debris and ash on improved properties.
1.2 Scope of Work
The objective of the sampling and analyses described herein was to perform a representative characterization of the hazards associated with burn debris and ash within two “typical” residential areas (one in San Bernardino County and one in San Diego County) affected by the 2007 Southern California Wildfires. The concentrations of constituents of concern (COCs) in the burn debris and ash were compared to statutorily-established human health-based screening levels and other established criteria to determine if COCs were present at concentrations exceeding the screening levels. The CalEPA intends to use the data collected as described herein to support the determination of an immediate threat to public health and safety made by CalEPA and its boards, departments, and offices according to FEMA disaster Assistance Policy 9523.13. By using a statistically-based random sampling approach within “typical” burned residential areas, the conclusions based on the sample analyses may be generalized to other residential areas affected by the fires. Therefore, sampling within each fire area and in each affected local jurisdiction was determined to not be necessary.
Sampling data collected during this assessment were used to evaluate the possible presence of constituents which may pose hazards to human health, public safety, and the environment posed by hazardous constituents in the residual burn debris and ash on improved properties. To achieve the stated objectives, Geosyntec completed the following scope of work:
• Participated in regulatory conference calls to develop guidelines for the assessment of burned residential areas;
• Prepared and distributed a SAP for concurrence from the interested regulatory agencies;
• Prepared a project-specific Health and Safety Plan (HASP);
• Collected burn debris samples (debris samples) from 70 different sites for laboratory analyses;
• Analyzed debris samples for the COCs, namely Title 22 Metals and PAHs;
• Evaluated field and laboratory data;
• Performed a statistical analysis of the sample results; and
• Prepared this report.
P:\SC0459\SamplingReport.122707.f.doc 4
2. SITE DESCRIPTION AND BACKGROUND
This section provides a general description of the burned areas, regulatory guidance, COCs, sampling locations, and statistical methods used to identify properties for sampling.
2.1 Description of Burned Areas
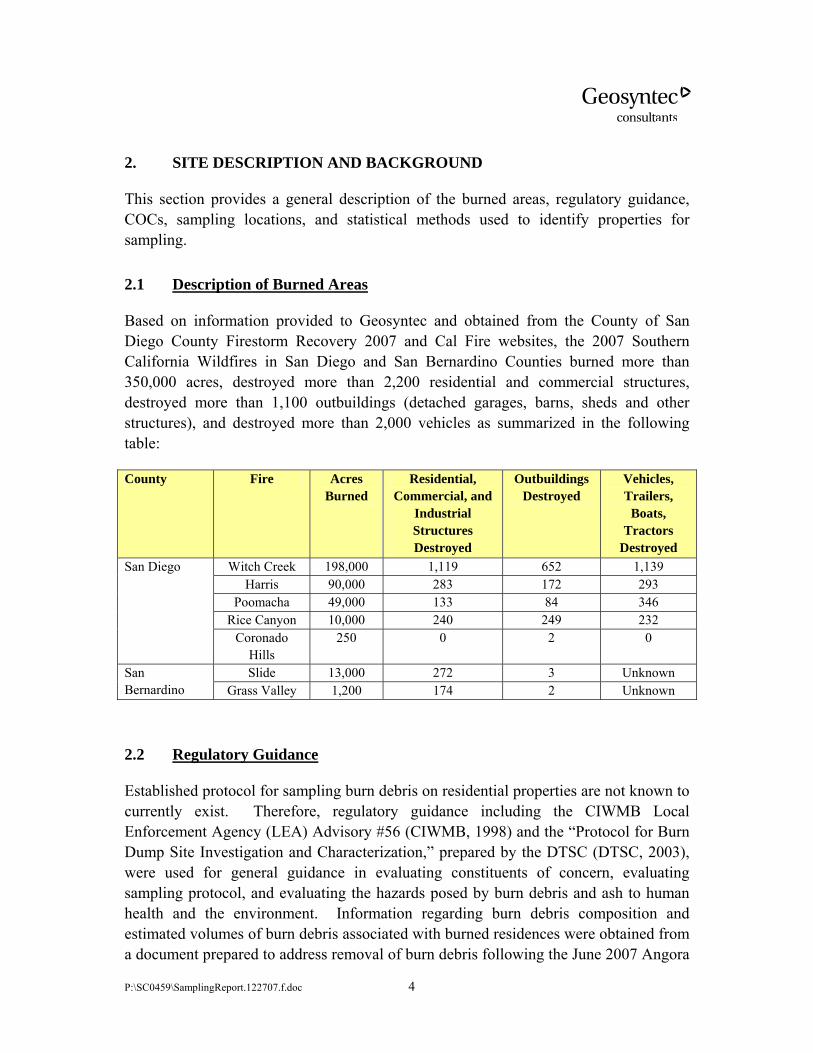
Based on information provided to Geosyntec and obtained from the County of San Diego County Firestorm Recovery 2007 and Cal Fire websites, the 2007 Southern California Wildfires in San Diego and San Bernardino Counties burned more than 350,000 acres, destroyed more than 2,200 residential and commercial structures, destroyed more than 1,100 outbuildings (detached garages, barns, sheds and other structures), and destroyed more than 2,000 vehicles as summarized in the following table:
County Fire Acres Burned
Residential, Commercial, and
Industrial Structures Destroyed
Outbuildings Destroyed
Vehicles, Trailers,
Boats, Tractors
Destroyed Witch Creek 198,000 1,119 652 1,139
Harris 90,000 283 172 293 Poomacha 49,000 133 84 346
Rice Canyon 10,000 240 249 232
San Diego
Coronado Hills
250 0 2 0
Slide 13,000 272 3 Unknown San Bernardino Grass Valley 1,200 174 2 Unknown
2.2 Regulatory Guidance
Established protocol for sampling burn debris on residential properties are not known to currently exist. Therefore, regulatory guidance including the CIWMB Local Enforcement Agency (LEA) Advisory #56 (CIWMB, 1998) and the “Protocol for Burn Dump Site Investigation and Characterization,” prepared by the DTSC (DTSC, 2003), were used for general guidance in evaluating constituents of concern, evaluating sampling protocol, and evaluating the hazards posed by burn debris and ash to human health and the environment. Information regarding burn debris composition and estimated volumes of burn debris associated with burned residences were obtained from a document prepared to address removal of burn debris following the June 2007 Angora
P:\SC0459\SamplingReport.122707.f.doc 5
Fire in South Lake Tahoe, California (CIWMB, 2007). Debris sampling protocol were reviewed from the USEPA Resource Conservation and Recovery Act (RCRA) Waste Sampling Guidance (USEPA, 2002a). Composite sampling protocol were reviewed from the USEPA Guidance on Choosing a Sampling Design for Environmental Data Collection (USEPA, 2002b), and the San Diego County DEH Site Assessment and Mitigation (SAM) Manual (DEH, 2004).
2.3 Constituents of Concern
Based on sampling and laboratory analyses following the 2003 San Diego County Wildfires, metals (primarily arsenic, lead, zinc, copper, and antimony), and PAHs (primarily benzo(a)anthracene, benzo(a)pyrene, and dibenz(a,h)anthracene) were the COCs most frequently detected at concentrations exceeding health-based screening levels (Geosyntec, 2004). Therefore, Geosyntec was directed by CalEPA to use metals and PAHs as indicator parameters for the laboratory analyses to be performed on samples collected.
Other constituents of potential concern (COPCs) in residential burn debris include pesticides and herbicides from lawn, garden, and home products; asbestos from building materials, insulation, flooring, and roofing materials; PCBs from appliances, transformers, and automotive parts; polybrominated biphenyls (PBBs) used as flame retardants in textiles, carpets, and plastics; and dioxins and furans created by burning organic materials. These COPCs were not analyzed as part of this assessment.
2.4 Sampling Areas
Representatives from San Bernardino and San Diego Counties designated the “typical” residential areas targeted for sampling in their respective county. The San Bernardino County sampling area was located within the “Running Springs” community, approximately 6 miles from Lake Arrowhead in the San Bernardino Mountains. Within this general area, approximately 161 homes were destroyed by the Slide Fire. The San Diego County sampling area was located within the “Westwood” community in Rancho Bernardo, an area of single family homes within the City of San Diego. Within this general area, approximately 134 homes were destroyed by the Witch Creek Fire (City of San Diego, 2007). Sampling was performed on or near the footprint of the former structures (where the burn debris and ash was typically located) on the residential properties randomly selected within the two areas. In the one case where burn debris and ash were consolidated at the site within a stockpile, in preparation for offsite transport and disposal, samples were collected following stockpile sampling protocol summarized in the SAP.
P:\SC0459\SamplingReport.122707.f.doc 6
2.4.1 San Bernardino County
2.4.1.1 Physiographic and Geologic Setting
The general site area is located within the Lake Arrowhead basin of the Transverse Ranges Province. The Lake Arrowhead basin is situated within the San Bernardino Mountains of San Bernardino County, approximately 20 miles northeast of the City of San Bernardino and approximately 90 miles east of Los Angeles.
The Lake Arrowhead basin, like much of the San Bernardino Mountains, is comprised primarily of Cretaceous age granitic bedrock and lesser amounts of Pre-Cambrian granitic and metamorphic crystalline rock (Bortungno, 1986). The general area is bounded to the north by south-dipping faults of the north-frontal fault system and to the south and west by the San Andreas Fault system (USGS, 2006).
The general sampling area is located within the Upper Mojave River Valley Groundwater Basin of the South Lahontan Hydrologic Region. The groundwater in the Upper Mojave Basin is predominantly unconfined, and has been designated as beneficial for municipal and agricultural supply purposes (California Department of Water Resources, 2004).
The presence of a relatively thin layer or “veneer” of residual soil overlying fractured rock throughout much of the areas burned presents a greater potential for the introduction of contaminants, which may be present at the sites, into the groundwater.
2.4.1.2 Site Features and Conditions
The sites sampled are primarily located in rural, unincorporated areas of San Bernardino County. Many of the residences were located on steep slopes or other high-lying areas, and were typically surrounded by relatively thick vegetation consisting of native and non-native species. Sites sampled generally consisted of the remnants of a former home and a garage or shed. In many cases, a burned vehicle(s)/equipment, or debris pile(s) were present at the sampling site. Although a site-specific evaluation of soil conditions was not within the scope of this assessment, most of the burned areas were found to be underlain by residual soil, and weathered or fractured bedrock.
2.4.2 San Diego County
2.4.2.1 Physiographic and Geologic Setting
The general sampling area is situated within the western foothills of the Peninsular Ranges Province in the Rancho Bernardo area of San Diego County, approximately 20 miles north-northeast of downtown San Diego. Within this area, the topography
P:\SC0459\SamplingReport.122707.f.doc 7
generally consists of canyons and rolling hills at an approximate elevation of 470 feet above MSL. The area is bounded by the Peninsular Range to the east and the coastal plain and Pacific Ocean to the West. The western foothills of the Peninsular Ranges are typically composed of crystalline (igneous and metamorphic) rock of Cretaceous to late Jurassic age (Kennedy, 1975) and is characterized by northwest-trending faults associated with the boundary between the North American and Pacific plates. The project area lies between the active Rose Canyon and Elsinore fault zones at respective distances of approximately 12 miles west and 22 miles east.
The general sampling area is located within the Del Dios Hydrologic Subarea of the Hodges Hydrogeologic Area (905.2) of the San Dieguito Hydrologic Unit. The groundwater in the Hodges Hydrologic Area is generally unconfined, and has been designated as beneficial for municipal, agricultural, and industrial supply purposes (RWQCB, 2006).
The presence of a relatively thin layer or “veneer” of residual soil overlying fractured rock throughout much of the areas burned presents a greater potential for the introduction of contaminants which may be present at the sites into the fractured rock aquifer(s) which underlie many of these areas. In contrast, a significant thickness of sediments which may be present on a mesa or in an alluvial valley would likely provide greater protection by acting as a “filter” to an underlying fractured rock or sedimentary aquifer.
2.4.2.2 Site Features and Conditions
The sites sampled are located in a suburban, residential area. Many of the residences were located in generally flat areas; some homes were on terraced slopes. Sites sampled generally consisted of the remnants of a former home and attached garage. In some cases there was also a burned vehicle, burned appliances, or debris pile(s) at the sampling site. Although a site specific evaluation of soil conditions was not within the scope of this assessment, most of the burned areas were found to be underlain by residual soil, and weathered and fractured bedrock.
2.5 Statistical Methods for Identifying Properties Selected for Sampling
Variability in the concentrations of constituents in burn debris samples collected from residential properties affected by the 2003 wildfires were used to estimate the variance of constituent concentrations for the proposed samples. The coefficient of variation (CV) was used to estimate variability relative to the mean. The results for a few key COCs from the 2003 fires (including metals and PAHs) along with the median CV for
P:\SC0459\SamplingReport.122707.f.doc 8
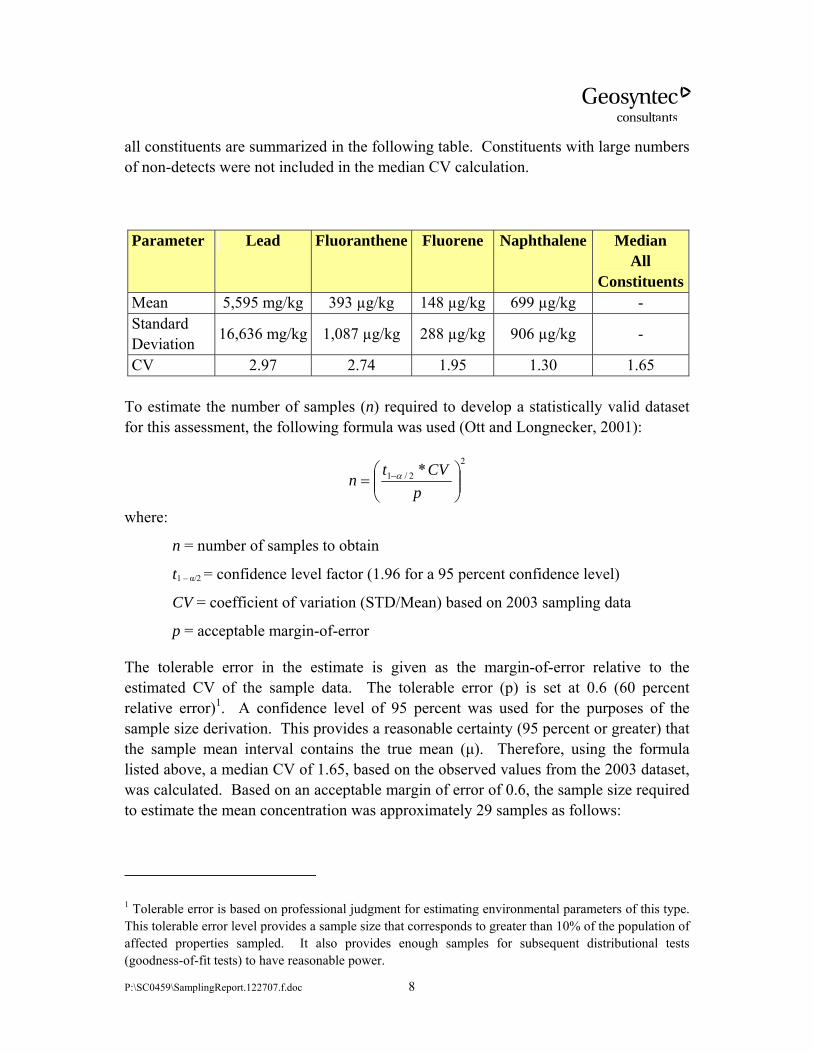
all constituents are summarized in the following table. Constituents with large numbers of non-detects were not included in the median CV calculation.
Parameter Lead Fluoranthene Fluorene Naphthalene Median All
ConstituentsMean 5,595 mg/kg 393 µg/kg 148 µg/kg 699 µg/kg - Standard Deviation 16,636 mg/kg 1,087 µg/kg 288 µg/kg 906 µg/kg -
CV 2.97 2.74 1.95 1.30 1.65
To estimate the number of samples (n) required to develop a statistically valid dataset for this assessment, the following formula was used (Ott and Longnecker, 2001):
22/1 *
⎟⎟⎠
⎞⎜⎜⎝
⎛= −
pCVt
n α
where:
n = number of samples to obtain
t1 – α/2 = confidence level factor (1.96 for a 95 percent confidence level)
CV = coefficient of variation (STD/Mean) based on 2003 sampling data
p = acceptable margin-of-error
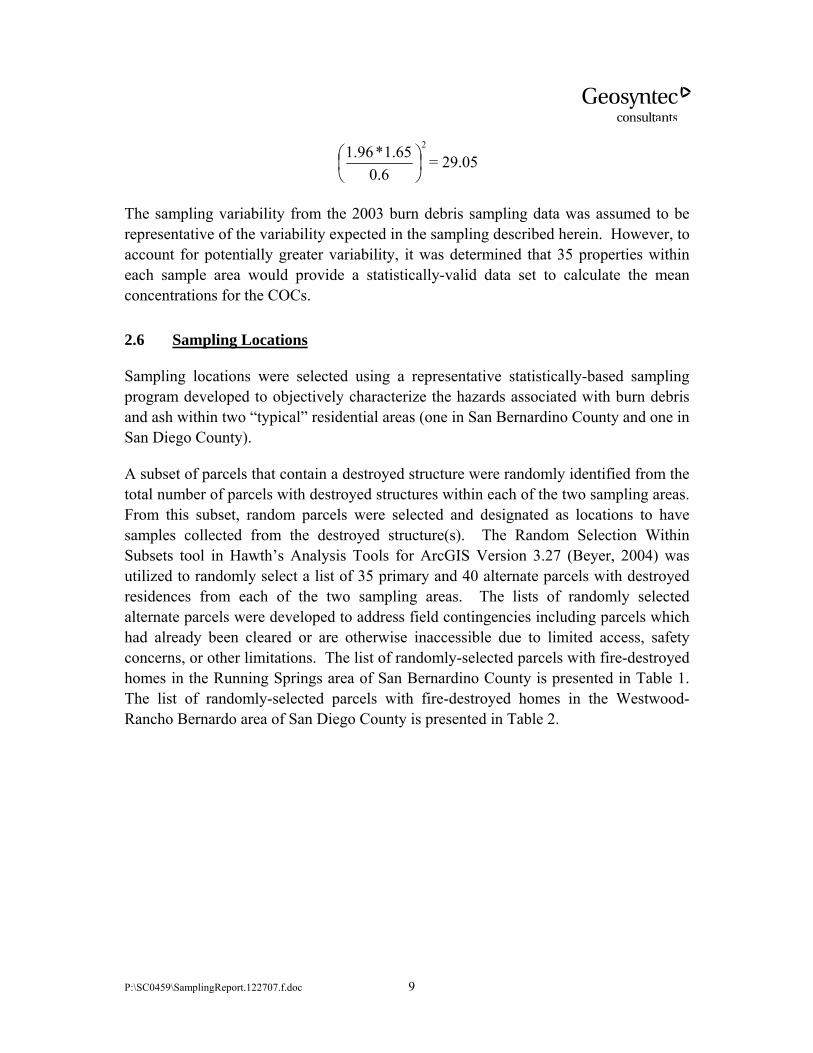
The tolerable error in the estimate is given as the margin-of-error relative to the estimated CV of the sample data. The tolerable error (p) is set at 0.6 (60 percent relative error)1. A confidence level of 95 percent was used for the purposes of the sample size derivation. This provides a reasonable certainty (95 percent or greater) that the sample mean interval contains the true mean (µ). Therefore, using the formula listed above, a median CV of 1.65, based on the observed values from the 2003 dataset, was calculated. Based on an acceptable margin of error of 0.6, the sample size required to estimate the mean concentration was approximately 29 samples as follows:
1 Tolerable error is based on professional judgment for estimating environmental parameters of this type. This tolerable error level provides a sample size that corresponds to greater than 10% of the population of affected properties sampled. It also provides enough samples for subsequent distributional tests (goodness-of-fit tests) to have reasonable power.
P:\SC0459\SamplingReport.122707.f.doc 9
2
6.065.1*96.1
⎟⎠⎞
⎜⎝⎛ = 29.05
The sampling variability from the 2003 burn debris sampling data was assumed to be representative of the variability expected in the sampling described herein. However, to account for potentially greater variability, it was determined that 35 properties within each sample area would provide a statistically-valid data set to calculate the mean concentrations for the COCs.
2.6 Sampling Locations
Sampling locations were selected using a representative statistically-based sampling program developed to objectively characterize the hazards associated with burn debris and ash within two “typical” residential areas (one in San Bernardino County and one in San Diego County).
A subset of parcels that contain a destroyed structure were randomly identified from the total number of parcels with destroyed structures within each of the two sampling areas. From this subset, random parcels were selected and designated as locations to have samples collected from the destroyed structure(s). The Random Selection Within Subsets tool in Hawth’s Analysis Tools for ArcGIS Version 3.27 (Beyer, 2004) was utilized to randomly select a list of 35 primary and 40 alternate parcels with destroyed residences from each of the two sampling areas. The lists of randomly selected alternate parcels were developed to address field contingencies including parcels which had already been cleared or are otherwise inaccessible due to limited access, safety concerns, or other limitations. The list of randomly-selected parcels with fire-destroyed homes in the Running Springs area of San Bernardino County is presented in Table 1. The list of randomly-selected parcels with fire-destroyed homes in the Westwood-Rancho Bernardo area of San Diego County is presented in Table 2.
P:\SC0459\SamplingReport.122707.f.doc 10
3. SITE ASSESSMENT FIELD ACTIVITIES
The following sections describe the sampling methodology, analytical parameters, and sample handling procedures to be followed. A project specific health and safety plan was prepared and implemented to address potential hazards which may have been encountered at the sampling sites and administrative or engineering controls for maintaining worker health and safety.
3.1 Sampling Methodology
Based on volume estimates derived during the 2007 Angora Fires (CIWMB, 2007), it was expected that burned parcels would contain 10 to 150 cubic yards of burn ash and debris resulting from burned residential structures and associated outbuildings. Geosyntec understands that visible and retrievable household hazardous wastes were removed prior to sampling, and did not influence the results of characterizing typical residential contamination following a wildfire.
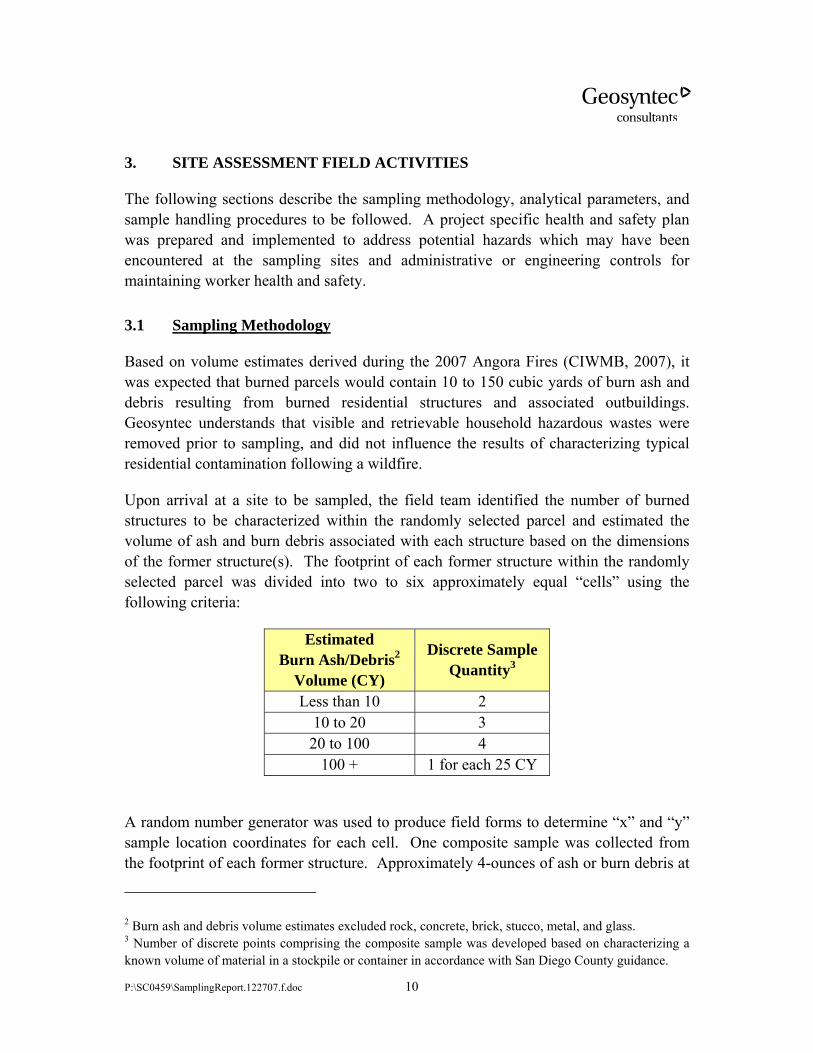
Upon arrival at a site to be sampled, the field team identified the number of burned structures to be characterized within the randomly selected parcel and estimated the volume of ash and burn debris associated with each structure based on the dimensions of the former structure(s). The footprint of each former structure within the randomly selected parcel was divided into two to six approximately equal “cells” using the following criteria:
Estimated Burn Ash/Debris2
Volume (CY)
Discrete Sample Quantity3
Less than 10 2 10 to 20 3 20 to 100 4
100 + 1 for each 25 CY
A random number generator was used to produce field forms to determine “x” and “y” sample location coordinates for each cell. One composite sample was collected from the footprint of each former structure. Approximately 4-ounces of ash or burn debris at
2 Burn ash and debris volume estimates excluded rock, concrete, brick, stucco, metal, and glass. 3 Number of discrete points comprising the composite sample was developed based on characterizing a known volume of material in a stockpile or container in accordance with San Diego County guidance.
P:\SC0459\SamplingReport.122707.f.doc 11
each random sampling location was collected from the upper 6 to 12 inches of burn debris and ash using a new single-use stainless-steel spoon and placed into a new single-use stainless-steel mixing bowl for homogenization. Homogenization consisted of manually mixing the discrete samples until the composite sample appeared thoroughly mixed. Following homogenization of the composite sample, the resulting material was placed in an 8-ounce glass jar for laboratory analysis. The sampling team took photographs of each site sampled and of the random discrete sample locations at each site. The photograph numbers were recorded on the field sampling log and are presented in Appendix B. At a minimum, one discrete sample was collected from the location of the former garage vicinity for residential structures with attached garages. Outbuildings (e.g. detached garage, shed, barn, etc.), if present within the randomly selected parcels, were sampled separately.
At site SD-46, the burn debris had been removed from the foundation of the structure and was stockpiled. A composite sample of the stockpile was collected. For stockpiles, the number of samples comprising the composite sample is summarized as follows:
• Stockpiles/bins less than 10 cubic yards: 2 samples were collected for compositing, one from each half of the stockpile/bin;
• Stockpiles/bins 10-20 cubic yards: 3 samples were collected for compositing, one from each third of the stockpile/bin; and
• Stockpiles from 20-100 cubic yards: 4 samples were collected for compositing, one from each quarter of the stockpile/bin.
For quality assurance/quality control (QA/QC), each field team collected one blind duplicate sample per day (eight duplicate samples total) to evaluate sampling and analytical precision.
3.2 Field Documentation
The following information about each sampling site was documented on field forms:
• Field crew names;
• Date of sampling;
• Site address (if known) and Assessors Parcel number (if known);
• GPS coordinates of structure sampled;
• Sketch depicting footprint of structure sampled, garage location (if known), and approximate sample locations;
• Approximate ash and burn debris volumes at the site;
P:\SC0459\SamplingReport.122707.f.doc 12
• Sample and photo identification numbers;
• Chain of custody number; and
• General observations.
3.3 Sample Handling
The following sections detail methods that were used for sample labeling, identification, containerizing, preservation, transportation, and maintaining proper chain of custody. Samples were handled in accordance with standard EPA sampling protocol.
3.3.1 Sample Labeling and Identification
Each sample was designated with a unique identification number and was labeled with the job number, sampler, date, and time of collection. The sample identification number identified the County (San Bernardino or San Diego), site number (1 through 75) and date, (i.e., SD-08-11262007 identifies that this sample was collected from San Diego County Site No. 08 on 26 November 2007).
3.3.2 Sample Containers and Transportation
Following homogenization, burn debris samples were placed in 8-ounce wide-mouth glass jars, sealed with Teflon-lined plastic lids. Sample jars were labeled, sealed in plastic bags, stored on ice, and transported under chain-of-custody procedures to the laboratory in a cooler.
3.3.3 Chain-of-Custody Procedures
A chain-of-custody form was used to record possession of the samples from the time of collection to arrival at the laboratory. The samples were released to the laboratory by signature on the chain-of-custody form. The laboratory control officer verified all samples listed on the chain-of-custody form were present; verified sample integrity; and verified that proper sample preservation procedures were utilized.
3.4 Analytical Parameters
Laboratory analyses were performed by Calscience Environmental Laboratory in Garden Grove, California, a California Department of Public Health certified laboratory. Each composite sample (74 samples total) was analyzed for Title 22 metals (TTLC) by EPA Method 6010B/7471A and PAHs by EPA Method 8310. Laboratory analytical certificates are included in Appendix C.
P:\SC0459\SamplingReport.122707.f.doc 13
QC performed by the analytical laboratory, to assess laboratory precision and accuracy, included method blanks, laboratory control spikes, and matrix spikes.
Method Blanks: A method blank is a laboratory-generated sample that assesses the degree to which laboratory operations and procedures cause false-positive analytical results for the samples. The method blank results associated with the samples are included with the analytical results (Appendix C).
Laboratory Control Spike: A Laboratory Control Spike (LCS) is a sample that is spiked with known analyte concentrations, and analyzed at approximately 10 percent of the sample load in order to establish method-specific control limits. The LCS results associated with the samples are included on the Laboratory Control Sample Report (Appendix C).
Matrix Spike Results: A matrix spike is a sample that is spiked with known analyte concentrations and analyzed at approximately 10 percent of the sample load in order to establish method-specific control limits. The matrix spike results associated with the samples are included on the Spike/Spike Duplicate Report (Appendix C).
Accuracy: Accuracy is measured by percent recovery as defined by:
% recovery = (measured concentration) x 100 (actual concentration)
3.5 Validation of Laboratory Analytical Results
Level II data packages produced by Calscience were validated by Ms. Shana McCarthy of Geosyntec. Poor recovery of PAHs in the matrix spike and matrix spike duplicate QA/QC samples was identified in each of the laboratory analytical reports. With the exception of “J” flags for PAH detections in samples SB-25A-112807, SB-28-112807, SB-28C-1128-7, SB-31-112807, SB-40-112807, SD-22-11272007, and SD-41-11272007 for PAHs, no other qualifiers were applied to the data. A copy of the data validation report is included in Appendix C.
P:\SC0459\SamplingReport.122707.f.doc 14
4. SUMMARY OF RESULTS
The following sections summarize the results and findings for the two sampling areas based on the laboratory data. Laboratory analytical results for the San Bernardino and the San Diego sites are summarized in Tables 3 and 4, respectively. Laboratory analytical certificates are presented in Appendix C.
4.1 Nature of Materials Sampled
In general, burn debris samples consisted of dry to moist, white fine ash to black coarse ash, with small fragments of metal, glass, and other debris, such as drywall. Debris larger than approximately pea-size was avoided. Samples collected from former house pads and garages were generally underlain by concrete slabs. Samples collected from sheds or debris piles were frequently underlain by soil. During sampling, attempts were made to collect burn debris rather than near-surface soils.
4.2 Established Screening Criteria
In the proceeding sections, data collected during this assessment were compared to the following established criteria:
• CalEPA California Human Health Screening Levels for residential properties (residential CHHSLs);
• United States Environmental Protection Agency (USEPA) Region IX Preliminary Remediation Goals for residential properties (residential PRGs);
• California hazardous waste classification criteria (total threshold limit concentrations (TTLC4) and soluble threshold limit concentrations (STLC5));
• Federal hazardous waste classification criteria (toxicity characteristic leaching procedure (TCLP6));
4 The TTLC refers to a test method and associated regulatory thresholds used for characterizing wastes in California for disposal purposes. Waste samples are dissolved in a nitric acid solution that is strong enough to partially dissolve bits of metal which may be present in the fire debris ash samples. The total concentrations of target metals are then determined. EPA Method 6010B/7471A, used to analyzed samples during this study, is appropriate for analyzing samples and comparing the results to TTLC values. 5 The STLC refers to a different test method (the Waste Extraction Test or “WET” test) and different regulatory thresholds. The WET test combines a unit of solid waste with ten units of a weaker acid
P:\SC0459\SamplingReport.122707.f.doc 15
• California background metals concentrations (UC Riverside, 1996); and
• USEPA Region IX Soil Screening Levels (SSLs), Dilution Attenuation Factors 1 and 20 (DAF1 – to evaluate migrations and potential threats to shallow groundwater or surface water; and DAF20 – to evaluate migration and potential threats to deeper groundwater).
A brief discussion about each constituent detected and comparisons to established hazardous waste classification criteria; residential PRGs and CHHSLs, for human health risk; and DAF1 and DAF20, for potential migration to groundwater or surface water, are provided below.
4.2.1 Human Health Screening Criteria
The CHHSLs are CalEPA developed risk-based concentrations that the CalEPA considers to be below thresholds of concern for risks to human health. The thresholds of concern used to develop the CHHSLs are an excess lifetime cancer risk of one-in-a-million (10-6) and a hazard quotient of 1.0 for noncancer health effects (CalEPA, 2005). The CHHSLs were developed using standard exposure assumptions and chemical toxicity values published by the USEPA and CalEPA. The CHHSLs can be used to screen sites for potential human health concerns where releases of hazardous chemicals to soils have occurred. Under most circumstances, the presence of a chemical in soil at concentrations below the corresponding CHHSLs can be assumed to not pose a significant health risk to people who may live (residential CHHSLs) or work (commercial/industrial CHHSLs) at the site.
PRGs are human health risk-based “cleanup” goals developed by the USEPA and are commonly used in the investigation of contaminated sites. PRGs are chemical concentrations that equal or exceed fixed levels of risk of either one-in-a-million (10-6) cancer risk or a noncarcinogenic hazard quotient of 1.0. PRGs are “guideline” generic values that are not legally enforceable, and do not take site-specific conditions into account. However, PRGs are useful as preliminary screening tools to evaluate the potential for human health risks related to constituents identified at a site. For the purposes of this study, residential PRGs developed by USEPA Region IX, were used to evaluate potential hazards to humans (USEPA, 2004).
(citric acid) than is used for TTLC purposes. The WET test is intended to simulate how a disposed material might be affected by leachate in a landfill. 6 The TCLP and its associated regulatory thresholds are, essentially, a federal law version of the STLC. A different test method (with a 20 to 1 initial dilution ratio) is used, and associated regulatory thresholds are less stringent. For the extraction, the TCLP test uses a weaker acid (acetic acid) than is used for STLC purposes.
P:\SC0459\SamplingReport.122707.f.doc 16
4.2.2 Waste Characterization Screening Criteria
The TTLC, STLC, and TCLP are commonly used in the characterization of wastes for disposal purposes. The purpose of this study was not to characterize ash as hazardous waste. However, comparing the concentration of constituents in burn debris and ash to waste characterization screening criteria provides an important benchmark. Knowing the total concentration (TTLC) value of a waste material for a specific compound, a simple computation can be performed to determine the maximum theoretical leachable concentration of that compound. The maximum theoretical leachable concentration can be computed by dividing the total concentration (TTLC) by 20 for the TCLP, or by 10 for the STLC (based on the liquid to solid ratio used in the respective extraction procedures). The maximum extractable concentration is conservative in that it assumes the extraction is 100 percent efficient. If this calculated maximum extractable concentration is below the TCLP and STLC threshold concentrations, these extraction methods need not be performed because it would not be possible to exceed the TCLP/STLC threshold concentration.
No STLC or TCLP testing was performed during this assessment, but TTLC metals concentrations obtained using EPA Method 6010B/7471A were compared to 10 times the STLC standard, or 20 times the TCLP standard. The TTLC, 10 times the STLC and 20 times the TCLP were used during this assessment to evaluate the presence in the samples of constituents identified as hazardous substances under Federal or State law, at concentrations that could be subject to regulation.
4.2.3 Other Screening Criteria
Soil screening dilution-attenuation factors (DAFs) for the protection of groundwater are similar to PRGs in that they are also generic values derived by the USEPA, and are commonly used to preliminarily assess potential threats to groundwater for constituents identified in site soil based on some general assumptions. Using a default DAF of 1 assumes that little or no dilution of contaminant concentrations occurs between the source and groundwater (e.g., a site where groundwater was shallow or underlain by a fractured rock aquifer). A DAF of 1 was also used for the purposes of assessing potential threats to surface water, where little or no attenuation of surface contaminants would occur before entering a surface water body. A DAF of 20 is also presented for comparison to account for sites where significant contaminant reduction would likely occur in the subsurface before reaching groundwater (e.g., a site where groundwater was deep, in a porous media aquifer) (USEPA, 2004).
Summaries of the number of samples exceeding the established regulatory threshold criteria listed above and the maximum and minimum detected concentrations, arithmetic mean, and geometric mean for each data set are presented in Tables 5 and 6.
P:\SC0459\SamplingReport.122707.f.doc 17
When a constituent was not detected, half of the laboratory detection limit was used to calculate the mean and geometric mean, per standard guidelines (USEPA, 1992).
4.3 Laboratory Analytical Results
4.3.1 San Bernardino County
4.3.1.1 Metals
Each sample (39 primary samples and 4 field duplicate samples from 35 sites) collected during this assessment was analyzed for California Title 22 Metals by EPA Method 6010B/7471A. Each of the Title 22 metals listed in Table 3, except thallium, were detected in at least one sample, and the “total metals” results are discussed below. The statistics and established criteria exceedances are summarized in Table 5.
Beryllium, cobalt, molybdenum, thallium, and vanadium were not detected at concentrations exceeding the previously referenced regulatory threshold criteria in samples collected from the 35 sites evaluated during this assessment.
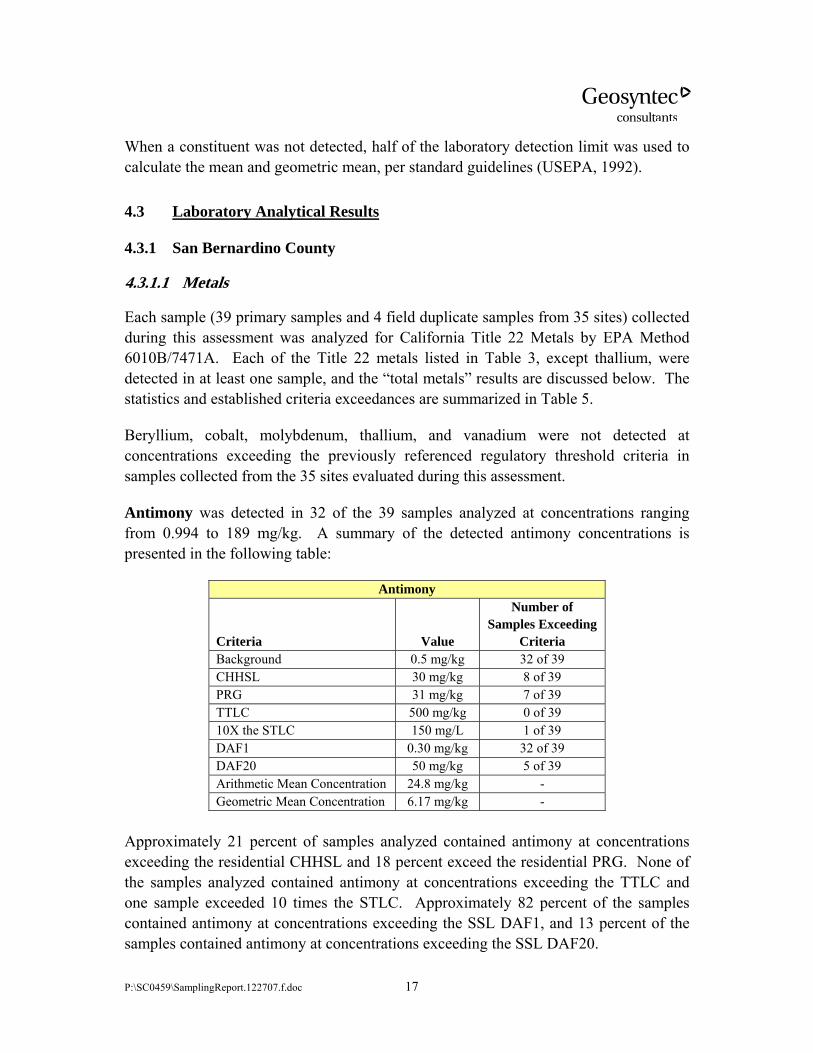
Antimony was detected in 32 of the 39 samples analyzed at concentrations ranging from 0.994 to 189 mg/kg. A summary of the detected antimony concentrations is presented in the following table:
Antimony
Criteria Value
Number of Samples Exceeding
Criteria Background 0.5 mg/kg 32 of 39 CHHSL 30 mg/kg 8 of 39 PRG 31 mg/kg 7 of 39 TTLC 500 mg/kg 0 of 39 10X the STLC 150 mg/L 1 of 39 DAF1 0.30 mg/kg 32 of 39 DAF20 50 mg/kg 5 of 39 Arithmetic Mean Concentration 24.8 mg/kg - Geometric Mean Concentration 6.17 mg/kg -
Approximately 21 percent of samples analyzed contained antimony at concentrations exceeding the residential CHHSL and 18 percent exceed the residential PRG. None of the samples analyzed contained antimony at concentrations exceeding the TTLC and one sample exceeded 10 times the STLC. Approximately 82 percent of the samples contained antimony at concentrations exceeding the SSL DAF1, and 13 percent of the samples contained antimony at concentrations exceeding the SSL DAF20.
P:\SC0459\SamplingReport.122707.f.doc 18
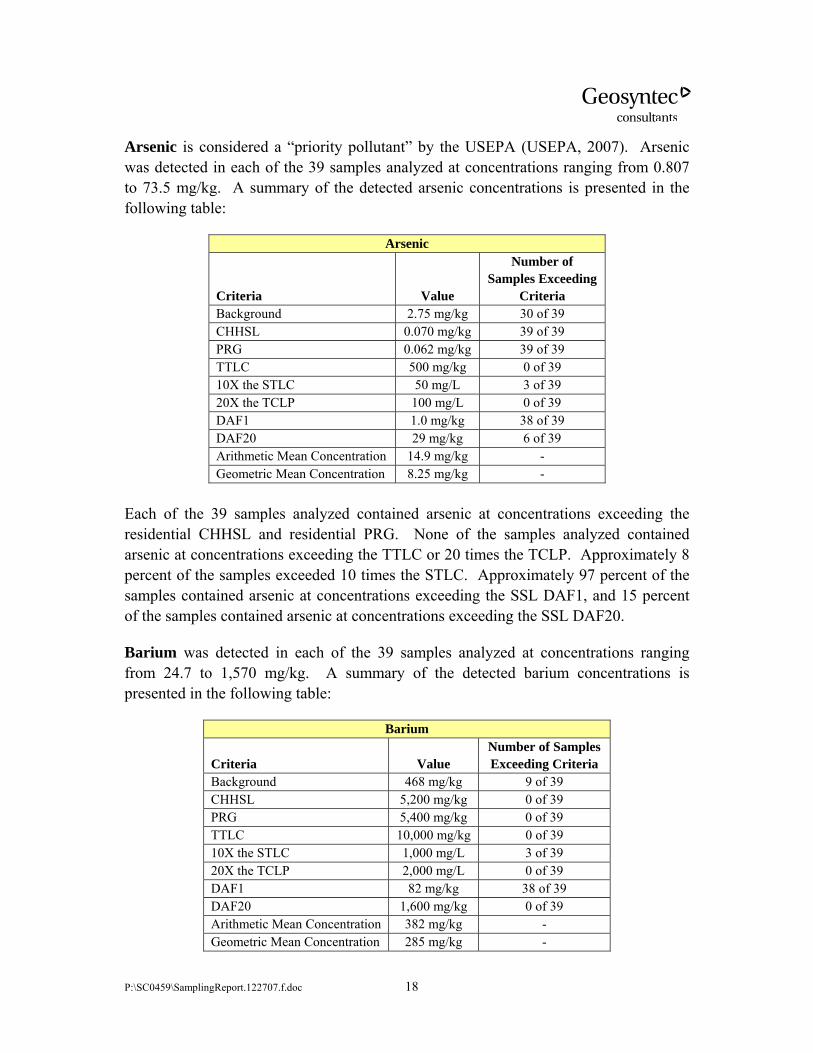
Arsenic is considered a “priority pollutant” by the USEPA (USEPA, 2007). Arsenic was detected in each of the 39 samples analyzed at concentrations ranging from 0.807 to 73.5 mg/kg. A summary of the detected arsenic concentrations is presented in the following table:
Arsenic
Criteria Value
Number of Samples Exceeding
Criteria Background 2.75 mg/kg 30 of 39 CHHSL 0.070 mg/kg 39 of 39 PRG 0.062 mg/kg 39 of 39 TTLC 500 mg/kg 0 of 39 10X the STLC 50 mg/L 3 of 39 20X the TCLP 100 mg/L 0 of 39 DAF1 1.0 mg/kg 38 of 39 DAF20 29 mg/kg 6 of 39 Arithmetic Mean Concentration 14.9 mg/kg - Geometric Mean Concentration 8.25 mg/kg -
Each of the 39 samples analyzed contained arsenic at concentrations exceeding the residential CHHSL and residential PRG. None of the samples analyzed contained arsenic at concentrations exceeding the TTLC or 20 times the TCLP. Approximately 8 percent of the samples exceeded 10 times the STLC. Approximately 97 percent of the samples contained arsenic at concentrations exceeding the SSL DAF1, and 15 percent of the samples contained arsenic at concentrations exceeding the SSL DAF20.
Barium was detected in each of the 39 samples analyzed at concentrations ranging from 24.7 to 1,570 mg/kg. A summary of the detected barium concentrations is presented in the following table:
Barium
Criteria Value Number of Samples Exceeding Criteria
Background 468 mg/kg 9 of 39 CHHSL 5,200 mg/kg 0 of 39 PRG 5,400 mg/kg 0 of 39 TTLC 10,000 mg/kg 0 of 39 10X the STLC 1,000 mg/L 3 of 39 20X the TCLP 2,000 mg/L 0 of 39 DAF1 82 mg/kg 38 of 39 DAF20 1,600 mg/kg 0 of 39 Arithmetic Mean Concentration 382 mg/kg - Geometric Mean Concentration 285 mg/kg -
P:\SC0459\SamplingReport.122707.f.doc 19
None of the samples analyzed contained barium at concentrations exceeding the residential CHHSL or PRG. None of the samples analyzed contained barium at concentrations exceeding the TTLC or 20 times the TCLP. Approximately 8 percent of the samples exceeded 10 times the STLC. Approximately 97 percent of the samples contained barium at concentrations exceeding the SSL DAF1, and none of the samples contained barium at concentrations exceeding the SSL DAF20.
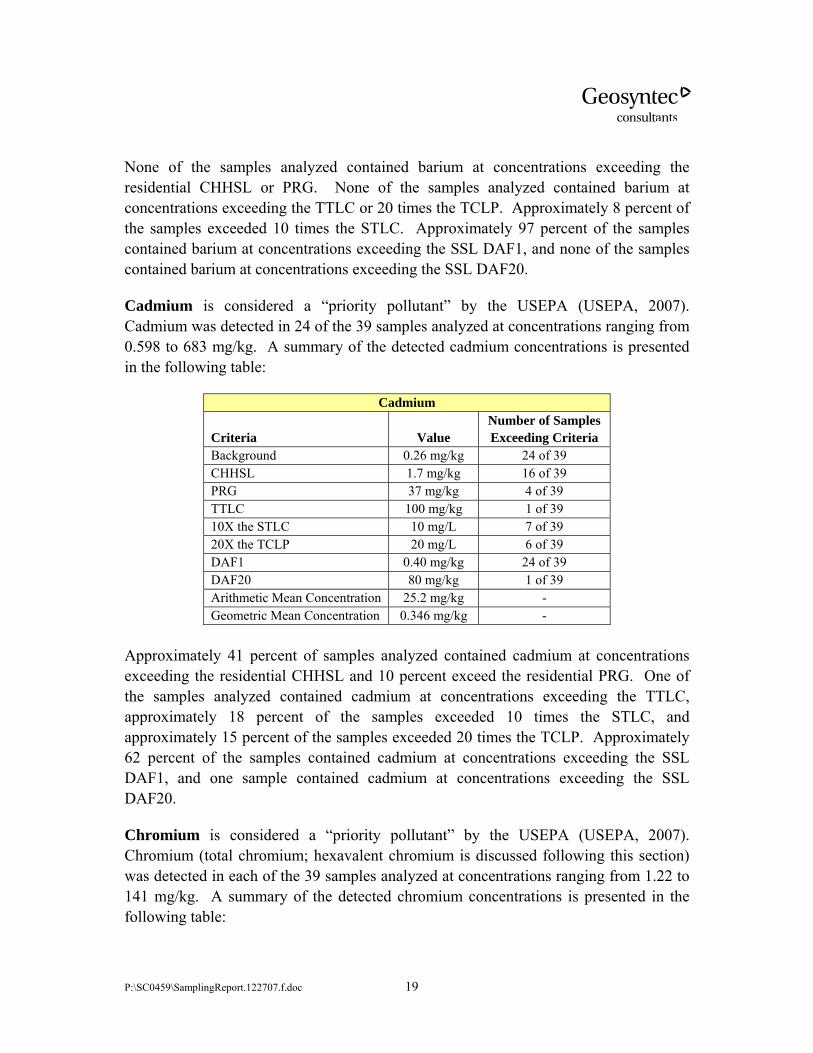
Cadmium is considered a “priority pollutant” by the USEPA (USEPA, 2007). Cadmium was detected in 24 of the 39 samples analyzed at concentrations ranging from 0.598 to 683 mg/kg. A summary of the detected cadmium concentrations is presented in the following table:
Cadmium
Criteria Value Number of Samples Exceeding Criteria
Background 0.26 mg/kg 24 of 39 CHHSL 1.7 mg/kg 16 of 39 PRG 37 mg/kg 4 of 39 TTLC 100 mg/kg 1 of 39 10X the STLC 10 mg/L 7 of 39 20X the TCLP 20 mg/L 6 of 39 DAF1 0.40 mg/kg 24 of 39 DAF20 80 mg/kg 1 of 39 Arithmetic Mean Concentration 25.2 mg/kg - Geometric Mean Concentration 0.346 mg/kg -
Approximately 41 percent of samples analyzed contained cadmium at concentrations exceeding the residential CHHSL and 10 percent exceed the residential PRG. One of the samples analyzed contained cadmium at concentrations exceeding the TTLC, approximately 18 percent of the samples exceeded 10 times the STLC, and approximately 15 percent of the samples exceeded 20 times the TCLP. Approximately 62 percent of the samples contained cadmium at concentrations exceeding the SSL DAF1, and one sample contained cadmium at concentrations exceeding the SSL DAF20.
Chromium is considered a “priority pollutant” by the USEPA (USEPA, 2007). Chromium (total chromium; hexavalent chromium is discussed following this section) was detected in each of the 39 samples analyzed at concentrations ranging from 1.22 to 141 mg/kg. A summary of the detected chromium concentrations is presented in the following table:
P:\SC0459\SamplingReport.122707.f.doc 20
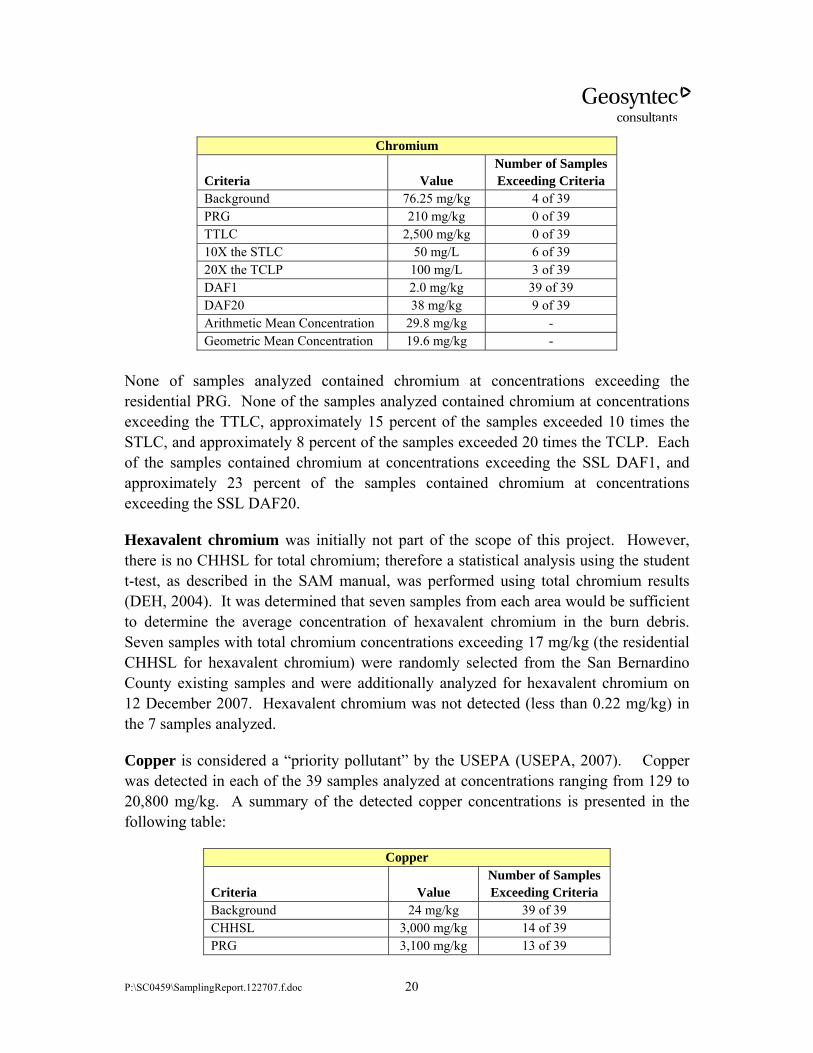
Chromium
Criteria Value Number of Samples Exceeding Criteria
Background 76.25 mg/kg 4 of 39 PRG 210 mg/kg 0 of 39 TTLC 2,500 mg/kg 0 of 39 10X the STLC 50 mg/L 6 of 39 20X the TCLP 100 mg/L 3 of 39 DAF1 2.0 mg/kg 39 of 39 DAF20 38 mg/kg 9 of 39 Arithmetic Mean Concentration 29.8 mg/kg - Geometric Mean Concentration 19.6 mg/kg -
None of samples analyzed contained chromium at concentrations exceeding the residential PRG. None of the samples analyzed contained chromium at concentrations exceeding the TTLC, approximately 15 percent of the samples exceeded 10 times the STLC, and approximately 8 percent of the samples exceeded 20 times the TCLP. Each of the samples contained chromium at concentrations exceeding the SSL DAF1, and approximately 23 percent of the samples contained chromium at concentrations exceeding the SSL DAF20.
Hexavalent chromium was initially not part of the scope of this project. However, there is no CHHSL for total chromium; therefore a statistical analysis using the student t-test, as described in the SAM manual, was performed using total chromium results (DEH, 2004). It was determined that seven samples from each area would be sufficient to determine the average concentration of hexavalent chromium in the burn debris. Seven samples with total chromium concentrations exceeding 17 mg/kg (the residential CHHSL for hexavalent chromium) were randomly selected from the San Bernardino County existing samples and were additionally analyzed for hexavalent chromium on 12 December 2007. Hexavalent chromium was not detected (less than 0.22 mg/kg) in the 7 samples analyzed.
Copper is considered a “priority pollutant” by the USEPA (USEPA, 2007). Copper was detected in each of the 39 samples analyzed at concentrations ranging from 129 to 20,800 mg/kg. A summary of the detected copper concentrations is presented in the following table:
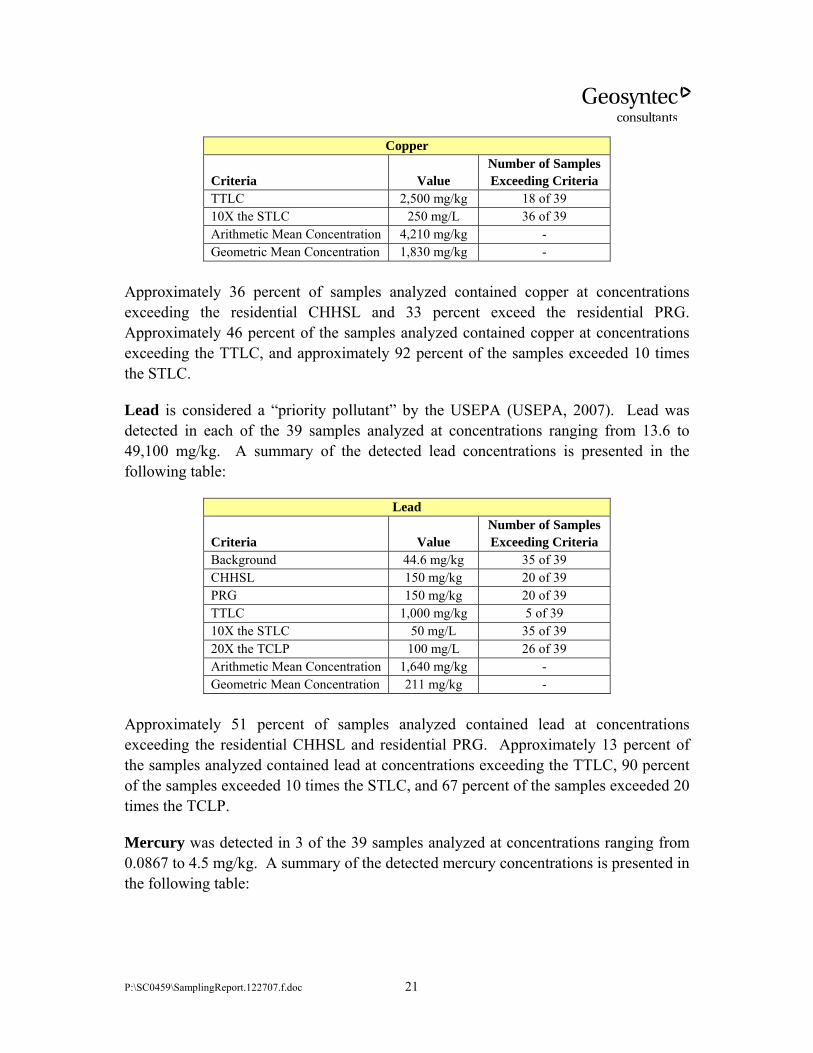
Copper
Criteria Value Number of Samples Exceeding Criteria
Background 24 mg/kg 39 of 39 CHHSL 3,000 mg/kg 14 of 39 PRG 3,100 mg/kg 13 of 39
P:\SC0459\SamplingReport.122707.f.doc 21
Copper
Criteria Value Number of Samples Exceeding Criteria
TTLC 2,500 mg/kg 18 of 39 10X the STLC 250 mg/L 36 of 39 Arithmetic Mean Concentration 4,210 mg/kg - Geometric Mean Concentration 1,830 mg/kg -
Approximately 36 percent of samples analyzed contained copper at concentrations exceeding the residential CHHSL and 33 percent exceed the residential PRG. Approximately 46 percent of the samples analyzed contained copper at concentrations exceeding the TTLC, and approximately 92 percent of the samples exceeded 10 times the STLC.
Lead is considered a “priority pollutant” by the USEPA (USEPA, 2007). Lead was detected in each of the 39 samples analyzed at concentrations ranging from 13.6 to 49,100 mg/kg. A summary of the detected lead concentrations is presented in the following table:
Lead
Criteria Value Number of Samples Exceeding Criteria
Background 44.6 mg/kg 35 of 39 CHHSL 150 mg/kg 20 of 39 PRG 150 mg/kg 20 of 39 TTLC 1,000 mg/kg 5 of 39 10X the STLC 50 mg/L 35 of 39 20X the TCLP 100 mg/L 26 of 39 Arithmetic Mean Concentration 1,640 mg/kg - Geometric Mean Concentration 211 mg/kg -
Approximately 51 percent of samples analyzed contained lead at concentrations exceeding the residential CHHSL and residential PRG. Approximately 13 percent of the samples analyzed contained lead at concentrations exceeding the TTLC, 90 percent of the samples exceeded 10 times the STLC, and 67 percent of the samples exceeded 20 times the TCLP.
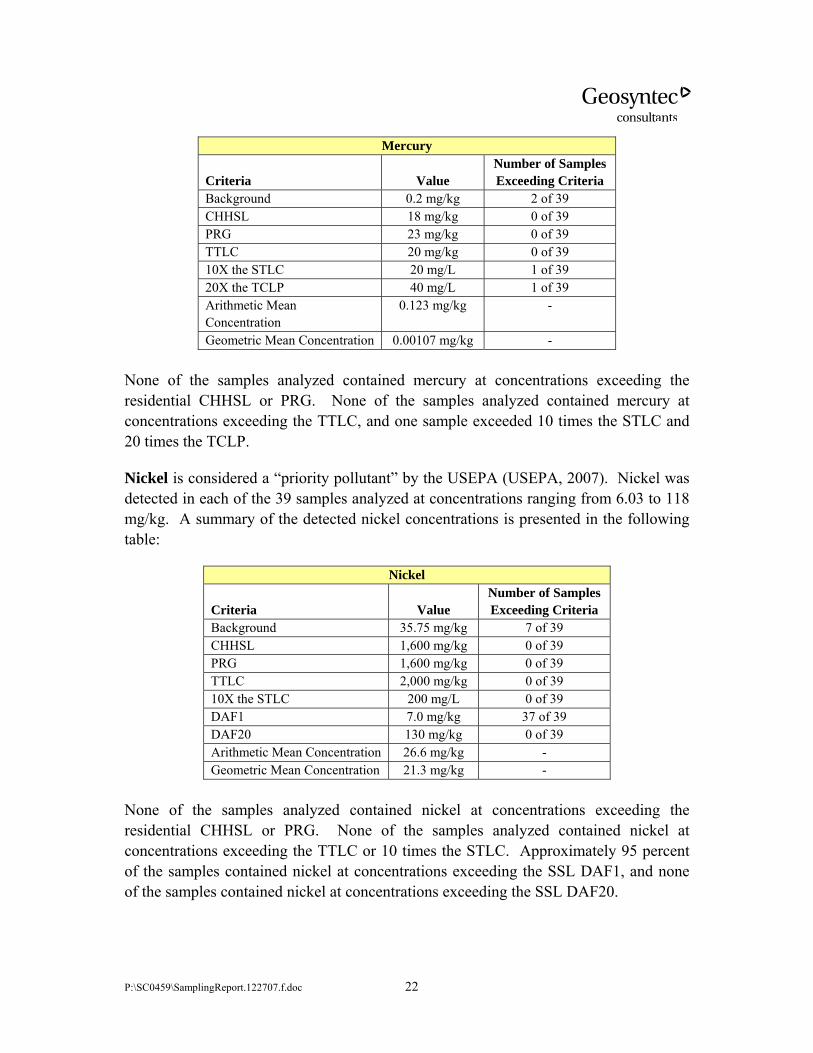
Mercury was detected in 3 of the 39 samples analyzed at concentrations ranging from 0.0867 to 4.5 mg/kg. A summary of the detected mercury concentrations is presented in the following table:
P:\SC0459\SamplingReport.122707.f.doc 22
Mercury
Criteria Value Number of Samples Exceeding Criteria
Background 0.2 mg/kg 2 of 39 CHHSL 18 mg/kg 0 of 39 PRG 23 mg/kg 0 of 39 TTLC 20 mg/kg 0 of 39 10X the STLC 20 mg/L 1 of 39 20X the TCLP 40 mg/L 1 of 39 Arithmetic Mean Concentration
0.123 mg/kg -
Geometric Mean Concentration 0.00107 mg/kg - None of the samples analyzed contained mercury at concentrations exceeding the residential CHHSL or PRG. None of the samples analyzed contained mercury at concentrations exceeding the TTLC, and one sample exceeded 10 times the STLC and 20 times the TCLP.
Nickel is considered a “priority pollutant” by the USEPA (USEPA, 2007). Nickel was detected in each of the 39 samples analyzed at concentrations ranging from 6.03 to 118 mg/kg. A summary of the detected nickel concentrations is presented in the following table:
Nickel
Criteria Value Number of Samples Exceeding Criteria
Background 35.75 mg/kg 7 of 39 CHHSL 1,600 mg/kg 0 of 39 PRG 1,600 mg/kg 0 of 39 TTLC 2,000 mg/kg 0 of 39 10X the STLC 200 mg/L 0 of 39 DAF1 7.0 mg/kg 37 of 39 DAF20 130 mg/kg 0 of 39 Arithmetic Mean Concentration 26.6 mg/kg - Geometric Mean Concentration 21.3 mg/kg -
None of the samples analyzed contained nickel at concentrations exceeding the residential CHHSL or PRG. None of the samples analyzed contained nickel at concentrations exceeding the TTLC or 10 times the STLC. Approximately 95 percent of the samples contained nickel at concentrations exceeding the SSL DAF1, and none of the samples contained nickel at concentrations exceeding the SSL DAF20.
P:\SC0459\SamplingReport.122707.f.doc 23
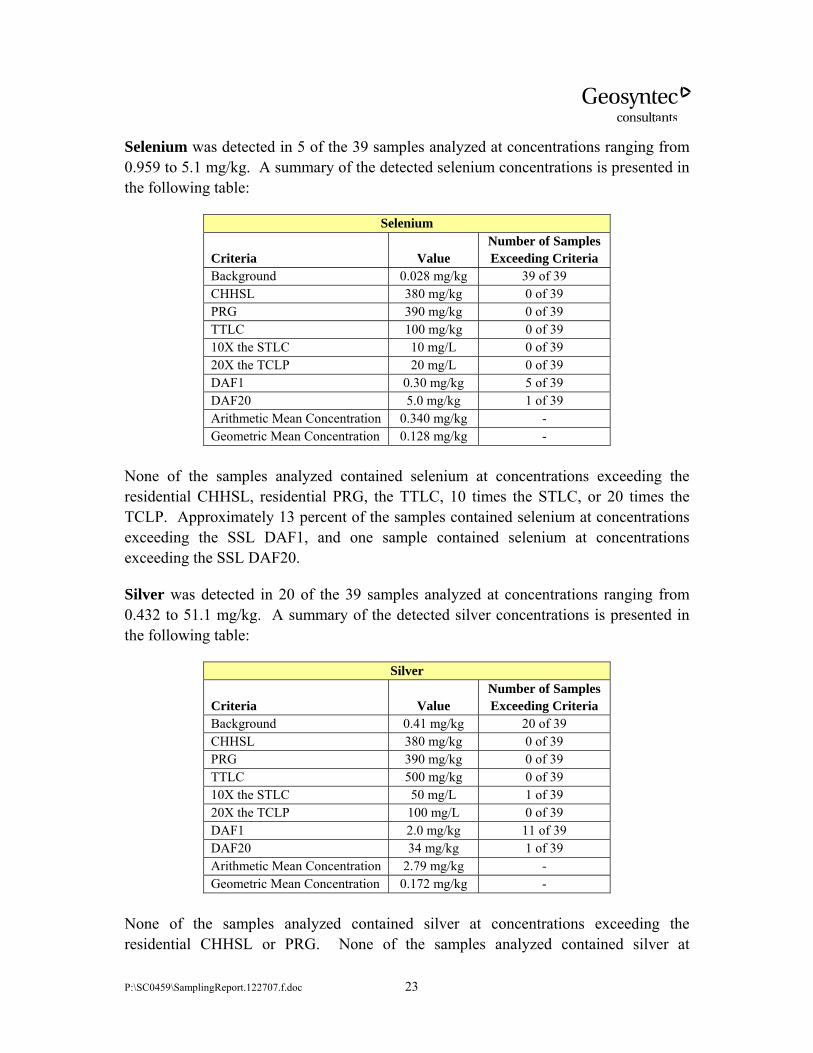
Selenium was detected in 5 of the 39 samples analyzed at concentrations ranging from 0.959 to 5.1 mg/kg. A summary of the detected selenium concentrations is presented in the following table:
Selenium
Criteria Value Number of Samples Exceeding Criteria
Background 0.028 mg/kg 39 of 39 CHHSL 380 mg/kg 0 of 39 PRG 390 mg/kg 0 of 39 TTLC 100 mg/kg 0 of 39 10X the STLC 10 mg/L 0 of 39 20X the TCLP 20 mg/L 0 of 39 DAF1 0.30 mg/kg 5 of 39 DAF20 5.0 mg/kg 1 of 39 Arithmetic Mean Concentration 0.340 mg/kg - Geometric Mean Concentration 0.128 mg/kg -
None of the samples analyzed contained selenium at concentrations exceeding the residential CHHSL, residential PRG, the TTLC, 10 times the STLC, or 20 times the TCLP. Approximately 13 percent of the samples contained selenium at concentrations exceeding the SSL DAF1, and one sample contained selenium at concentrations exceeding the SSL DAF20.
Silver was detected in 20 of the 39 samples analyzed at concentrations ranging from 0.432 to 51.1 mg/kg. A summary of the detected silver concentrations is presented in the following table:
Silver
Criteria Value Number of Samples Exceeding Criteria
Background 0.41 mg/kg 20 of 39 CHHSL 380 mg/kg 0 of 39 PRG 390 mg/kg 0 of 39 TTLC 500 mg/kg 0 of 39 10X the STLC 50 mg/L 1 of 39 20X the TCLP 100 mg/L 0 of 39 DAF1 2.0 mg/kg 11 of 39 DAF20 34 mg/kg 1 of 39 Arithmetic Mean Concentration 2.79 mg/kg - Geometric Mean Concentration 0.172 mg/kg -
None of the samples analyzed contained silver at concentrations exceeding the residential CHHSL or PRG. None of the samples analyzed contained silver at
P:\SC0459\SamplingReport.122707.f.doc 24
concentrations exceeding the TTLC or 20 times the TCLP. One sample exceeded 10 times the STLC. Approximately 28 percent of the samples contained silver at concentrations exceeding the SSL DAF1, and one sample contained silver at concentrations exceeding the SSL DAF20.
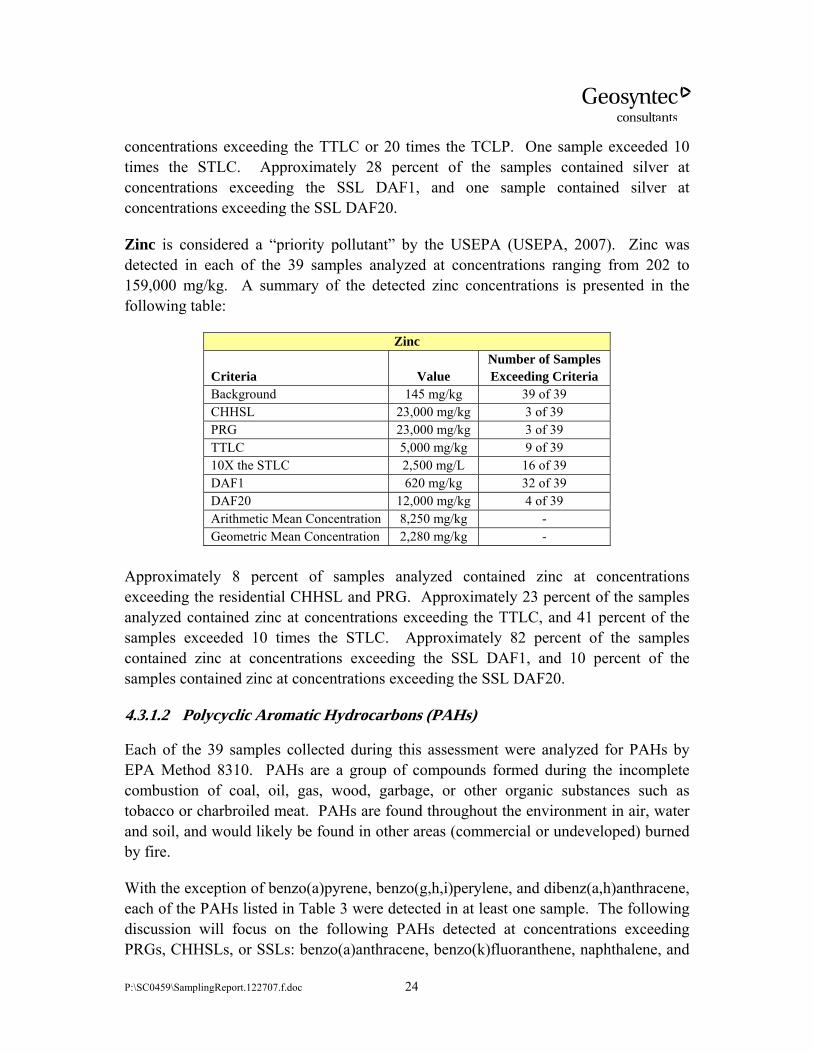
Zinc is considered a “priority pollutant” by the USEPA (USEPA, 2007). Zinc was detected in each of the 39 samples analyzed at concentrations ranging from 202 to 159,000 mg/kg. A summary of the detected zinc concentrations is presented in the following table:
Zinc
Criteria Value Number of Samples Exceeding Criteria
Background 145 mg/kg 39 of 39 CHHSL 23,000 mg/kg 3 of 39 PRG 23,000 mg/kg 3 of 39 TTLC 5,000 mg/kg 9 of 39 10X the STLC 2,500 mg/L 16 of 39 DAF1 620 mg/kg 32 of 39 DAF20 12,000 mg/kg 4 of 39 Arithmetic Mean Concentration 8,250 mg/kg - Geometric Mean Concentration 2,280 mg/kg -
Approximately 8 percent of samples analyzed contained zinc at concentrations exceeding the residential CHHSL and PRG. Approximately 23 percent of the samples analyzed contained zinc at concentrations exceeding the TTLC, and 41 percent of the samples exceeded 10 times the STLC. Approximately 82 percent of the samples contained zinc at concentrations exceeding the SSL DAF1, and 10 percent of the samples contained zinc at concentrations exceeding the SSL DAF20.
4.3.1.2 Polycyclic Aromatic Hydrocarbons (PAHs)
Each of the 39 samples collected during this assessment were analyzed for PAHs by EPA Method 8310. PAHs are a group of compounds formed during the incomplete combustion of coal, oil, gas, wood, garbage, or other organic substances such as tobacco or charbroiled meat. PAHs are found throughout the environment in air, water and soil, and would likely be found in other areas (commercial or undeveloped) burned by fire.
With the exception of benzo(a)pyrene, benzo(g,h,i)perylene, and dibenz(a,h)anthracene, each of the PAHs listed in Table 3 were detected in at least one sample. The following discussion will focus on the following PAHs detected at concentrations exceeding PRGs, CHHSLs, or SSLs: benzo(a)anthracene, benzo(k)fluoranthene, naphthalene, and
P:\SC0459\SamplingReport.122707.f.doc 25
total benzo(a)pyrene equivalency. According to the Department of Human Health Services, and the International Agency for Research on Cancer, the PAHs detected (except for naphthalene) are possible to probable human carcinogens. A summary of the samples exceeding the above criteria is presented in Table 5.
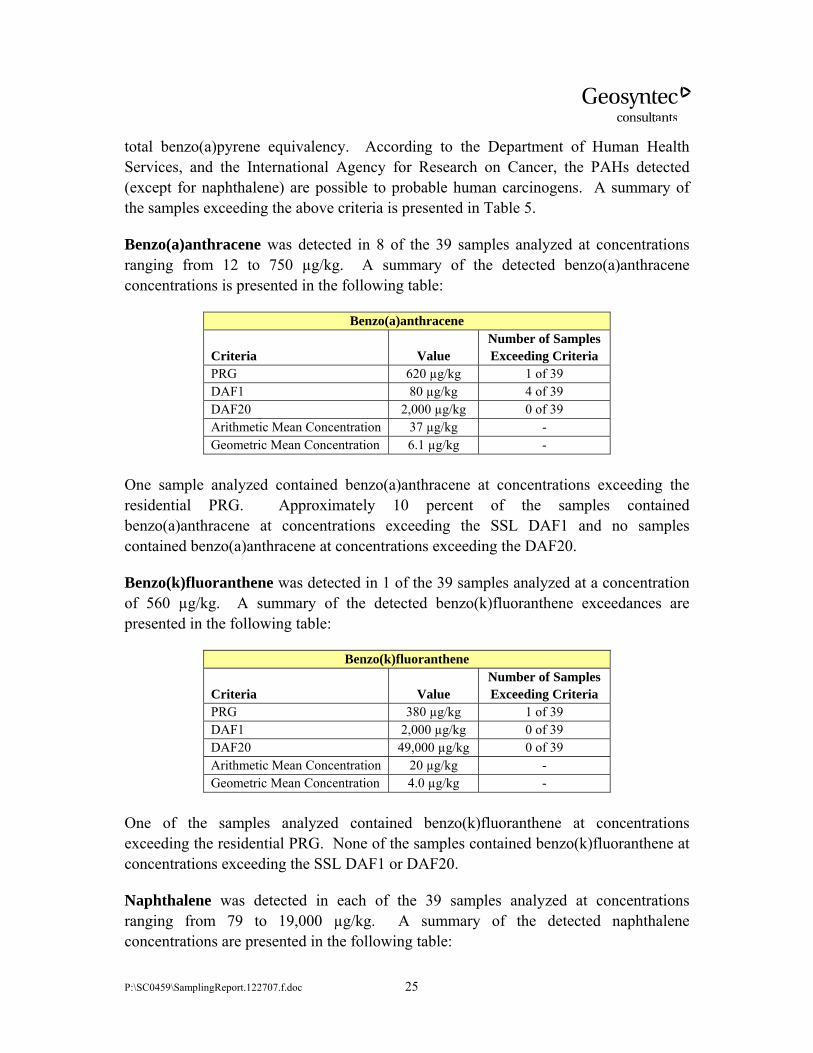
Benzo(a)anthracene was detected in 8 of the 39 samples analyzed at concentrations ranging from 12 to 750 µg/kg. A summary of the detected benzo(a)anthracene concentrations is presented in the following table:
Benzo(a)anthracene
Criteria Value Number of Samples Exceeding Criteria
PRG 620 µg/kg 1 of 39 DAF1 80 µg/kg 4 of 39 DAF20 2,000 µg/kg 0 of 39 Arithmetic Mean Concentration 37 µg/kg - Geometric Mean Concentration 6.1 µg/kg -
One sample analyzed contained benzo(a)anthracene at concentrations exceeding the residential PRG. Approximately 10 percent of the samples contained benzo(a)anthracene at concentrations exceeding the SSL DAF1 and no samples contained benzo(a)anthracene at concentrations exceeding the DAF20.
Benzo(k)fluoranthene was detected in 1 of the 39 samples analyzed at a concentration of 560 µg/kg. A summary of the detected benzo(k)fluoranthene exceedances are presented in the following table:
Benzo(k)fluoranthene
Criteria Value Number of Samples Exceeding Criteria
PRG 380 µg/kg 1 of 39 DAF1 2,000 µg/kg 0 of 39 DAF20 49,000 µg/kg 0 of 39 Arithmetic Mean Concentration 20 µg/kg - Geometric Mean Concentration 4.0 µg/kg -
One of the samples analyzed contained benzo(k)fluoranthene at concentrations exceeding the residential PRG. None of the samples contained benzo(k)fluoranthene at concentrations exceeding the SSL DAF1 or DAF20.
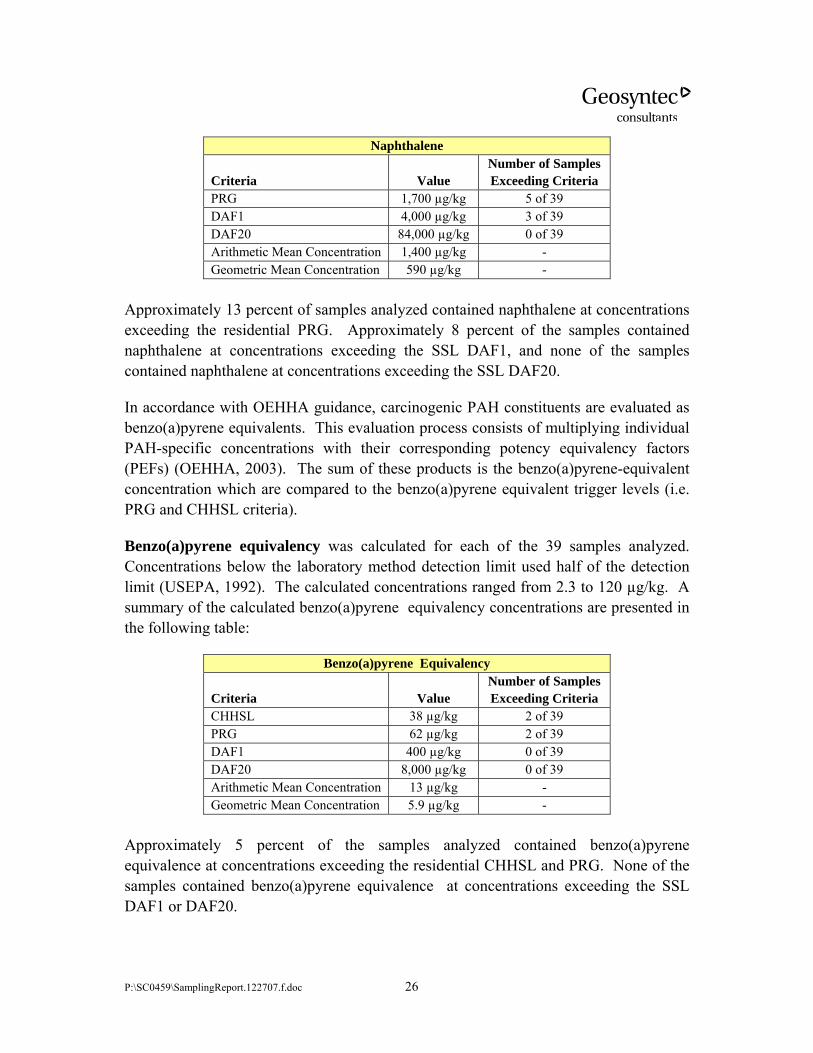
Naphthalene was detected in each of the 39 samples analyzed at concentrations ranging from 79 to 19,000 µg/kg. A summary of the detected naphthalene concentrations are presented in the following table:
P:\SC0459\SamplingReport.122707.f.doc 26
Naphthalene
Criteria Value Number of Samples Exceeding Criteria
PRG 1,700 µg/kg 5 of 39 DAF1 4,000 µg/kg 3 of 39 DAF20 84,000 µg/kg 0 of 39 Arithmetic Mean Concentration 1,400 µg/kg - Geometric Mean Concentration 590 µg/kg -
Approximately 13 percent of samples analyzed contained naphthalene at concentrations exceeding the residential PRG. Approximately 8 percent of the samples contained naphthalene at concentrations exceeding the SSL DAF1, and none of the samples contained naphthalene at concentrations exceeding the SSL DAF20.
In accordance with OEHHA guidance, carcinogenic PAH constituents are evaluated as benzo(a)pyrene equivalents. This evaluation process consists of multiplying individual PAH-specific concentrations with their corresponding potency equivalency factors (PEFs) (OEHHA, 2003). The sum of these products is the benzo(a)pyrene-equivalent concentration which are compared to the benzo(a)pyrene equivalent trigger levels (i.e. PRG and CHHSL criteria).
Benzo(a)pyrene equivalency was calculated for each of the 39 samples analyzed. Concentrations below the laboratory method detection limit used half of the detection limit (USEPA, 1992). The calculated concentrations ranged from 2.3 to 120 µg/kg. A summary of the calculated benzo(a)pyrene equivalency concentrations are presented in the following table:
Benzo(a)pyrene Equivalency
Criteria Value Number of Samples Exceeding Criteria
CHHSL 38 µg/kg 2 of 39 PRG 62 µg/kg 2 of 39 DAF1 400 µg/kg 0 of 39 DAF20 8,000 µg/kg 0 of 39 Arithmetic Mean Concentration 13 µg/kg - Geometric Mean Concentration 5.9 µg/kg -
Approximately 5 percent of the samples analyzed contained benzo(a)pyrene equivalence at concentrations exceeding the residential CHHSL and PRG. None of the samples contained benzo(a)pyrene equivalence at concentrations exceeding the SSL DAF1 or DAF20.
P:\SC0459\SamplingReport.122707.f.doc 27
4.3.2 San Diego County
4.3.2.1 Metals
Each sample (35 primary samples and 4 field duplicate samples from 35 sites) collected during this assessment was analyzed for California Title 22 Metals by EPA Method 6010B/7471A. Each of the Title 22 metals listed in Table 4, except selenium and thallium, were detected in at least one sample, and the “total metals” results are discussed below. The statistics and established criteria exceedances are summarized in Table 6.
Beryllium, cobalt, mercury, molybdenum, selenium, and thallium were not detected at concentrations exceeding the previously referenced regulatory threshold criteria in samples collected at the 35 sites evaluated during this assessment.
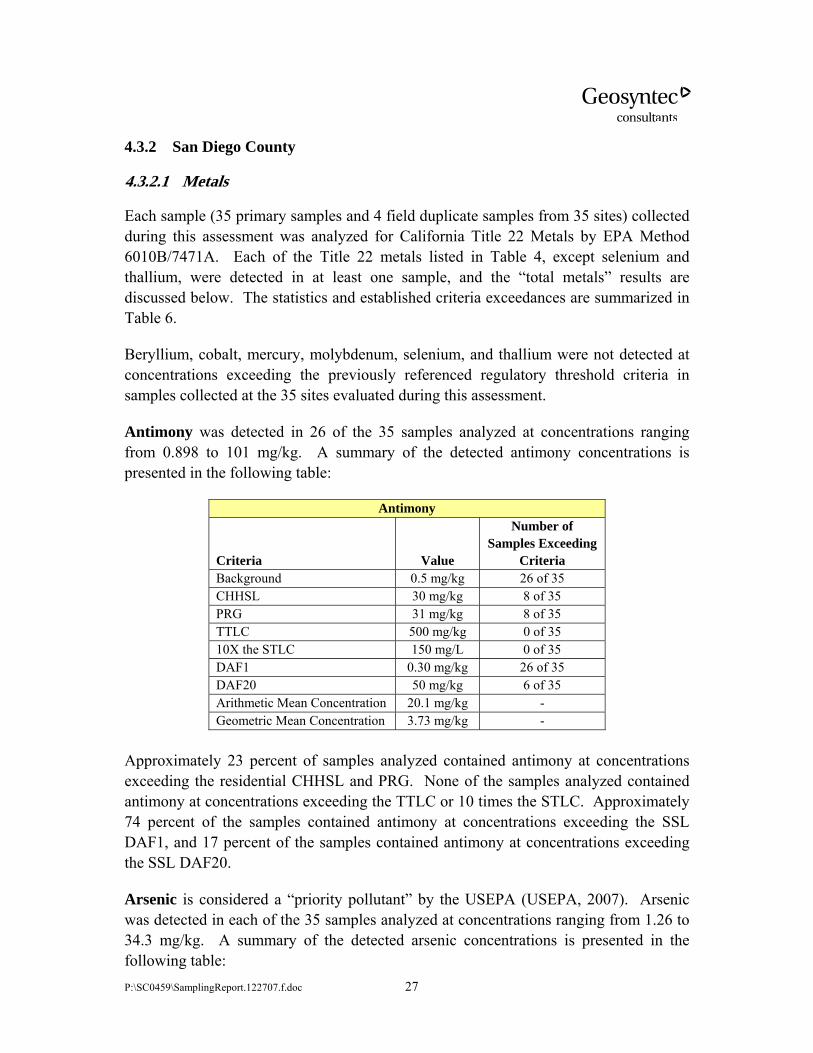
Antimony was detected in 26 of the 35 samples analyzed at concentrations ranging from 0.898 to 101 mg/kg. A summary of the detected antimony concentrations is presented in the following table:
Antimony
Criteria Value
Number of Samples Exceeding
Criteria Background 0.5 mg/kg 26 of 35 CHHSL 30 mg/kg 8 of 35 PRG 31 mg/kg 8 of 35 TTLC 500 mg/kg 0 of 35 10X the STLC 150 mg/L 0 of 35 DAF1 0.30 mg/kg 26 of 35 DAF20 50 mg/kg 6 of 35 Arithmetic Mean Concentration 20.1 mg/kg - Geometric Mean Concentration 3.73 mg/kg -
Approximately 23 percent of samples analyzed contained antimony at concentrations exceeding the residential CHHSL and PRG. None of the samples analyzed contained antimony at concentrations exceeding the TTLC or 10 times the STLC. Approximately 74 percent of the samples contained antimony at concentrations exceeding the SSL DAF1, and 17 percent of the samples contained antimony at concentrations exceeding the SSL DAF20.
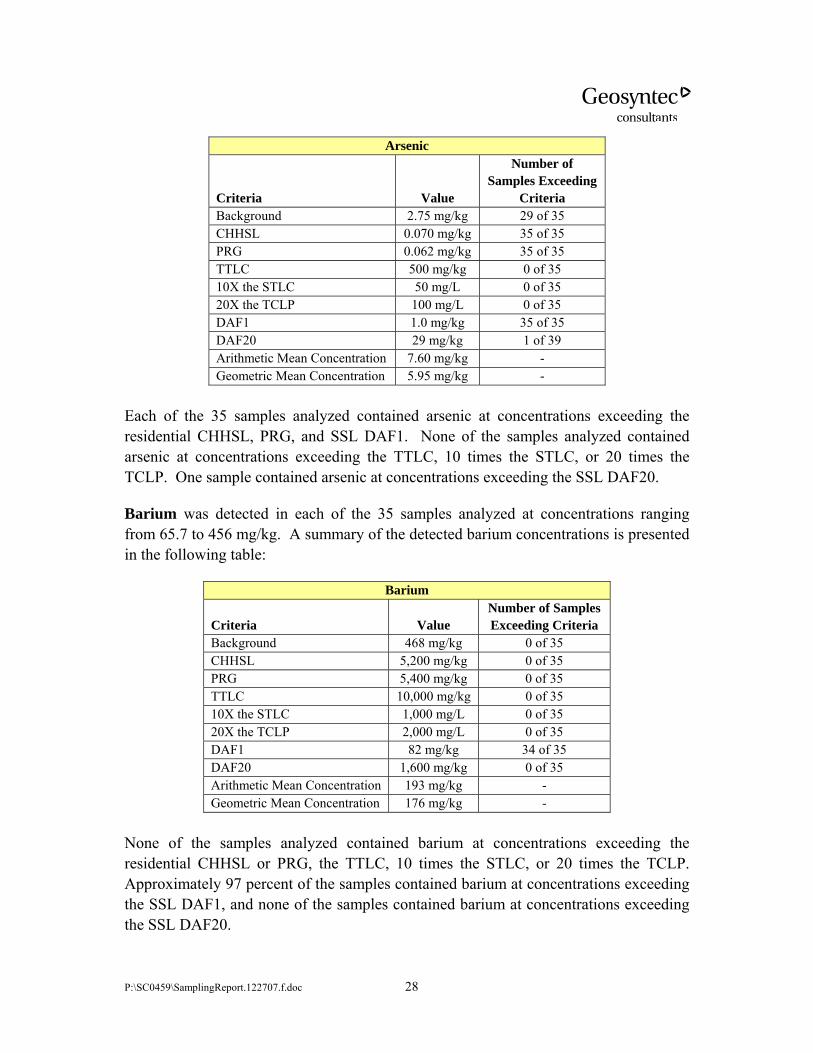
Arsenic is considered a “priority pollutant” by the USEPA (USEPA, 2007). Arsenic was detected in each of the 35 samples analyzed at concentrations ranging from 1.26 to 34.3 mg/kg. A summary of the detected arsenic concentrations is presented in the following table:
P:\SC0459\SamplingReport.122707.f.doc 28
Arsenic
Criteria Value
Number of Samples Exceeding
Criteria Background 2.75 mg/kg 29 of 35 CHHSL 0.070 mg/kg 35 of 35 PRG 0.062 mg/kg 35 of 35 TTLC 500 mg/kg 0 of 35 10X the STLC 50 mg/L 0 of 35 20X the TCLP 100 mg/L 0 of 35 DAF1 1.0 mg/kg 35 of 35 DAF20 29 mg/kg 1 of 39 Arithmetic Mean Concentration 7.60 mg/kg - Geometric Mean Concentration 5.95 mg/kg -
Each of the 35 samples analyzed contained arsenic at concentrations exceeding the residential CHHSL, PRG, and SSL DAF1. None of the samples analyzed contained arsenic at concentrations exceeding the TTLC, 10 times the STLC, or 20 times the TCLP. One sample contained arsenic at concentrations exceeding the SSL DAF20.
Barium was detected in each of the 35 samples analyzed at concentrations ranging from 65.7 to 456 mg/kg. A summary of the detected barium concentrations is presented in the following table:
Barium
Criteria Value Number of Samples Exceeding Criteria
Background 468 mg/kg 0 of 35 CHHSL 5,200 mg/kg 0 of 35 PRG 5,400 mg/kg 0 of 35 TTLC 10,000 mg/kg 0 of 35 10X the STLC 1,000 mg/L 0 of 35 20X the TCLP 2,000 mg/L 0 of 35 DAF1 82 mg/kg 34 of 35 DAF20 1,600 mg/kg 0 of 35 Arithmetic Mean Concentration 193 mg/kg - Geometric Mean Concentration 176 mg/kg -
None of the samples analyzed contained barium at concentrations exceeding the residential CHHSL or PRG, the TTLC, 10 times the STLC, or 20 times the TCLP. Approximately 97 percent of the samples contained barium at concentrations exceeding the SSL DAF1, and none of the samples contained barium at concentrations exceeding the SSL DAF20.
P:\SC0459\SamplingReport.122707.f.doc 29
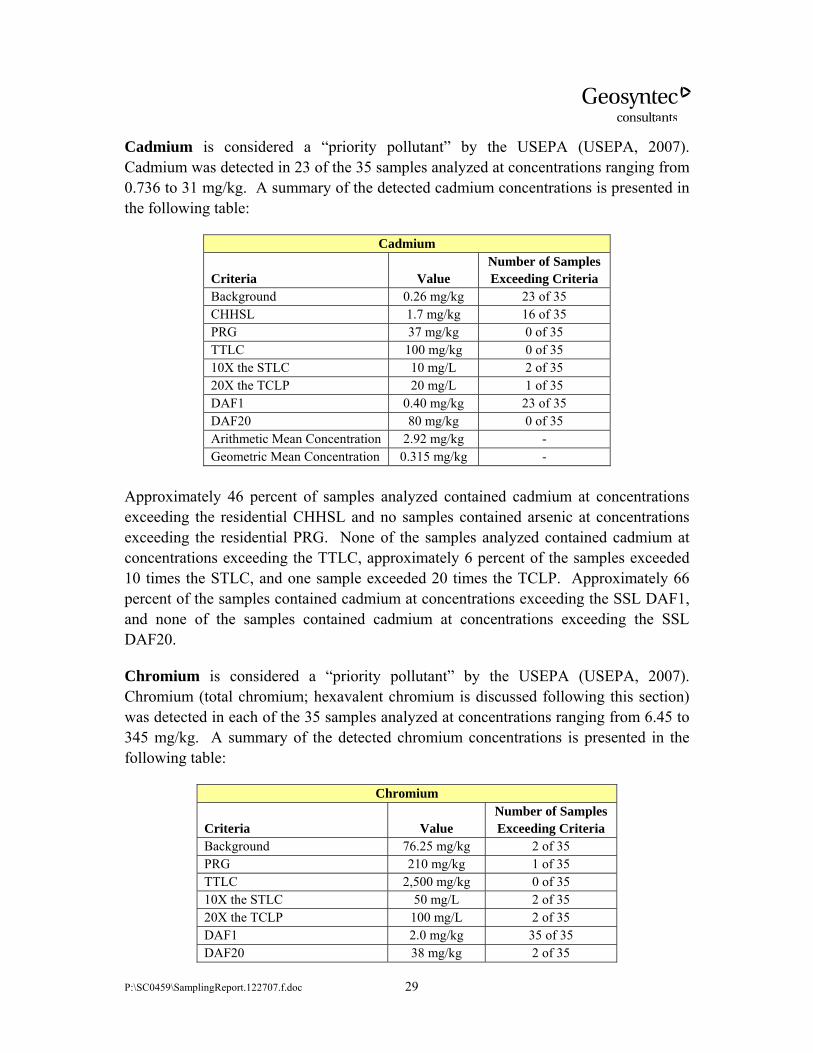
Cadmium is considered a “priority pollutant” by the USEPA (USEPA, 2007). Cadmium was detected in 23 of the 35 samples analyzed at concentrations ranging from 0.736 to 31 mg/kg. A summary of the detected cadmium concentrations is presented in the following table:
Cadmium
Criteria Value Number of Samples Exceeding Criteria
Background 0.26 mg/kg 23 of 35 CHHSL 1.7 mg/kg 16 of 35 PRG 37 mg/kg 0 of 35 TTLC 100 mg/kg 0 of 35 10X the STLC 10 mg/L 2 of 35 20X the TCLP 20 mg/L 1 of 35 DAF1 0.40 mg/kg 23 of 35 DAF20 80 mg/kg 0 of 35 Arithmetic Mean Concentration 2.92 mg/kg - Geometric Mean Concentration 0.315 mg/kg -
Approximately 46 percent of samples analyzed contained cadmium at concentrations exceeding the residential CHHSL and no samples contained arsenic at concentrations exceeding the residential PRG. None of the samples analyzed contained cadmium at concentrations exceeding the TTLC, approximately 6 percent of the samples exceeded 10 times the STLC, and one sample exceeded 20 times the TCLP. Approximately 66 percent of the samples contained cadmium at concentrations exceeding the SSL DAF1, and none of the samples contained cadmium at concentrations exceeding the SSL DAF20.
Chromium is considered a “priority pollutant” by the USEPA (USEPA, 2007). Chromium (total chromium; hexavalent chromium is discussed following this section) was detected in each of the 35 samples analyzed at concentrations ranging from 6.45 to 345 mg/kg. A summary of the detected chromium concentrations is presented in the following table:
Chromium
Criteria Value Number of Samples Exceeding Criteria
Background 76.25 mg/kg 2 of 35 PRG 210 mg/kg 1 of 35 TTLC 2,500 mg/kg 0 of 35 10X the STLC 50 mg/L 2 of 35 20X the TCLP 100 mg/L 2 of 35 DAF1 2.0 mg/kg 35 of 35 DAF20 38 mg/kg 2 of 35
P:\SC0459\SamplingReport.122707.f.doc 30
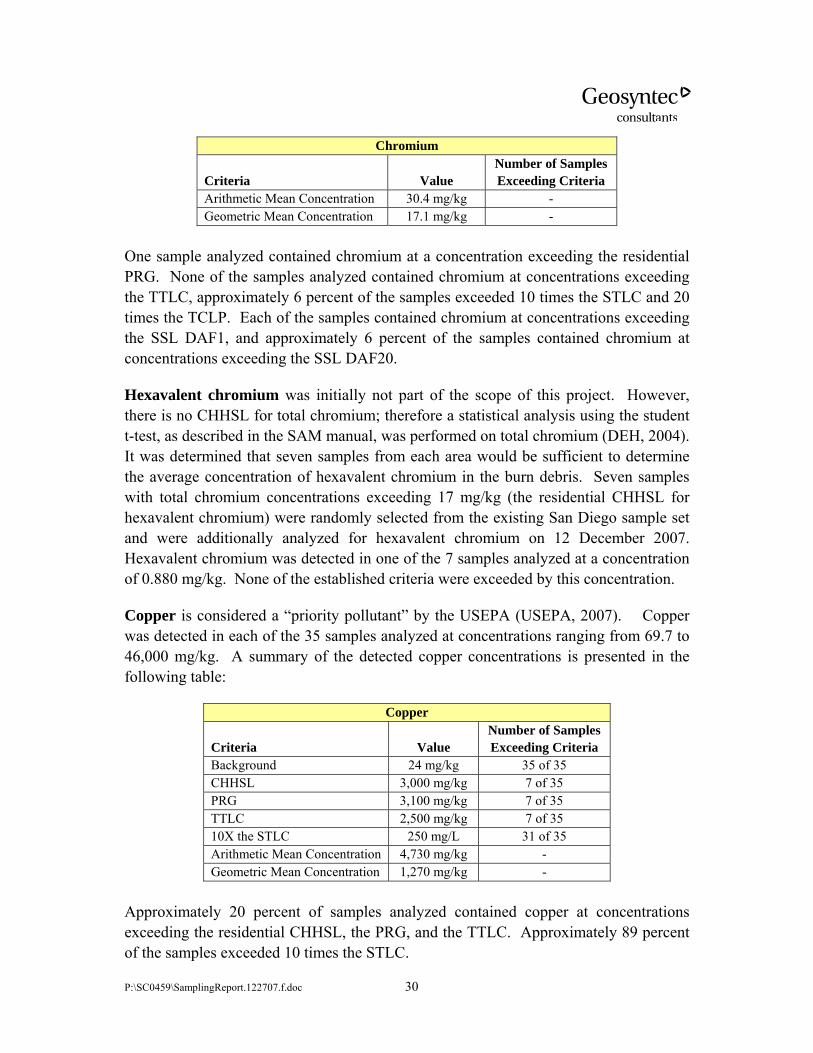
Chromium
Criteria Value Number of Samples Exceeding Criteria
Arithmetic Mean Concentration 30.4 mg/kg - Geometric Mean Concentration 17.1 mg/kg -
One sample analyzed contained chromium at a concentration exceeding the residential PRG. None of the samples analyzed contained chromium at concentrations exceeding the TTLC, approximately 6 percent of the samples exceeded 10 times the STLC and 20 times the TCLP. Each of the samples contained chromium at concentrations exceeding the SSL DAF1, and approximately 6 percent of the samples contained chromium at concentrations exceeding the SSL DAF20.
Hexavalent chromium was initially not part of the scope of this project. However, there is no CHHSL for total chromium; therefore a statistical analysis using the student t-test, as described in the SAM manual, was performed on total chromium (DEH, 2004). It was determined that seven samples from each area would be sufficient to determine the average concentration of hexavalent chromium in the burn debris. Seven samples with total chromium concentrations exceeding 17 mg/kg (the residential CHHSL for hexavalent chromium) were randomly selected from the existing San Diego sample set and were additionally analyzed for hexavalent chromium on 12 December 2007. Hexavalent chromium was detected in one of the 7 samples analyzed at a concentration of 0.880 mg/kg. None of the established criteria were exceeded by this concentration.
Copper is considered a “priority pollutant” by the USEPA (USEPA, 2007). Copper was detected in each of the 35 samples analyzed at concentrations ranging from 69.7 to 46,000 mg/kg. A summary of the detected copper concentrations is presented in the following table:
Copper
Criteria Value Number of Samples Exceeding Criteria
Background 24 mg/kg 35 of 35 CHHSL 3,000 mg/kg 7 of 35 PRG 3,100 mg/kg 7 of 35 TTLC 2,500 mg/kg 7 of 35 10X the STLC 250 mg/L 31 of 35 Arithmetic Mean Concentration 4,730 mg/kg - Geometric Mean Concentration 1,270 mg/kg -
Approximately 20 percent of samples analyzed contained copper at concentrations exceeding the residential CHHSL, the PRG, and the TTLC. Approximately 89 percent of the samples exceeded 10 times the STLC.
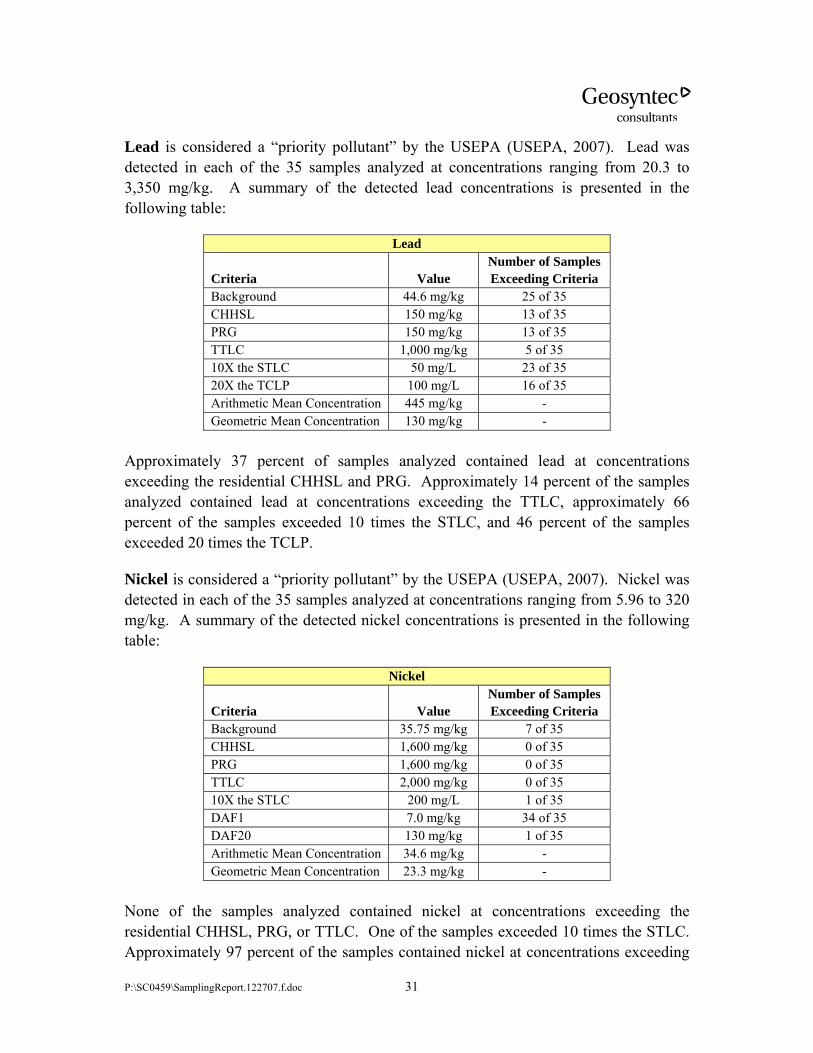
P:\SC0459\SamplingReport.122707.f.doc 31
Lead is considered a “priority pollutant” by the USEPA (USEPA, 2007). Lead was detected in each of the 35 samples analyzed at concentrations ranging from 20.3 to 3,350 mg/kg. A summary of the detected lead concentrations is presented in the following table:
Lead
Criteria Value Number of Samples Exceeding Criteria
Background 44.6 mg/kg 25 of 35 CHHSL 150 mg/kg 13 of 35 PRG 150 mg/kg 13 of 35 TTLC 1,000 mg/kg 5 of 35 10X the STLC 50 mg/L 23 of 35 20X the TCLP 100 mg/L 16 of 35 Arithmetic Mean Concentration 445 mg/kg - Geometric Mean Concentration 130 mg/kg -
Approximately 37 percent of samples analyzed contained lead at concentrations exceeding the residential CHHSL and PRG. Approximately 14 percent of the samples analyzed contained lead at concentrations exceeding the TTLC, approximately 66 percent of the samples exceeded 10 times the STLC, and 46 percent of the samples exceeded 20 times the TCLP.
Nickel is considered a “priority pollutant” by the USEPA (USEPA, 2007). Nickel was detected in each of the 35 samples analyzed at concentrations ranging from 5.96 to 320 mg/kg. A summary of the detected nickel concentrations is presented in the following table:
Nickel
Criteria Value Number of Samples Exceeding Criteria
Background 35.75 mg/kg 7 of 35 CHHSL 1,600 mg/kg 0 of 35 PRG 1,600 mg/kg 0 of 35 TTLC 2,000 mg/kg 0 of 35 10X the STLC 200 mg/L 1 of 35 DAF1 7.0 mg/kg 34 of 35 DAF20 130 mg/kg 1 of 35 Arithmetic Mean Concentration 34.6 mg/kg - Geometric Mean Concentration 23.3 mg/kg -
None of the samples analyzed contained nickel at concentrations exceeding the residential CHHSL, PRG, or TTLC. One of the samples exceeded 10 times the STLC. Approximately 97 percent of the samples contained nickel at concentrations exceeding
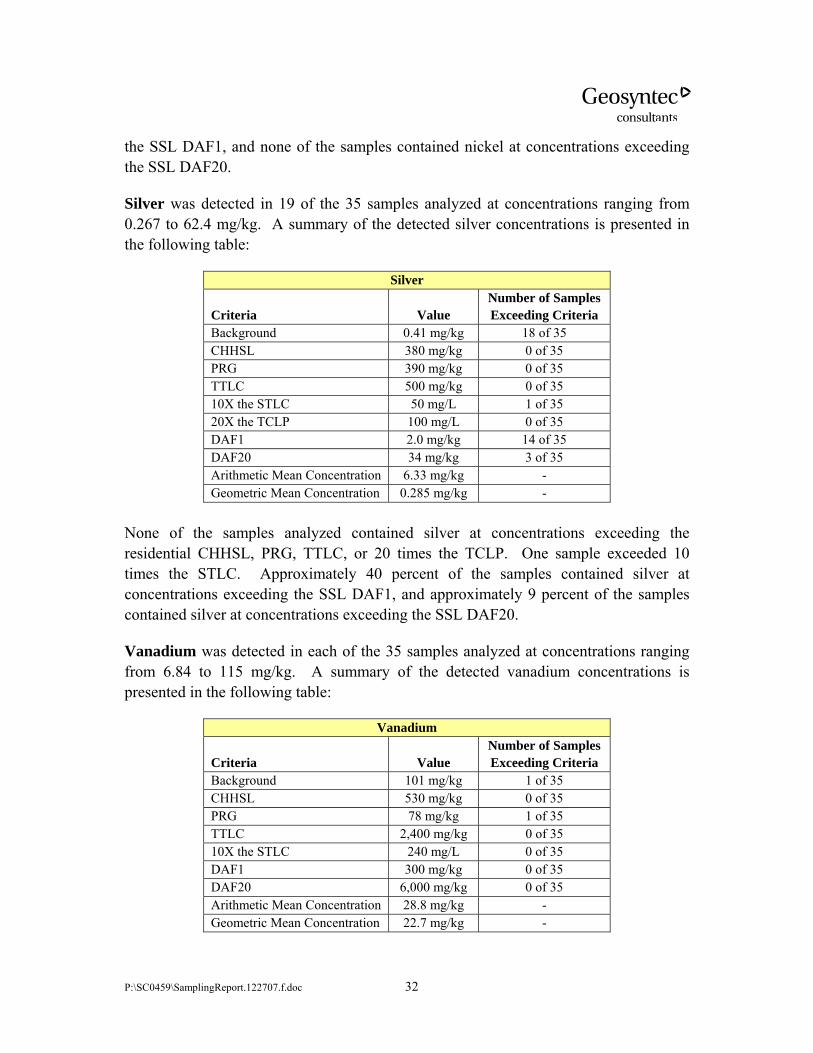
P:\SC0459\SamplingReport.122707.f.doc 32
the SSL DAF1, and none of the samples contained nickel at concentrations exceeding the SSL DAF20.
Silver was detected in 19 of the 35 samples analyzed at concentrations ranging from 0.267 to 62.4 mg/kg. A summary of the detected silver concentrations is presented in the following table:
Silver
Criteria Value Number of Samples Exceeding Criteria
Background 0.41 mg/kg 18 of 35 CHHSL 380 mg/kg 0 of 35 PRG 390 mg/kg 0 of 35 TTLC 500 mg/kg 0 of 35 10X the STLC 50 mg/L 1 of 35 20X the TCLP 100 mg/L 0 of 35 DAF1 2.0 mg/kg 14 of 35 DAF20 34 mg/kg 3 of 35 Arithmetic Mean Concentration 6.33 mg/kg - Geometric Mean Concentration 0.285 mg/kg -
None of the samples analyzed contained silver at concentrations exceeding the residential CHHSL, PRG, TTLC, or 20 times the TCLP. One sample exceeded 10 times the STLC. Approximately 40 percent of the samples contained silver at concentrations exceeding the SSL DAF1, and approximately 9 percent of the samples contained silver at concentrations exceeding the SSL DAF20.
Vanadium was detected in each of the 35 samples analyzed at concentrations ranging from 6.84 to 115 mg/kg. A summary of the detected vanadium concentrations is presented in the following table:
Vanadium
Criteria Value Number of Samples Exceeding Criteria
Background 101 mg/kg 1 of 35 CHHSL 530 mg/kg 0 of 35 PRG 78 mg/kg 1 of 35 TTLC 2,400 mg/kg 0 of 35 10X the STLC 240 mg/L 0 of 35 DAF1 300 mg/kg 0 of 35 DAF20 6,000 mg/kg 0 of 35 Arithmetic Mean Concentration 28.8 mg/kg - Geometric Mean Concentration 22.7 mg/kg -
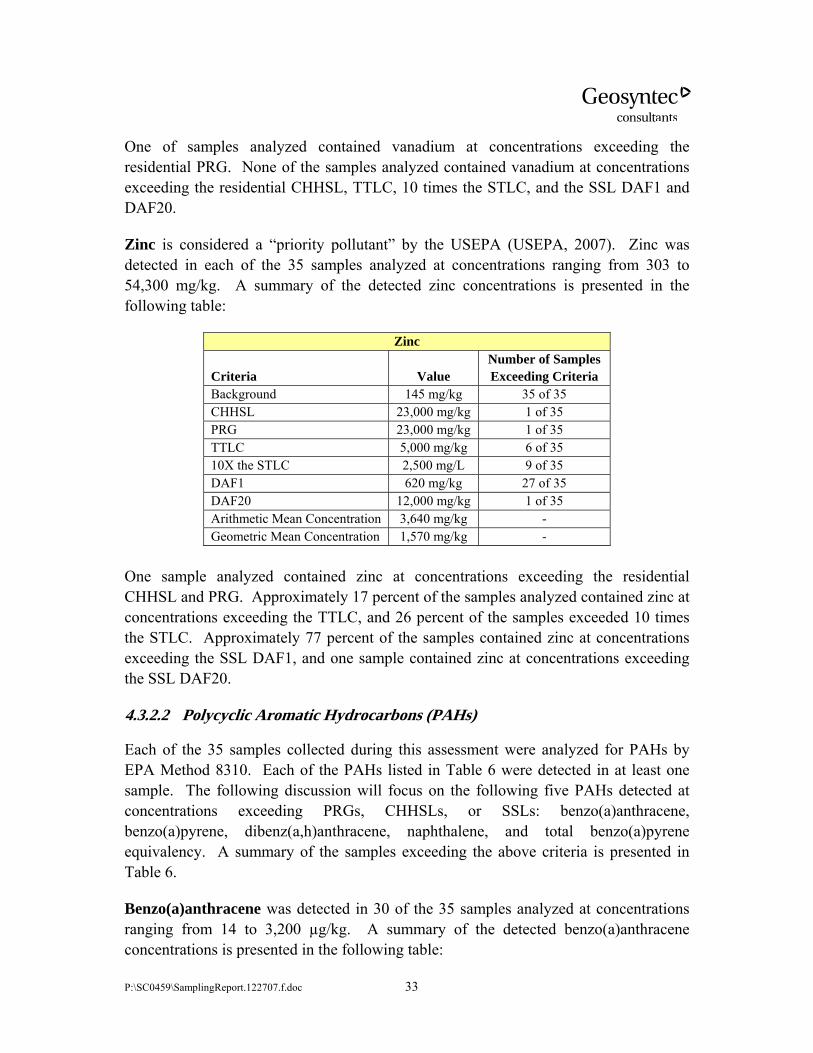
P:\SC0459\SamplingReport.122707.f.doc 33
One of samples analyzed contained vanadium at concentrations exceeding the residential PRG. None of the samples analyzed contained vanadium at concentrations exceeding the residential CHHSL, TTLC, 10 times the STLC, and the SSL DAF1 and DAF20.
Zinc is considered a “priority pollutant” by the USEPA (USEPA, 2007). Zinc was detected in each of the 35 samples analyzed at concentrations ranging from 303 to 54,300 mg/kg. A summary of the detected zinc concentrations is presented in the following table:
Zinc
Criteria Value Number of Samples Exceeding Criteria
Background 145 mg/kg 35 of 35 CHHSL 23,000 mg/kg 1 of 35 PRG 23,000 mg/kg 1 of 35 TTLC 5,000 mg/kg 6 of 35 10X the STLC 2,500 mg/L 9 of 35 DAF1 620 mg/kg 27 of 35 DAF20 12,000 mg/kg 1 of 35 Arithmetic Mean Concentration 3,640 mg/kg - Geometric Mean Concentration 1,570 mg/kg -
One sample analyzed contained zinc at concentrations exceeding the residential CHHSL and PRG. Approximately 17 percent of the samples analyzed contained zinc at concentrations exceeding the TTLC, and 26 percent of the samples exceeded 10 times the STLC. Approximately 77 percent of the samples contained zinc at concentrations exceeding the SSL DAF1, and one sample contained zinc at concentrations exceeding the SSL DAF20.
4.3.2.2 Polycyclic Aromatic Hydrocarbons (PAHs)
Each of the 35 samples collected during this assessment were analyzed for PAHs by EPA Method 8310. Each of the PAHs listed in Table 6 were detected in at least one sample. The following discussion will focus on the following five PAHs detected at concentrations exceeding PRGs, CHHSLs, or SSLs: benzo(a)anthracene, benzo(a)pyrene, dibenz(a,h)anthracene, naphthalene, and total benzo(a)pyrene equivalency. A summary of the samples exceeding the above criteria is presented in Table 6.
Benzo(a)anthracene was detected in 30 of the 35 samples analyzed at concentrations ranging from 14 to 3,200 µg/kg. A summary of the detected benzo(a)anthracene concentrations is presented in the following table:
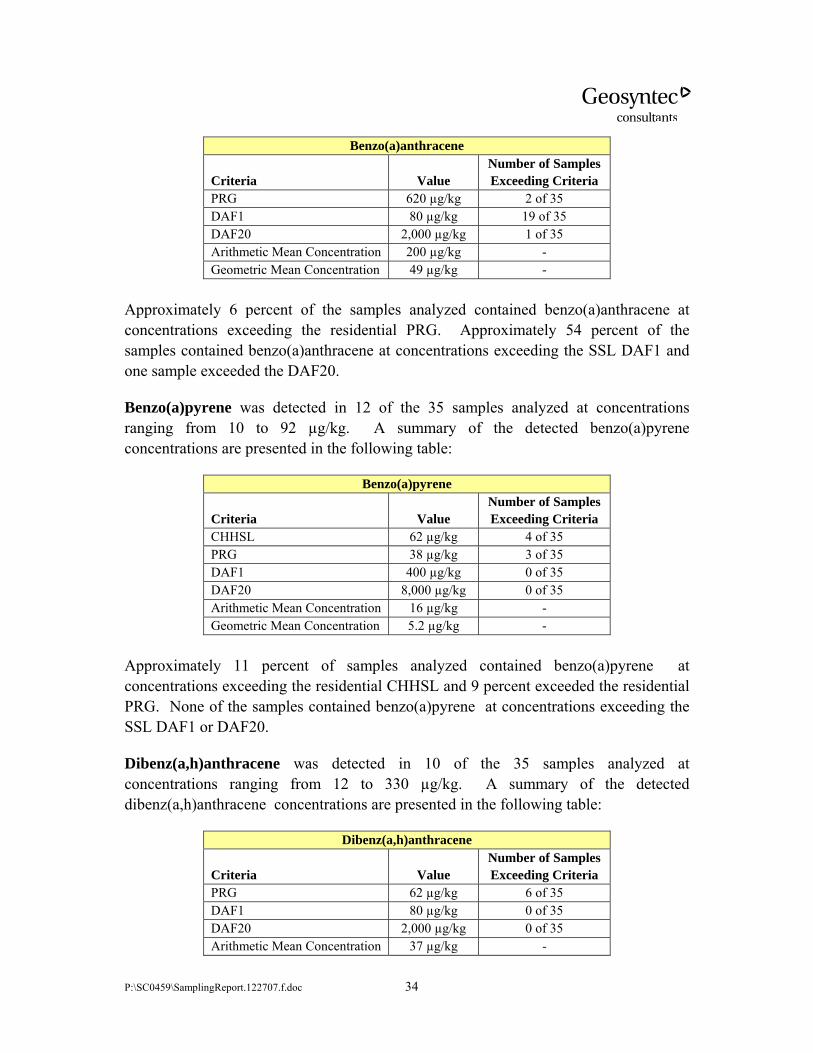
P:\SC0459\SamplingReport.122707.f.doc 34
Benzo(a)anthracene
Criteria Value Number of Samples Exceeding Criteria
PRG 620 µg/kg 2 of 35 DAF1 80 µg/kg 19 of 35 DAF20 2,000 µg/kg 1 of 35 Arithmetic Mean Concentration 200 µg/kg - Geometric Mean Concentration 49 µg/kg -
Approximately 6 percent of the samples analyzed contained benzo(a)anthracene at concentrations exceeding the residential PRG. Approximately 54 percent of the samples contained benzo(a)anthracene at concentrations exceeding the SSL DAF1 and one sample exceeded the DAF20.
Benzo(a)pyrene was detected in 12 of the 35 samples analyzed at concentrations ranging from 10 to 92 µg/kg. A summary of the detected benzo(a)pyrene concentrations are presented in the following table:
Benzo(a)pyrene
Criteria Value Number of Samples Exceeding Criteria
CHHSL 62 µg/kg 4 of 35 PRG 38 µg/kg 3 of 35 DAF1 400 µg/kg 0 of 35 DAF20 8,000 µg/kg 0 of 35 Arithmetic Mean Concentration 16 µg/kg - Geometric Mean Concentration 5.2 µg/kg -
Approximately 11 percent of samples analyzed contained benzo(a)pyrene at concentrations exceeding the residential CHHSL and 9 percent exceeded the residential PRG. None of the samples contained benzo(a)pyrene at concentrations exceeding the SSL DAF1 or DAF20.
Dibenz(a,h)anthracene was detected in 10 of the 35 samples analyzed at concentrations ranging from 12 to 330 µg/kg. A summary of the detected dibenz(a,h)anthracene concentrations are presented in the following table:
Dibenz(a,h)anthracene
Criteria Value Number of Samples Exceeding Criteria
PRG 62 µg/kg 6 of 35 DAF1 80 µg/kg 0 of 35 DAF20 2,000 µg/kg 0 of 35 Arithmetic Mean Concentration 37 µg/kg -
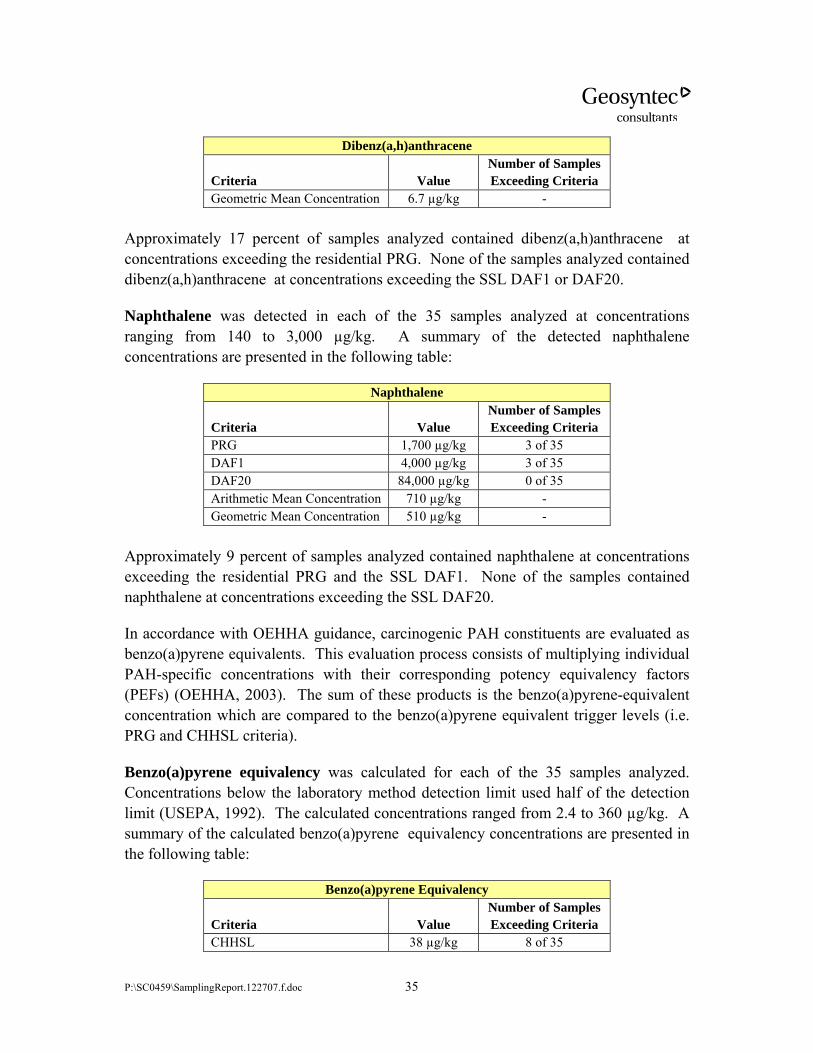
P:\SC0459\SamplingReport.122707.f.doc 35
Dibenz(a,h)anthracene
Criteria Value Number of Samples Exceeding Criteria
Geometric Mean Concentration 6.7 µg/kg - Approximately 17 percent of samples analyzed contained dibenz(a,h)anthracene at concentrations exceeding the residential PRG. None of the samples analyzed contained dibenz(a,h)anthracene at concentrations exceeding the SSL DAF1 or DAF20.
Naphthalene was detected in each of the 35 samples analyzed at concentrations ranging from 140 to 3,000 µg/kg. A summary of the detected naphthalene concentrations are presented in the following table:
Naphthalene
Criteria Value Number of Samples Exceeding Criteria
PRG 1,700 µg/kg 3 of 35 DAF1 4,000 µg/kg 3 of 35 DAF20 84,000 µg/kg 0 of 35 Arithmetic Mean Concentration 710 µg/kg - Geometric Mean Concentration 510 µg/kg -
Approximately 9 percent of samples analyzed contained naphthalene at concentrations exceeding the residential PRG and the SSL DAF1. None of the samples contained naphthalene at concentrations exceeding the SSL DAF20.
In accordance with OEHHA guidance, carcinogenic PAH constituents are evaluated as benzo(a)pyrene equivalents. This evaluation process consists of multiplying individual PAH-specific concentrations with their corresponding potency equivalency factors (PEFs) (OEHHA, 2003). The sum of these products is the benzo(a)pyrene-equivalent concentration which are compared to the benzo(a)pyrene equivalent trigger levels (i.e. PRG and CHHSL criteria).
Benzo(a)pyrene equivalency was calculated for each of the 35 samples analyzed. Concentrations below the laboratory method detection limit used half of the detection limit (USEPA, 1992). The calculated concentrations ranged from 2.4 to 360 µg/kg. A summary of the calculated benzo(a)pyrene equivalency concentrations are presented in the following table:
Benzo(a)pyrene Equivalency
Criteria Value Number of Samples Exceeding Criteria
CHHSL 38 µg/kg 8 of 35
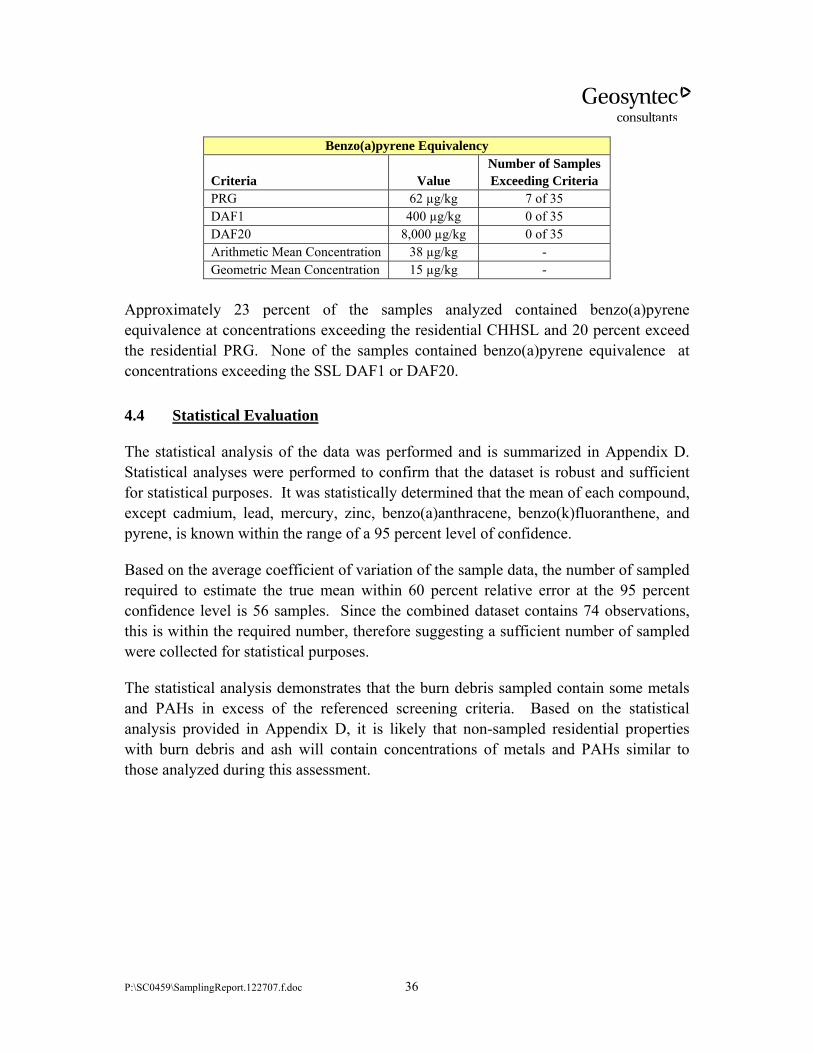
P:\SC0459\SamplingReport.122707.f.doc 36
Benzo(a)pyrene Equivalency
Criteria Value Number of Samples Exceeding Criteria
PRG 62 µg/kg 7 of 35 DAF1 400 µg/kg 0 of 35 DAF20 8,000 µg/kg 0 of 35 Arithmetic Mean Concentration 38 µg/kg - Geometric Mean Concentration 15 µg/kg -
Approximately 23 percent of the samples analyzed contained benzo(a)pyrene equivalence at concentrations exceeding the residential CHHSL and 20 percent exceed the residential PRG. None of the samples contained benzo(a)pyrene equivalence at concentrations exceeding the SSL DAF1 or DAF20.
4.4 Statistical Evaluation
The statistical analysis of the data was performed and is summarized in Appendix D. Statistical analyses were performed to confirm that the dataset is robust and sufficient for statistical purposes. It was statistically determined that the mean of each compound, except cadmium, lead, mercury, zinc, benzo(a)anthracene, benzo(k)fluoranthene, and pyrene, is known within the range of a 95 percent level of confidence.
Based on the average coefficient of variation of the sample data, the number of sampled required to estimate the true mean within 60 percent relative error at the 95 percent confidence level is 56 samples. Since the combined dataset contains 74 observations, this is within the required number, therefore suggesting a sufficient number of sampled were collected for statistical purposes.
The statistical analysis demonstrates that the burn debris sampled contain some metals and PAHs in excess of the referenced screening criteria. Based on the statistical analysis provided in Appendix D, it is likely that non-sampled residential properties with burn debris and ash will contain concentrations of metals and PAHs similar to those analyzed during this assessment.
P:\SC0459\SamplingReport.122707.f.doc 37
5. SUMMARY OF HAZARDS ASSOCIATED WITH BURN DEBRIS
Based on a representative and statistically-based characterization of residual burn debris and ash in two “typical” residential areas affected by the 2007 Southern California Wildfires, the primary purposes of the characterization were to: evaluate the presence of constituents of concern in burn debris and ash in the residential areas selected for sampling; and to compare the laboratory analytical data generated from this characterization to California statutorily-established health-based criteria, and other criteria referenced herein, to assess the hazards associated with the burn debris and ash. Based on this evaluation, the following hazards have been identified.
5.1 San Bernardino County
Hazards associated with the burn debris and ash in the San Bernardino County sampling area are summarized as follows:
• Arithmetic mean concentrations of arsenic (14.9 mg/kg), cadmium (25.2 mg/kg), copper (4,210 mg/kg), and lead (1,640 mg/kg) exceed the residential CHHSLs or PRGs.
• Geometric mean concentrations of arsenic (8.25 mg/kg) and lead (211 mg/kg) exceed the residential CHHSLs or PRGs.
• Arithmetic and geometric mean concentrations of PAHs were below CHHSLs and PRGs, but approximately 20 percent of the samples collected contained one or more of the following constituents at concentrations exceeding CHHSLs or PRGs: benzo(a)anthracene, benzo(k)flouranthene, naphthalene, and benzo(a)pyrene-equivalents.
• Arithmetic mean concentrations of copper (4,210 mg/kg), lead (1,640 mg/kg), and zinc (8,250 mg/kg) exceed the TTLC, 10 times the STLC, and 20 times the TCLP (except copper).
• Arithmetic mean concentrations of cadmium (25.2 mg/kg) exceed 10 times the STLC and 20 times the TCLP.
• Geometric mean concentrations of antimony, arsenic, cadmium, copper, lead, molybdenum, selenium, and zinc exceeded California geometric mean background concentrations.
• Geometric mean concentrations of antimony, arsenic, barium, chromium, nickel, and zinc exceeded USEPA Region IX soil screening levels for potential impacts to surface water, shallow groundwater, and areas underlain by fractured rock aquifers.
P:\SC0459\SamplingReport.122707.f.doc 38
• In addition to confirming the presence of elevated concentrations of several metals and caustic alkaline materials, the November 2007 assessment performed by the USGS indicated that rain-water runoff from burned areas may adversely affect ecosystems and the quality of surface drinking water supplies, and that aquatic habitat may be affected by spikes in alkalinity as rainwater mixes with ash to form surface runoff.
5.2 San Diego County
Hazards associated with the burn debris and ash in the San Diego County sampling area are summarized as follows:
• Arithmetic mean concentrations of arsenic (7.57 mg/kg), cadmium (2.92 mg/kg), copper (4,730 mg/kg) and lead (445 mg/kg) exceed the residential CHHSLs or PRGs.
• The geometric mean concentration of arsenic (5.47 mg/kg) exceeded the residential CHHSL and PRG.
• Arithmetic and geometric mean concentrations of PAHs were below CHHSLs and PRGs, but greater than 34 percent of the samples collected contained one or more of the following constituents at concentrations exceeding CHHSLs or PRGs: benzo(a)pyrene, benzo(a)anthracene, dibenz(a,h)anthracene, naphthalene, and benzo(a)pyrene-equivalents.
• The arithmetic mean concentration of copper (4,730 mg/kg) exceeded the TTLC and 10 times the STLC.
• Arithmetic mean concentrations of lead (445 mg/kg) and zinc (3,640 mg/kg) exceeded 10 times the STLC and 20 times the TCLP (lead only).
• Geometric mean concentrations of antimony, arsenic, cadmium, copper, lead, molybdenum, selenium, and zinc exceeded California geometric mean background concentrations.
• Geometric mean concentrations of antimony, arsenic, barium, chromium, nickel, and zinc exceeded USEPA Region IX soil screening levels for potential impacts to surface water, shallow groundwater, and areas underlain by fractured rock aquifers.
• In addition to confirming the presence of elevated concentrations of several metals and caustic alkaline materials, the November 2007 assessment performed by the USGS indicated that rain-water runoff from burned areas may adversely affect ecosystems and the quality of surface drinking water
P:\SC0459\SamplingReport.122707.f.doc 39
supplies, and that aquatic habitat may be affected by spikes in alkalinity as rainwater mixes with ash to form surface runoff.
P:\SC0459\SamplingReport.122707.f.doc 40
6. CONCLUSIONS
The objective of this investigation was to perform a representative characterization of burn debris and ash in residential areas to assess the presence of hazardous COCs at concentrations exceeding statutorily-established human health-based screening levels such as residential CHHSLs and PRGs. The laboratory analytical data documenting the presence of COCs in the burn debris and ash at concentrations exceeding established residential CHHSLs or PRGs will be used to substantiate the determination of an immediate threat to public health and safety made by CalEPA and its boards, departments, and offices, according to FEMA Disaster Assistance Policy 9523.13 “Debris Removal from Private Property.” FEMA Disaster Assistance Policy 9523.13 provides FEMA authority to fund debris removal from private property provided that debris removal is in the “public interest.” FEMA defines “public interest” as being necessary to: eliminate immediate threats to life, public health, and safety; eliminate immediate threats of significant damage to improved property; or ensure economic recovery of the affected community to the benefit of the community-at-1arge. In these situations, debris removal from private property may be considered to be in the public interest and thus may be eligible for reimbursement under the Public Assistance Program (44 CFR 206.224).
The results of this assessment demonstrate that burn debris and ash in residential areas affected by the 2007 Southern California Wildfires contain contaminants whose concentrations exceed health-based criteria. These data, therefore, support the determination by CalEPA and its boards, departments, and offices, of an immediate threat to public health and safety based on the following:
• Arithmetic mean concentrations of arsenic, cadmium, copper, and lead exceed residential CHHSLs or PRGs in both areas characterized in San Bernardino and San Diego Counties.
• The geometric mean concentration of arsenic exceeds the residential CHHSL and PRG in both areas characterized in San Bernardino and San Diego Counties. The geometric mean concentration of lead exceeds the residential CHHSL and PRG in the area characterized in San Bernardino County.
• Arithmetic and geometric mean concentrations of PAHs were below CHHSLs and PRGs, but greater than 27 percent of the samples collected in San Bernardino and San Diego Counties contained one or more PAH constituents at concentrations exceeding CHHSLs or PRGs.
P:\SC0459\SamplingReport.122707.f.doc 41
• Geometric mean concentrations of antimony, arsenic, barium, chromium, nickel, and zinc exceeded USEPA Region IX soil screening levels for surface water, shallow groundwater, and areas underlain by fractured rock aquifers in both areas characterized in San Bernardino and San Diego Counties. As demonstrated by the November 2007 USGS study, when mixed with rainwater to form surface water runoff, the elevated concentrations of several metals and caustic alkaline materials in the ash may adversely affect ecosystems and the quality of surface drinking water supplies.
• The results of this burn debris assessment indicated similar COCs were detected as those detected during the assessment following the 2003 San Diego County wildfires. However, the concentrations of COCs detected following the 2007 wildfires were generally lower than concentrations detected following the 2003 wildfires as a result of the statistically-based random sampling approach and purposefully avoiding samples from areas with suspected high levels of contamination (i.e., under a burned car) during the 2007 assessment. Therefore, it is possible that higher concentrations of COCs are present in burn debris in the areas sampled than detected during this assessment.
• Geosyntec understands that visible and retrievable household hazardous wastes were removed prior to sampling, and did not influence the results of characterizing typical residential contamination following a wildfire. However, constituents still exceeded the established screening criteria following the removal of these wastes.
• The screening criteria (residential CHHSLs and PRGs) utilized during this assessment were developed for soil and may underestimate the hazard associated with ash and burn debris which is more likely to become airborne or absorbed through the skin.
The data, therefore, indicate an exceedance of health-based criteria, and support the conclusion by CalEPA that expedited removal of burn debris and ash from these areas is warranted and in the public interest.
P:\SC0459\SamplingReport.122707.f.doc 42
7. LIMITATIONS
This assessment of burned residential areas associated with the Slide and Witch Creek fires has been performed in accordance with current practices and the standard of care exercised by scientists and engineers performing similar tasks in this area. The conclusions contained in this report are based solely on the analysis of the conditions observed by Geosyntec personnel and as reported by regulatory agencies and other named sources. We cannot make any assurances concerning the completeness of the data presented to us.
No warranty, expressed or implied, is made regarding the professional opinions expressed in this report. If actual conditions are found to differ from those described in this report, or if new information regarding the site is obtained, Geosyntec should be notified and additional recommendations, if required, will be provided. Geosyntec is not liable for any use of the information contained in this report by persons other than the California Department of Toxic Substances Control, or use of information in this report for any purposes other than referenced in this report without the expressed, written consent of Geosyntec.
P:\SC0459\SamplingReport.122707.f.doc 43
8. REFERENCES
Beyer, H. L., 2004. Hawth's Analysis Tools for ArcGIS. Available at http://www.spatialecology.com/htools.
Bortungno, D.J. and Spittler, T.E., 1986. Geologic Map of the San Bernardino Quadrangle, California, 1:250,000, California Geological Survey (formerly California Division of Mines and Geology), Map No. 3A (Geology), Sheet 1 of 5.
California Department of Toxic Substances Control (DTSC), 2003. Protocol for Burn Dump Site Investigation and Characterization. 30 June 2003.
California Department of Water Resources, Division of Planning and Local Assistance, 2004. South Lahontan Hydrologic Region, Upper Mojave River Valley Groundwater Basin, California’s Groundwater Bulletin 118. Website: http://www.dpla2.water.ca.gov/publications/groundwater/bulletin118/basins/pdfs_desc/6-42.pdf. 27 February 2004.
California Environmental Protection Agency (CalEPA), 2005. Use of California Human Health Screening Levels (CHHSLs) in Evaluation of Contaminated Properties. January 2005. Available at: http://www.calepa.ca.gov/Brownfields/ documents/2005/CHHSLsGuide.pdf
California Integrated Waste Management Board (CIWMB), 1998. Local Enforcement Agency Advisory #56, Process for Evaluating and Remediating Burn Dump Sites. 4 November 1998.
CIWMB, 2007. Project Specifications for the Angora Fire Structural Debris Removal. 16 July 2007.
City of San Diego, Development Services, 2007. 2007 Firestorm Damage Assessment. 30 October 2007.
County of San Diego, Department of Environmental Health (DEH), 2004. Site Assessment and Mitigation (SAM) Manual 2004, 18 February 2004.
Geosyntec Consultants, 2004. Assessment of Burned Debris Report, Cedar Fire and Paradise Fire Areas, San Diego County, California. 5 February 2004.
P:\SC0459\SamplingReport.122707.f.doc 44
Geosyntec Consultants, 2007. Sampling and Analysis Plan, 2007 Wildfires - Burn debris Assessment, San Diego and San Bernardino Counties, California. 27 November 2007.
Governor of the State of California, 2007. Executive Order S-13-07. 25 October 2007.
Kennedy, M.P., 1975. Geology of Metropolitan San Diego, California Division of Mines and Geology, Bulletin 200.
Office of Environmental Health Hazard Assessment (OEHHA), 2003. Air Toxics Hot Spots Program Risk Assessment Guidelines – The Air Toxics Hot Spots Program Guidance Manual for Preparation of Health Risk Assessments. August 2003.
Ott, L. and M. Longnecker, 2001. An Introduction to Statistical Methods and Data Analysis, 5th Ed. Pacific Grove, CA: Duxbury, 2001.
Regional Water Quality Control Board (RWQCB), San Diego Region, 2006. Water Quality Control Plan for the San Diego Basin (9), Adopted on 8 September 1994, with amendments adopted through 8 Feb 2006.
University of California Riverside and CalEPA DTSC, 1996. Background Concentrations of Trace and Major Elements in California Soils, Kearney Foundation Special Report, March 1996.
United States Environmental Protection Agency (USEPA), 1992. Statistical Analysis of Ground-water Monitoring Data at RCRA Facilities. Addendum to Interim Final Guidance. Washington DC: Office of Solid Waste. July 1992.
USEPA, 2002a. RCRA Waste Sampling Draft Technical Guidance - Planning, Implementation, and Assessment, August 2002.
USEPA, 2002b. Guidance on Choosing a Sampling Design for Environmental Data Collection. December 2002.
USEPA, Region IX, 2004. Region IX PRGs Table 2002 Update, 1 October 2004.
USEPA, 2006. Data Quality Assessment: Statistical Methods for Practitioners, EPA QA/G-9S. EPA/240/B-06/003. Office of Environmental Information, Washington, D.C.
USEPA website, 2007. Water Quality Standards Database. http://oaspub.epa.gov/ wqsdatabase/wqsi_epa_criteria.rep_parameter. Last updated on 13 December 2007.
P:\SC0459\SamplingReport.122707.f.doc 45
United States Geological Survey (USGS), Western Earth Surface Processes Team, 2006. Geology of the San Bernardino Mountains. Website: http://geomaps.wr.usgs.gov/socal/geology/transverse_ranges/san_bernardino_mtns/index.html. Last modified: 26 May 2006.
USGS, 2007. Preliminary Analytical Results for Ash and Burned Soils from the October 2007 Southern California Wildfires. November 2007.