Embed Size (px)
Citation preview
Assessment of Blind Predictions of Protein–ProteinInteractions: Current Status of Docking MethodsRaul Mendez,1,2 Raphael Leplae,1 Leonardo De Maria,1,3 and Shoshana J. Wodak1*1Service de Conformation de Macromolecules Biologiques, et Bioinformatique, Centre de Biologie Structurale etBioinformatique, CP 263, BC6, Universite Libre de Bruxelles, Bruxelles, Belgium2Grup de Modelitzacio Estructural i Funcional de Sistemes Biologics, Institut de Neurociencies, Unitat de Bioestadıstica,Facultat de Medicina, Universitat Autonoma de Barcelona Bellaterra, Spain3Centro Internacional de Fisica, A.A. 4948, Bogota DC, Colombia
ABSTRACT The current status of docking pro-cedures for predicting protein–protein interactionsstarting from their three-dimensional structure isassessed from a first major evaluation of blind pre-dictions. This evaluation was performed as part of acommunitywide experiment on Critical Assessmentof PRedicted Interactions (CAPRI). Seven newlydetermined structures of protein–protein complexeswere available as targets for this experiment. Thesewere the complexes between a kinase and its pro-tein substrate, between a T-cell receptor �-chainand a superantigen, and five antigen-antibody com-plexes. For each target, the predictors were giventhe experimental structures of the free components,or of one free and one bound component in a ran-dom orientation. The structure of the complex wasrevealed only at the time of the evaluation. A total of465 predictions submitted by 19 groups were evalu-ated. These groups used a wide range of algorithmsand scoring functions, some of which were com-pletely novel. The quality of the predicted interac-tions was evaluated by comparing residue–residuecontacts and interface residues to those in the X-raystructures and by analyzing the fit of the ligandmolecules (the smaller of the two proteins in thecomplex) or of interface residues only, in the pre-dicted versus target complexes. A total of 14 groupsproduced predictions, ranking from acceptable tohighly accurate for five of the seven targets. The useof available biochemical and biological information,and in one instance structural information, played akey role in achieving this result. It was essential foridentifying the native binding modes for the fivecorrectly predicted targets, including the kinase-substrate complex where the enzyme changes con-formation on association. But it was also the causefor missing the correct solution for the two remain-ing unpredicted targets, which involve unexpectedantigen-antibody binding modes. Overall, this anal-ysis reveals genuine progress in docking proce-dures but also illustrates the remaining seriouslimitations and points out the need for better scor-ing functions and more effective ways for handlingconformational flexibility. Proteins 2003;52:51–67.© 2003 Wiley-Liss, Inc.
Key words: structure predictions; residue-residuecontacts; interface residues
INTRODUCTION
Intermolecular interactions, particularly those betweenproteins, have become a central focus in postgenomicbiology.1–8 Tens of thousands of gene products are knownor suspected to interact with many others, from genetic,biochemical, or bioinformatics studies forming millions ofputative complexes.9–12 However, a very small fraction ofthese complexes will in the near future be available foranalysis, let alone for crystallization. Therefore, predictedmodes of association between macromolecules should be auseful guide for genetic and biochemical experiments, butthe prediction methods, commonly called docking algo-rithms, must first be extensively tested and their validityassessed.
Docking algorithms, first suggested in 1978,13,14 operateon the atomic coordinates of two individual proteins usu-ally considered as rigid bodies and generate a largenumber of candidate association modes between them.These candidates are then ranked by using various crite-ria, used independently or in combination. The criteriagenerally include geometric and chemical complementar-ity measures, electrostatics, H-bonding interactions andsolvation, and use empirical potentials or database-derived functions. A number of algorithms and manydifferent scoring functions have been developed in the last10 years, as recently reviewed by several authors,2,15 andthe field has become extremely active.
Authors developing docking procedures usually testthem on crystal structures of complexes deposited in theProtein Data Bank, which so far have been protease-inhibitor and antigen-antibody complexes. In the mostfavorable case, the best prediction is reasonably close to
Grant sponsor: Marie Curie Host Training; Grant number: QLK3-1999-51297.
*Correspondence to: Shoshana J. Wodak. Service de Conformationde Macromolecules Biologiques, et Bioinformatique, Centre de Biolo-gie Structurale et Bioinformatique, CP 263, BC6, Universite Libre deBruxelles, Blvd. du Triomphe, 1050 Bruxelles, Belgium. E-mail:[email protected]
Received 20 December 2002; Accepted 30 December 2002
PROTEINS: Structure, Function, and Genetics 52:51–67 (2003)
© 2003 WILEY-LISS, INC.
the crystal structure,16–27 but none of the docking proce-dures achieves this on all test complexes. Furthermore,the procedures perform poorly when the docking calcula-tions use the unbound molecules, which often display somedifferences in conformation relative to the bound ones,either in their side-chains, or main-chain, or both.
Previous attempts critically assessed docking proce-dures by comparing their performance in blind trials, inwhich the X-ray structures of the components are knownand that of the complex were made available only at thetime of evaluation.28–30 But these attempts were limitedin scope, with only two available targets and less than ahandful of participating groups.
Here we present the results from an independent evalu-ation of blind predictions of protein–protein interactions.These predictions were performed as part of the CriticalAssessment of PRedicted Interactions (CAPRI), a commu-nitywide experiment analogous to CASP,31 but aimed atassessing the performance of procedures for predicting themode of association of two proteins based on their three-dimensional (3D) structure.
Seven protein–protein complexes were available as tar-gets for the first two rounds of CAPRI evaluated here.These comprised a complex between a kinase and itsprotein substrate, that of a T-cell receptor �-chain and asuperantigen, and five antigen-antibody complexes. Inseveral of the complexes, one of the partners was a largemultimeric protein.
For each target, the experimental structures of the freecomponents, or of one free and one bound component in arandom orientation, were made available to the predictors,but the structure of the complex was revealed only at thetime of the evaluation.
Nineteen groups submitted a total of 465 predictedcomplexes, with not all the predictor groups submittingpredictions for every target. No limits were set on thesource or type of additional information (homologue pro-teins, biochemical data on interacting residues) that thepredictors could use to guide their docking calculations.
The presented evaluation was performed with no knowl-edge of the identity of the predictors. It is based on anumber of simple criteria, agreed on by the CAPRI manage-ment team and approved by the participating groupsduring the first CAPRI evaluation meeting held in Franceon September 19–21, 2002 (see http://capri.ebi.ac.uk). Theresults are presented in ways that should enable easyperusal and comparison of the predictions (a set of simplenumbers and pictures), with the following main goals:assessing the performance of available docking proce-dures, identifying useful applications of available methodsin structural genomics and proteomics efforts, and evaluat-ing the prospects of making progress in the field in thenear future.
THE TARGET COMPLEXES AND THEIRCOMPONENTS
The seven targets of this first CAPRI experiment aredenoted T01–T07 in Table I of Janin et al. (this issue). T01was the complex between the protein kinase from Lactoba-
cillus casei HprK, and its protein substrate Hpr (from B.subtilis).32 Targets T02–T06 were the following five differ-ent antigen-antibody complexes. The complex between thebovine rotavirus VP6 protein with Fab fragments from amonoclonal antibody (Rey et al., unpublished), the com-plex between the influenza hemagglutinin and an Fabfragment that prevents the hemagglutinin low pH transi-tion,33 and the complexes between porcine pancreatic�-amylase and three different variants of the single VHHdomain of camelid antibodies.34 Target 7 (T07) was thecomplex between the mouse T-cell receptor �-chain andthe superantigen Streptoccoccal pyrogenic exotoxin A.35
The atomic coordinates of the targets were provided tothe assessors before publication to conduct the indepen-dent evaluation reported here.
To perform the prediction for each target, predictorswere given the atomic coordinates of the two componentsto be used in their docking calculations. The 3D structuresof these components, with the corresponding PDB codeswhen applicable, are listed in Table I of Janin et al. (thisissue). For the five antigen-antibody complexes, no 3Dstructures were available for the unbound Fab fragments.Therefore, the predictors were given the atomic coordi-nates of the bound Fab molecules, but after their overallorientation was randomized. This was not considered aserious bias given that antibodies generally undergo lim-ited conformational changes on antigen binding.
The seven targets cover a range of biological systemsand represent different degrees of difficulty. As seen fromthe Table I of Janin et al. (this issue), the interfaces inthese complexes bury surface areas in the range of 1200–2300 A2, similar to those encountered in many protein–protein complexes.36 These interfaces involve between 17and 34 residues on each protein, and those are engaged in37–65 residue–residue contacts. The types of residuesinvolved in these interfaces (charged, polar, and hydropho-bic) are also typical.
The HprK-Hpr complex (T01) was clearly one of themost difficult problems. The free HprK protein is a hex-amer and although the complex is known to involve oneHpr molecule per kinase subunit, the predictors had tomake a choice between using the entire hexamer, a trimeronly, or just the monomer, with the latter being a perilouschoice because it excluded the possibility for the Hprmolecule to simultaneously interact with two kinase sub-units, as it is in fact the case.
Because most docking programs are still limited in theircapacity in dealing with conformational adjustments, afurther difficulty arose from the fact that kinase conforma-tions in the free and bound forms differed. The main-chainof individual bound and unbound monomers superimposewith a root-mean-square deviation (RMSD) of 1.96 A, witha significant movement of the C-terminal helix (fromresidue 287 on), which makes contact with the Hpr mole-cule in the complex. The monomers move moreover rela-tive to one another.
In addition, the structures of the unbound HprK mol-ecules available in the PDB (see Table I in Janin et al.) hadmissing coordinates for the loop comprising residues 241–
52 R. MENDEZ ET AL.
252. Therefore, predictors needed to model the structurefor this loop, to avoid the risk of missing solutions thatinvolve interactions with it.
However, there were some helpful clues as well. It wasknown that the phosphorylation site of the Hpr moleculeswas Ser-46, and not His-15, and hence that the kinaseP-loop needed to be close to this residue in the cognatecomplex. Ample information on amino acid sequences ofrelated kinases and Hpr molecules was also available.
The problem of conformational changes was negligiblefor the remaining targets. The largest structural changesbetween the unbound and bound molecules are for targetT07 where the backbones of the variable domains (bound/unbound) display an RMSD of 1.08 A (Table I Janin et al.).However, the large size of the virus antigen moieties intargets T02 and T03 was a drawback for most dockingprograms. To deal with such large molecules, predictorsoften use common knowledge or biochemical informationto limit the search space around regions of the proteinsthat are most likely to interact. For these targets suchregions were the complementarity determining regions(CDRs) of the antibody and the portions of the antigen thatwould be accessible to an antibody on the virus envelope.But restricting the search space bears the danger ofmissing the correct solution, as reported by some predic-tors (Eisenstein). As seen below, the use of prior assump-tions was a serious problem for the two simpler complexesof the porcine �-amylase with the camelid VHH domains(T04 and T05), where the antibodies bind in a ratherunexpected mode involving a large number of frameworkresidues.
In terms of potentially helpful information, a low-resolution structural description37 was available for T02,and a crystal structure of a related complex (1jck) with thesame mode of interaction was available for the TCR�-SpeAcomplex.
THE DOCKING PROCEDURES
Table I gives a short summary of the docking proceduresand the assumptions and constraints used by the differentgroups in predicting the CAPRI target complexes.
A sizeable fraction of the procedures uses a cubic gridrepresentation of the protein surface and fast Fouriertransform search algorithms, following earlier work. An-other involves alternative representations of the proteinmodels and different algorithms for sampling interactionmodes, which include geometric hashing, Monte Carlo,genetic algorithm and Molecular, or Brownian-type, me-chanics procedures.
The criteria used to single out the correct interactionfrom the large number of incorrect solutions are alsorather diverse. Some still rely essentially on purely geomet-ric criteria, but the more recent methods make increasinguse of composite scoring functions, which involve contribu-tions from H-bonds, electrostatics, and solvation. How-ever, usually these contributions are severely approxi-mated and often used only to rescore a subset of solutionsselected on the basis of geometric complementarity. But in
some more recent algorithms, they are directly incorpo-rated in the sampling step.
The ability of most procedures to handle conformationalchanges that may occur when the two proteins interact isstill insufficient. Several allow for limited adjustments ofthe side-chains and backbone conformations by relaxationvia molecular mechanics during a refinement step oraccount for flexibility by a built-in “softness” of the poten-tial. However, some completely repack side-chains at theinterface, whereas others dock sets of conformations frommolecular dynamics simulations, rather than a singlestructure, to mimic conformational flexibility.
It is noteworthy that at least six procedures used in thisfirst CAPRI challenge are novel or have novel aspects, andmany of these are still in the development stage. Hence,their present performance is in no way indicative of theirintrinsic value. It should also be emphasized that thedocking procedures differ significantly in calculation speed.Some take minutes, whereas others take hours or days forthe same problem. However, comparing the speeds ofdifferent procedures was not possible at this stage becauseof the large variety of hardware and scoring functionsused.
THE EVALUATION PROTOCOL
To assess the quality of the predicted complexes, theiratomic coordinates were first processed to correctly alignthe various chain segments to their counterparts in thetargets. Procedures implemented in the BRUGEL pack-age39 were then used to compute a set of parameters aimedat evaluating different aspects of the predicted complexes,which might be useful for different applications. Forexample, accurate modeling of the predicted interface foruse in designing inhibitors requires that residue–residuecontacts and, if possible, atomic contacts be correctlyidentified, whereas information of the interface residuesmight be sufficient for mutagenesis experiments lookingfor mutants that inhibit the interaction. On the otherhand, fitting an atomic model into a low-resolution elec-tron density map derived from electron microscopy40 is notsensitive to the exact nature of the interacting residuesbut rather to the overall geometry of the complex (relativeorientation and position of the receptor and ligand mol-ecules). In the following paragraphs, the parameters usedin the CAPRI evaluation are described in detail.
Residue–Residue Contacts and Interface Residues
Two quantities pertaining to residue–residue contactsbetween the docked proteins were computed for eachpredicted complex. A pair of residues on different sides ofthe interface was considered to be in contact if any of theiratoms were within 5 A.
One quantity is the fraction of native contacts fnat
defined as the number of native (correct) residue–residuecontacts in the predicted complex divided by the number ofcontacts in the target complex. The other is the fraction ofnon-native contacts fnon-nat, defined as the number ofnon-native (incorrect) residues–residue contacts in thepredicted complex divided by the total number of contacts
BLIND PREDICTIONS OF PROTEIN–PROTEIN INTERACTIONS 53
TABLE I. Procedures for Protein–Protein Docking Used in CAPRI
Predictor Program Algorithm CAPRI specifics
Scripps, US (Abagyan) ICM-DISCO Rigid body pseudo-Brownian MC with grid-basedenergy function; refinement: grid-based BiasedProbability MC Minimization using ICM(internal coordinate mechanics).
T01: filtered for H15 or D46 in contact with phosphateand ranked according to score. T02–T06: filtered,for CDRs in contact; T07: filtered for VHH CDRs incontact, and no clashes with TCR-�.
Boston U. US (Camacho) SmoothDock Clustering, refinement and discriminationprotocol: constrained minimization usingCHARMM; Coulomb and solvation.
T01: restricted search to presumed phosphate bindingregion. T04: restricted to solutions involving CDRs.T07: ranked first solution as in homologue.
Weizmann Inst. IL(Eisenstein)
MolFit Weighted geometric docking with FFT followedby clustering and filtering. Scoring byweighted geometric complementarity.
T01: up-weight conserved residues in HPrK and HPr;filtering for solutions with D46 directed to P-loop.T02–T06: up-weight interactions with CDRs; T04–T06 filter against solutions with non-CDR contacts.T07: homologue used, down-weight residues inTCR�/� contacts.
Cancer Research UK LRI(Fitzjohn/Bates)
Guided Docking Rigid body molecular mechanics usingCHARMM22 force field. Flexible refinementstep in some cases. Solvation used in finalenergy ranking.
Only T04–T07 predicted. Partial manual ranking,T07: homologue (1JCK)used
Sheffield U. UK(Gardiner)
GAPDOCK GA for sampling different relative rotations andclustering. Scoring based on shape correlationand buried area, as per CCP4 package; someclash checks.
T01, T02 only. Search restricted to expected contactregions. Final selection, manual.T01: selected solutions with Ser 46 contactingligands on kinase. T02: limited search space, andselected solution containing CDRs.
U. Washington US (Gray/Baker)
Monte Carlo and clustering, side-chainrepacking, rigid body minimization. Fittedmultiterm scoring function, mainly vdWorientation-dependent hydrogen bonding;implicit solvation.
T01–T03: no minimization; T01: search restricted toHPr. Ser46-HPrK. Asp157 in contact, kinaseconserved residues. T02–T06: favored contactswith CDRs; T02: only outer cap.; T07: usedhomologue, manual selection except for model1
Aberdeen U. UK(Mustard)
CONCOORD43�Hex Dock 500 essential dynamics structures fromCONCOORD using Hex.
T07: 500 SpeA structures docked onto rigid TCR.Search constrained to TCR hypervariable loops.
Columbia U. US (Norel) PPD Geometric hashing; multiple rescoring.Scripps US
(Olson/Norledge)Surfdock46 Fourier correlation of spherical harmonics.
Scoring by electrostatic, hydrophobic, van derWaals (buried surface area) interactions andshape complementarity. Clashes determinedby overlap of the docked surfaces.
Only T01–T03 predicted. Manual inspection of topscoring solutions. T01: Hpr S46 constrained nearkinase active site � manual check of kinasebinding region. T02–T03: Ag epitopes from otherstructures. Penalization of Ag regions inaccessiblein virion. Manual filtering of symmetric solutions.
Universidade Nova DeLisboa(Palma/Krippahl)
BiGGER (Chemera) Binary grids; scoring with geometric, contactscounts, electrostatics and solvation, no clashchecks.
Some manual ranking. T07: TCR. truncated at D118
Aberdeen U. UK (Ritchie) Hex Spherical polar Fourier correlation of shape andelectrostatics, followed by soft rigid body OPLSminimization.
T01: search restricted to HPrK P-loop. T02–T07:search restricted to antibody and TCRhypervariable loops. Visual inspection andselection of orientations for T01–T03.
North Western U. US(Shoichet)
Northwestern DOCK Search for hot-spot correspondences betweenreceptor and ligand to calculate orientations,precalculation of ensemble of ligandconformations, receptor held rigid, energyevaluation using electrostatics and van derWaals terms.
Only T01 predicted
Imperial Coll. UK(Sternberg)
3D-DOCK MULTIDOCK FFT; rescore: residue potentials; flexiblerefinement: mean-field side-chain multicopy,solution clustering
Search restricted to expected interacting regions in allcases (CDRs for targets T02–T06); manualselection from highest ranking solutions.
UCSD US (Ten Eyck) DOT FFT for shape complementarity and Poission–Boltzmann electrostatics.
Ranking by shape complementarity (FADE). T02–T07 screened for CDRs. Manual ranking for T01and T02. Cluster analysis for T04–T07.
Kitasato U. JP(Umeyama/Komatsu)
TSCF Solvent cluster fitting; refinement by molecularmechanics and molecular dynamics usingAMBER force field.
No biochemical data, or bioinformatics used. Somemanual ranking.
SUNY/StonyBrook, US(Tovchigrechko,Vakser)
GRAMM FFT for shape complementarity; softer potentialfor conformational changes; no clash check;symmetry of multimeric receptors used toenhance sampling; docking of ligand tooverlapping fragments of receptor for speed.
Only T01–T03 predicted. T01: filtered for HPr H15 orD46 close to kinase active site. T021: filtered for forCDRs44 in contact � constraints on epitoperesidues. T03: Filtered for CDRs45 in contact �constraints on epitope
U. Autonoma Madrid, SP(Valencia)
Neural network-based predictions of interactionssites, using information on related sequences.
Only T01 predicted
Boston U. US (Weng) ZDOCK FFT with scoring by pairwise shapecomplementarity, solvation and electrostatics;clustering.
Blocked non-CDR residues for T02–T06. T01: Ser 46of Hpr within 7 A from P-loop. T02: distal half ofVP6. T07: locked residues according to homology;manual selection from best solutions
Tel Aviv U., IL NIH, US(Wofson/Nussinov)
PatchDock (T04–07)BUDDA (T01–07)PPD (T01)
Geometric docking: matching of local shapefeatures and geometric hashing, fast geometricscoring and search, avoids exhaustiveorientation search.
T01: HPr Ser46 close to P on kinase. T02–T06: CDRsonly. T04–T06: preference for high-sequencevariability regions in mammalian amylases. T07:used interface from homologue.
1Figure 6 of this reference.44
The left-most column lists the affiliation of the predictor group and the group principal investigator(s). The second column gives the acronym ofthe docking software. Column 3 lists key features of the docking algorithm and the right-most column lists details on the various assumptions,constraints, and additional information used in applying the different procedures to the CAPRI targets. The format of this table was inspired from(http://www.bmm.icnet.uk/�smithgr/soft.html) with permission from G. Smith.
54 R. MENDEZ ET AL.
in that complex. This latter quantity is informative be-cause a predicted complex in which a small number ofnative contacts is embedded in a large number of non-native ones is much less useful than a complex in whichthe number of false-positive contacts is small.
When several quasi-symmetrical docking solutions weresubmitted, as was the case for targets T01–T03 in whichone of the components is a multisubunit protein, fnat wasevaluated for all the submitted solutions and the one withthe largest fnat value was used for further analysis.
To evaluate the extent to which a prediction identifiesthe native interaction surfaces or “epitopes” on either orboth proteins, independently of its ability to produce thenative contacts between them, we also computed thefraction of native interface residues fIR. This fraction,computed for each of the interacting proteins, is defined asthe number of native residues in the predicted interfacedivided by the total number of native residues in thecorresponding target interface. Here, the interface resi-dues were defined as those that lose accessible surfacearea when the two proteins associate.
Backbone RMSDs and Rigid Body Transformations
To evaluate the overall geometric fit between the 3Dstructures of the predicted and observed complexes, sev-eral parameters were computed. One is the RMSD of theligand (the smaller of the two proteins) in the predictedversus target complexes after the receptor (the larger ofthe two proteins) was superimposed.41 This ligand RMSD,denoted L_RMS, and the superpositions were both com-puted on backbone atoms (N,C�,C,O). To further character-ize the global fit between the predicted and observedligand positions, we also computed the residual rigid bodyrotation angle �L and the residual translation vector of thegeometric centre dL required to superimpose the ligandmolecules once the receptors have been superimposed.
Because some predictors chose to perform their dockingcalculations by using only part of the component molecules(e.g., the hypervariable domains of the Fab fragments), theL_RMS values were computed for the molecular portionsthat were common to all the predictors. In target T07,where the two domains of the TCR receptor move relativeto one another on complex formation, the L_RMS wascomputed on the backbone of the variable domain only.
When several quasi-symmetrical docking solutions werepossible or actually submitted, as was the case for targetsT01–T03, the receptor subunit involved in the maximumnumber of residue–residue contacts with the ligand wassuccessively superimposed onto the different receptor sub-units of the target. The superposition yielding the best fitof the ligands was then used to computed the L_RMS andother related parameters.
The L_RMS is a global measure that depends on the sizeof the ligand. Thus, it may not always provide a goodpicture of the fit at the interface, especially when theligand is large and oriented slightly differently in thepredicted model than in the target. Therefore, it wasagreed to evaluate also the backbone RMSD of interfaceresidues only (I_RMS) and use it as a measure of how the
model fits the target structure in the interface region,realizing well that such measure includes contributionsfrom rigid body motion as well as local conformationalchanges. To that end, the interface residues in the targetwere redefined as those having at least one atom within 10A of an atom on the other molecule. This is twice thethreshold used in defining the residue–residue contactsdescribed above. The backbone of these residues were thensuperimposed on their equivalents in the predicted com-plex to compute the I_RMS.
Atomic Clashes
Early during the analysis, it became obvious that sev-eral prediction procedures produced complexes that fea-tured a very large number of atomic clashes due toappreciable interpenetration of the two molecules and thatsuch interpenetration often artificially increased the frac-tion of native contacts fnat. Therefore, it was agreed toimpose a threshold on the allowed number of clashes forthe predictions submitted for a given target. To that end,we computed the average and standard deviation of thenumber of such clashes in all the predictions for eachtarget and rejected from any further assessment predic-tions where the number of clashes was 2 SD away from theaverage. Clashes were defined as contacts between non-hydrogen atoms separated by �3.0 A.
Ranking the Predictions
As initially suggested by members of the CAPRI manage-ment committee, a major criterion for ranking the pre-dicted complexes was the fraction of native residue–residue contacts (fnat). But because this quantity is sensitiveto the number of atomic clashes and depends on the chosendistance cutoff parameter, a detailed evaluation was per-formed on all the predictions with fnat � 0.1, whereas thosewith lower fnat values were not evaluated further becausethey were considered to represent random solutions.
The evaluated predictions were in turn grouped intofour categories on the basis of the three parameters fnat,L_RMS, and I_RMS. These categories are highly accurate,medium accuracy, acceptable, and incorrect, with predic-
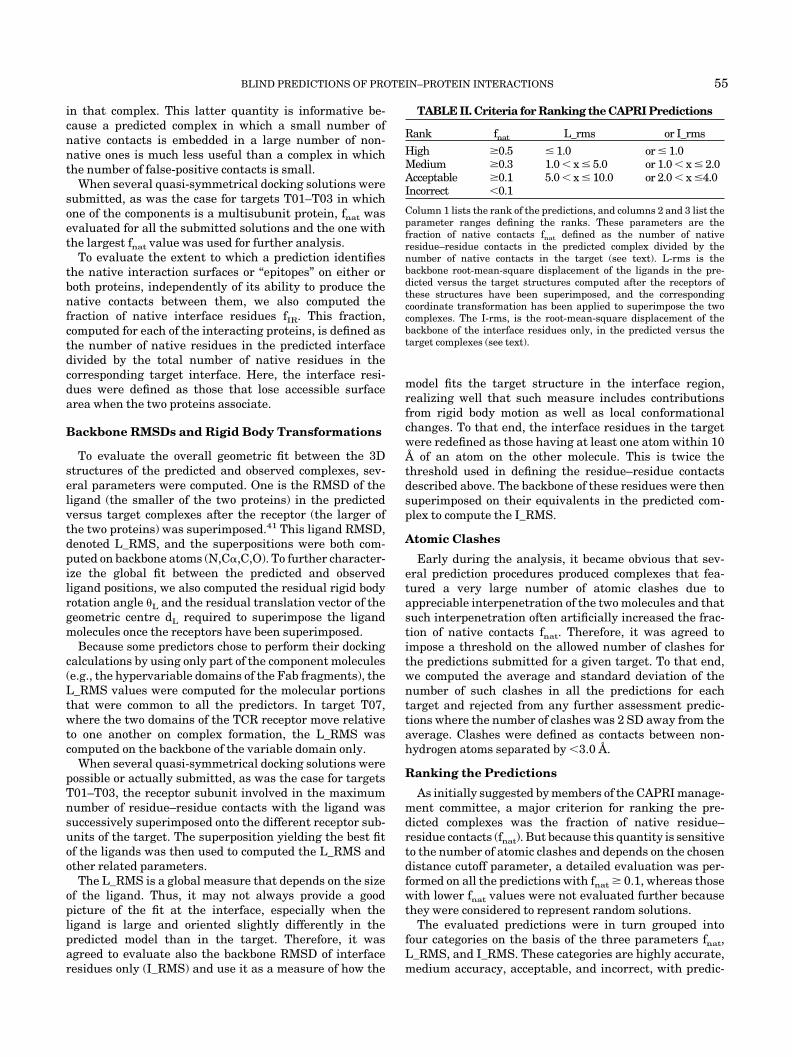
TABLE II. Criteria for Ranking the CAPRI Predictions
Rank fnat L_rms or I_rms
High �0.5 � 1.0 or � 1.0Medium �0.3 1.0 � x � 5.0 or 1.0 � x � 2.0Acceptable �0.1 5.0 � x � 10.0 or 2.0 � x �4.0Incorrect �0.1
Column 1 lists the rank of the predictions, and columns 2 and 3 list theparameter ranges defining the ranks. These parameters are thefraction of native contacts fnat defined as the number of nativeresidue–residue contacts in the predicted complex divided by thenumber of native contacts in the target (see text). L-rms is thebackbone root-mean-square displacement of the ligands in the pre-dicted versus the target structures computed after the receptors ofthese structures have been superimposed, and the correspondingcoordinate transformation has been applied to superimpose the twocomplexes. The I-rms, is the root-mean-square displacement of thebackbone of the interface residues only, in the predicted versus thetarget complexes (see text).
BLIND PREDICTIONS OF PROTEIN–PROTEIN INTERACTIONS 55
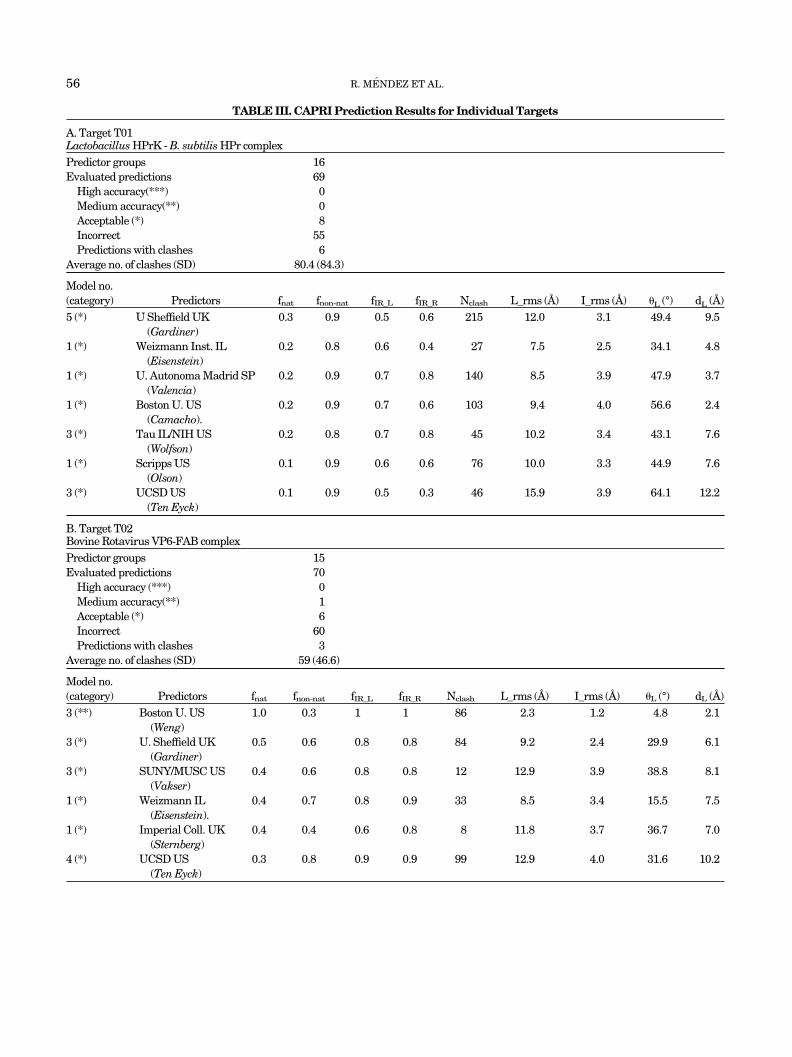
TABLE III. CAPRI Prediction Results for Individual Targets
A. Target T01Lactobacillus HPrK - B. subtilis HPr complexPredictor groups 16Evaluated predictions 69
High accuracy(***) 0Medium accuracy(**) 0Acceptable (*) 8Incorrect 55Predictions with clashes 6
Average no. of clashes (SD) 80.4 (84.3)
Model no.(category) Predictors fnat fnon-nat fIR_L fIR_R Nclash L_rms (A) I_rms (A) �L (°) dL (A)5 (*) U Sheffield UK
(Gardiner)0.3 0.9 0.5 0.6 215 12.0 3.1 49.4 9.5
1 (*) Weizmann Inst. IL(Eisenstein)
0.2 0.8 0.6 0.4 27 7.5 2.5 34.1 4.8
1 (*) U. Autonoma Madrid SP(Valencia)
0.2 0.9 0.7 0.8 140 8.5 3.9 47.9 3.7
1 (*) Boston U. US(Camacho).
0.2 0.9 0.7 0.6 103 9.4 4.0 56.6 2.4
3 (*) Tau IL/NIH US(Wolfson)
0.2 0.8 0.7 0.8 45 10.2 3.4 43.1 7.6
1 (*) Scripps US(Olson)
0.1 0.9 0.6 0.6 76 10.0 3.3 44.9 7.6
3 (*) UCSD US(Ten Eyck)
0.1 0.9 0.5 0.3 46 15.9 3.9 64.1 12.2
B. Target T02Bovine Rotavirus VP6-FAB complexPredictor groups 15Evaluated predictions 70
High accuracy (***) 0Medium accuracy(**) 1Acceptable (*) 6Incorrect 60Predictions with clashes 3
Average no. of clashes (SD) 59 (46.6)
Model no.(category) Predictors fnat fnon-nat fIR_L fIR_R Nclash L_rms (A) I_rms (A) �L (°) dL (A)3 (**) Boston U. US
(Weng)1.0 0.3 1 1 86 2.3 1.2 4.8 2.1
3 (*) U. Sheffield UK(Gardiner)
0.5 0.6 0.8 0.8 84 9.2 2.4 29.9 6.1
3 (*) SUNY/MUSC US(Vakser)
0.4 0.6 0.8 0.8 12 12.9 3.9 38.8 8.1
1 (*) Weizmann IL(Eisenstein).
0.4 0.7 0.8 0.9 33 8.5 3.4 15.5 7.5
1 (*) Imperial Coll. UK(Sternberg)
0.4 0.4 0.6 0.8 8 11.8 3.7 36.7 7.0
4 (*) UCSD US(Ten Eyck)
0.3 0.8 0.9 0.9 99 12.9 4.0 31.6 10.2
56 R. MENDEZ ET AL.
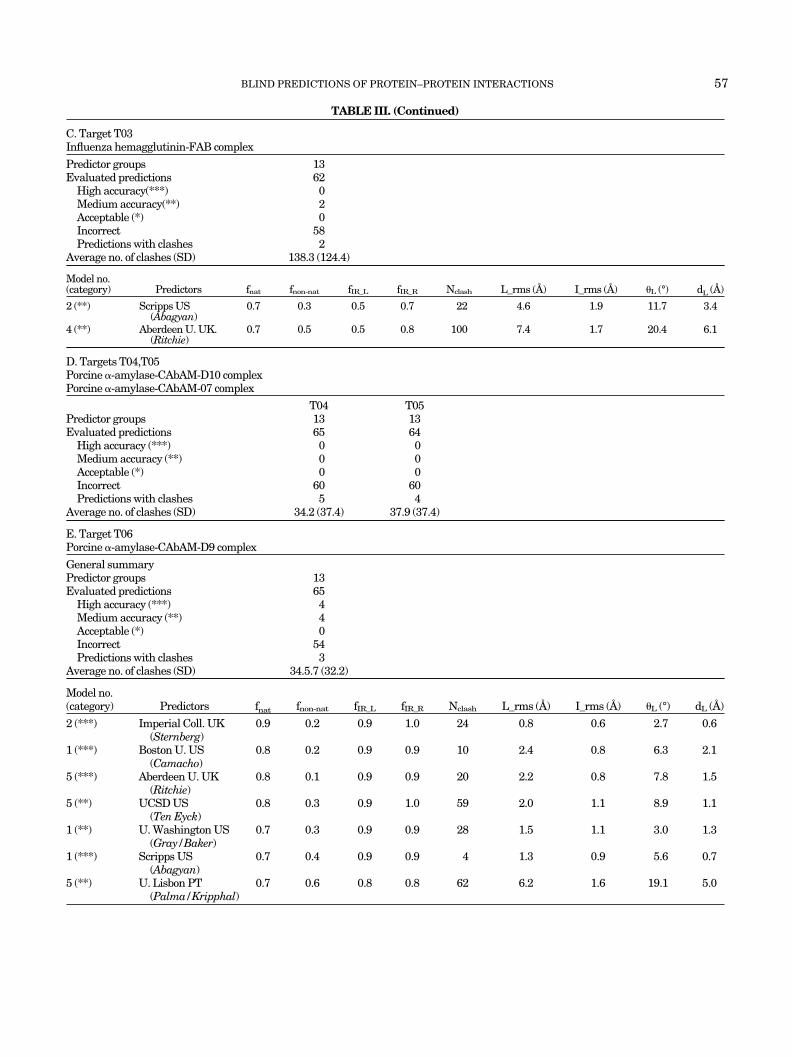
TABLE III. (Continued)
C. Target T03Influenza hemagglutinin-FAB complex
Predictor groups 13Evaluated predictions 62
High accuracy(***) 0Medium accuracy(**) 2Acceptable (*) 0Incorrect 58Predictions with clashes 2
Average no. of clashes (SD) 138.3 (124.4)
Model no.(category) Predictors fnat fnon-nat fIR_L fIR_R Nclash L_rms (A) I_rms (A) �L (°) dL (A)
2 (**) Scripps US(Abagyan)
0.7 0.3 0.5 0.7 22 4.6 1.9 11.7 3.4
4 (**) Aberdeen U. UK.(Ritchie)
0.7 0.5 0.5 0.8 100 7.4 1.7 20.4 6.1
D. Targets T04,T05Porcine �-amylase-CAbAM-D10 complexPorcine �-amylase-CAbAM-07 complex
T04 T05Predictor groups 13 13Evaluated predictions 65 64
High accuracy (***) 0 0Medium accuracy (**) 0 0Acceptable (*) 0 0Incorrect 60 60Predictions with clashes 5 4
Average no. of clashes (SD) 34.2 (37.4) 37.9 (37.4)
E. Target T06Porcine �-amylase-CAbAM-D9 complex
General summaryPredictor groups 13Evaluated predictions 65
High accuracy (***) 4Medium accuracy (**) 4Acceptable (*) 0Incorrect 54Predictions with clashes 3
Average no. of clashes (SD) 34.5.7 (32.2)
Model no.(category) Predictors fnat fnon-nat fIR_L fIR_R Nclash L_rms (A) I_rms (A) �L (°) dL (A)
2 (***) Imperial Coll. UK(Sternberg)
0.9 0.2 0.9 1.0 24 0.8 0.6 2.7 0.6
1 (***) Boston U. US(Camacho)
0.8 0.2 0.9 0.9 10 2.4 0.8 6.3 2.1
5 (***) Aberdeen U. UK(Ritchie)
0.8 0.1 0.9 0.9 20 2.2 0.8 7.8 1.5
5 (**) UCSD US(Ten Eyck)
0.8 0.3 0.9 1.0 59 2.0 1.1 8.9 1.1
1 (**) U. Washington US(Gray/Baker)
0.7 0.3 0.9 0.9 28 1.5 1.1 3.0 1.3
1 (***) Scripps US(Abagyan)
0.7 0.4 0.9 0.9 4 1.3 0.9 5.6 0.7
5 (**) U. Lisbon PT(Palma/Kripphal)
0.7 0.6 0.8 0.8 62 6.2 1.6 19.1 5.0
BLIND PREDICTIONS OF PROTEIN–PROTEIN INTERACTIONS 57
tions of the latter category being considered as equivalentto random solutions. The parameter ranges used to definethese categories are summarized in Table II. As expected,we could observe a correlation between the differentparameters, particularly between the native contact frac-tion and the I_RMS, although mainly for predictionsreasonably close to the correct solution. But this correla-tion tended to break down for poorer predictions.
RESULTS AND DISCUSSION
In this section, the CAPRI evaluation results are pre-sented as follows. First, we describe the results obtainedfor individual targets. Second, an overview is presented ofthe results across predictors and targets, respectively, andthird, an attempt is made to relate the results of thedifferent groups with the methodology used.
A detailed description of all the parameters and all theresults obtained for the seven targets can be found on theCAPRI web site (http://capri.ebi.ac.uk).
Predictions for Individual TargetsTarget T01: HPr-K/P-Hpr complex
Table III(a) summarizes the prediction data for Target01, the Hpr-K/P-Hpr complex. Sixteen groups submitted atotal of 69 nonredundant predictions for this target (predic-tions not related by quasi-symmetry). Of these, six had toomany atomic clashes (more than the threshold of 228atom–atom contacts within 3 A) and were not analyzedfurther. Of the remaining 63 predictions, only 8 were ofacceptable quality (with fnat � 0.1, L_RMS � 10 A andI_RMS � 4 A), and none were of medium or high accuracy.
TABLE III. (Continued)
F. Target T07TCR�-SpeA complex
Predictor groups 14Evaluated predictions 70
High accuracy (***) 5Medium accuracy (**) 7Acceptable (*) 8Incorrect 47Predictions with clashes 3
Average no. of clashes (SD) 33.8 (44.9)
Model no.(category) Predictors fnat fnon-nat fIR_L fIR_R Nclash L_rms (A) I_rms (A) �L (°) dL (A)
1 (**) Boston U. US(Weng)
0.8 0.4 1.0 0.9 42 3.9 1.2 12.0 3.3
1 (***) Weizmann IL(Eisenstein)
0.8 0.2 1.0 0.8 12 2.1 0.9 7.2 1.3
1 (***) Cancer Research UK(Fitzjohn/Bates)
0.8 0.2 1.0 0.9 3 2.6 1.0 10.8 1.7
1 (***) Boston U. US(Camacho)
0.8 0.1 1.0 0.9 2 1.5 0.9 7.0 0.4
1 (***) Tau IL/NIH US(Wolfson)
0.7 0 1.0 0.9 5 1.3 0.6 3.4 0.6
1 (***) U. Washington US(Gray/Baker)
0.6 0.2 0.9 0.9 5 2.2 0.7 7.1 1.5
5 (**) Scripps US(Abagyan)
0.6 0.5 1.0 0.9 3 6.0 1.9 22.6 3.9
1 (*) U. Lisbon PT(Palma/Krippahl)
0.5 0.4 0.9 0.8 13 7.5 2.3 31.6 4.8
3 (*) Imperial Coll. UK(Sternberg)
0.3 0.8 0.6 0.8 15 8.5 3.3 38.1 4.5
Sections (a)–(f) of this table are devoted to the results for individual targets T01–T07. Each section is divided into two main parts. The top partgives a general summary of the predictions, and the bottom part lists the key parameters of the best predictions ranked as acceptable or highersubmitted by each group.The submitted predictions were divided into four categories as detailed in Table II. Predictions with a number of clashes exceeding a definedthreshold were not evaluated. Clashes were defined as those between two non-hydrogen atoms on each side of the interface whose distance was �3 A. The threshold was taken as 2 SD, plus the average of the number of clashes in all the predictions submitted for a given target.Detailed results for the best predictions for each participant, which were of acceptable quality or better (bottom), ranked as indicated in Table II.Column 1 lists the model number (1–5) and the rank of the prediction (high accuracy (***), medium accuracy (**), and acceptable (*). Column 2lists the participant groups in order of decreasing native contact fraction fnat (column 3). Column 3 lists the fraction of non-native contacts fnon-nat,defined as the number of non-native contacts over the total number of contacts in the predicted complex. fIR_L/R is defined as the number of nativeresidues in the predicted interface over the total number of interface residues in the target, computed for both the R (receptor) or L (ligand)molecules. Column 7 (Nclash) lists the number of atomic clashes in the predicted complex. Columns 8 and 9 list the RMSD values. L_RMS is thebackbone RMSD (A) of the ligand molecules in the predicted versus the target complexes after the receptor moieties have been superimposed. TheI_RMS is the interface RMSD (A) computed by superimposing only the backbone of the interface residues from the target complex onto theircounterparts in the predicted complex. The last two columns list the residual rigid body rotation (�L) and translation (dL) of the ligand in thepredicted versus the target complexes after the corresponding receptor molecules have been superimposed. For further details on how the variousparameters were computed, see the text.
58 R. MENDEZ ET AL.
The best of the acceptable predictions obtained for thistarget by each group and their quality measures are listedin Table III(a) (bottom). We see that the prediction withthe highest native contact ratio (fnat � 0.3), by U. Sheffield(Gardiner), has an appreciable number of clashes (215),and a large fraction of non-native contacts (fnon-nat � 0.9).It also features a quite large L_RMS (12 A) of the Hprmolecule whose overall rotation and translation are shiftedby �49° and 9.5 A, respectively [last two column of TableIII(a)]. Despite this, the I_RMS value is relatively low(�3.1 A), reflecting the fact that it measures the fit of thepredicted versus target backbones for interface residuesonly and is not affected by parts of the molecule far wayfrom the interface.
One of the best predictions listed in Table III(a) is thatby the Weizmann (Eisenstein) group. However, this predic-tion has a somewhat lower native contact fraction (fnat �0.2) but also a slightly lower, although still too high,fraction of non-native (fnon-nat � 0.8). It has furthermoresignificantly lower RMSDs (L_RMS � 7.5 A, I_RMS � 2.45A), the deviation of the rigid body rotation and translationparameters of the Hpr molecule are smaller (34° and 4.8A), and the number of clashes is low (27). Except for thepoorer prediction, at the bottom of the list, the remainingones listed in Table III(a) are of roughly comparablequality, although several have a notable number of clashes.
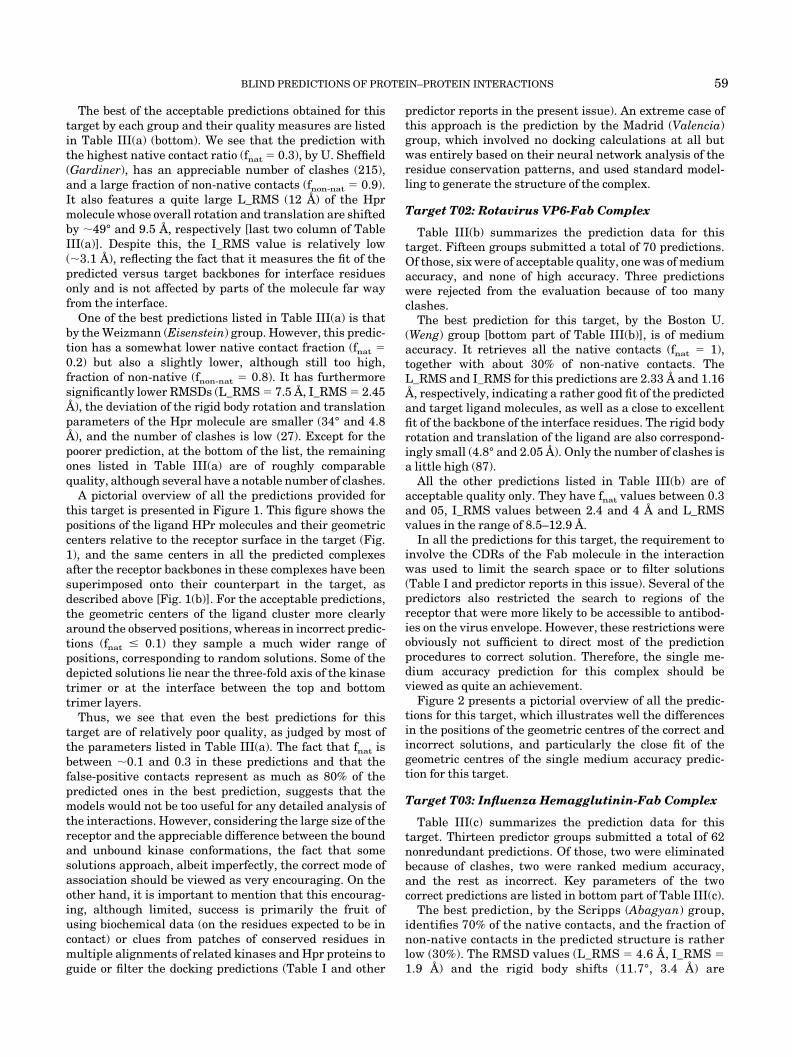
A pictorial overview of all the predictions provided forthis target is presented in Figure 1. This figure shows thepositions of the ligand HPr molecules and their geometriccenters relative to the receptor surface in the target (Fig.1), and the same centers in all the predicted complexesafter the receptor backbones in these complexes have beensuperimposed onto their counterpart in the target, asdescribed above [Fig. 1(b)]. For the acceptable predictions,the geometric centers of the ligand cluster more clearlyaround the observed positions, whereas in incorrect predic-tions (fnat � 0.1) they sample a much wider range ofpositions, corresponding to random solutions. Some of thedepicted solutions lie near the three-fold axis of the kinasetrimer or at the interface between the top and bottomtrimer layers.
Thus, we see that even the best predictions for thistarget are of relatively poor quality, as judged by most ofthe parameters listed in Table III(a). The fact that fnat isbetween �0.1 and 0.3 in these predictions and that thefalse-positive contacts represent as much as 80% of thepredicted ones in the best prediction, suggests that themodels would not be too useful for any detailed analysis ofthe interactions. However, considering the large size of thereceptor and the appreciable difference between the boundand unbound kinase conformations, the fact that somesolutions approach, albeit imperfectly, the correct mode ofassociation should be viewed as very encouraging. On theother hand, it is important to mention that this encourag-ing, although limited, success is primarily the fruit ofusing biochemical data (on the residues expected to be incontact) or clues from patches of conserved residues inmultiple alignments of related kinases and Hpr proteins toguide or filter the docking predictions (Table I and other
predictor reports in the present issue). An extreme case ofthis approach is the prediction by the Madrid (Valencia)group, which involved no docking calculations at all butwas entirely based on their neural network analysis of theresidue conservation patterns, and used standard model-ling to generate the structure of the complex.
Target T02: Rotavirus VP6-Fab Complex
Table III(b) summarizes the prediction data for thistarget. Fifteen groups submitted a total of 70 predictions.Of those, six were of acceptable quality, one was of mediumaccuracy, and none of high accuracy. Three predictionswere rejected from the evaluation because of too manyclashes.
The best prediction for this target, by the Boston U.(Weng) group [bottom part of Table III(b)], is of mediumaccuracy. It retrieves all the native contacts (fnat � 1),together with about 30% of non-native contacts. TheL_RMS and I_RMS for this predictions are 2.33 A and 1.16A, respectively, indicating a rather good fit of the predictedand target ligand molecules, as well as a close to excellentfit of the backbone of the interface residues. The rigid bodyrotation and translation of the ligand are also correspond-ingly small (4.8° and 2.05 A). Only the number of clashes isa little high (87).
All the other predictions listed in Table III(b) are ofacceptable quality only. They have fnat values between 0.3and 05, I_RMS values between 2.4 and 4 A and L_RMSvalues in the range of 8.5–12.9 A.
In all the predictions for this target, the requirement toinvolve the CDRs of the Fab molecule in the interactionwas used to limit the search space or to filter solutions(Table I and predictor reports in this issue). Several of thepredictors also restricted the search to regions of thereceptor that were more likely to be accessible to antibod-ies on the virus envelope. However, these restrictions wereobviously not sufficient to direct most of the predictionprocedures to correct solution. Therefore, the single me-dium accuracy prediction for this complex should beviewed as quite an achievement.
Figure 2 presents a pictorial overview of all the predic-tions for this target, which illustrates well the differencesin the positions of the geometric centres of the correct andincorrect solutions, and particularly the close fit of thegeometric centres of the single medium accuracy predic-tion for this target.
Target T03: Influenza Hemagglutinin-Fab Complex
Table III(c) summarizes the prediction data for thistarget. Thirteen predictor groups submitted a total of 62nonredundant predictions. Of those, two were eliminatedbecause of clashes, two were ranked medium accuracy,and the rest as incorrect. Key parameters of the twocorrect predictions are listed in bottom part of Table III(c).
The best prediction, by the Scripps (Abagyan) group,identifies 70% of the native contacts, and the fraction ofnon-native contacts in the predicted structure is ratherlow (30%). The RMSD values (L_RMS � 4.6 A, I_RMS �1.9 A) and the rigid body shifts (11.7°, 3.4 A) are
BLIND PREDICTIONS OF PROTEIN–PROTEIN INTERACTIONS 59
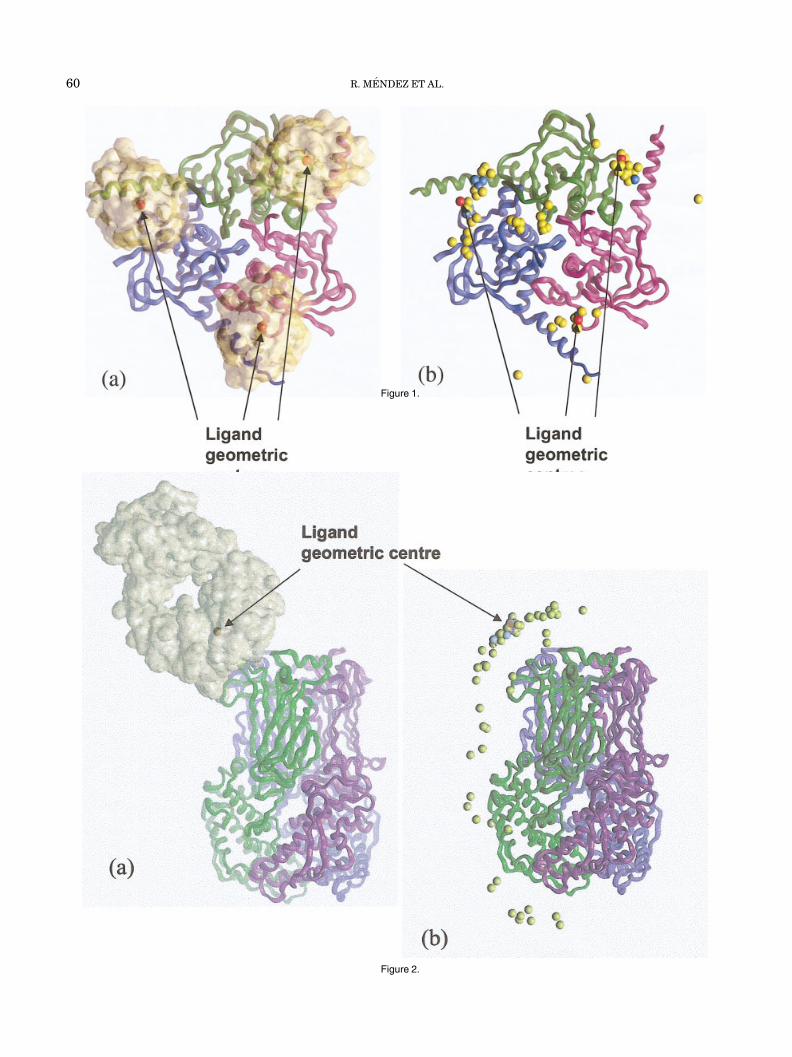
Figure 1.
Figure 2.
60 R. MENDEZ ET AL.
relatively small too, with only 22 clashes. The secondacceptable prediction has the same fraction of nativecontacts, but the fraction non-native contacts is higher(50%), and so are the RMSD values and the number ofclashes. It is rather reassuring to see that both predic-tions are of higher quality than the blind predictionssubmitted for a similar target in a previous contest 6years earlier.30
Two other groups submitted one prediction each thatqualified as acceptable, but these predictions were notassessed here because they were not among the top fivesolutions submitted by these groups.
Here too, most predictors limited the search regions tothe loops of the hypervariable regions of the antibody andto the accessible portions of the antigen. But as for target2, the correct solutions certainly cannot be attributedsolely to these restrictions, especially because virtually allthe predictors used them.
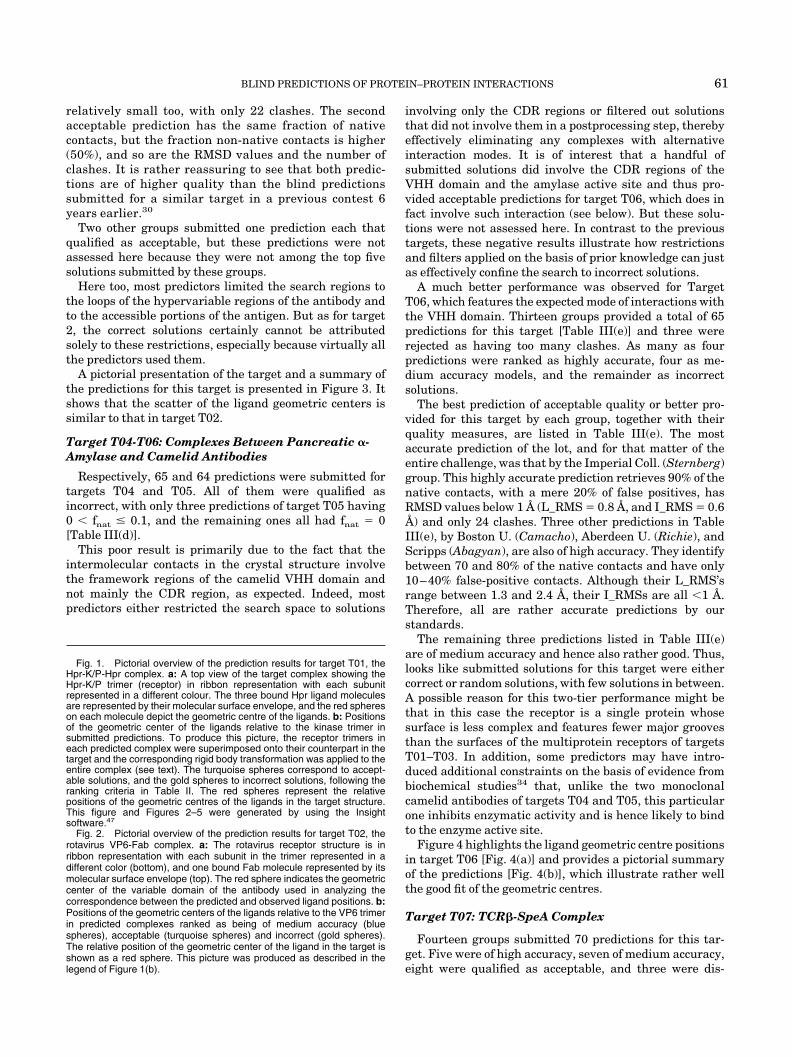
A pictorial presentation of the target and a summary ofthe predictions for this target is presented in Figure 3. Itshows that the scatter of the ligand geometric centers issimilar to that in target T02.
Target T04-T06: Complexes Between Pancreatic �-Amylase and Camelid Antibodies
Respectively, 65 and 64 predictions were submitted fortargets T04 and T05. All of them were qualified asincorrect, with only three predictions of target T05 having0 � fnat � 0.1, and the remaining ones all had fnat � 0[Table III(d)].
This poor result is primarily due to the fact that theintermolecular contacts in the crystal structure involvethe framework regions of the camelid VHH domain andnot mainly the CDR region, as expected. Indeed, mostpredictors either restricted the search space to solutions
involving only the CDR regions or filtered out solutionsthat did not involve them in a postprocessing step, therebyeffectively eliminating any complexes with alternativeinteraction modes. It is of interest that a handful ofsubmitted solutions did involve the CDR regions of theVHH domain and the amylase active site and thus pro-vided acceptable predictions for target T06, which does infact involve such interaction (see below). But these solu-tions were not assessed here. In contrast to the previoustargets, these negative results illustrate how restrictionsand filters applied on the basis of prior knowledge can justas effectively confine the search to incorrect solutions.
A much better performance was observed for TargetT06, which features the expected mode of interactions withthe VHH domain. Thirteen groups provided a total of 65predictions for this target [Table III(e)] and three wererejected as having too many clashes. As many as fourpredictions were ranked as highly accurate, four as me-dium accuracy models, and the remainder as incorrectsolutions.
The best prediction of acceptable quality or better pro-vided for this target by each group, together with theirquality measures, are listed in Table III(e). The mostaccurate prediction of the lot, and for that matter of theentire challenge, was that by the Imperial Coll. (Sternberg)group. This highly accurate prediction retrieves 90% of thenative contacts, with a mere 20% of false positives, hasRMSD values below 1 A (L_RMS � 0.8 A, and I_RMS � 0.6A) and only 24 clashes. Three other predictions in TableIII(e), by Boston U. (Camacho), Aberdeen U. (Richie), andScripps (Abagyan), are also of high accuracy. They identifybetween 70 and 80% of the native contacts and have only10–40% false-positive contacts. Although their L_RMS’srange between 1.3 and 2.4 A, their I_RMSs are all �1 A.Therefore, all are rather accurate predictions by ourstandards.
The remaining three predictions listed in Table III(e)are of medium accuracy and hence also rather good. Thus,looks like submitted solutions for this target were eithercorrect or random solutions, with few solutions in between.A possible reason for this two-tier performance might bethat in this case the receptor is a single protein whosesurface is less complex and features fewer major groovesthan the surfaces of the multiprotein receptors of targetsT01–T03. In addition, some predictors may have intro-duced additional constraints on the basis of evidence frombiochemical studies34 that, unlike the two monoclonalcamelid antibodies of targets T04 and T05, this particularone inhibits enzymatic activity and is hence likely to bindto the enzyme active site.
Figure 4 highlights the ligand geometric centre positionsin target T06 [Fig. 4(a)] and provides a pictorial summaryof the predictions [Fig. 4(b)], which illustrate rather wellthe good fit of the geometric centres.
Target T07: TCR�-SpeA Complex
Fourteen groups submitted 70 predictions for this tar-get. Five were of high accuracy, seven of medium accuracy,eight were qualified as acceptable, and three were dis-
Fig. 1. Pictorial overview of the prediction results for target T01, theHpr-K/P-Hpr complex. a: A top view of the target complex showing theHpr-K/P trimer (receptor) in ribbon representation with each subunitrepresented in a different colour. The three bound Hpr ligand moleculesare represented by their molecular surface envelope, and the red sphereson each molecule depict the geometric centre of the ligands. b: Positionsof the geometric center of the ligands relative to the kinase trimer insubmitted predictions. To produce this picture, the receptor trimers ineach predicted complex were superimposed onto their counterpart in thetarget and the corresponding rigid body transformation was applied to theentire complex (see text). The turquoise spheres correspond to accept-able solutions, and the gold spheres to incorrect solutions, following theranking criteria in Table II. The red spheres represent the relativepositions of the geometric centres of the ligands in the target structure.This figure and Figures 2–5 were generated by using the Insightsoftware.47
Fig. 2. Pictorial overview of the prediction results for target T02, therotavirus VP6-Fab complex. a: The rotavirus receptor structure is inribbon representation with each subunit in the trimer represented in adifferent color (bottom), and one bound Fab molecule represented by itsmolecular surface envelope (top). The red sphere indicates the geometriccenter of the variable domain of the antibody used in analyzing thecorrespondence between the predicted and observed ligand positions. b:Positions of the geometric centers of the ligands relative to the VP6 trimerin predicted complexes ranked as being of medium accuracy (bluespheres), acceptable (turquoise spheres) and incorrect (gold spheres).The relative position of the geometric center of the ligand in the target isshown as a red sphere. This picture was produced as described in thelegend of Figure 1(b).
BLIND PREDICTIONS OF PROTEIN–PROTEIN INTERACTIONS 61
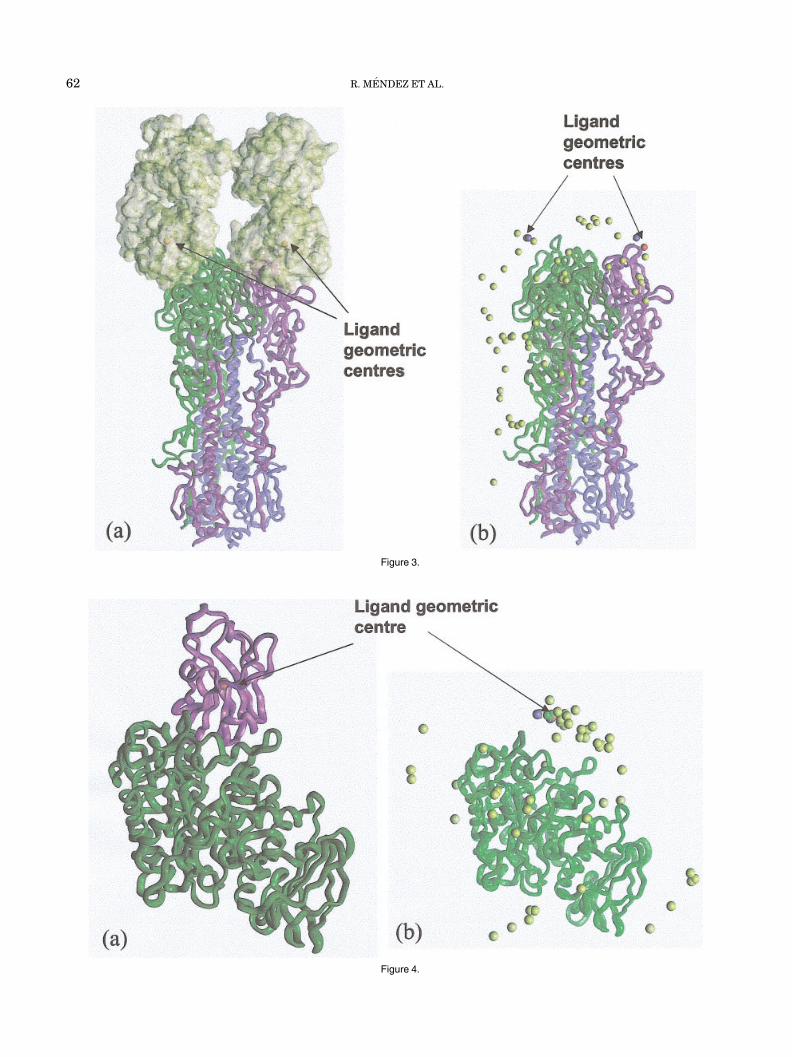
Figure 3.
Figure 4.
62 R. MENDEZ ET AL.
carded for having too many clashes [Table III(f)]. It is ofinterest for this target more than any other, several of thegroups submitted more than one correct prediction, and fortwo groups Tau (Wolfson) and Boston U. (Weng), all thefive submitted predictions were of acceptable quality orbetter.
Table III(f) (bottom) lists the details for the best predic-tion ranked acceptable or higher from each group. The fivehighly accurate predictions identify between 60 and 80% ofthe native contacts and between 0 and 20% of false-positive contacts. Their L_RMSs are between 1.3 and 2.6 Aand I_RMSs are all 1 A or less. The two medium accuracypredictions by the Boton U. (Weng) and Scripps (Abagyan)groups have native contacts fraction of 80% and 60%,respectively, but a larger proportion of false-positive con-tacts (40–50%) and higher L_RMS values (3.9–6.0 A). TheScripps prediction is a borderline case, which is probablybetter ranked as acceptable, because it resembles more thelast two acceptable predictions listed in Table III(f) thanthe better models.
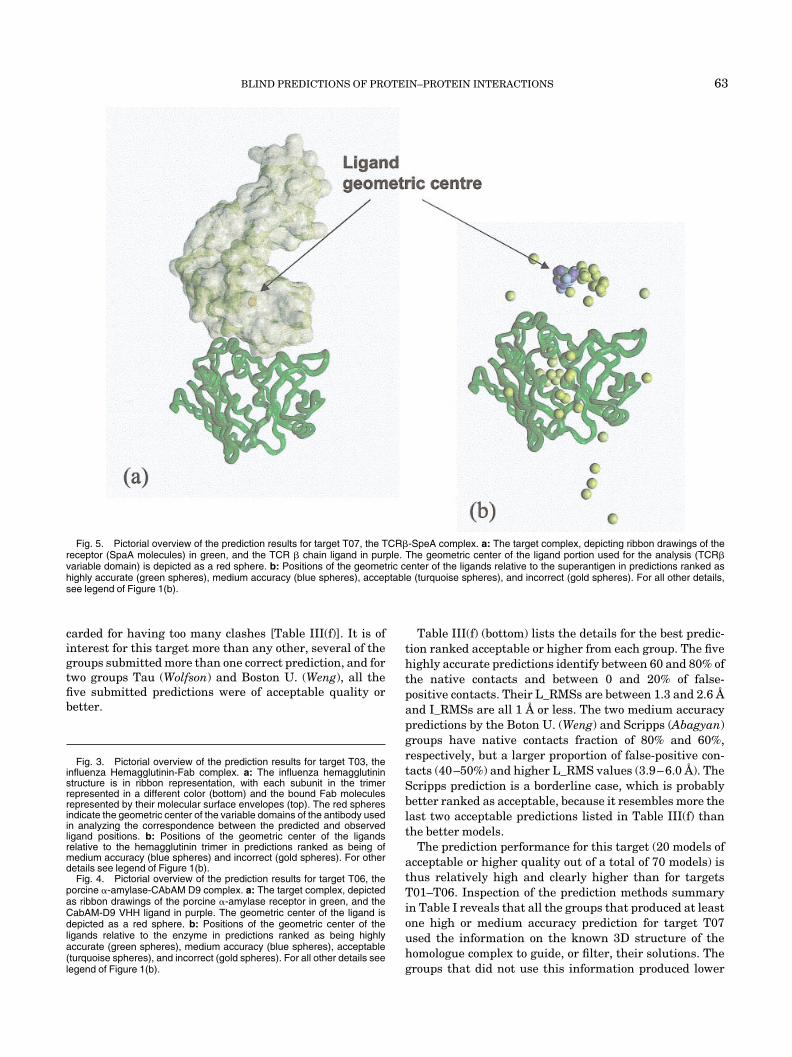
The prediction performance for this target (20 models ofacceptable or higher quality out of a total of 70 models) isthus relatively high and clearly higher than for targetsT01–T06. Inspection of the prediction methods summaryin Table I reveals that all the groups that produced at leastone high or medium accuracy prediction for target T07used the information on the known 3D structure of thehomologue complex to guide, or filter, their solutions. Thegroups that did not use this information produced lower
Fig. 5. Pictorial overview of the prediction results for target T07, the TCR�-SpeA complex. a: The target complex, depicting ribbon drawings of thereceptor (SpaA molecules) in green, and the TCR � chain ligand in purple. The geometric center of the ligand portion used for the analysis (TCR�variable domain) is depicted as a red sphere. b: Positions of the geometric center of the ligands relative to the superantigen in predictions ranked ashighly accurate (green spheres), medium accuracy (blue spheres), acceptable (turquoise spheres), and incorrect (gold spheres). For all other details,see legend of Figure 1(b).
Fig. 3. Pictorial overview of the prediction results for target T03, theinfluenza Hemagglutinin-Fab complex. a: The influenza hemagglutininstructure is in ribbon representation, with each subunit in the trimerrepresented in a different color (bottom) and the bound Fab moleculesrepresented by their molecular surface envelopes (top). The red spheresindicate the geometric center of the variable domains of the antibody usedin analyzing the correspondence between the predicted and observedligand positions. b: Positions of the geometric center of the ligandsrelative to the hemagglutinin trimer in predictions ranked as being ofmedium accuracy (blue spheres) and incorrect (gold spheres). For otherdetails see legend of Figure 1(b).
Fig. 4. Pictorial overview of the prediction results for target T06, theporcine �-amylase-CAbAM D9 complex. a: The target complex, depictedas ribbon drawings of the porcine �-amylase receptor in green, and theCabAM-D9 VHH ligand in purple. The geometric center of the ligand isdepicted as a red sphere. b: Positions of the geometric center of theligands relative to the enzyme in predictions ranked as being highlyaccurate (green spheres), medium accuracy (blue spheres), acceptable(turquoise spheres), and incorrect (gold spheres). For all other details seelegend of Figure 1(b).
BLIND PREDICTIONS OF PROTEIN–PROTEIN INTERACTIONS 63
quality or incorrect predictions. The pictorial summary ofthe predictions for this target is given in Figure 5.
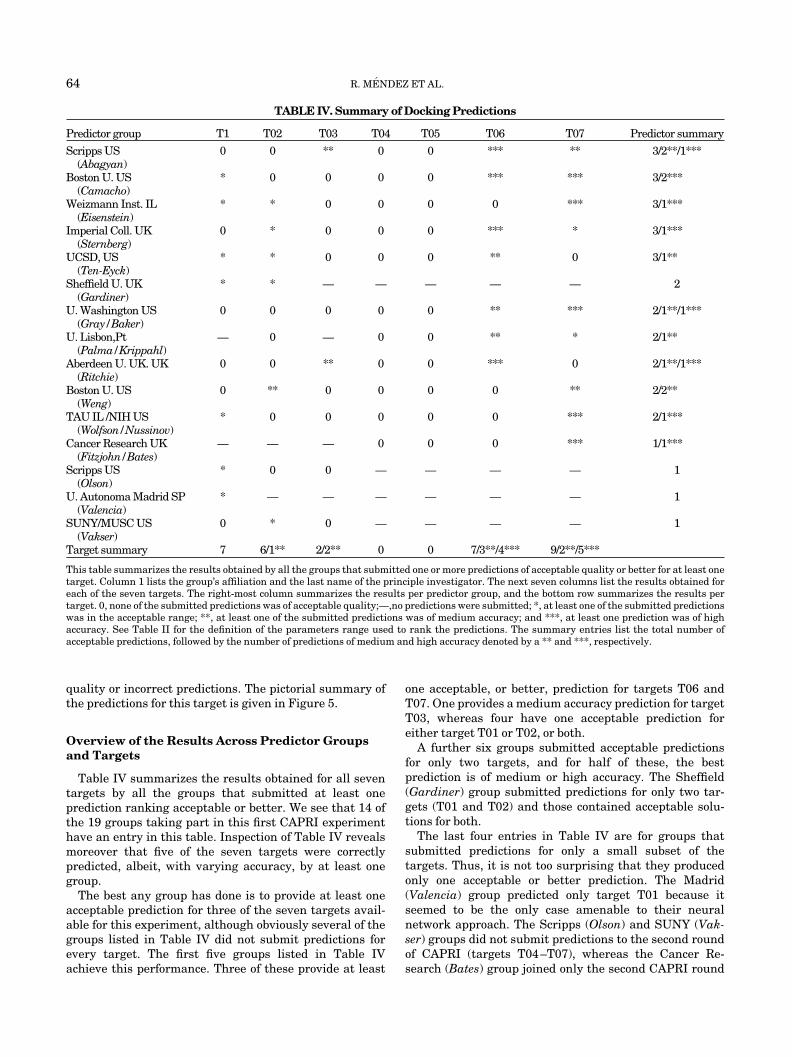
Overview of the Results Across Predictor Groupsand Targets
Table IV summarizes the results obtained for all seventargets by all the groups that submitted at least oneprediction ranking acceptable or better. We see that 14 ofthe 19 groups taking part in this first CAPRI experimenthave an entry in this table. Inspection of Table IV revealsmoreover that five of the seven targets were correctlypredicted, albeit, with varying accuracy, by at least onegroup.
The best any group has done is to provide at least oneacceptable prediction for three of the seven targets avail-able for this experiment, although obviously several of thegroups listed in Table IV did not submit predictions forevery target. The first five groups listed in Table IVachieve this performance. Three of these provide at least
one acceptable, or better, prediction for targets T06 andT07. One provides a medium accuracy prediction for targetT03, whereas four have one acceptable prediction foreither target T01 or T02, or both.
A further six groups submitted acceptable predictionsfor only two targets, and for half of these, the bestprediction is of medium or high accuracy. The Sheffield(Gardiner) group submitted predictions for only two tar-gets (T01 and T02) and those contained acceptable solu-tions for both.
The last four entries in Table IV are for groups thatsubmitted predictions for only a small subset of thetargets. Thus, it is not too surprising that they producedonly one acceptable or better prediction. The Madrid(Valencia) group predicted only target T01 because itseemed to be the only case amenable to their neuralnetwork approach. The Scripps (Olson) and SUNY (Vak-ser) groups did not submit predictions to the second roundof CAPRI (targets T04–T07), whereas the Cancer Re-search (Bates) group joined only the second CAPRI round
TABLE IV. Summary of Docking Predictions
Predictor group T1 T02 T03 T04 T05 T06 T07 Predictor summary
Scripps US(Abagyan)
0 0 ** 0 0 *** ** 3/2**/1***
Boston U. US(Camacho)
* 0 0 0 0 *** *** 3/2***
Weizmann Inst. IL(Eisenstein)
* * 0 0 0 0 *** 3/1***
Imperial Coll. UK(Sternberg)
0 * 0 0 0 *** * 3/1***
UCSD, US(Ten-Eyck)
* * 0 0 0 ** 0 3/1**
Sheffield U. UK(Gardiner)
* * — — — — — 2
U. Washington US(Gray/Baker)
0 0 0 0 0 ** *** 2/1**/1***
U. Lisbon,Pt(Palma/Krippahl)
— 0 — 0 0 ** * 2/1**
Aberdeen U. UK. UK(Ritchie)
0 0 ** 0 0 *** 0 2/1**/1***
Boston U. US(Weng)
0 ** 0 0 0 0 ** 2/2**
TAU IL /NIH US(Wolfson/Nussinov)
* 0 0 0 0 0 *** 2/1***
Cancer Research UK(Fitzjohn/Bates)
— — — 0 0 0 *** 1/1***
Scripps US(Olson)
* 0 0 — — — — 1
U. Autonoma Madrid SP(Valencia)
* — — — — — — 1
SUNY/MUSC US(Vakser)
0 * 0 — — — — 1
Target summary 7 6/1** 2/2** 0 0 7/3**/4*** 9/2**/5***
This table summarizes the results obtained by all the groups that submitted one or more predictions of acceptable quality or better for at least onetarget. Column 1 lists the group’s affiliation and the last name of the principle investigator. The next seven columns list the results obtained foreach of the seven targets. The right-most column summarizes the results per predictor group, and the bottom row summarizes the results pertarget. 0, none of the submitted predictions was of acceptable quality;—,no predictions were submitted; *, at least one of the submitted predictionswas in the acceptable range; **, at least one of the submitted predictions was of medium accuracy; and ***, at least one prediction was of highaccuracy. See Table II for the definition of the parameters range used to rank the predictions. The summary entries list the total number ofacceptable predictions, followed by the number of predictions of medium and high accuracy denoted by a ** and ***, respectively.
64 R. MENDEZ ET AL.
and hence provided no predictions of the first three tar-gets.
It can also be seen that no highly accurate predictionswere obtained for the first three targets, which representthe more difficult prediction problems either due to thelarge size of the molecules, or to conformational differencesbetween the bound and unbound components, or both. Onthe other hand, highly accurate predictions were achievedby several groups for targets T06 and T07.
The excellent results obtained for Target T07 wereclearly the consequence of using structural information ona related complex. But those for target T06 made use onlyof biochemical information on the regions likely to interact(VHH CDRs with the enzyme active site) and are thereforemore directly attributable to the docking procedures them-selves. The use of this type of information, as well as dataon sequence conservation, were most probably key tohaving as many as seven groups producing acceptablepredictions for Target T01 despite the important conforma-tional differences between the bound and unbound kinasemolecules.
Finally, a comment is warranted on the two groupsColumbia (Norel) and Kitasato U. (Umeyama) who submit-ted predictions for all seven targets but produced accept-able predictions for none. The main feature common totheir approaches seemed to be that they made little or nouse of biochemical information. Otherwise, their dockingprocedures are very different, with the Columbia teamusing a more classical FFT procedure, whereas the Kita-sato team used a new hitherto untested algorithm (TableI). Nothing can be said about the two remaining groupswith no acceptable predictions, Aberdeen (Mustard), andNorthwestern (Shoichet), because both submitted predic-tions for a single target, T01 and T07, respectively.
Current Status of Docking Procedure and TheirPotential Applications
This first CAPRI experiment with 465 predictions forseven targets, obtained by using a wide variety of methods,provides a much better overview of the performance ofcurrent docking procedures than hitherto available. Thegood quality predictions obtained here for a number ofdifficult targets clearly shows that progress has beenachieved since docking procedures have last been assessedabout 6 years ago.28–30 But the performance of currentprocedures taken globally is by no means reliable enoughto allow their use as a routine tool. For many real-worldproblems, as in the case of targets T01–T06, only around10% of the submitted predictions are of acceptable qualityor better. Only when detailed structural information isavailable on a related complex in which the interactionmode is conserved, as for Target 07, do we see a highersuccess rate of 30% correct predictions.
Prior knowledge and information on the regions likely tointeract have been used whenever possible on all targetsby most predictors (Table I). The results were positive inmost cases, and predictors who did not consider themclearly lost out. A further indication that using suchinformation was important can be obtained by comparing
the descriptions of the docking procedures in Table I withthe results summary in Table IV. We see indeed that themost successful procedures, those that produced at leastthree predictions of acceptable or higher quality, are basedon very different search algorithms (FFT, rigid bodymechanics molecular mechanics) and scoring functions(geometric only, different empirical, and database-derivedforce fields). Because several other procedures, whichproduced less successful results, used similar algorithmsor scoring function in combination with biochemical knowl-edge, it is tempting to conclude that a successful achieve-ment depends on the manner in which this knowledge isintegrated into the calculation procedure. Thus, morework in this area is clearly a direction for future research.
A legitimate question to address at this stage is underwhich circumstances and for what purpose can currentdocking procedures be useful?
Having found that accurate predictions can be obtainedfor only a subset of problems (molecules are small, limitedconformational changes, biochemical information avail-able, etc.), we can conclude that, at least for such problems,current docking procedures are capable of producing mod-els accurate enough for guiding drug design or for rationalmutagenesis studies. Given that usually these modelsaccurately predict the relative ligand-receptor positionand orientation as well, they should also be useful instructural studies for deriving phase information by mo-lecular replacement42 or for the interpretation of low-resolution electron density maps obtained by electronmicroscopy.40
Medium-accuracy predictions seem to be reachable for awider range of problems, including those with quite largereceptor molecules. But here too, biochemical informationand prior knowledge are needed to guide the calculations.However, the resulting models often contain between 30and 60% of non-native contacts, and although the interfaceRMSDs are within 2 A, detailed side-chain modeling mightnot be straightforward. Therefore, such models are prob-ably not accurate enough for guiding rational drug designor structural studies but should be useful for exploratorymutagenesis and functional analyses.
To enable such applications, however, the correct modelshould be among the top ranking solutions produced by thedocking calculations, a condition largely fulfilled by theacceptable solutions analyzed here, because those wereamong the five top predictions of each group examined inthis evaluation. Moreover, of the 24 high- and medium-accuracy predictions produced for the seven targets, asizeable fraction (60%) corresponds to the top rankingsolutions (models 1 or 2). However, one should recall thatmany predictors reranked their predictions manually(Table I).
Finally, many of the lower accuracy predictions, some-what generously qualified as acceptable in this evaluation,might also be very helpful. We find that many suchpredictions, as well as some of the incorrect predictions,often identify at least 50% of the native residues thatparticipate in the interaction on the receptor, the ligand orboth [fIR_L and fIR_R in Table III(a–f)]. Hence, many of the
BLIND PREDICTIONS OF PROTEIN–PROTEIN INTERACTIONS 65
predictions may be helpful in delineating regions on theprotein surface that are likely to interact. On the otherhand, it is not clear from the present analysis to whatextent current docking procedures can be used for predict-ing if two proteins that are not known to interact before-hand are likely to do so or not. This requires a systematiccomparison of scores of good solutions with those ofrandom ones, something that was not performed here, andundertaken by a few groups only (Eisenstein et al. thisissue).
Prospects for Improving Docking Methods
The very wide panorama of methods used in this firstCAPRI experiment offers unprecedented opportunity forsome useful insights into the directions for future progress.Not too surprising is the recognition that the ability ofdocking methods to single out the correct modes of protein–protein interactions from a large number of incorrect onesis still limited. However, appreciable efforts in this direc-tion are being made already, as judged by the increasedsophistication of the scoring functions used in several ofthe more recent procedures described in Table I. Furtherprogress should be expected as our capacity to judiciouslyapproximate the physical contributions to the free energyof these interactions improves.
Another key component of docking procedures is thealgorithms for sampling rigid body and conformationaldegrees of freedom. Some of these, in particular thespherical polar Fourier correlation or geometric hashingalgorithms, are quite efficient. But often the proceduresthat implement them are not the same as those with themost advanced scoring functions. Therefore, notableprogress could result in the near future from combiningthe best of both worlds.
Handling conformational flexibility remains nonethe-less a major challenge. However, several completely novelprocedures evaluated in this first CAPRI experiment werecapable of handling some conformational flexibility andsimulating more physical docking trajectories. Some ofthese seemed quite promising because they performed noworse than the more classical approaches despite beingstill in an early stage of development.
Thus, there appears to be not only a lot of room forimprovements in docking algorithms but also concreteperspectives in achieving them. Large-scale blind predic-tions and their objective assessment, as done here, areclearly key in monitoring progress in this field. Thereforeit is of paramount importance that other CAPRI experi-ments should follow this one to create a similar momen-tum as that produced by CASP for protein structureprediction methods.
ACKNOWLEDGMENTS
We acknowledge the Marie-Curie Host Training grant(contract num, QLK3-1999-51297), to Raul Mendez forsupport. Thanks go to Jean Richelle for help with com-puter systems and to the rest of the SCMBB (Service deConformation de Macromolecules Biologiques, et Bioinfor-matique) group members for their kind support and friend-
ship. We also thank all the participants and the manage-ment team of this first CAPRI experiment for helpfuldiscussions and valuable input and cooperation. Last butnot least, we express gratitude to all the crystallographersthat provided their X-ray structures before publication.
REFERENCES
1. Kleanthous C. Protein-protein recognition, Oxford UniversityPress; 2000.
2. Janin J, Wodak SJ. The structural basis of macromolecularrecognition. Adv Protein Chem 2002;61:9–73.
3. Jones S, Thornton JM. Principles of protein-protein interactions.Proc Natl Acad Sci USA 1996;93:13–20.
4. Marcotte EM, Pellegrini M, Thompson MJ, Yeates TO, EisenbergD. A combined algorithm for genome-wide prediction of proteinfunction. Nature 1999;402:83–86.
5. Xenarios I, Rice DW, Salwinski L, Baron MK, Marcotte EM,Eisenberg D. DIP: the database of interacting proteins. NucleicAcids Res 2000;28:289–291.
6. Enright AJ, Iliopoulos I, Kyrpides NC, Ouzounis CA. Proteininteraction maps for complete genomes based on gene fusionevents. Nature 1999;402:86–90.
7. Bader GD, Donaldson I, Wolting C, Ouellette BF, Pawson, T,Hogue CW. BIND—the biomolecular interaction network data-base. Nucleic Acids Res 2001;29:242–245.
8. Park J, Lappe M, Teichmann SA. Mapping protein family interac-tions: intramolecular and intermolecular protein family interac-tion repertoires in the PDB and yeast. J Mol Biol 2001;307:929–938.
9. Uetz P, Giot L, Cagney G, Mansfield TA, Judson RS, Knight JR,Lockshon D, Narayan V, Srinivasan M, Pochart P. A comprehen-sive analysis of protein-protein interactions in Saccharomycescerevisiae. Nature 2000;403:623–627.
10. Ito T, Chiba T, Ozawa R, Yoshida M, Hattori M, Sakaki Y. Acomprehensive two-hybrid analysis to explore the yeast proteininteractome. Proc Natl Acad Sci USA 2001;98:4569–4574.
11. Hazbun TR, Fields S. Networking proteins in yeast. Proc NatlAcad Sci USA 2001;98:4277–4278.
12. Rain JC, Selig L, De Reuse H, Battaglia V, Reverdy C, Simon S,Lenzen G, Petel F, Wojcik J, Schachter V. The protein-proteininteraction map of Helicobacter pylori. Nature 2001;409:211–215.
13. Wodak SJ, Janin J. Computer analysis of protein-protein interac-tion. J Mol Biol 1978;124:323–342.
14. Janin J, Wodak SJ. Reaction pathway for the quaternary struc-ture change in hemoglobin. Biopolymers 1985;24:509–526.
15. Halperin I, Ma B, Wolfson H, Nussinov R. Principles of docking:an overview of search algorithms and a guide to scoring functions.Proteins 2002;47:409–43.
16. Jiang F, Kim SH. “Soft docking”: matching of molecular surfacecubes. J Mol Biol 1991;219:79–102.
17. Cherfils J, Duquerroy S, Janin J. Protein-protein recognitionanalyzed by docking simulation. Proteins 1991;11:271–280.
18. Shoichet BK, Kuntz ID. Protein docking and complementarity. JMol Biol 1991;221:327–346.
19. Katchalski-Katzir E, Shariv I, Eisenstein M, Friesem AA, AflaloC, Vakser IA. Molecular surface recognition: determination ofgeometric fit between proteins and their ligands by correlationtechniques. Proc Natl Acad Sci USA 1992;89:2195–2199.
20. Norel R, Fischer D, Wolfson HJ, Nussinov R. Molecular surfacerecognition by a computer vision-based technique. Protein Eng1994;7:39–46.
21. Totrov M, Abagyan R. Detailed ab initio prediction of lysozyme-antibody complex with 1.6 A accuracy. Nat Struct Biol 1994;1:259–263.
22. Vakser IA. Protein docking for low-resolution structures. ProteinEng 1995;8:371–377.
23. Meyer M, Wilson P, Schomburg D. Hydrogen bonding and molecu-lar surface shape complementarity as a basis for protein docking.J Mol Biol 1996;264:199–210.
24. Gabb HA, Jackson RM, Stemberg MJ. Modelling protein dockingusing shape complementarity, electrostatics and biochemical infor-mation. J Mol Biol 1997;272:106–120.
25. Ackermann F, Hermann G, Posch S, Sagerer G. Estimation andfiltering of potential protein-protein docking positions. Bioinformat-ics 1998;14:196–205.
66 R. MENDEZ ET AL.
26. Camacho CJ, Weng Z, Vajda S, DeLisi C. Free energy landscapesof encounter complexes in protein-protein association. Biophys J1999;76:1166–1178.
27. Ritchie DW, Kemp GJ. Protein docking using spherical polarFourier correlations. Proteins 2000;39:178–194.
28. Strynadka NC, Eisenstein M, Katchalski-Kazir E, Shoichet BK,Kuntz ID, Abagyan R, Totrov M, Janin J. Zimmerman F. Molecu-lar docking programs successfully predict the binding of a beta-lactamase inhibitory protein to TEM-1 beta-lactamase. Nat StructBiol 1996;3:233–239.
29. Dixon JS. Evaluation of the CASP2 docking session. Proteins1997;Suppl 1:198–204.
30. Vakser IA. Evaluation of GRAMM low ressolution docking meth-odology on the hemaglutinin-antibody complex. Proteins 1997;Suppl 1:226–230.
31. Moult J. Predicting protein three-dimensional structure. CurrOpin Biotechnol 1999;10:583–588.
32. Fieulaine S, Morera S, Poncet S, Mijakovic I, Galinier A, Janin J,Deutscher J, Nessler S. X-ray structure of a bifunctional proteinkinase in complex with its protein substrate HPr. Proc Natl AcadSci USA 2002;99:13437–13441.
33. Barbey-Martin C, Gigant B, Bizebard T, Calder LJ, Wharton SA,Skehel JJ, Knossow M. An antibody that prevents the hemaggluti-nin low pH fusogenic transition. Virology 2002 Mar 1;294:70–74.
34. Desmyter A, Spinelli S, Payan F, Lauwereys M, Wyns L, Muylder-mans S, Cambillau C. Three camelid VHH domains in complexwith porcine pancreatic alpha-amylase. Inhibition and versatilityof binding topology. J Biol Chem 2002;277:23645–23650.
35. Sundberg EJ, Li H, Llera AS, McCormick JK, Tormo J, SchlievertPM, Karjalainen K, Mariuzza RA. Structures of two streptococcalsuperantigens bound to TCR beta chains reveal/diversity in thearchitecture of T cell signaling. Structure (Camb) 2002;10:687–699.
36. Lo Conte L, Chothia C, Janin J. The atomic structure of protein-protein recognition sites. J Mol Biol 1999;285:2177–2198.
37. Thouvenin E, Schoehn G, Rey FA, Petitpas I, Mathieu M, Vaney
MC, Cohen J, Kohli E, Pothier P, Hewat E. Antibody Inhibition ofthe transcriptase activity of the rotavirus DLP: a structural view.J Mol Biol 2001;307:161–172.
38. Wang H. Grid-search molecular accessible surface algorithm forsolving the protein docking problem. J Comp Chem 1991;12:746–750.
39. Delhaise P, Bardiaux M, De Maeyer M, Prevost M, Van Belle D,Donneux J, Lasters I, Van Cutsem E, Alard P, Wodak SJ. TheBRUGEL package: toward computer-aided design of macromol-ecules. J Mol Graphics 1988;6:219.
40. Wriggers W, Milligan RA, McGammon JA. Situs: a package fordocking crystal structures into low-resolution maps from electronmicroscopy. J Struct Biol 1999;125:185–195.
41. McLachlan AD. Gene duplications in the sructural evolution ofchymotrypsin. J Mol Biol 1979;128:49–79.
42. Navaza J. Implantation of molecular replacement in AMoRe. ActaCrystallogr D. Biol Crystallogr 2001;57:1367–1372.
43. de Groot BL, van Aalten DMF, Scheek RM, Amadei A, Vriend G,Berendsem HJC. Prediction of protein conformational freedomfrom distance constraints. Proteins 1997;29:241–251.
44. Thouvenin E, Schoehn G, Rey F, Petitpas I, Mathieu M, VaneyMC, Cohen J, Kohli E, Pothier P, Hewat E. Antibody inhibition ofthe transcriptase activity of the rotavirus DLP: a structural view.J Mol Biol 2001;307:161–172.
45. Gigant B, Barbey-Martin C, Bizebard T, Fleury D, Daniels R,Skehel JJ, Knossow. A neutralizing antibody Fab-influenza haem-agglutinin complex with an unprecedented 2:1 stoichiometry:characterization and crystallization. Acta Crystallogr D 2000;56:1067–1069.
46. Duncan B, Olson A. Applications of evolutionary programming forthe prediction of protein-protein interactions. Evolutionary pro-gramming V. Proceedings of the 5th annual conference on evolu-tionary programming. Boston, MA: MIT Press; 1996.
47. Dayringer, H.E., Tramontano A., Sprang, S.R., Fletterick, R.J.,Interactive program for visualization and modeling of proteins,nucleic-acids and small molecules. J Mol Graph 1986;4:82.
BLIND PREDICTIONS OF PROTEIN–PROTEIN INTERACTIONS 67


![FFAS server: novel features and applications · 2017. 4. 14. · structural predictions using sequence information. Protein Science: a Publication of the Protein Society, 9, 232–241]](https://img.pdfslide.us/doc/110x75/5fd4a0ab4618f23b9c177df5/ffas-server-novel-features-and-applications-2017-4-14-structural-predictions.jpg)