Embed Size (px)
Citation preview
proteinsSTRUCTURE O FUNCTION O BIOINFORMATICS
Ab initio protein structure assembly usingcontinuous structure fragments andoptimized knowledge-based force fieldDong Xu1 and Yang Zhang1,2*1Department of Computational Medicine and Bioinformatics, University of Michigan, Ann Arbor, Michigan 48109
2Department of Biological Chemistry, University of Michigan, Ann Arbor, Michigan 48109
INTRODUCTION
Despite significant effort, we still have very limited abilityto fold proteins by ab initio approaches, that is, to predict3D structures of protein sequences without using templatestructures from other experimentally solved proteins. Suc-cessful cases have been witnessed only on small proteinswith length below 100 residues, and with a root meansquared deviation (RMSD) typically above 2–5 A.1–6 Thedifficulty of ab initio protein structure prediction is twofold.First, we lack decent force fields to accurately describe theatomic interactions which can be used to guide the proteinfolding simulations. Apparently, force fields with an incor-rectly located global minimum will undoubtedly misfoldthe target proteins. Although the physics-based atomic forcefields7,8 can provide a reasonable description of proteinatomic interactions in many aspects, the implementationrequests atomic-level representation which is often too slowto fold a protein structure from scratch. The knowledge-
based potentials, which are often in reduced forms andderived from statistical regularities of structures in the Pro-tein Data Bank (PDB),9 have shown power in both proteinfold recognition and structure assembly simulations,10,11
where appropriate selections of reference states and struc-tural features are proven to be of critical importance.12
Additional Supporting Information may be found in the online version of this ar-
ticle.
Abbreviations: NN, neural network; REMC, replica-exchange Monte Carlo;
RMSD, root mean squared deviation; SA, solvent accessibility; SS, secondary
structure.
Grant sponsor: The NSF Career Award; Grant number: DBI 1027394; Grant spon-
sor: The National Institute of General Medical Sciences; Grant number:
GM083107, GM084222
*Correspondence to: Yang Zhang, Department of Computational Medicine and
Bioinformatics, University of Michigan, Ann Arbor, MI 48109.
E-mail: [email protected].
Received 7 November 2011; Revised 23 January 2012; Accepted 3 March 2012
Published online 12 March 2012 in Wiley Online Library (wileyonlinelibrary.com).
DOI: 10.1002/prot.24065
ABSTRACT
Ab initio protein folding is one of the major unsolved problems in computational biology owing to the difficulties in force
field design and conformational search. We developed a novel program, QUARK, for template-free protein structure predic-
tion. Query sequences are first broken into fragments of 1–20 residues where multiple fragment structures are retrieved at
each position from unrelated experimental structures. Full-length structure models are then assembled from fragments
using replica-exchange Monte Carlo simulations, which are guided by a composite knowledge-based force field. A number
of novel energy terms and Monte Carlo movements are introduced and the particular contributions to enhancing the effi-
ciency of both force field and search engine are analyzed in detail. QUARK prediction procedure is depicted and tested on
the structure modeling of 145 nonhomologous proteins. Although no global templates are used and all fragments from ex-
perimental structures with template modeling score >0.5 are excluded, QUARK can successfully construct 3D models of
correct folds in one-third cases of short proteins up to 100 residues. In the ninth community-wide Critical Assessment of
protein Structure Prediction experiment, QUARK server outperformed the second and third best servers by 18 and 47%
based on the cumulative Z-score of global distance test-total scores in the FM category. Although ab initio protein folding
remains a significant challenge, these data demonstrate new progress toward the solution of the most important problem
in the field.
Proteins 2012; 80:1715–1735.VVC 2012 Wiley Periodicals, Inc.
Key words: hydrogen bonding; Monte Carlo simulation; protein folding; protein structure prediction; solvent accessibility;
statistical potential.
VVC 2012 WILEY PERIODICALS, INC. PROTEINS 1715
Second, given the force fields, we have difficulties in
efficiently identifying the global energy minimum which
is supposed to be the protein native state in thermody-
namic hypothesis assumption,13 because most of the
composite force fields are characterized with numerous
local energy minima which can easily trap the folding
simulations. One way of speeding up the computational
search process is to reduce the size of the search space.
For example, in TOUCHSTONE,4 the authors con-
strained the conformational change of protein structure
on a lattice system. In Rosetta,14 TASSER,15 and I-
TASSER,16 fragment sequences have the structures cop-
ied from PDB templates which are kept rigid during the
simulation. Rosetta also keeps the bond lengths and
bond angles fixed which further decreases the degrees of
freedom. These techniques can help to significantly
reduce the search space because of the constraint of con-
formational movements. Nevertheless, it is essential to
have the resolution of conformational representations not
limited by the constraints. In TOUCHSTONE, the pro-
gram implemented a grid size of 0.87 A which resulted in
an average resolution of 0.5 A in RMSD. In Rosetta and
TASSER programs, as the fragments are off-lattice, the
conformation should have no resolution limit if the frag-
ment structures are ideally selected.
Another way of increasing the efficiency of conforma-
tional search, which is also associated with the reduction
in the size of the search space, is to reduce the level of
protein structure representation. For example, in
UNRES,17 a protein residue is represented by three units
of Ca atom, side-chain ellipsoid, and peptide group. In
I-TASSER,16,18 each residue is specified by two units of
Ca atom and side-chain center of mass. These reductions
of structure representation can dramatically reduce the
total number of conformations needed for searching.
However, although the reduced models have the gain in
conformational search, they may suffer a lower accuracy
of energy force field design. Finally, a central theme in
protein conformational search is the appropriate design
of conformational updating and optimization algorithms,
with examples including Monte Carlo and molecule dy-
namics simulations, which will essentially decide the effi-
ciency of the overall conformational search.
In this study, we develop a new algorithm, QUARK, for
ab initio protein structure prediction, with the focus on
the elaborate design of both the force field and the search
engine. To facilitate the force field development and search
engine design, QUARK takes a semi-reduced model to
represent protein residues by the full backbone atoms and
the side-chain center of mass. For a query sequence, it first
predicts a variety of carefully selected structural features by
neural network (NN). The global fold is then generated by
replica-exchange Monte Carlo (REMC) simulations by
assembling the small fragments as generated by gapless
threading through template library, an idea borrowed
from Rosetta and I-TASSER; but different from Rosetta
and I-TASSER which have the fragments in either 3/9-mer
or from threading alignments, the fragments in QUARK
have continuously multiple sizes from 1 to 20 residues.
Meanwhile, in contrast to the pure fragment substitutions
as taken by Rosetta and the fixed fragment rotation as
taken by I-TASSER, QUARK simulations contain compos-
ite movements of free-chain constructions and fragment
substitutions between decoy and fragment structures.
These techniques have significantly increased the structural
flexibility and the efficiency of conformational search while
taking the advantage of the reduction of the conforma-
tional search owing to fragment assembly.
We then conducted a systematical test and analysis of
QUARK in ab initio structure prediction on the basis of
145 small- to medium-sized globular proteins, on the
control with other top ab initio modeling methods. As
these proteins are taken from the PDB, we made a series
of stringent filters to rule out homologous information
from the template library. We also tested the method in
the ninth Critical Assessment of protein Structure Predic-
tion (CASP9) experiment. Although the blind CASP
experiment has a much smaller test set of free modeling
(FM) targets, some being nonglobular, it offers a valuable
opportunity to objectively benchmark the method in
comparison with all other state-of-the-art programs in
the field.
MATERIALS AND METHODS
Construction of benchmarking datasets
As ab initio folding methods are designed to predict
protein structures without using templates, it is impor-
tant to establish a stringent benchmarking protein set
which completely excludes global topology information
of templates. This is essential to train, test, and evaluate
the method developments, especially in the situation
where most of the top-performing methods in the field
were designed to exploit fragment structures from experi-
mental structures to assemble the models of target pro-
tein sequences.5,14 The importance and difficulty of ab
initio benchmarking were also reflected in the commu-
nity-wide blind CASP experiments,19,20 where the por-
tion of FM targets has been consistently decreasing owing
to the difficulties in collecting individual protein
domains which have different folds from the existing
proteins in the PDB. Even among the limited FM targets,
there are an increasing portion of proteins which lack of
globular compact shapes, owing to the fact that they are
often isolated from a small region of interaction com-
plexes, which can prevent them from being useful assess-
ment targets for ab initio folding methods.
We first obtain a nonredundant set of 6023 high-reso-
lution experimental structures from the PISCES server,21
which are culled from the whole PDB based on the iden-
tity cutoff 25%, resolution cutoff 1.8 A, and R-factor cut-
D. Xu and Y. Zhang
1716 PROTEINS
off 0.25. All the statistical potentials used in the QUARK
simulation are derived from this protein set. We also use
the same template library for retrieving fragment struc-
tures of various lengths for each query sequence. As the
purpose of ab initio prediction is to handle the targets
which have no homologous templates hit by threading
algorithms and are inaccurate to predict by template-
based methods, protein sequences we choose for training
and test are the ‘‘Hard’’ targets classified by the LOcal
MEta-Threading Server (LOMETS).22 We first run
LOMETS for all the sequences in the PISCES list, where
homologous templates with sequence identities larger
than 30% to each query sequence are excluded from the
threading template library. In total, 665 sequences are
considered as ‘‘Hard’’ targets by LOMETS, where a
‘‘Hard’’ target means none of the threading algorithms
detects a template with the Z-score higher than the given
cutoff. The Z-score cutoffs of the nine threading algo-
rithms in LOMETS are determined by minimizing the
false-positive and false-negative rates.22 We manually
check the native structures of the 665 protein chains and
exclude the targets which have obvious broken chains or
incompact shapes. The remaining list contains 413 pro-
teins. To quickly train the various parameters during the
design of energy terms and movements, we randomly
selected 88 small globular proteins as the training set
from the remaining list of ‘‘Hard’’ targets. The lengths of
protein chains in the training set are in the range of
70–100 amino acids. To test the modeling accuracy of the
QUARK method, 145 globular proteins are randomly
selected as the test set from the remaining list, which is
further divided into two subsets: 51 small proteins
(70–100 amino acids) and 94 medium-sized proteins
(100–150 amino acids). The lists of the training and test
proteins are available at http://zhanglab.ccmb.med.umi-
ch.edu/QUARK/list.txt.
As two movements in QUARK use fragments from ex-
perimental structures and one energy term is derived
from the structural fragments, to avoid the potential
influence from homologous templates, we use three fil-
ters to exclude homologous templates when generating
the position-specific fragments. First, all the template
proteins whose sequence identities to the target sequence
are >30% are removed. Second, we run MUSTER
threading program through the QUARK template library.
All the templates with a template modeling score (TM-
score) of >0.3 in the MUSTER alignment are removed
from the QUARK template library. Third, we run TM-
align23 to superimpose each template to the target struc-
ture. All the templates with a TM-score of >0.5 will be
removed. We have observed that nonhomologous tem-
plates, if they have global structural similarity to the tar-
get, will have considerable impact to the fragment-based
assembly results. In the third filter, all structurally similar
templates are removed even they have low-sequence
homology to the target sequence.
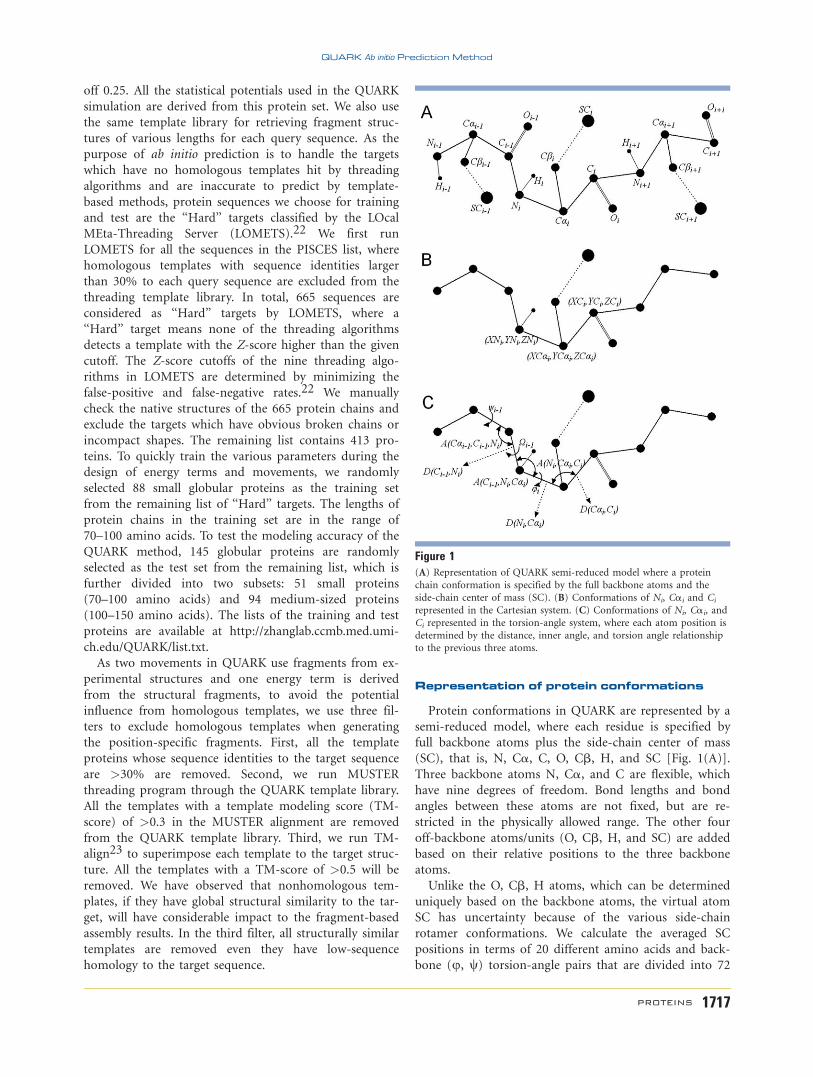
Representation of protein conformations
Protein conformations in QUARK are represented by a
semi-reduced model, where each residue is specified by
full backbone atoms plus the side-chain center of mass
(SC), that is, N, Ca, C, O, Cb, H, and SC [Fig. 1(A)].
Three backbone atoms N, Ca, and C are flexible, which
have nine degrees of freedom. Bond lengths and bond
angles between these atoms are not fixed, but are re-
stricted in the physically allowed range. The other four
off-backbone atoms/units (O, Cb, H, and SC) are added
based on their relative positions to the three backbone
atoms.
Unlike the O, Cb, H atoms, which can be determined
uniquely based on the backbone atoms, the virtual atom
SC has uncertainty because of the various side-chain
rotamer conformations. We calculate the averaged SC
positions in terms of 20 different amino acids and back-
bone (u, w) torsion-angle pairs that are divided into 72
Figure 1(A) Representation of QUARK semi-reduced model where a protein
chain conformation is specified by the full backbone atoms and the
side-chain center of mass (SC). (B) Conformations of Ni, Cai and Ci
represented in the Cartesian system. (C) Conformations of Ni, Cai, and
Ci represented in the torsion-angle system, where each atom position is
determined by the distance, inner angle, and torsion angle relationshipto the previous three atoms.
QUARK Ab initio Prediction Method
PROTEINS 1717
bins with an interval p/36, summarized from the 6023
high-resolution experimental structures. The SC position
of each residue is therefore decided based on the residue
type and the backbone torsion angles, which has also
been implemented in ModRefiner24 for main-chain
energy minimization.
During the simulation, we represent each reduced
model in two coordinate systems: Cartesian system and
torsion-angle system. In the Cartesian system, backbone
atoms are represented by their 3D coordinates, whereas in
the torsion-angle system they are represented by bond
lengths, bond angles, and torsion angles [Fig. 1(B,C)].
Some movements change only 3D coordinates of the
atoms which can be easily modified in the Cartesian sys-
tem. Other movements change only the bond length,
bond angle, or torsion angle, which can be changed con-
veniently in the torsion-angle system. If the coordinates
are changed in one system, the new coordinates in the
other system are updated correspondingly as the two sys-
tems are exchangeable. The two different coordinate sys-
tems are also useful in the calculation of different energy
terms after each movement. For example, pair-wise energy
terms rely on the 3D coordinates of atoms, whereas tor-
sion-angle term is based on the backbone torsion angles.
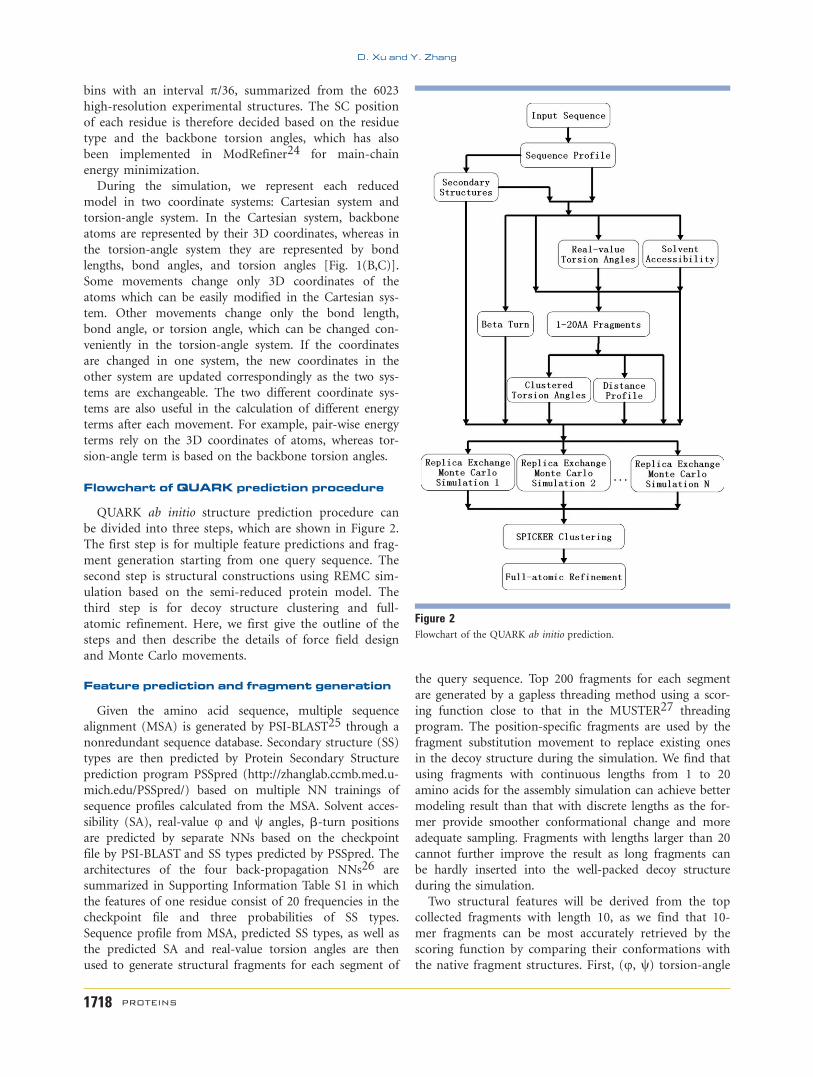
Flowchart of QUARK prediction procedure
QUARK ab initio structure prediction procedure can
be divided into three steps, which are shown in Figure 2.
The first step is for multiple feature predictions and frag-
ment generation starting from one query sequence. The
second step is structural constructions using REMC sim-
ulation based on the semi-reduced protein model. The
third step is for decoy structure clustering and full-
atomic refinement. Here, we first give the outline of the
steps and then describe the details of force field design
and Monte Carlo movements.
Feature prediction and fragment generation
Given the amino acid sequence, multiple sequence
alignment (MSA) is generated by PSI-BLAST25 through a
nonredundant sequence database. Secondary structure (SS)
types are then predicted by Protein Secondary Structure
prediction program PSSpred (http://zhanglab.ccmb.med.u-
mich.edu/PSSpred/) based on multiple NN trainings of
sequence profiles calculated from the MSA. Solvent acces-
sibility (SA), real-value u and w angles, b-turn positions
are predicted by separate NNs based on the checkpoint
file by PSI-BLAST and SS types predicted by PSSpred. The
architectures of the four back-propagation NNs26 are
summarized in Supporting Information Table S1 in which
the features of one residue consist of 20 frequencies in the
checkpoint file and three probabilities of SS types.
Sequence profile from MSA, predicted SS types, as well as
the predicted SA and real-value torsion angles are then
used to generate structural fragments for each segment of
the query sequence. Top 200 fragments for each segment
are generated by a gapless threading method using a scor-
ing function close to that in the MUSTER27 threading
program. The position-specific fragments are used by the
fragment substitution movement to replace existing ones
in the decoy structure during the simulation. We find that
using fragments with continuous lengths from 1 to 20
amino acids for the assembly simulation can achieve better
modeling result than that with discrete lengths as the for-
mer provide smoother conformational change and more
adequate sampling. Fragments with lengths larger than 20
cannot further improve the result as long fragments can
be hardly inserted into the well-packed decoy structure
during the simulation.
Two structural features will be derived from the top
collected fragments with length 10, as we find that 10-
mer fragments can be most accurately retrieved by the
scoring function by comparing their conformations with
the native fragment structures. First, (u, w) torsion-angle
Figure 2Flowchart of the QUARK ab initio prediction.
D. Xu and Y. Zhang
1718 PROTEINS
pairs at each residue position are clustered by standard
clustering algorithms and at most 30 torsion-angle pairs
are selected for each residue position. The reduced num-
ber of torsion angles along with their associated bond
lengths and bond angles constitute a look-up table,
which will be efficiently used in one local movement dur-
ing the simulation. The second important feature
extracted from fragments is the distance profile, which is
a histogram distribution of pair-wise distances extracted
from unrelated experimental structures based on the
occurrence of fragments at different positions but from
the same templates. The derivation and usage of distance
profile will be described in the following section.
The predicted SA is also used in the energy term
which is represented as the difference between the pre-
dicted value and the actual value of the structural decoy.
The predicted three-state SS types will guide the simula-
tion to generate decoy structures with the similar SS
types. We do not restrict the decoy to have exactly the
same SS types as the PSSpred prediction. If one template
fragment is successfully placed into the decoy by the frag-
ment substitution movement, this segment will have the
same SS types as the fragment structure, rather than the
PSSpred prediction. The predicted probabilities of b-turnpositions will be used to guide one movement for b-turnformation.
REMC simulation
There are in total 40 replicas implemented in the
REMC simulation. As the average energy in low-tempera-
ture replicas gets saturated in near 100 cycles for most of
our training proteins, around 200 cycles are run for each
protein by default. However, the simulation will be ter-
minated if the variation of the average energy of the 10
low-temperature replicas is smaller than 1024 times of
the average energy.
The initial structure for each replica is constructed by
randomly connecting the randomly selected fragments
with different lengths. We run 10 different REMC simula-
tions with different starting random numbers. The Lehmer
random number generator28 is used for random number
generation, which has 256 different streams with a long
period (2.15E9) in each stream. In our benchmark test,
the TM-score29 of the first model clustered from 10
REMC simulations is on average 15% better than that
from one simulation. However, there are no notable differ-
ences when more than 10 simulations are implemented.
Decoy clustering and full-atomic refinement
In total, 5000 decoys randomly selected from the last
150 cycles of the 10 low-temperature replicas in the 10
REMC simulations are gathered and clustered by the re-
vised SPICKER program.30 The mean and standard devi-
ation of RMSD for all pairs of decoys are precalculated
in the new version of SPICKER because different targets
may have different distributions of QUARK decoy struc-
tures. The minimum and maximum RMSD cutoffs in
the new SPICKER algorithm are then automatically
adjusted based on the mean and standard deviation. Five
largest cluster centers are selected as the representative
predicted models, which are the decoy conformations
closest to the cluster centroids. As the QUARK decoy
conformation contains only backbone heavy atoms, the
final full-atomic structure is constructed by ModRefiner,
which was designed to add the missing atoms in the
reduced models and refine the physical quality of both
backbone and side-chain atomic structures simultane-
ously.
Design of force fields
The total energy of the QUARK force field is the sum
of the 11 terms:
Etot ¼ Eprm þ w1Eprs þ w2Eev þ w3Ehb þ w4Esa þ w5Edh
þ w6Edp þ w7Erg þ w8Ebab þ w9Ehp þ w10Ebp ð1Þ
where w1 5 0.10, w2 5 0.03, w3 5 0.03, w4 5 4.00, w5
5 0.40, w6 5 0.60, w7 5 1.00, w8 5 1.00, w9 5 0.05,
and w10 5 0.10 are the weighting factors to balance the
energy terms, which were tuned based on the modeling
accuracy of the small proteins in the training set. We use
a super-dimensional grid-searching strategy to decide
those weighting factors, which is the same as that by
MUSTER. The pair-wise energy term Eprm is considered
as the base energy term which has the weight equal to 1.
The other weights are set to zero at the beginning and
gradually increased until they cannot improve the TM-
score of the best model in the top five cluster centers any
more. We determine those 10 weights in the first round
in the order of w1, w2–w10 and then refine them in ran-
dom orders for several iterations. In each round, we use
big intervals to update each weight in the beginning and
then try small ones when the weight is approaching the
best. The parameterization procedure by this strategy we
believe is close to the optimum, which can lead to better
modeling accuracy than using the one-round order-de-
pendent parameterization.
The 11 energy terms can be categorized into three lev-
els, that is, the atomic-level terms (Eprm, Eprs, and Eev),
the residue-level terms (Ehb, Esa, Edh, and Edp), and the
topology-level terms (Erg, Ebab, Ehp, and Ebp). All the
energy terms are knowledge based, in the sense that they
are derived from the statistics of experimental structures
although most of them have direct physical sources. In
the following, we describe in more detail of the energy
terms, with the emphases on the new design of hydro-
gen-bonding and SA potentials and the novel concept of
distance profile potential.
QUARK Ab initio Prediction Method
PROTEINS 1719
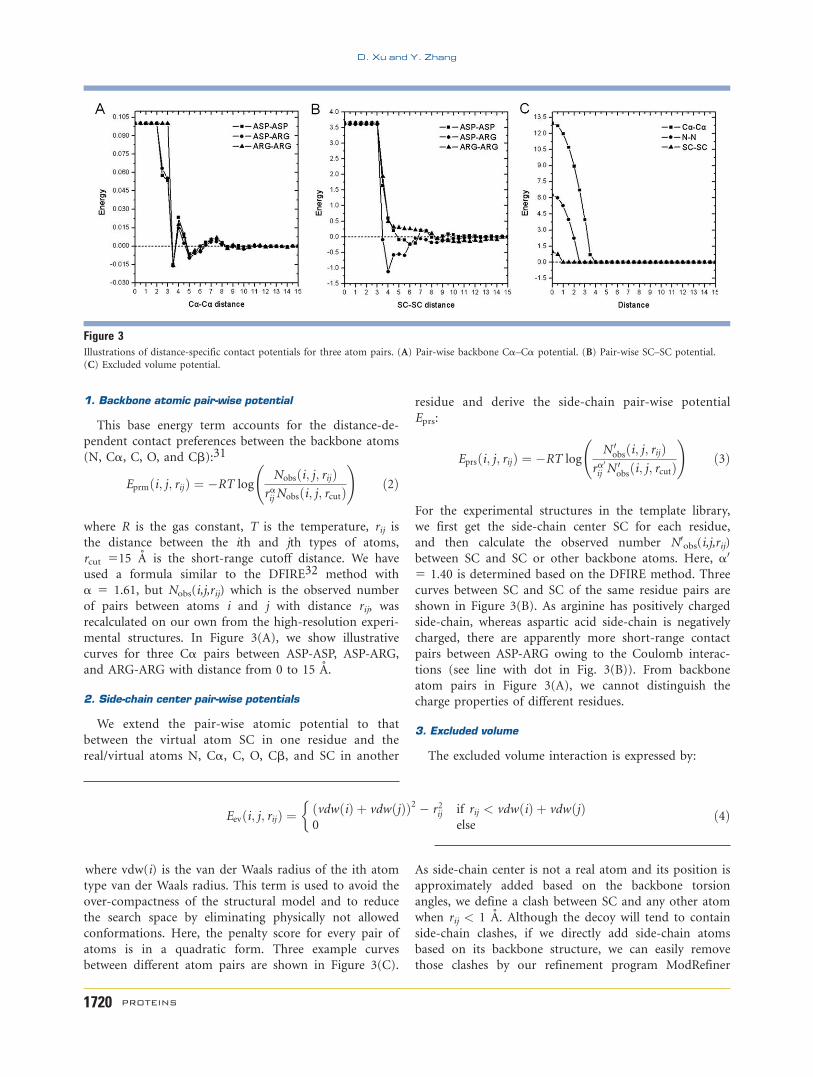
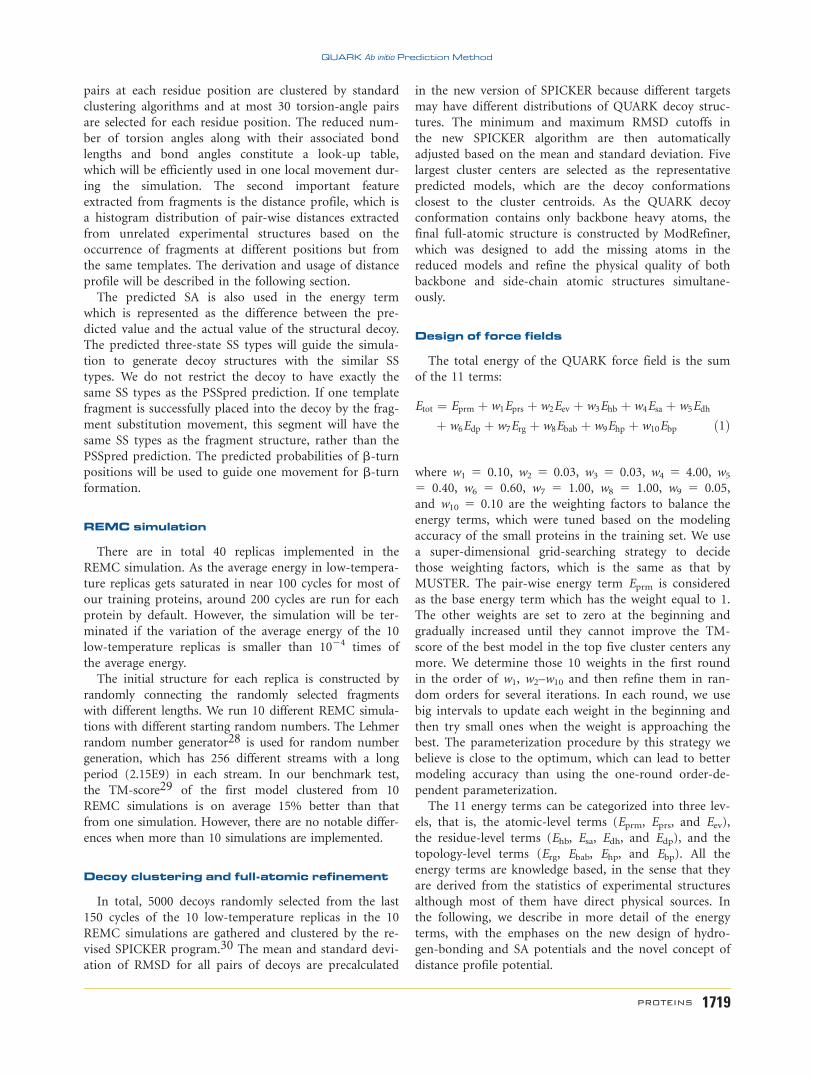
1. Backbone atomic pair-wise potential
This base energy term accounts for the distance-de-
pendent contact preferences between the backbone atoms
(N, Ca, C, O, and Cb):31
Eprmði; j; rijÞ ¼ �RT logNobsði; j; rijÞ
raij Nobsði; j; rcutÞ
!ð2Þ
where R is the gas constant, T is the temperature, rij is
the distance between the ith and jth types of atoms,
rcut 515 A is the short-range cutoff distance. We have
used a formula similar to the DFIRE32 method with
a 5 1.61, but Nobs(i,j,rij) which is the observed number
of pairs between atoms i and j with distance rij, was
recalculated on our own from the high-resolution experi-
mental structures. In Figure 3(A), we show illustrative
curves for three Ca pairs between ASP-ASP, ASP-ARG,
and ARG-ARG with distance from 0 to 15 A.
2. Side-chain center pair-wise potentials
We extend the pair-wise atomic potential to that
between the virtual atom SC in one residue and the
real/virtual atoms N, Ca, C, O, Cb, and SC in another
residue and derive the side-chain pair-wise potential
Eprs:
Eprsði; j; rijÞ ¼ �RT logN 0
obsði; j; rijÞra
0ij N
0obsði; j; rcutÞ
!ð3Þ
For the experimental structures in the template library,
we first get the side-chain center SC for each residue,
and then calculate the observed number N0obs(i,j,rij)
between SC and SC or other backbone atoms. Here, a0
5 1.40 is determined based on the DFIRE method. Three
curves between SC and SC of the same residue pairs are
shown in Figure 3(B). As arginine has positively charged
side-chain, whereas aspartic acid side-chain is negatively
charged, there are apparently more short-range contact
pairs between ASP-ARG owing to the Coulomb interac-
tions (see line with dot in Fig. 3(B)). From backbone
atom pairs in Figure 3(A), we cannot distinguish the
charge properties of different residues.
3. Excluded volume
The excluded volume interaction is expressed by:
Eevði; j; rijÞ ¼ ðvdwðiÞ þ vdwðjÞÞ2 � r2ij if rij < vdwðiÞ þ vdwðjÞ0 else
�ð4Þ
where vdw(i) is the van der Waals radius of the ith atom
type van der Waals radius. This term is used to avoid the
over-compactness of the structural model and to reduce
the search space by eliminating physically not allowed
conformations. Here, the penalty score for every pair of
atoms is in a quadratic form. Three example curves
between different atom pairs are shown in Figure 3(C).
As side-chain center is not a real atom and its position is
approximately added based on the backbone torsion
angles, we define a clash between SC and any other atom
when rij < 1 A. Although the decoy will tend to contain
side-chain clashes, if we directly add side-chain atoms
based on its backbone structure, we can easily remove
those clashes by our refinement program ModRefiner
Figure 3Illustrations of distance-specific contact potentials for three atom pairs. (A) Pair-wise backbone Ca–Ca potential. (B) Pair-wise SC–SC potential.
(C) Excluded volume potential.
D. Xu and Y. Zhang
1720 PROTEINS
later. Using a big distance cutoff rij for side-chain center
definitely will help to build the full-atomic model easily,
but we found that it would worsen the backbone model-
ing accuracy. This is because the conformational search
space is narrowed if the simulation forbids any overlap
between the inaccurate side-chain centers.
4. Hydrogen bonding
Hydrogen bonds, especially those between backbone
atoms, are one of the major driven forces to form regular
SSs and stabilize the global topology of protein structures.
In the semi-reduce model, we consider only the backbone
hydrogen bonds which are between N��H in one residue
and O¼¼C in another residue (Supporting Information Fig.
S1(A)). In a-helix, the hydrogen bond (H-bond) is
between O¼¼C of residue i and N��H of residue i 1 4,
whereas in b-sheet, it can be between any pair of residues i
and j. Here, we select four geometric features to gauge the
bonding, that is, the distance between Oi and Hj, D(Oi,Hj);
the inner angle between Ci, Oi, and Hj, A(Ci,Oi,Hj); the
inner angle between Oi, Hj, and Nj, A(Oi,Hj,Nj); and the
torsion angle between Ci, Oi, Hj, and Nj, T(Ci,Oi,Hj,Nj).
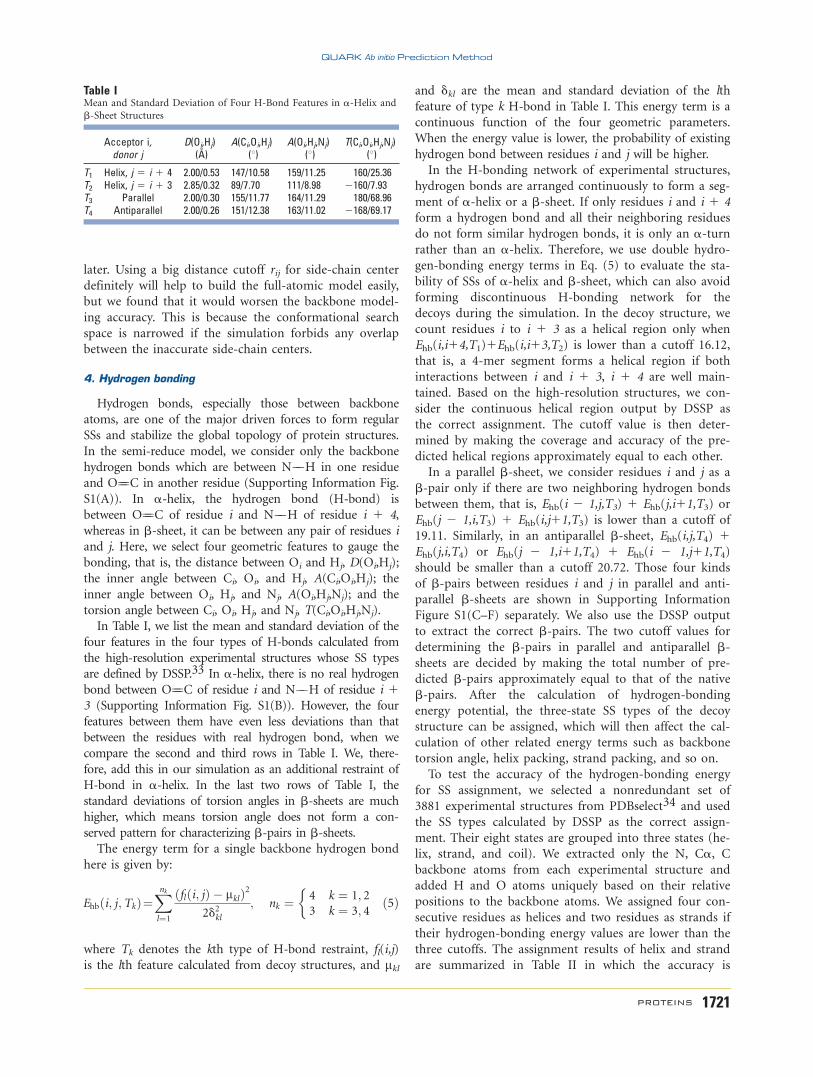
In Table I, we list the mean and standard deviation of the
four features in the four types of H-bonds calculated from
the high-resolution experimental structures whose SS types
are defined by DSSP.33 In a-helix, there is no real hydrogen
bond between O¼¼C of residue i and N��H of residue i 13 (Supporting Information Fig. S1(B)). However, the four
features between them have even less deviations than that
between the residues with real hydrogen bond, when we
compare the second and third rows in Table I. We, there-
fore, add this in our simulation as an additional restraint of
H-bond in a-helix. In the last two rows of Table I, the
standard deviations of torsion angles in b-sheets are much
higher, which means torsion angle does not form a con-
served pattern for characterizing b-pairs in b-sheets.The energy term for a single backbone hydrogen bond
here is given by:
Ehbði; j;TkÞ¼Xnkl¼1
ðflði; jÞ � lklÞ22d2kl
; nk ¼ 4 k ¼ 1; 23 k ¼ 3; 4
�ð5Þ
where Tk denotes the kth type of H-bond restraint, fl(i,j)
is the lth feature calculated from decoy structures, and lkl
and dkl are the mean and standard deviation of the lth
feature of type k H-bond in Table I. This energy term is a
continuous function of the four geometric parameters.
When the energy value is lower, the probability of existing
hydrogen bond between residues i and j will be higher.
In the H-bonding network of experimental structures,
hydrogen bonds are arranged continuously to form a seg-
ment of a-helix or a b-sheet. If only residues i and i 1 4
form a hydrogen bond and all their neighboring residues
do not form similar hydrogen bonds, it is only an a-turnrather than an a-helix. Therefore, we use double hydro-
gen-bonding energy terms in Eq. (5) to evaluate the sta-
bility of SSs of a-helix and b-sheet, which can also avoid
forming discontinuous H-bonding network for the
decoys during the simulation. In the decoy structure, we
count residues i to i 1 3 as a helical region only when
Ehb(i,i14,T1)1Ehb(i,i13,T2) is lower than a cutoff 16.12,
that is, a 4-mer segment forms a helical region if both
interactions between i and i 1 3, i 1 4 are well main-
tained. Based on the high-resolution structures, we con-
sider the continuous helical region output by DSSP as
the correct assignment. The cutoff value is then deter-
mined by making the coverage and accuracy of the pre-
dicted helical regions approximately equal to each other.
In a parallel b-sheet, we consider residues i and j as a
b-pair only if there are two neighboring hydrogen bonds
between them, that is, Ehb(i 2 1,j,T3) 1 Ehb(j,i11,T3) or
Ehb(j 2 1,i,T3) 1 Ehb(i,j11,T3) is lower than a cutoff of
19.11. Similarly, in an antiparallel b-sheet, Ehb(i,j,T4) 1Ehb(j,i,T4) or Ehb(j 2 1,i11,T4) 1 Ehb(i 2 1,j11,T4)
should be smaller than a cutoff 20.72. Those four kinds
of b-pairs between residues i and j in parallel and anti-
parallel b-sheets are shown in Supporting Information
Figure S1(C–F) separately. We also use the DSSP output
to extract the correct b-pairs. The two cutoff values for
determining the b-pairs in parallel and antiparallel b-sheets are decided by making the total number of pre-
dicted b-pairs approximately equal to that of the native
b-pairs. After the calculation of hydrogen-bonding
energy potential, the three-state SS types of the decoy
structure can be assigned, which will then affect the cal-
culation of other related energy terms such as backbone
torsion angle, helix packing, strand packing, and so on.
To test the accuracy of the hydrogen-bonding energy
for SS assignment, we selected a nonredundant set of
3881 experimental structures from PDBselect34 and used
the SS types calculated by DSSP as the correct assign-
ment. Their eight states are grouped into three states (he-
lix, strand, and coil). We extracted only the N, Ca, Cbackbone atoms from each experimental structure and
added H and O atoms uniquely based on their relative
positions to the backbone atoms. We assigned four con-
secutive residues as helices and two residues as strands if
their hydrogen-bonding energy values are lower than the
three cutoffs. The assignment results of helix and strand
are summarized in Table II in which the accuracy is
Table IMean and Standard Deviation of Four H-Bond Features in a-Helix and
b-Sheet Structures
Acceptor i,donor j
D(Oi,Hj)(�)
A(Ci,Oi,Hj)(8)
A(Oi,Hj,Nj)(8)
T(Ci,Oi,Hj,Nj)(8)
T1 Helix, j 5 i 1 4 2.00/0.53 147/10.58 159/11.25 160/25.36T2 Helix, j 5 i 1 3 2.85/0.32 89/7.70 111/8.98 2160/7.93T3 Parallel 2.00/0.30 155/11.77 164/11.29 180/68.96T4 Antiparallel 2.00/0.26 151/12.38 163/11.02 2168/69.17
QUARK Ab initio Prediction Method
PROTEINS 1721
defined as the number of correct assigned residues di-
vided by the total assigned residues and the coverage is
the number of correct assigned residues divided by the
total residues which are assigned as helix or strand by
DSSP.
As a control, we also implement an algorithm which
determines the residue SS type based on the geometry of
Ca atoms only, that is, a set of six pair-wise distances of
neighboring residues were trained to decide the SS types.
As summarized in Table II, the NHOC-based method
here is much more accurate than the method based on
Ca only, which demonstrates the benefit from adding
other backbone atoms in our model. Both the accuracy
and the coverage of the NHOC assignments are high
(>97%) for a-helix assignment. The accuracy of b-stranddetermination is also high (>98%) but the coverage is
slightly lower (93.7%), partly because some b-pairs such
as b-bridges, which have only isolated hydrogen bonds,
are neglected by the method here, which evaluates two
consecutive H-bonds at a time.
5. Solvent accessibility
SA is an important attribution of different amino
acids, which potentially determines the relative positions
of the residues in the global structure. For a given full-
atomic structure, the SA of each residue can be accu-
rately calculated using, for example EDTSurf.35 However,
the calculation can be time consuming. One challenging
issue in the molecular simulation is to design an algo-
rithm that can quickly and yet reliably calculate the SA
value for each residue, especially in reduced models.
The energy accounting for the residue-specific SA here
is written as:
Esa ¼XLi¼1
jsi � sEi j ð6Þ
where L is the sequence length, siE is the expected SA of
the ith residue, which is predicted by the back-propagation
NN trained from the checkpoint file by PSI-BLAST and SS
types by DSSP. si is the SA of the ith residue in the decoy
structure, which is calculated from the reduced model by:
si ¼ 1� wX
dðGi ;GjÞ<9A
AaaðjÞd2ðGi;GjÞ ð7Þ
where Aaa is the precalculated maximum solvent accessi-
ble surface area for amino acid aa. The weight w here
equals to 0.007. Gi is the geometric center of the ith resi-
due which is calculated from the coordinates of N, Ca,C, O, Cb, and SC atoms. d(Gi,Gj) is the distance between
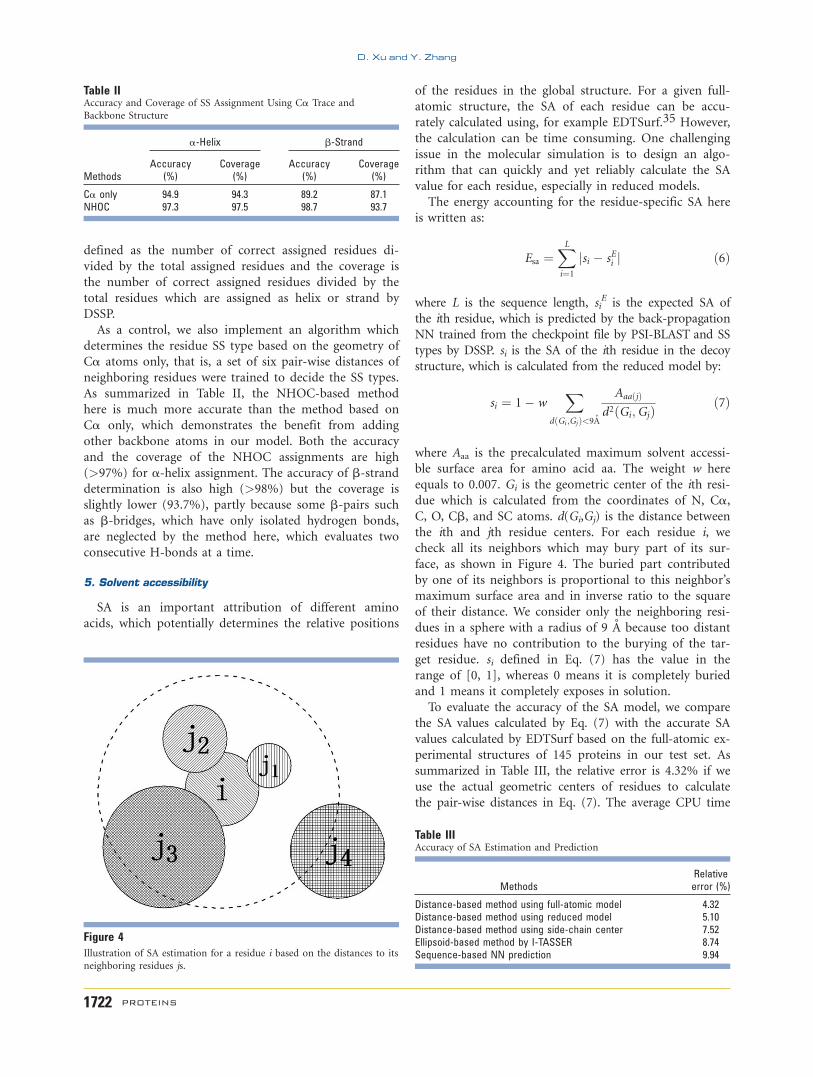
the ith and jth residue centers. For each residue i, we
check all its neighbors which may bury part of its sur-
face, as shown in Figure 4. The buried part contributed
by one of its neighbors is proportional to this neighbor’s
maximum surface area and in inverse ratio to the square
of their distance. We consider only the neighboring resi-
dues in a sphere with a radius of 9 A because too distant
residues have no contribution to the burying of the tar-
get residue. si defined in Eq. (7) has the value in the
range of [0, 1], whereas 0 means it is completely buried
and 1 means it completely exposes in solution.
To evaluate the accuracy of the SA model, we compare
the SA values calculated by Eq. (7) with the accurate SA
values calculated by EDTSurf based on the full-atomic ex-
perimental structures of 145 proteins in our test set. As
summarized in Table III, the relative error is 4.32% if we
use the actual geometric centers of residues to calculate
the pair-wise distances in Eq. (7). The average CPU time
Table IIAccuracy and Coverage of SS Assignment Using Ca Trace and
Backbone Structure
Methods
a-Helix b-Strand
Accuracy(%)
Coverage(%)
Accuracy(%)
Coverage(%)
Ca only 94.9 94.3 89.2 87.1NHOC 97.3 97.5 98.7 93.7
Figure 4Illustration of SA estimation for a residue i based on the distances to its
neighboring residues js.
Table IIIAccuracy of SA Estimation and Prediction
MethodsRelativeerror (%)
Distance-based method using full-atomic model 4.32Distance-based method using reduced model 5.10Distance-based method using side-chain center 7.52Ellipsoid-based method by I-TASSER 8.74Sequence-based NN prediction 9.94
D. Xu and Y. Zhang
1722 PROTEINS
for one test protein is 1.0 ms, which is 6000 times faster
than EDTSurf. As QUARK uses a reduced model with a
side-chain center (SC) representing each residue, if we cal-
culate the residue distance based on the center of N, Ca,C, O and the estimated SC, the SA error is only slightly
increased (5.10%). These data demonstrate the feasibility
of the equation to quickly and reliably calculate SA values.
We attempted to use the side-chain center instead of
the geometric center in the formula, which, however,
resulted in a bigger error 7.52%. This is because the geo-
metric center of one residue is more accurate in determin-
ing the contacts with its neighbors for SA estimation. We
also implemented another faster algorithm for SA estima-
tion, which was used in TOUCHSTONE and I-TASSER.
The algorithm first builds the bounding ellipsoid for the
entire Ca trace structure based on its three principal axes.
The SA of each residue is then calculated by the square of
the ratio of the distance between the residue and the pro-
tein structure center to the distance from the protein cen-
ter to the surface of the ellipsoid which passes through the
residue. The average error for this method is 8.74%; but
the computation of the model is slightly faster with aver-
age CPU time 0.8 ms for one test protein, as it avoids the
calculation of pair-wise distances. In the QUARK simula-
tion, we choose the distance-based method owing to the
better balance between the accuracy and the speed. For
real-value SA prediction, SA values of training proteins
input for NN training are calculated by EDTSurf. In the
last row of Table III, the average error between the
sequence-based NN prediction and the native SA is 9.94%
for the test proteins, which means more effort still should
be made to improve the sequence-based prediction.
As an illustration, we show the SA results for 1bgfA
from three resources in Supporting Information Figure S2.
The blue curve shows the solvent accessibilities of all the
residues calculated by EDTSurf from the full-atomic ex-
perimental structure. The green curve is the SA predicted
by NN from amino acid sequence, which is generally con-
sistent with the experimental structure. The estimation by
using geometric centers from native full-atomic structure
and Eq. (7) is shown in the red curve. We can see that the
average error of the structure-based estimation is much
lower than that from the sequence-based NN prediction.
6. Backbone torsion potential
The dihedral-angle potential is calculated as:
Edh ¼ �XL�1
i¼2
logðPð/i;wijaaðiÞ; ssðiÞÞÞ ð8Þ
where ui and wi are the torsion-angle pair of the ith resi-
due; P(u,w|aa,ss) is the conditional probability of u and
w at the residue type aa and the SS type ss, which are
calculated from the high-resolution experimental struc-
tures. For this purpose, 60 (520 3 3) Ramachandran
plots36 should be generated for 20 amino acids and three
SS types. In Supporting Information Figure S3, we illus-
trate four energy spectra converted from the Ramachan-
dran plots. As shown in Supporting Information Figure
S3(A–C), the energy spectra for the same residue are dif-
ferent according to different SS types. Although torsion
angles are highly conserved in helix, there is still some
difference between different residues by comparing the
blue regions in Supporting Information Figures S3(A,D).
7. Fragment-based distance profile
The distance profile energy term for each decoy is
written as:
Edp ¼ �X
ði;jÞ2SdplogðNi;jðdijÞÞ ð9Þ
where dij is the distance between the ith and jth Caatoms in the decoy structure. Ni,j(d) is the distance pro-
file for residue i and j extracted from the 10-mer frag-
ment structures, with d divided from 0 to 9 A in the
interval 0.5 A. Sdp is the set of residue pairs which have
distance profiles.
We have already generated top 200 fragment structures
for each segment of the query sequence, by gapless
threading of the query segment sequence through the
template library. In the fragment file, we also recorded
the template name and residue indexes for each selected
fragment structure. We then checked all the fragments in
different positions if they come from the same template.
If there are two residues in two different fragment struc-
tures (one aligned with residue i and another with resi-
due j in the query sequence) which come from the same
template structure, we can directly calculate their Ca dis-
tance dkl (assuming the indexes of the two residues are k
and l in the template), as they are in the same coordinate
system. If the distance is <9 A, then we consider residue
i and j in the query sequence which may also have the
same distance. A histogram of dij, Ni,j(dij) will be con-
structed for all the (i, j) residue pairs by comparing every
two fragment structures in two different positions.
Not all the residue pairs are concerned in the distance
profile because many are false-positive pairs. We filter the
residue pairs whose distance profiles are monotonically
increasing functions, as we cannot distinguish whether
those residue pairs have short-range contacts or not from
their distributions. We count only the residue pairs
which have the peaks of the histograms below 9 A from
their distance distributions. Those residue pairs constitute
the set Sdp. We choose fragments with length 10 to
extract distance profile information because 10-mer frag-
ments can lead to the highest accuracy of distance
restraint prediction.
The concept of distance profile is different from the
traditional distance restraint energy term, where only one
QUARK Ab initio Prediction Method
PROTEINS 1723
expected distance is assigned to each residue pair, which
is usually the average distance extracted from threading
alignments or sequence-based predictions. The average
distance can be incorrect if multiple distances appear
with high frequencies. The distance profile term designed
here includes frequencies of all the distance bins. There-
fore, all the distances, which have high probabilities, will
be appropriately considered in Eq. (9). The best distance
will be eventually selected by the simulations with the
competitions with other energy terms.
8. Radius of gyration
The propensity to the radius of gyration is written as:
Erg ¼0 rmin � r � rmax
ðrmin � rÞ2 r < rmin
ðr � rmaxÞ2 r > rmax
8<: ð10Þ
where r is the radius of gyration of the simulated decoy
structure, rmin and rmax are the minimum and maximum
of estimated radius of gyration. The expected radius gyra-
tion was estimated based on both protein length and SS
elements. Generally, longer proteins have a larger radius of
gyration; a-proteins are relative less tightly packed than a/b-proteins especially when they contain some long helices.
The average radius and the minimum radius of proteins
with different lengths are shown in Supporting Informa-
tion Figure S4. The minimum radius fits well the equation
rmin 5 2.316L0.358 (dash line), which has a Pearson correla-
tion coefficient (PCC) of 0.991 with the actual values. The
average radius of gyration has bigger fluctuations which
are approximately fitted with ravg 5 d12.316L0.358 (solid
line) where the difference d between the minimum radius
and the average radius is 2.5 A. If we take rmin 52.316L0.358 and rmax ¼ maxfrmin þ 3d; 0:7
ffiffiffiffiffiffiffiffi3=5
pNmax hg
where Nmaxh is the number of residues of the longest helix
in the structure, we find that 95% of the experimental
structures in the PDB have the radius of gyration within
[rmin, rmax], that is, most of the native states have Erg 5 0
in Eq. (10).
9. Strand–helix–strand packing
As there are rarely left-handed b-a-b motifs in native
structures, we add one energy term to penalize this motif
during the simulation:
Ebab ¼ Epen left� handed
0 else
�ð11Þ
where the penalty energy Epen equals to the negative
value of the total hydrogen bonding energy between the
two b-strands in the motif. Given the structure of each
decoy, we first scan all the SS elements which have one
helix sequentially between two b-strands. Then we check
if the two b-strands form a parallel b-sheet. The left-
handedness is determined based on the relative position
of the center of the helix to the plane formed by the two
b-strands. As the b-a-b motif has identical energy values
to its mirror image for most of the other energy terms,
Eq. (11) will help avoid the incorrect mirror image mod-
els, which have been most often encountered in ab initio
structure folding.4
10. Helix packing
The helix–helix packing energy is written as:
Ehpði; jÞ ¼ � logðPðdij ; /ijÞÞ ð12Þ
where dij is the distance between the medial axis of the
ith helix and that of the jth helix; uij is the torsion angle
of the axis vectors which are oriented from N- to C-ter-
minal. P(dij, uij) is the probability distribution calculated
from the nonredundant experimental structures, where
dij is split into 30 bins in [0, 15 A] and uij into 36 bins
in [21808, 1808]. As shown in Supporting Information
Figure S5, most of the helix pairs fall in the region of dij5 9.5 A and uij 5 2160, 240 or 1408.
11. Strand packing
The b-pairing energy of the ith and jth residues in two
paired strands is written as:
Ebpði; jÞ ¼ � logðPðaaðiÞ; aaðjÞ;TijÞÞ ð13Þ
where P(A, B, T) is the probability for amino acids A
and B in the sheet type T (parallel or antiparallel), calcu-
lated from the high-resolution experimental structures.
This energy term is used to emphasize the residue types
in b-pairs which have not been considered by the hydro-
gen bonding term. As shown in Supporting Information
Figure S6, the distributions of residue types between the
residue pairs that form backbone hydrogen bonds are
highly uneven. Prolines rarely appear in a b-pair as thereis no hydrogen atom associated with the nitrogen. By
comparing Supporting Information Figure S6(A,B), there
is a slight difference between the two distributions. There
are more b-pairs between glutamic acid and arginine in
parallel b-sheets than in antiparallel b-sheets.
Design of conformational movements
Efficient conformational search is another critical com-
ponent of ab initio protein folding, where the design of
conformational movements with high acceptance rates is
essential for improving the efficiency of Monte Carlo
simulations. QUARK performs the conformational search
based on the standard REMC simulation algorithm.37 It
involves two types of conformational movements. The
global movement consists of periodically conformational
swap between neighboring replicas. The local movements
include conformational updates implemented in each
D. Xu and Y. Zhang
1724 PROTEINS
replica, which is the major focus of discussion in this
section.
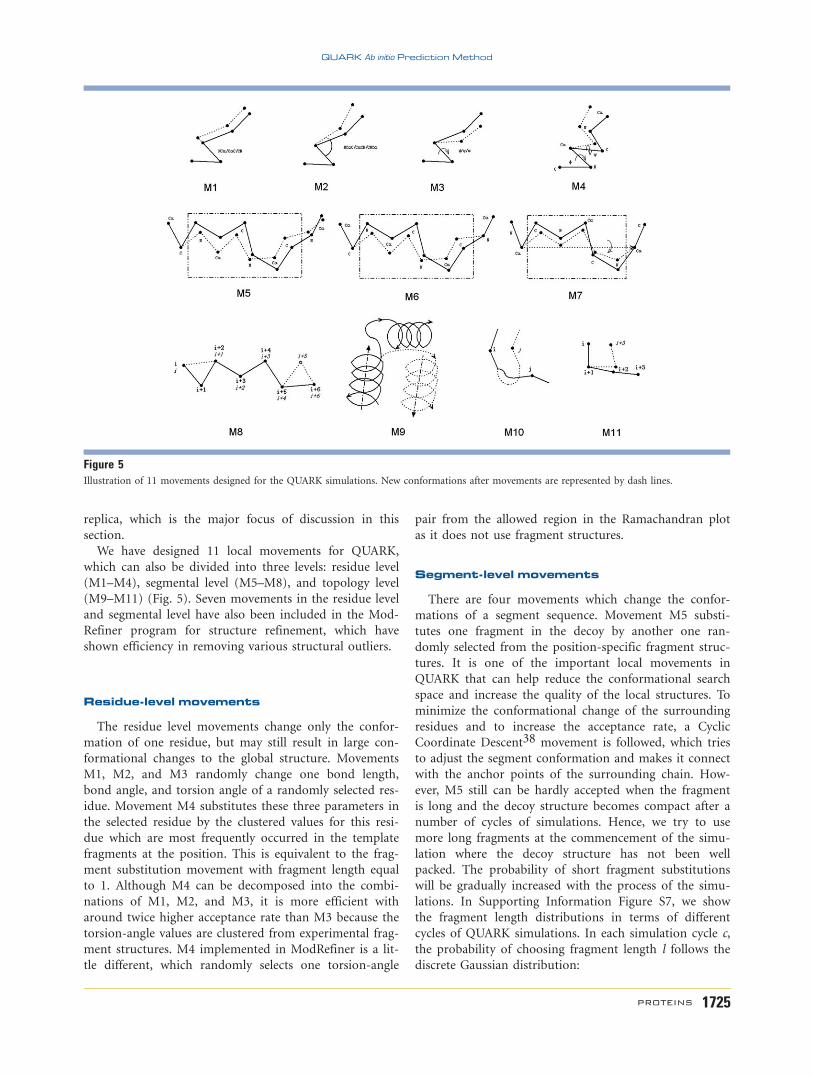
We have designed 11 local movements for QUARK,
which can also be divided into three levels: residue level
(M1–M4), segmental level (M5–M8), and topology level
(M9–M11) (Fig. 5). Seven movements in the residue level
and segmental level have also been included in the Mod-
Refiner program for structure refinement, which have
shown efficiency in removing various structural outliers.
Residue-level movements
The residue level movements change only the confor-
mation of one residue, but may still result in large con-
formational changes to the global structure. Movements
M1, M2, and M3 randomly change one bond length,
bond angle, and torsion angle of a randomly selected res-
idue. Movement M4 substitutes these three parameters in
the selected residue by the clustered values for this resi-
due which are most frequently occurred in the template
fragments at the position. This is equivalent to the frag-
ment substitution movement with fragment length equal
to 1. Although M4 can be decomposed into the combi-
nations of M1, M2, and M3, it is more efficient with
around twice higher acceptance rate than M3 because the
torsion-angle values are clustered from experimental frag-
ment structures. M4 implemented in ModRefiner is a lit-
tle different, which randomly selects one torsion-angle
pair from the allowed region in the Ramachandran plot
as it does not use fragment structures.
Segment-level movements
There are four movements which change the confor-
mations of a segment sequence. Movement M5 substi-
tutes one fragment in the decoy by another one ran-
domly selected from the position-specific fragment struc-
tures. It is one of the important local movements in
QUARK that can help reduce the conformational search
space and increase the quality of the local structures. To
minimize the conformational change of the surrounding
residues and to increase the acceptance rate, a Cyclic
Coordinate Descent38 movement is followed, which tries
to adjust the segment conformation and makes it connect
with the anchor points of the surrounding chain. How-
ever, M5 still can be hardly accepted when the fragment
is long and the decoy structure becomes compact after a
number of cycles of simulations. Hence, we try to use
more long fragments at the commencement of the simu-
lation where the decoy structure has not been well
packed. The probability of short fragment substitutions
will be gradually increased with the process of the simu-
lations. In Supporting Information Figure S7, we show
the fragment length distributions in terms of different
cycles of QUARK simulations. In each simulation cycle c,
the probability of choosing fragment length l follows the
discrete Gaussian distribution:
Figure 5Illustration of 11 movements designed for the QUARK simulations. New conformations after movements are represented by dash lines.
QUARK Ab initio Prediction Method
PROTEINS 1725
Pfragsubðl; cÞ ¼ e�ð20�l�0:1cÞ2
2r2
P20l¼1 e
�ð20�l�0:1cÞ22r2
; r ¼ 3=ffiffiffi2
p; c � 200
ð14Þ
where the average length of the moved fragments
decreases with the number of the simulation cycles which
is proportional to the simulation time. We found that
the acceptance rate of M5 was increased by 1.45 times,
compared with that using the uniform distribution.
Movement M6 is an LMProt39 perturbation, which
first randomly changes the positions of backbone atoms
in a selected segment and then tries to restrict all the
bond lengths and bond angles within the physically
allowed region. Movement M7 rotates the backbone
atoms of a randomly selected segment around the axis
connecting the two ending Ca atoms. Movement M8
shifts the residue numbers in a segment forward or back-
ward by one residue, which means that the coordinates
of each residue are copied from their preceded or fol-
lowed residue in the segment. We then need to delete the
unused coordinates of one residue in one terminal and
insert new coordinates of another residue in the other
terminal. This movement can easily adjust the b-pairingin two well-aligned b-strands.
Topology-level movements
There are three topological movements which try to
form well-packed helix pair, b-pair, and b-turn. In
movement M9, one helix is moved close to another one.
The probability of their distance and torsion-angle distri-
bution is the same as that in the helix-packing energy
term. The linkage region between the two helices will be
rebuilt to keep the backbone connectivity. In the similarly
way, one b-pair is formed in movement M10. As one b-strand is likely to pair with another one which has simi-
lar number of residues to form a b-sheet, we precalcu-
lated the probability for every pair of residues which may
form a b-pair based on their SS types and positions in
the SS elements. A pair of residues whose predicted SS
types are strands have a higher probability than those
with SS types equal to coils and helices. During the ran-
dom b-pair formation movement M10, we select the res-
idue pair based on those precalculated probabilities. The
possibilities of forming a b-pair in antiparallel and paral-
lel sheets are 75 and 25%, respectively, based on the ob-
servation from experimental structures in the PDB.
The probabilities of b-turn positions are predicted by
NN, where the correct b-turn positions in the training
structures are assigned by PROMOTIF.40,41 Movement
M11 tries to form a b-turn motif for every 4-mer seg-
ment along the query sequence. The number of M11
attempts at each position is proportional to the predicted
b-turn probability.
The summary of the acceptance rates of all the 11
movements designed for QUARK simulations is shown
in Supporting Information Figure S8(A–D). Movements
like M1, M2, M4, M6, and M7, which change the decoy
conformation in a smaller magnitude, often have a
higher acceptance rate. On the other hand, movements
such as M3, M5, M8, M9, M10, and M11 were designed
to change the whole part of the conformation from the
selected location to the C-terminal or to change the con-
formation of one segment, or to form a given motif
structure. They often have a much larger magnitude of
conformational move and generally have a lower accep-
tance rate.
By comparing Supporting Information Figure S8(A,B),
the replicas at high temperatures have a higher accep-
tance rate than that at the low temperatures, which is
consistent with the Metropolis criterion.42 As shown in
Supporting Information Figure S8(C,D), decoy confor-
mations in the beginning of the simulation have a higher
acceptance rate than that in the end of the simulation, as
the decoy structures at the start are unpacked and have
high energies, which therefore can easily accept new
movements. But with the number of cycles increasing,
the structures become more compact and harder to
accept new movements. The average acceptance rate of
all the movements in all the replicas and all the 200
cycles is 8.5%. The proportions of these 11 movements
attempted to update the decoy structures are listed in
Supporting Information Table S2, which are determined
by trial and error with the goal to identify the lower
energy conformations in a finite simulation time.
Although the acceptance rate of fragment substitution
movement M5 is low, it still has a high probability to
attempt during the simulation, because the local segment
or the global topology of the decoy gets improved signifi-
cantly once a M5 movement is accepted.
Global movements
QUARK runs Monte Carlo simulations in 40 parallel
replicas. Although the simulation at low temperatures
will detect conformation of lower energies, it can be eas-
ily trapped at local energy basin. The replica swap move-
ment is designed to exploit the high-temperature replica
simulations to help the low-temperature replicas jump
over low-energy basins. It is, therefore, essential to keep a
high-acceptance rate for swapping each pair of neighbor-
ing replicas.
Each replica runs separately within each cycle, where
30L1/2 (L is the protein length) movements will be
attempted based on the Metropolis criterion. After a run-
ning cycle is completed, a swap movement will be
attempted between every two adjacent replicas to
exchange their decoy conformations. The swap move-
ment also follows the Metropolis rule. Supporting Infor-
mation Figure S9(A) shows the average acceptance rates
D. Xu and Y. Zhang
1726 PROTEINS
of the swap movements for different replicas, where
high-temperature replicas have generally higher swap
rates. The minimum swap rate is >75% which indicates
that the number of replicas is higher enough to keep suf-
ficient replica exchanges. The trajectories of five replicas
at low temperatures and five replicas at high tempera-
tures are shown in Supporting Information Figure S9(B).
Indeed, the low-temperature replicas tend to search the
low-energy basin and the high-temperature ones have
higher overall energies with higher fluctuations. The
neighboring replicas have overlapped energy ranges to
ensure replica exchanges.
The temperature distribution of the 40 replicas is
shown in Supporting Information Figure S10, which fol-
lows an exponential function for the purpose of keeping
approximately equal acceptance rate for the global swap
movements. The temperature of the ith replica is given
in the following formula:
Ti ¼ Tmin
Tmax
Tmin
� �40�i39
; 1 � i � 40 ð15Þ
where Tmax 5 2.4 1 0.016L, Tmin 5 0.6 1 0.00067L are
the temperatures for the first and last replicas. Tempera-
ture range of the replicas is larger for bigger proteins to
keep a reasonable acceptance rate of movements in all
replicas as bigger proteins have usually larger energy fluc-
tuation range.
We have also tried different numbers of replicas when
we fix the maximum and minimum temperatures. Basi-
cally, the modeling result will be better if we use more
replicas. The overall swap rate will be higher when we
use a larger number of replicas owing to the smaller tem-
perature interval between two adjacent replicas. As more
replicas also take more time for the simulation, we
decide to use 40 replicas which can achieve a reasonably
short running time, high swap rate, and high modeling
accuracy.
RESULTS AND DISCUSSION
Impact of force field to quality of final models
An accurate force field for protein folding should have
a correlation with the structure similarity of the decoy
structures to their native structure, so that the energy
function can be used to guide the folding simulations to-
ward the native state. To examine the correlation of the
QUARK force field, we generated 5000 structure decoys
which were randomly taken from the 10 low-temperature
replicas of 10 different REMC runs for each of the 145
test proteins. Homologous templates were removed base
on the three strict filters for fragment generation before
the REMC simulations. All the decoy structures are de-
posited at http://zhanglab.ccmb.med.umich.edu/decoys/
decoy3.html.
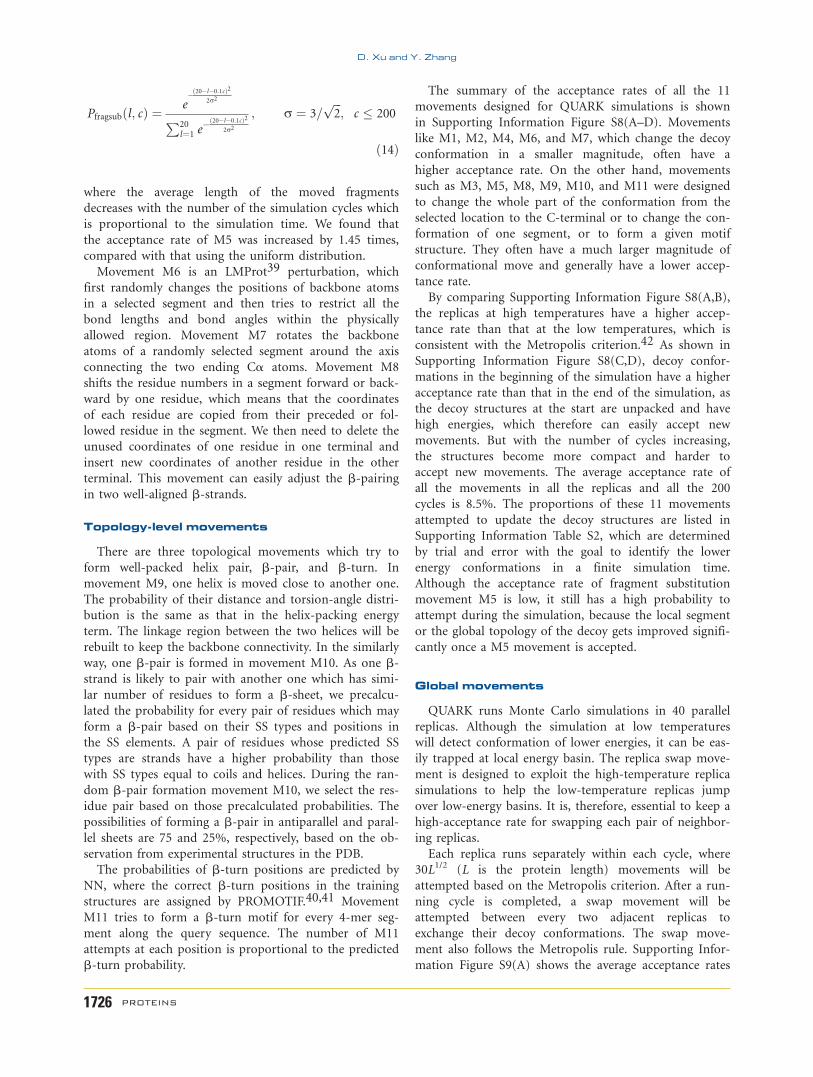
One important question is how much the structural
prediction power of QUARK is influenced by the correla-
tion of the force field to the backbone accuracy as eval-
uated by TM-score. To examine this, we cluster the struc-
ture decoys by SPICKER and plot the TM-score of the
first cluster center versus the PCC of the energy-to-TM-
score in Figure 6. As shown in Figure 6, PCC of the
QUARK energy and the TM-score of the first cluster cen-
ter are typically in the range of [20.7, 0.2]; the average
PCC is 20.185. There is a general tendency that the
well-folded targets with higher TM-score correspond to
cases with stronger correlation coefficients between TM-
score and energy of the decoys. The PCC between the
TM-score of the first cluster and the PCC of the energy-
to-TM-score is 20.469. It is, however, quite surprising
that there are several exceptional cases where QUARK
successfully folds the proteins which do not have strong
energy-to-TM-score correlation. There are also cases
where QUARK potential has a high correlation with TM-
score but the final model has a low TM-score. In the fol-
lowing, we specifically examine these cases.
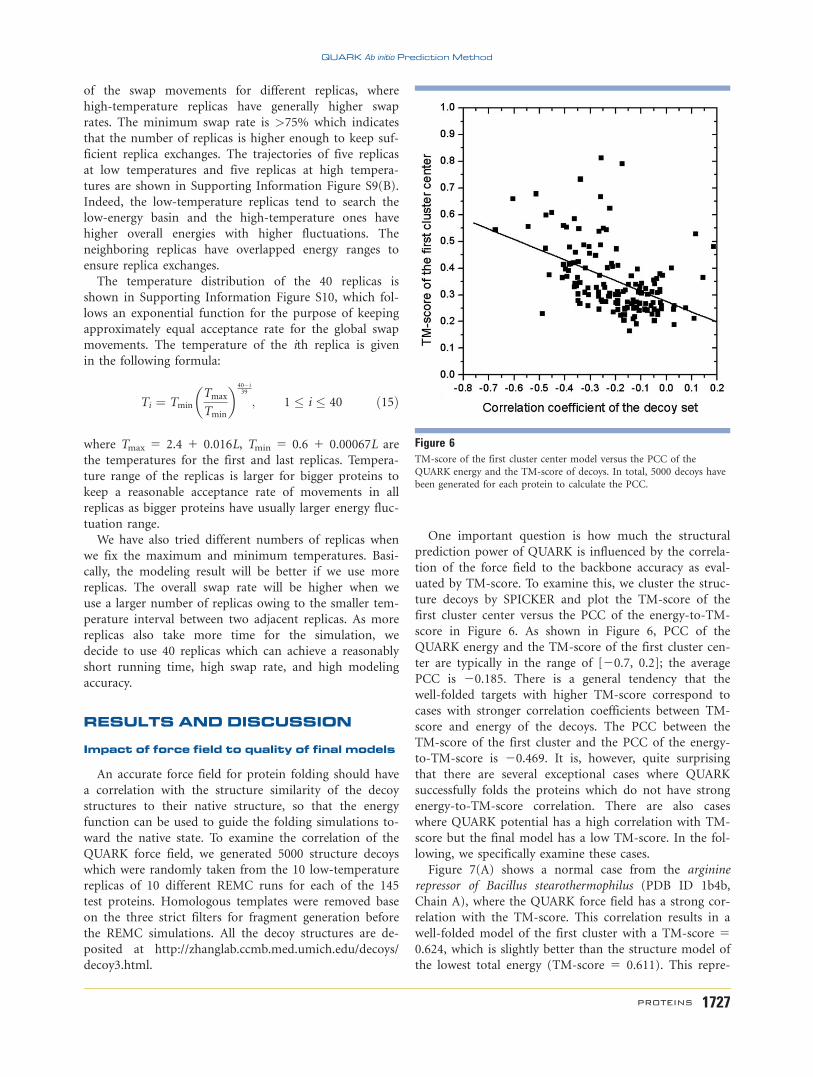
Figure 7(A) shows a normal case from the arginine
repressor of Bacillus stearothermophilus (PDB ID 1b4b,
Chain A), where the QUARK force field has a strong cor-
relation with the TM-score. This correlation results in a
well-folded model of the first cluster with a TM-score 50.624, which is slightly better than the structure model of
the lowest total energy (TM-score 5 0.611). This repre-
Figure 6TM-score of the first cluster center model versus the PCC of the
QUARK energy and the TM-score of decoys. In total, 5000 decoys have
been generated for each protein to calculate the PCC.
QUARK Ab initio Prediction Method
PROTEINS 1727
sents a typical example of QUARK simulations where
better energy force fields lead to better modeling results.
Figure 7(B) is an example from EntA-im (PDB ID:
2bl7, Chain A). The QUARK energy has no obvious cor-
relation with the TM-score (PCC 5 20.116) but
QUARK generated a model of correct fold (TM-score 50.527). The major error of this model is at the loop
region (53N-67T), where the SS prediction program
incorrectly assigned the loop as b-strands. Therefore,
QUARK generated an additional b-hairpin structure in
this loop region. Nevertheless, the global fold of the
model which contains four a-helices is the same as the
experimental structure. However, many of other decoys
whose global topologies are incorrect have consistent SSs
with the predictions (including the incorrectly assigned
b-hairpin region) and therefore have a low energy in the
QUARK simulation; this resulted in the weak energy-to-
TM-score correlation coefficient for this example. Despite
of the low correlation, the conformation of the correct
fold has the largest cluster size with the lowest free
energy, which can, therefore, be picked up by the
SPICKER clustering program. One possible reason for
the low correlation but high modeling accuracy is
because of the unbalanced Monte Carlo simulation using
fragment assembly. Local segments of the generated
decoys may be biased toward the fragments retrieved
from the template library. Those fragment structures in
fact are part of the energy surface implicitly which has
not been included in the energy calculation.
Figure 7(C) is another example of exceptional energy-
to-TM-score correlation, which is from the M11L apopto-
sis inhibitor protein (PDB ID: 2o42, Chain A). Although
this protein has a strong correlation (PCC 5 20.489), all
the decoys are within the low TM-score region. The ex-
perimental structure of the protein consists of a pack of
seven short helices, but the majority of the QUARK
decoys have the topology of a bundle of two long helices,
mainly owing to the incorrect SS prediction. The
QUARK energy of the native structure is 2406.124 which
is higher than almost all that of the decoys because more
loop regions in the native structure make the torsion-
angle potential higher than that of the decoys which con-
tain more regular helical regions as predicted by PSSpred.
This target represents a typical example of the QUARK
Figure 7Three illustrative examples for energy-to-TM-score correlations of 5000 decoys. The cluster center model (in gray) selected from the decoy set issuperimposed onto the native structure (in black). (A) 1b4bA, (B) 2bl7A, and (C) 2o42A.
D. Xu and Y. Zhang
1728 PROTEINS
simulations which were misguided by the incorrect SS
predictions.
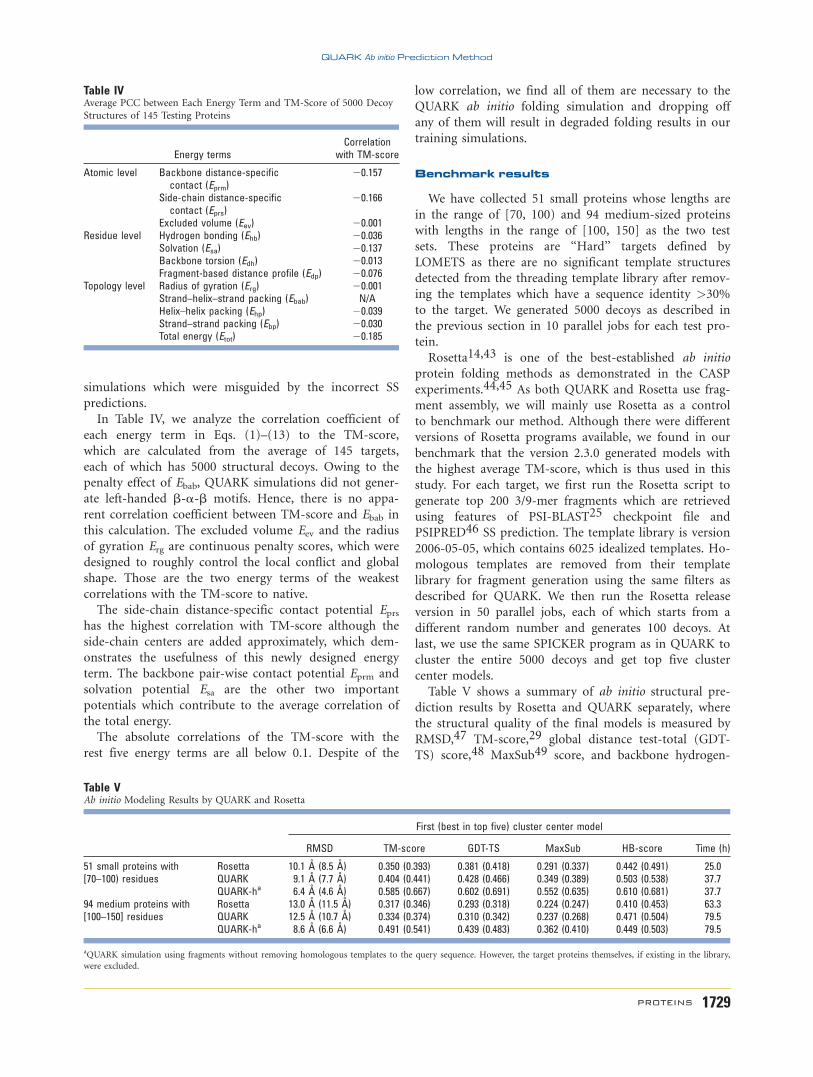
In Table IV, we analyze the correlation coefficient of
each energy term in Eqs. (1)–(13) to the TM-score,
which are calculated from the average of 145 targets,
each of which has 5000 structural decoys. Owing to the
penalty effect of Ebab, QUARK simulations did not gener-
ate left-handed b-a-b motifs. Hence, there is no appa-
rent correlation coefficient between TM-score and Ebab in
this calculation. The excluded volume Eev and the radius
of gyration Erg are continuous penalty scores, which were
designed to roughly control the local conflict and global
shape. Those are the two energy terms of the weakest
correlations with the TM-score to native.
The side-chain distance-specific contact potential Eprshas the highest correlation with TM-score although the
side-chain centers are added approximately, which dem-
onstrates the usefulness of this newly designed energy
term. The backbone pair-wise contact potential Eprm and
solvation potential Esa are the other two important
potentials which contribute to the average correlation of
the total energy.
The absolute correlations of the TM-score with the
rest five energy terms are all below 0.1. Despite of the
low correlation, we find all of them are necessary to the
QUARK ab initio folding simulation and dropping off
any of them will result in degraded folding results in our
training simulations.
Benchmark results
We have collected 51 small proteins whose lengths are
in the range of [70, 100) and 94 medium-sized proteins
with lengths in the range of [100, 150] as the two test
sets. These proteins are ‘‘Hard’’ targets defined by
LOMETS as there are no significant template structures
detected from the threading template library after remov-
ing the templates which have a sequence identity >30%
to the target. We generated 5000 decoys as described in
the previous section in 10 parallel jobs for each test pro-
tein.
Rosetta14,43 is one of the best-established ab initio
protein folding methods as demonstrated in the CASP
experiments.44,45 As both QUARK and Rosetta use frag-
ment assembly, we will mainly use Rosetta as a control
to benchmark our method. Although there were different
versions of Rosetta programs available, we found in our
benchmark that the version 2.3.0 generated models with
the highest average TM-score, which is thus used in this
study. For each target, we first run the Rosetta script to
generate top 200 3/9-mer fragments which are retrieved
using features of PSI-BLAST25 checkpoint file and
PSIPRED46 SS prediction. The template library is version
2006-05-05, which contains 6025 idealized templates. Ho-
mologous templates are removed from their template
library for fragment generation using the same filters as
described for QUARK. We then run the Rosetta release
version in 50 parallel jobs, each of which starts from a
different random number and generates 100 decoys. At
last, we use the same SPICKER program as in QUARK to
cluster the entire 5000 decoys and get top five cluster
center models.
Table V shows a summary of ab initio structural pre-
diction results by Rosetta and QUARK separately, where
the structural quality of the final models is measured by
RMSD,47 TM-score,29 global distance test-total (GDT-
TS) score,48 MaxSub49 score, and backbone hydrogen-
Table IVAverage PCC between Each Energy Term and TM-Score of 5000 Decoy
Structures of 145 Testing Proteins
Energy termsCorrelation
with TM-score
Atomic level Backbone distance-specificcontact (Eprm)
20.157
Side-chain distance-specificcontact (Eprs)
20.166
Excluded volume (Eev) 20.001Residue level Hydrogen bonding (Ehb) 20.036
Solvation (Esa) 20.137Backbone torsion (Edh) 20.013Fragment-based distance profile (Edp) 20.076
Topology level Radius of gyration (Erg) 20.001Strand–helix–strand packing (Ebab) N/AHelix–helix packing (Ehp) 20.039Strand–strand packing (Ebp) 20.030Total energy (Etot) 20.185
Table VAb initio Modeling Results by QUARK and Rosetta
First (best in top five) cluster center model
RMSD TM-score GDT-TS MaxSub HB-score Time (h)
51 small proteins with[70–100) residues
Rosetta 10.1 � (8.5 �) 0.350 (0.393) 0.381 (0.418) 0.291 (0.337) 0.442 (0.491) 25.0QUARK 9.1 � (7.7 �) 0.404 (0.441) 0.428 (0.466) 0.349 (0.389) 0.503 (0.538) 37.7QUARK-ha 6.4 � (4.6 �) 0.585 (0.667) 0.602 (0.691) 0.552 (0.635) 0.610 (0.681) 37.7
94 medium proteins with[100–150] residues
Rosetta 13.0 � (11.5 �) 0.317 (0.346) 0.293 (0.318) 0.224 (0.247) 0.410 (0.453) 63.3QUARK 12.5 � (10.7 �) 0.334 (0.374) 0.310 (0.342) 0.237 (0.268) 0.471 (0.504) 79.5QUARK-ha 8.6 � (6.6 �) 0.491 (0.541) 0.439 (0.483) 0.362 (0.410) 0.449 (0.503) 79.5
aQUARK simulation using fragments without removing homologous templates to the query sequence. However, the target proteins themselves, if existing in the library,
were excluded.
QUARK Ab initio Prediction Method
PROTEINS 1729
bonding score (HB-score) in comparison to the native
structures. Both TM-score and MaxSub49 score evaluate
the backbone accuracy to native after the optimum
superposition, but they have different distance cutoffs
and scoring functions. GDT-TS score is a little different
to the above two scores, which counts the sum of frac-
tions of residue pairs between model and native with dis-
tances below 1, 2, 4, and 8 A, respectively, after optimal
structural superimpositions. As models by both Rosetta
and QUARK contain full backbone atoms, it allows us to
compare their backbone H-bonding quality directly.
Here, HB-score is defined as the number of the correctly
predicted hydrogen bonds divided by the total number of
the hydrogen bonds appearing in the experimental struc-
ture as calculated by HBPLUS.50 Based on the first
QUARK models of all the 145 targets, the PCCs between
TM-score and GDT-TS, MaxSub scores are extremely
high, which are 0.968 and 0.965 separately. It reveals that
any one of the three scoring functions is adequate
enough to evaluate the backbone accuracy to native. The
PCCs are 20.783 and 0.606 between TM-score and
RMSD, HB-score, which means they are not equivalent
metrics.
Both Rosetta and QUARK programs have a slightly
better result in folding small proteins than medium-sized
proteins. Overall, one-third of the short proteins can be
correctly folded by QUARK with TM-score >0.5. A TM-
score >0.5 means the model most probably has the same
fold as the native structure.51 However, there are only 10
out of 94 medium-sized targets which QUARK can cor-
rectly predict. It is probably owing to the fact that small
proteins have usually simpler topology and smaller con-
formational search space. Therefore, it is relatively easier
for the algorithms to identify the correct fold. By com-
paring the best in top five QUARK models with the first
model, the relative TM-score differences are 9% for small
proteins and 12% for medium-sized proteins, which indi-
cate the ranking by the clustering algorithm is also better
for small proteins.
Comparing the two folding algorithms, although
QUARK outperforms Rosetta in both sets of proteins, the
TM-score difference of the final models is slightly larger
for the small proteins (15% in TM-score of the first
model) than that for the medium-sized proteins (6%).
This protein-size-dependent difference also exists for the
best in top five models, where the TM-score differences
of final models are 12 and 8%, respectively. QUARK
models also have a higher HB-score than the Rosetta
models. However, the difference does not depend on the
protein lengths. For example, the differences of HB-score
of the first models are 14 and 15% for small- and me-
dium-sized proteins, respectively. For the best in top five
models, the HB-score differences are 10 and 11% for
small- and medium-sized proteins, respectively, which are
still independent of the protein lengths but less signifi-
cant than that of the first model.
We also compare the average CPU hours per target in
the last column of Table V. Both programs are running
in the cluster with Linux 64-bit system installed. Each
cluster node is equipped with eight 2.27 GHZ Intel
E5520 Xeon processors and 24GB memory. As there are
totally 40 replicas in the QUARK REMC simulation and
only one-fourth of the 10 low-temperature replicas are
randomly selected for clustering, the running time of
QUARK is longer than that of Rosetta which runs a sin-
gle trajectory of simulated annealing algorithm. QUARK
is 1.51 times slower than Rosetta for small proteins while
the ratio becomes 1.26 for medium-sized proteins.
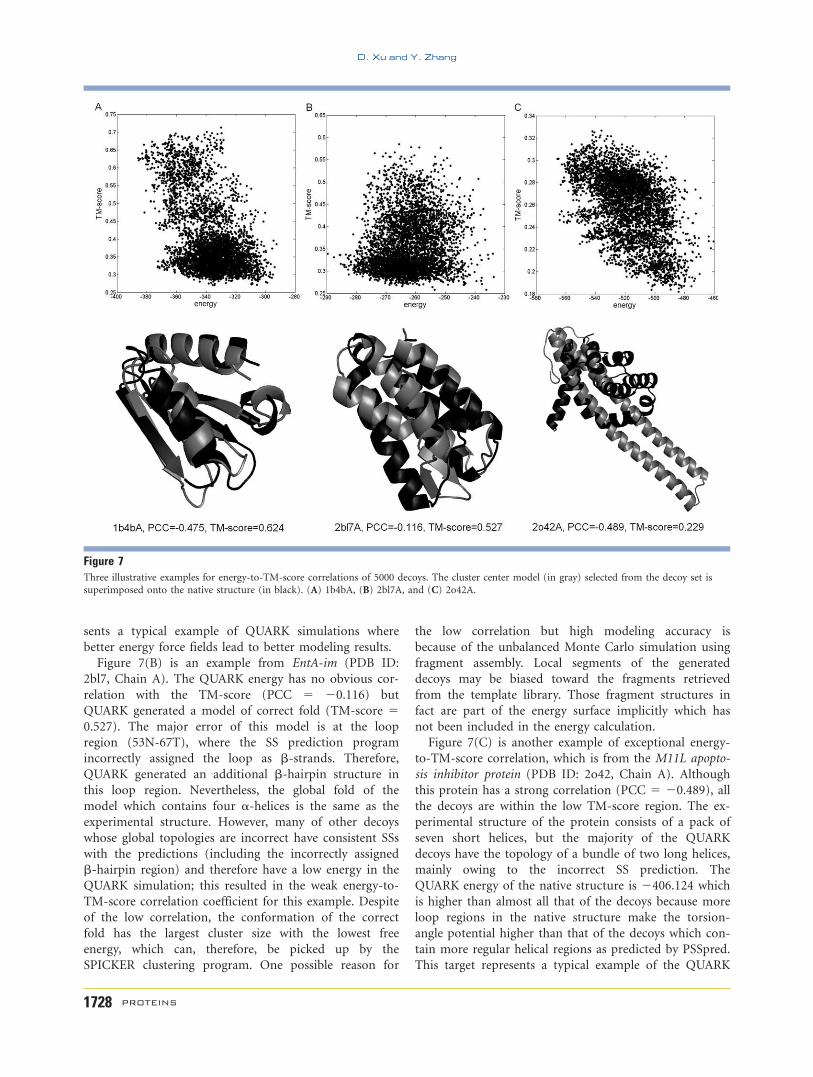
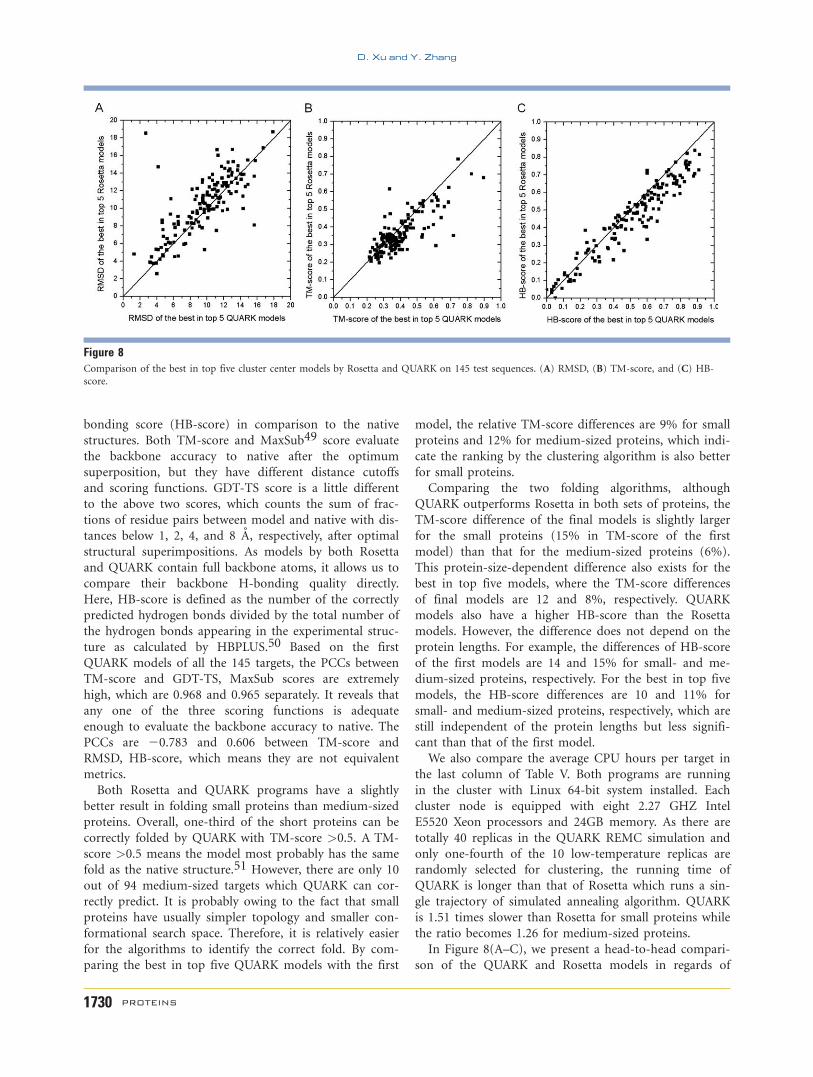
In Figure 8(A–C), we present a head-to-head compari-
son of the QUARK and Rosetta models in regards of
Figure 8Comparison of the best in top five cluster center models by Rosetta and QUARK on 145 test sequences. (A) RMSD, (B) TM-score, and (C) HB-
score.
D. Xu and Y. Zhang
1730 PROTEINS
RMSD, TM-score, and HB-score. According to the
RMSD of the best in top five models, there are 96 out of
145 targets where QUARK models are better than Rosetta
models, whereas QUARK outperforms Rosetta in 95 and
106 cases, respectively, in terms of TM-score and HB-
score. We further conduct the paired Student’s t-test to
check their difference. The P-values of the RMSD, TM-
score and HB-score between the best in top five QUARK
and Rosetta models are 1.51E24, 2.87E27, and
6.88E214 separately, which show their differences are
statistically significant.
Among all the test proteins, a large portion of them
can be modeled with an approximately correct topology
by both Rosetta and QUARK. However, QUARK models
often have better accuracy than Rosetta models for those
targets, as shown in Figure 8(B). The reason is probably
because of the more accurately designed potentials by
QUARK for the low-resolution simulations. In Figure 9,
we present four successful examples where QUARK gen-
erated improved structural models compared with
Rosetta. Figure 9(A,B) shows two a-proteins, whereas
targets in Figures 9(C,D) are a/b-proteins. Target in Fig-
ure 9(A) is the Chain T of SecM-stalled Escherichia coli
ribosome complex (PDB ID 2gyb), which has a simple to-
pology of a three-helix bundle. QUARK folds this target
with a very high accuracy (RMSD 5 1.30 A, TM-score
5 0.90). Rosetta has the fold approximately correct but
breaks the third long helix into two which results in a
much lower TM-score (0.68). Figure 9(B) is from the
sporulation inhibitor pXO2-61 of B. anthracis (PDB ID:
1yku), an a-protein of 132 amino acids containing five
long helices. QUARK model has a TM-score 0.61 where
all the five helices are with correct orientations. Again,
Rosetta breaks two long helices into short ones and mis-
places the orientation of the third helix, which results in
a low TM-score (0.46). The high modeling accuracy of
QUARK for a-proteins in these examples is mainly
owing to the joint effect of the side-chain pair-wise
potential in Eq. (3) and the helix-packing energy term in
Eq. (12).
Figure 9Examples of successful modeling results by QUARK in the benchmark set. Experimental structure, QUARK model, and Rosetta model are in red,
green, and blue separately. (A) 2gybT, (B) 1ykuA, (C) 2v94B, and (D) 1jo0A.
QUARK Ab initio Prediction Method
PROTEINS 1731
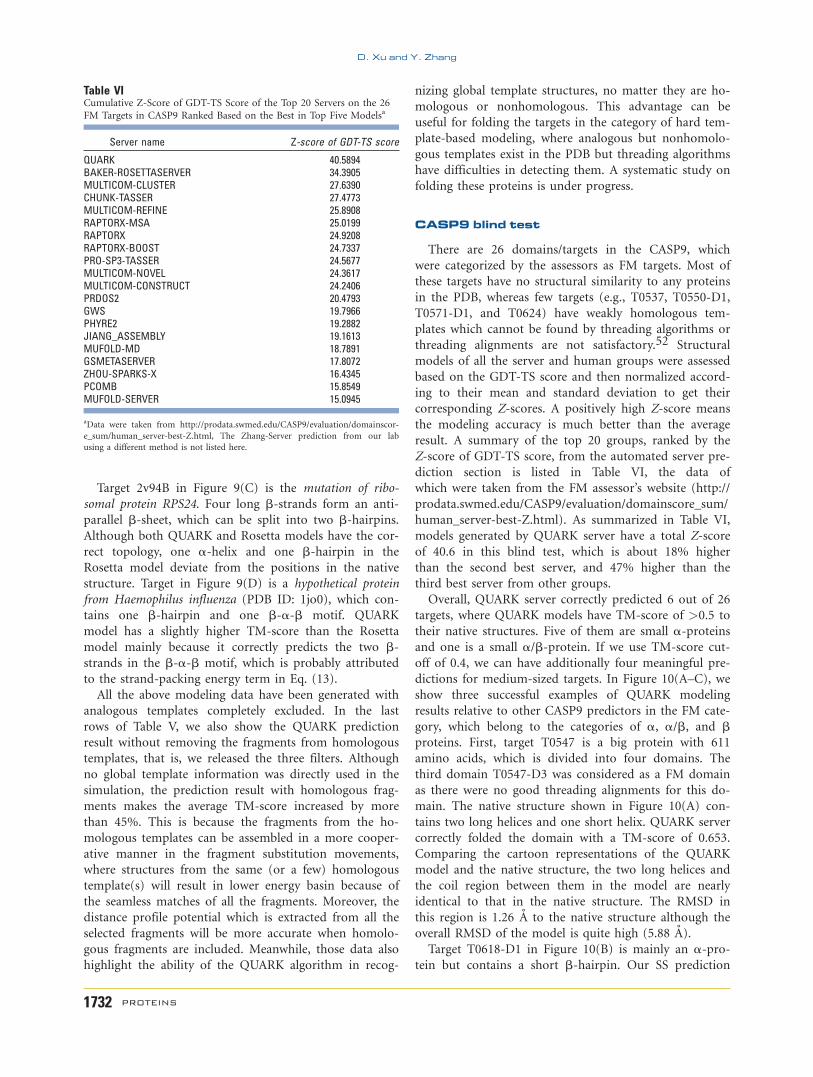
Target 2v94B in Figure 9(C) is the mutation of ribo-
somal protein RPS24. Four long b-strands form an anti-
parallel b-sheet, which can be split into two b-hairpins.Although both QUARK and Rosetta models have the cor-
rect topology, one a-helix and one b-hairpin in the
Rosetta model deviate from the positions in the native
structure. Target in Figure 9(D) is a hypothetical protein
from Haemophilus influenza (PDB ID: 1jo0), which con-
tains one b-hairpin and one b-a-b motif. QUARK
model has a slightly higher TM-score than the Rosetta
model mainly because it correctly predicts the two b-strands in the b-a-b motif, which is probably attributed
to the strand-packing energy term in Eq. (13).
All the above modeling data have been generated with
analogous templates completely excluded. In the last
rows of Table V, we also show the QUARK prediction
result without removing the fragments from homologous
templates, that is, we released the three filters. Although
no global template information was directly used in the
simulation, the prediction result with homologous frag-
ments makes the average TM-score increased by more
than 45%. This is because the fragments from the ho-
mologous templates can be assembled in a more cooper-
ative manner in the fragment substitution movements,
where structures from the same (or a few) homologous
template(s) will result in lower energy basin because of
the seamless matches of all the fragments. Moreover, the
distance profile potential which is extracted from all the
selected fragments will be more accurate when homolo-
gous fragments are included. Meanwhile, those data also
highlight the ability of the QUARK algorithm in recog-
nizing global template structures, no matter they are ho-
mologous or nonhomologous. This advantage can be
useful for folding the targets in the category of hard tem-
plate-based modeling, where analogous but nonhomolo-
gous templates exist in the PDB but threading algorithms
have difficulties in detecting them. A systematic study on
folding these proteins is under progress.
CASP9 blind test
There are 26 domains/targets in the CASP9, which
were categorized by the assessors as FM targets. Most of
these targets have no structural similarity to any proteins
in the PDB, whereas few targets (e.g., T0537, T0550-D1,
T0571-D1, and T0624) have weakly homologous tem-
plates which cannot be found by threading algorithms or
threading alignments are not satisfactory.52 Structural
models of all the server and human groups were assessed
based on the GDT-TS score and then normalized accord-
ing to their mean and standard deviation to get their
corresponding Z-scores. A positively high Z-score means
the modeling accuracy is much better than the average
result. A summary of the top 20 groups, ranked by the
Z-score of GDT-TS score, from the automated server pre-
diction section is listed in Table VI, the data of
which were taken from the FM assessor’s website (http://
prodata.swmed.edu/CASP9/evaluation/domainscore_sum/
human_server-best-Z.html). As summarized in Table VI,
models generated by QUARK server have a total Z-score
of 40.6 in this blind test, which is about 18% higher
than the second best server, and 47% higher than the
third best server from other groups.
Overall, QUARK server correctly predicted 6 out of 26
targets, where QUARK models have TM-score of >0.5 to
their native structures. Five of them are small a-proteinsand one is a small a/b-protein. If we use TM-score cut-
off of 0.4, we can have additionally four meaningful pre-
dictions for medium-sized targets. In Figure 10(A–C), we
show three successful examples of QUARK modeling
results relative to other CASP9 predictors in the FM cate-
gory, which belong to the categories of a, a/b, and bproteins. First, target T0547 is a big protein with 611
amino acids, which is divided into four domains. The
third domain T0547-D3 was considered as a FM domain
as there were no good threading alignments for this do-
main. The native structure shown in Figure 10(A) con-
tains two long helices and one short helix. QUARK server
correctly folded the domain with a TM-score of 0.653.
Comparing the cartoon representations of the QUARK
model and the native structure, the two long helices and
the coil region between them in the model are nearly
identical to that in the native structure. The RMSD in
this region is 1.26 A to the native structure although the
overall RMSD of the model is quite high (5.88 A).
Target T0618-D1 in Figure 10(B) is mainly an a-pro-tein but contains a short b-hairpin. Our SS prediction
Table VICumulative Z-Score of GDT-TS Score of the Top 20 Servers on the 26
FM Targets in CASP9 Ranked Based on the Best in Top Five Modelsa
Server name Z-score of GDT-TS score
QUARK 40.5894BAKER-ROSETTASERVER 34.3905MULTICOM-CLUSTER 27.6390CHUNK-TASSER 27.4773MULTICOM-REFINE 25.8908RAPTORX-MSA 25.0199RAPTORX 24.9208RAPTORX-BOOST 24.7337PRO-SP3-TASSER 24.5677MULTICOM-NOVEL 24.3617MULTICOM-CONSTRUCT 24.2406PRDOS2 20.4793GWS 19.7966PHYRE2 19.2882JIANG_ASSEMBLY 19.1613MUFOLD-MD 18.7891GSMETASERVER 17.8072ZHOU-SPARKS-X 16.4345PCOMB 15.8549MUFOLD-SERVER 15.0945
aData were taken from http://prodata.swmed.edu/CASP9/evaluation/domainscor-
e_sum/human_server-best-Z.html, The Zhang-Server prediction from our lab
using a different method is not listed here.
D. Xu and Y. Zhang
1732 PROTEINS
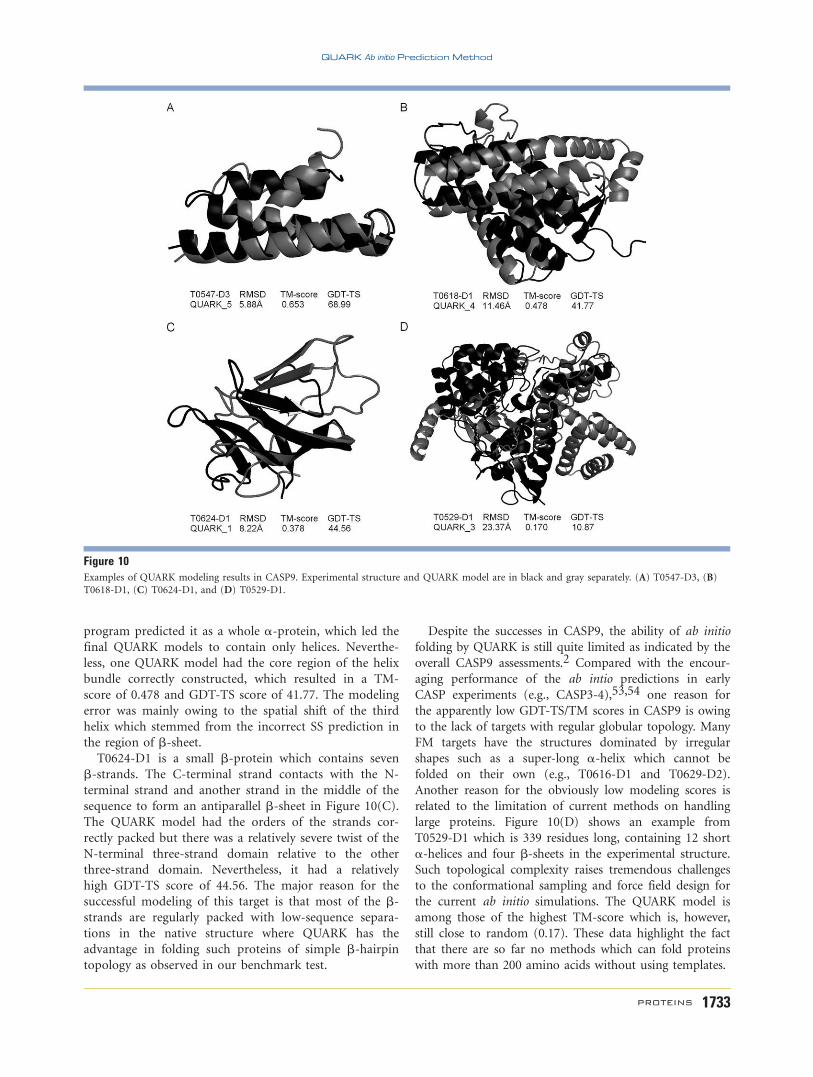
program predicted it as a whole a-protein, which led the
final QUARK models to contain only helices. Neverthe-
less, one QUARK model had the core region of the helix
bundle correctly constructed, which resulted in a TM-
score of 0.478 and GDT-TS score of 41.77. The modeling
error was mainly owing to the spatial shift of the third
helix which stemmed from the incorrect SS prediction in
the region of b-sheet.T0624-D1 is a small b-protein which contains seven
b-strands. The C-terminal strand contacts with the N-
terminal strand and another strand in the middle of the
sequence to form an antiparallel b-sheet in Figure 10(C).
The QUARK model had the orders of the strands cor-
rectly packed but there was a relatively severe twist of the
N-terminal three-strand domain relative to the other
three-strand domain. Nevertheless, it had a relatively
high GDT-TS score of 44.56. The major reason for the
successful modeling of this target is that most of the b-strands are regularly packed with low-sequence separa-
tions in the native structure where QUARK has the
advantage in folding such proteins of simple b-hairpintopology as observed in our benchmark test.
Despite the successes in CASP9, the ability of ab initio
folding by QUARK is still quite limited as indicated by the
overall CASP9 assessments.2 Compared with the encour-
aging performance of the ab intio predictions in early
CASP experiments (e.g., CASP3-4),53,54 one reason for
the apparently low GDT-TS/TM scores in CASP9 is owing
to the lack of targets with regular globular topology. Many
FM targets have the structures dominated by irregular
shapes such as a super-long a-helix which cannot be
folded on their own (e.g., T0616-D1 and T0629-D2).
Another reason for the obviously low modeling scores is
related to the limitation of current methods on handling
large proteins. Figure 10(D) shows an example from
T0529-D1 which is 339 residues long, containing 12 short
a-helices and four b-sheets in the experimental structure.
Such topological complexity raises tremendous challenges
to the conformational sampling and force field design for
the current ab initio simulations. The QUARK model is
among those of the highest TM-score which is, however,
still close to random (0.17). These data highlight the fact
that there are so far no methods which can fold proteins
with more than 200 amino acids without using templates.
Figure 10Examples of QUARK modeling results in CASP9. Experimental structure and QUARK model are in black and gray separately. (A) T0547-D3, (B)
T0618-D1, (C) T0624-D1, and (D) T0529-D1.
QUARK Ab initio Prediction Method
PROTEINS 1733
CONCLUSIONS
We have developed a new algorithm, QUARK, for ab
initio protein structure prediction. The protein confor-
mations are specified by the full-atom of backbone (N,
Ca, C, O, Cb, H) and side-chain center of mass (SC).
Such a semi-reduced model facilitates the design of
atomic-level force fields such as H-bonding, van der
Waals, backbone torsion-angle, and atomic pair-wise
interactions, which cannot be implemented by the con-
ventional reduced models4,17 that simplify each residue
by two or three virtual points. The conformations are
represented in both Cartesian and torsion-angle coordi-
nate systems, which significantly facilitate the conforma-
tional movements and energy calculations. As the ability
of ab initio protein structure predictions is mainly barred
by the inaccurate force field and limited conformational
search power, we present an effort to attack both aspects
of the problem by the development and benchmarking of
the QUARK algorithm.
Folding a protein structure by ab initio modeling
essentially requires force fields to guide both local struc-
tural packing and global topology assembly. There have
been a number of well-developed energy terms for local
SS constructions. But the more important short-range
interactions between residues far apart in the sequence
are generally lacked. The energy force field of QUARK
covers three levels of structural packing: atom-, residue-,
and topology-level energy terms. Especially, it includes
several topology-level terms to account for the motif
packing which are essential for assembling the global to-
pology of protein structures in the template-free protein
folding. Another helpful term is the fragment-based dis-
tance profile, where distance contacts between residue
pairs with both short and long sequence separations can
be derived from unrelated experimental structures based
on the cooperative occurrence of fragment motifs in the
same templates. This is different from the traditional
contact predictions from homologous templates55,56 or
machine learning,57,58 but provides comparable accuracy
for free-modeling targets. The other energy terms from
traditional considerations including SA, hydrogen-bond-
ing, and pair-wide atomic interactions have been recon-
structed and validated which help enhance both local
and global structural packing.
To speed up the conformational search, 11 local struc-
tural movements have been designed with the major
focus on increasing the average acceptance rate. Although
the fragment substitution and rotation movements were
borrowed from Rosetta and I-TASSER programs, which
are essential for reducing the size of the conformational
search space, the composite design of local movements
helps increase the flexibility and efficiency of the confor-
mational search significantly.
Based on the benchmark test, we showed that more
than one-third of short proteins (<100 residues) could
be successfully folded by QUARK with a TM-score of
>0.5 even after a stringent exclusion of all experimental
structures which have any sequence or structure similar-
ity to the target. For proteins with lengths >100 residues,
the successful rate is lower but there are still 31% targets
for which QUARK constructed reasonable structural folds
with a TM-score of >0.4. The average TM-score of the
models by QUARK on the 145 benchmark proteins is
10% higher than that by Rosetta, one of the state-of-the-
art algorithms in ab initio protein structure prediction.
The QUARK method was also tested in the recent com-
munity-wide CASP9 experiment. The total Z-score of the
GDT-TS score is 18% higher than the second best pro-
gram and 47% higher than the third best program from
other groups. These data demonstrated new progress in
the field of ab initio protein structure predictions.
Nevertheless, we witnessed several cases where global
energy minima have not been reached in current simula-
tions. Some cases were owing to the complexity of the
structural topology such as b-proteins of complicated
strand arrangement. We are working on enumerating all
types of typical b-topologies as QUARK starting confor-
mations which hopefully can partially address this issue.
The other cases were owing to the incorrect local and
global restraints which trap the simulations to specific
topologies, which are caused apparently by the combined
effect of both force field and search engine. Therefore,
continuous efforts in both aspects of force field develop-
ment and conformational search improvement are still
required.
REFERENCES
1. Ben-David M, Noivirt-Brik O, Paz A, Prilusky J, Sussman JL, Levy
Y. Assessment of CASP8 structure predictions for template free tar-
gets. Proteins 2009;77:50–65.
2. Kinch L, Yong Shi S, Cong Q, Cheng H, Liao Y, Grishin NV.
CASP9 assessment of free modeling target predictions. Proteins
2011;79:59–73.
3. Bradley P, Misura KM, Baker D. Toward high-resolution de novo
structure prediction for small proteins. Science 2005;309:1868–1871.
4. Zhang Y, Kolinski A, Skolnick J. TOUCHSTONE II: a new
approach to ab initio protein structure prediction. Biophys J
2003;85:1145–1164.
5. Wu S, Skolnick J, Zhang Y. Ab initio modeling of small proteins by
iterative TASSER simulations. Biomed Chromatogr Biol 2007;5:17.
6. Klepeis JL, Wei Y, Hecht MH, Floudas CA. Ab initio prediction of
the three-dimensional structure of a de novo designed protein: a
double-blind case study. Proteins 2005;58:560–570.
7. Brooks BR, Bruccoleri RE, Olafson BD, States DJ, Swaminathan S,
Karplus M. CHARMM: a program for macromolecular energy,
minimization, and dynamics calculations. J Comput Chem 1983;
4:187–217.
8. Case DA, Pearlman DA, Caldwell JA, Cheatham TE, Ross WSea.
AMBER 5.0. 1997; University of California, San Francisco, San
Francisco.
9. Berman HM, Westbrook J, Feng Z, Gilliland G, Bhat TN, Weissig
H, Shindyalov IN, Bourne PE. The Protein Data Bank. Nucleic
Acids Res 2000;28:235–242.
D. Xu and Y. Zhang
1734 PROTEINS
10. Summa CM, Levitt M. Near-native structure refinement using in
vacuo energy minimization. Proc Natl Acad Sci USA 2007;104:
3177–3182.
11. MacCallum JL, Hua L, Schnieders MJ, Pande VS, Jacobson MP, Dill
KA. Assessment of the protein-structure refinement category in
CASP8. Proteins 2009;77:66–80.
12. Skolnick J. In quest of an empirical potential for protein structure
prediction. Curr Opin Struct Biol 2006;16:166–171.
13. Anfinsen CB. Principles that govern the folding of protein chains.
Science 1973;181:223–230.
14. Simons KT, Kooperberg C, Huang E, Baker D. Assembly of protein
tertiary structures from fragments with similar local sequences
using simulated annealing and Bayesian scoring functions. J Mol
Biol 1997;268:209–225.
15. Zhang Y, Skolnick J. Automated structure prediction of weakly ho-
mologous proteins on a genomic scale. Proc Natl Acad Sci USA
2004;101:7594–7599.
16. Zhang Y. Template-based modeling and free modeling by I-TASSER
in CASP7. Proteins 2007;69:108–117.
17. Liwo A, Khalili M, Czaplewski C, Kalinowski S, Oldziej S, Wachucik
K, Scheraga HA. Modification and optimization of the united-resi-
due (UNRES) potential energy function for canonical simulations.
I. Temperature dependence of the effective energy function and
tests of the optimization method with single training proteins. J
Phys Chem B 2007;111:260–285.
18. Roy A, Kucukural A, Zhang Y. I-TASSER: a unified platform for
automated protein structure and function prediction. Nat Protoc
2010;5:725–738.
19. Moult J, Fidelis K, Kryshtafovych A, Rost B, Tramontano A. Critical
assessment of methods of protein structure prediction-Round VIII.
Protein Struct Funct Bioinformatics 2009;77:1–4.
20. Moult J, Fidelis K, Kryshtafovych A, Rost B, Hubbard T, Tramon-
tano A. Critical assessment of methods of protein structure predic-
tion-Round VII. Proteins 2007;69:3–9.
21. Wang G, Dunbrack RL, Jr. PISCES: a protein sequence culling
server. Bioinformatics 2003;19:1589–1591.
22. Wu S, Zhang Y. LOMETS: a local meta-threading-server for protein
structure prediction. Nucleic Acids Res 2007;35:3375–3382.
23. Zhang Y, Skolnick J. TM-align: a protein structure alignment algo-
rithm based on the TM-score. Nucleic Acids Res 2005;33:2302–
2309.
24. Xu D, Zhang Y. Improving the physical realism and structural accu-
racy of protein models by a two-step atomic-level energy minimiza-
tion. Biophys J 2011;101:2525–2534.
25. Altschul SF, Madden TL, Schaffer AA, Zhang J, Zhang Z, Miller W,
Lipman DJ. Gapped BLAST and PSI-BLAST: a new generation of
protein database search programs. Nucleic Acids Res 1997;25:3389–
3402.
26. Rumelhart DE, Hinton GE, Williams RJ. Learning representations
by back-propagating errors. Nature 1986;323:533–536.
27. Wu S, Zhang Y. MUSTER: Improving protein sequence profile-pro-
file alignments by using multiple sources of structure information.
Proteins 2008;72:547–556.
28. Park SK, Miller KW. Random number generators: good ones are
hard to find. Commun ACM 1988;31:1192–1201.
29. Zhang Y, Skolnick J. Scoring function for automated assessment of
protein structure template quality. Proteins 2004;57:702–710.
30. Zhang Y, Skolnick J. SPICKER: A clustering approach to identify
near-native protein folds. J Comput Chem 2004;25:865–871.
31. Sippl MJ. Calculation of conformational ensembles from potentials
of mean force. An approach to the knowledge-based prediction of
local structures in globular proteins. J Mol Biol 1990;213:859–883.
32. Zhou H, Zhou Y. Distance-scaled, finite ideal-gas reference state
improves structure-derived potentials of mean force for structure
selection and stability prediction. Protein Sci 2002;11:2714–2726.
33. Kabsch W, Sander C. Dictionary of protein secondary structure:
pattern recognition of hydrogen-bonded and geometrical features.
Biopolymers 1983;22:2577–2637.
34. Hobohm U, Scharf M, Schneider R, Sander C. Selection of repre-
sentative protein data sets. Protein Sci 1992;1:409–417.
35. Xu D, Zhang Y. Generating triangulated macromolecular surfaces
by Euclidean distance transform. PLoS One 2009;4:e8140.
36. Ramachandran GN, Sasisekharan V. Conformation of polypeptides
and proteins. Adv Protein Chem 1968;23:283–438.
37. Swendsen RH, Wang JS. Replica Monte Carlo simulation of spin
glasses. Phys Rev Lett 1986;57:2607–2609.
38. Canutescu AA, Dunbrack RL, Jr. Cyclic coordinate descent: a
robotics algorithm for protein loop closure. Protein Sci
2003;12:963–972.
39. da Silva RA, Degreve L, Caliri A. LMProt: an efficient algorithm for
Monte Carlo sampling of protein conformational space. Biophys J
2004;87:1567–1577.
40. Hutchinson EG, Thornton JM. A revised set of potentials for beta-
turn formation in proteins. Protein Sci 1994;3:2207–2216.
41. Hutchinson EG, Thornton JM. PROMOTIF—a program to identify
and analyze structural motifs in proteins. Protein Sci 1996;5:212–
220.
42. Metropolis N, Rosenbluth AW, Rosenbluth MN, Teller AH, Teller E.
Equation of state calculations by fast computing machines. J Chem
Phys 1953;21:1087–1092.
43. Rohl CA, Strauss CE, Misura KM, Baker D. Protein structure pre-
diction using Rosetta. Methods Enzymol 2004;383:66–93.
44. Simons KT, Bonneau R, Ruczinski I, Baker D. Ab initio protein
structure prediction of CASP III targets using ROSETTA. Proteins
1999;37:171–176.
45. Bonneau R, Tsai J, Ruczinski I, Chivian D, Rohl C, Strauss CE,
Baker D. Rosetta in CASP4: progress in ab initio protein structure
prediction. Proteins 2001;S5:119–126.
46. Jones DT. Protein secondary structure prediction based on posi-
tion-specific scoring matrices. J Mol Biol 1999;292:195–202.
47. Kabsch W. A solution for the best rotation to relate two sets of vec-
tors. Acta Cryst 1976;32A:922–923.
48. Zemla A. LGA: A method for finding 3D similarities in protein
structures. Nucleic Acids Res 2003;31:3370–3374.
49. Siew N, Elofsson A, Rychlewski L, Fischer D. MaxSub: an auto-
mated measure for the assessment of protein structure prediction
quality. Bioinformatics 2000;16:776–785.
50. McDonald IK, Thornton JM. Satisfying hydrogen bonding potential
in proteins. J Mol Biol 1994;238:777–793.
51. Xu J, Zhang Y. How significant is a protein structure similarity with
TM-score 5 0.5? Bioinformatics 2010;26:889–895.
52. Kinch LN, Shi S, Cheng H, Cong Q, Pei J, Mariani V, Schwede T,
Grishin NV. CASP9 target classification. Proteins 2011;79:21–36.
53. Orengo CA, Bray JE, Hubbard T, LoConte L, Sillitoe I. Analysis and
assessment of ab initio three-dimensional prediction, secondary
structure, and contacts prediction. Proteins 1999;S3:149–170.
54. Lesk AM, Lo Conte L, Hubbard TJ. Assessment of novel fold targets
in CASP4: predictions of three-dimensional structures, secondary
structures, and interresidue contacts. Proteins 2001;S5:98–118.
55. Sali A, Blundell TL. Comparative protein modelling by satisfaction
of spatial restraints. J Mol Biol 1993;234:779–815.
56. Skolnick J, Kolinski A, Ortiz AR. MONSSTER: a method for folding
globular proteins with a small number of distance restraints. J Mol
Biol 1997;265:217–241.
57. Shackelford G, Karplus K. Contact prediction using mutual infor-
mation and neural nets. Proteins 2007;69:159–164.
58. Wu S, Szilagyi A, Zhang Y. Improving protein structure prediction
using multiple sequence-based contact predictions. Structure
2011;19:1182–1191.
QUARK Ab initio Prediction Method
PROTEINS 1735