Embed Size (px)
Citation preview

Coastal Adaptation Decision Pathways Project (CAP)
Assessment and Decision Frameworks for Seawall Structures
2013
Case Study Bilgola
Appendix E

The Sydney Coastal Councils Group (SCCG) is a voluntary Regional Organisation of Councils representing fifteen coastal and estuarine councils in the Sydney region. The Group promotes cooperation and coordination between Members to achieve the sustainable management of the urban coastal environment.
Project Management
Geoff Withycombe Executive Officer Sydney Coastal Councils Group
Douglas Lord Director Coastal Environment Pty Ltd
Professor Rodger Tomlinson Director Griffith Centre for Coastal Management Griffith University
Project Co-ordination
Dr Ian Armstrong Project Officer - Climate Change Adaptation Sydney Coastal Councils Group Ph: 02 9288.5802 [email protected]
Disclaimer The information contained in this publication comprises general statements based on investigations into the development of policy and practice related to Climate Change. The reader is advised, and needs to be aware, that such information may be incomplete or unable to be used in any specific situation, including the case studies used in the investigations. No reliance or actions must therefore be made on that information without seeking prior expert professional, scientific, and technical advice. To the extent permitted by law the SCCG (including its employees and consultants) excludes all liability to any person for any consequences, including but not limited to all losses, damages, costs, expenses and any other compensation, arising directly or indirectly from using this publication and any information or material contained in it.
Funding has been provided by the Australian Government represented by the Department of Climate Change and Energy Efficiency. The Coastal Adaptation Decision Pathways project is an Australian Government Initiative.
Cover image: Coastal seawall. Provided by Douglas Lord

Assessment and Decision Frameworks for Seawall Structures Appendix E Case Study – Bilgola Beach Prepared for Sydney Coastal Councils Group Prepared by Water Research Laboratory University of New South Wales 110 King Street Manly Vale NSW 2093 21 April 2013 Printed on Australian recycled paper. © Sydney Coastal Councils Group 2013 This work is copyright. Apart from any use as permitted under the Copyright Act 1968, no part may be reproduced by any process without prior written permission from the copyright holder

Part A Synthesis ReportPart B Appendices Appendix A – Literature Review Appendix B – Geotechnical Considerations Appendix C – Economic Considerations Appendix D – Site Field Data Collection Appendix E – Case Study Bilgola Appendix F – Case Study Clontarf Appendix G – Case Study Gold Coast

Assessment and Decision Frameworks for Seawall Structures
Appendix E Case Study – Bilgola Beach Page i
APPENDIX E PREFACE
This Appendix was prepared by the Water Research Laboratory (WRL) of the University of New South Wales for this Report titled Assessment and Decision Frameworks for Seawall Structures. The purpose of the information in this Appendix was to assess the likely design elements applicable to a range of seawalls existing on Bilgola Beach based on existing information and on the results of field data collection as documented in Appendix E. The ‘probable’ design cross-sections were then subjected to design assessment using appropriate design conditions for current and future sea levels.
The assessment reported in this Appendix should not be construed as a detailed assessment of the adequacy or otherwise of any of the seawalls at Bilgola Beach. The study was purely a technical exercise in demonstrating an appropriate methodology for seawall assessment as applied by a leading coastal engineering consultancy. No consideration was given to the economic, wider environmental and community values or planning frameworks associated with managing seawalls. In particular, many of the design assumptions may not be appropriate relying on available information and generic values. They could be refined with more detailed investigation. While it is intended the document will be used widely, with councils in many locations as its intended audience, it cannot be assumed that all seawalls are a council-owned asset and that in instances, there could be multiple ownership/responsibility issues that have not been considered in this assessment as they are outside the scope of this project.
The authors of the WRL report were A. Mariani and I. Coghlan. It has been published by WRL as a single Report WRL2012/13 titled Seawall Structure Assessment at Bilgola and Clontarf, Sydney, NSW which includes the information included here as Appendix D, Appendix E and Appendix F. That WRL report was released in September 2012 and can also be viewed in that format.
The information included here has been taken in its entirety from the WRL report and is a true reflection of the original advice provided to the project by the Water Research Laboratory. No additions, edits or changes have been made to their final report, other than minor editorial and layout changes for consistency in appearance. References to sections, figures and tables are to those included within this Appendix or the associated Appendices as quoted.
As appropriate, information from this Appendix has been incorporated or referenced in the main report for this project.

Assessment and Decision Frameworks for Seawall Structures
Appendix E Case Study – Bilgola Beach Page ii
CONTENTS
1. Introduction 1
2. Assessment of Open Coast Seawalls (Bilgola Beach Case Study) 3
2.1 Overview 3
2.2 Literature Review 5
2.2.1 Coastal Hazard Definition Studies 5 2.2.2 Coastal Process Studies 6 2.2.3 Coastline Management Studies 6 2.2.4 Coastal Engineering Reports 6 2.2.5 Data Collection Reports 7
2.3 Structure Characterisation 7
2.4 Environmental Conditions 15
2.4.1 General 15 2.4.2 Design Life and Design Event 15 2.4.3 Design Wave Conditions 16 2.4.4 Design Water Levels 17 2.4.5 Sea Level Rise Projections 18 2.4.6 Erosion and Recession 18
2.5 Seawall Assessment 19
2.5.1 Overview 19 2.5.2 Toe Undermining 20 2.5.3 Wall Stability Under Wave Action 29 2.5.4 Wave Overtopping 31 2.5.5 Sea Level Rise Impacts 33 2.5.6 Summary 37
2.6 Remedial Options 41
2.6.1 Emergency and Short Term 41 2.6.2 Medium and Long-term Structural Options 41
2.7 Future Management 42
2.8 Conclusions 43
3. References 44

Assessment and Decision Frameworks for Seawall Structures
Appendix E Case Study – Bilgola Beach Page iii
TABLES
2.1 Summary of Assessed Seawalls at Bilgola Beach 4
2.2 Bilgola Beach Seawall Characteristics and Present Conditions 10
2.3 Annual Probability of Exceedance of Design Wave Events 16
2.4 Extreme Offshore Wave Conditions (All Directions) 17
2.5 Bilgola Beach Nearshore Extreme Wave Conditions (-4 m AHD Contour) 17
2.6 Design Water Levels, Tide + Storm Surge 17
2.7 Design Water Levels Including Wave Setup Excluding Wave Runup 17
2.8 Sea Level Rise Projections 18
2.9 Summary of Design Storm Demand and Active Slope for Bilgola Beach 19
2.10 Summary of Factors Influencing the Likelihood of Toe Undermining at Bilgola Beach 20
2.11 Weggel Seawall Classification 22
2.12 SBEACH Validated Model Parameters 23
2.13 Change in Dune Volume for Three Consecutive Design Storms (No Seawall) 25
2.14 100-year ARI Scour Depth Predictions at Bilgola Beach Seawalls 26
2.15 Scour Depth Predictions at Bilgola Beach Seawalls for a Range of ARI 27
2.16 Bilgola Beach ‘At Structure’ Extreme Wave Conditions 29
2.17 Classification of Rock Armour Damage Limits 30
2.18 Armour Stability Predictions for Bilgola Beach Seawall 1 30
2.19 Limits for Tolerable Mean Wave Overtopping Discharge 32
2.20 Predicted Overtopping Rates at Bilgola Beach Seawalls for 100-year ARI Storm Event 33
2.21 Predicted Overtopping Rates for 1-, 10- and 50-year ARI Storm Events 33
2.22 Beach Profile Response to Sea Level Rise Projections 34
2.23 Scour Level Predictions for 2050 and 2100 Planning Horizons 35
2.24 ‘At Structure’ Extreme Wave Conditions for 2050 and 2100 Planning Horizons 35
2.25 Wall Stability Predictions for Seawall 1 for 2050 and 2100 Planning Horizons 35
2.26 Wall Stability Predictions for Seawall 2B for 2050 and 2100 Planning Horizons 36
2.27 Predicted Overtopping Rates for 2050 and 2100 Planning Horizons 37
2.28 Summary of Seawall Assessment for Present Day, 2050 and 2100 Planning Horizons 38
2.29 Encounter Probability for ARI Event and Service Life 38
2.30 Predicted Failure Mechanism and Timing for Bilgola Beach Seawalls 39

Assessment and Decision Frameworks for Seawall Structures
Appendix E Case Study – Bilgola Beach Page iv
FIGURES
1.1 Methodology Applied for Seawall Suitability Assessment in Appendices E and F 2
2.1 Location of Bilgola Beach Sydney NSW 4
2.2 Seawall Locations at Bilgola Beach 5
2.3 Bilgola Beach Seawall 1 Fronting Allen Avenue Properties 11
2.4 Bilgola Beach Seawalls 2A and 2B Fronting 21 Bilgola Avenue 12
2.5 Bilgola Beach Seawall 3 Fronting Bilgola SLSC 10 April, 2012 13
2.6 Bilgola Beach Seawall Cross-sections (1, 2A and 2B) 14
2.7 Bilgola Beach Seawall Cross Section 3 15
2.8 Seawall Location According to Weggel Classification 22
2.9 100 year ARI Synthetic Design Swell Time Series for Bilgola Beach 23
2.10 Selected Photogrammetry Profiles at Bilgola Beach 25
2.11 Example SBEACH Erosion Modelling for 100-year ARI Event on Seawall 2A 26
2.12 Comparison of Predicted Scour Levels with Existing Toe Levels 28
2.13 Example SBEACH Erosion Modelling Input for Seawall 3 34

Assessment and Decision Frameworks for Seawall Structures
Appendix E Case Study – Bilgola Beach Page v
GLOSSARY
accretion On a beach, deposition of sediment (typically sand) transported naturally to the location by waves, currents and winds
active beach zone The section of the beach from the offshore limit of onshore/ offshore sand movement under waves to the landward limit of wave uprush during storms
active slope The slope of the nearshore area which adjusts to prevailing waves and currents through associated erosion or accretion. Tends to be flatter on an eroding profile and steeper on an accreting profile
aeolian processes Pertaining generally to sand or sediment moved and deposited by wind above the mean high water mark
altimetry The measurement of altitude annual exceedance probability (AEP)
The likelihood that an event of a given size, on average, occurs or is exceeded once each year (e.g. wave height, water level, wind velocity). It may occur several times in one year or may not occur for several years. See also exceedance probability.
asymptotic A measured value that approaches some maximum (or minimum) limiting value. For example, a plot of wave heights or wind velocities over time will approach some maximum limiting value, that will not be exceeded
barometric setup The increase in means sea level caused by a change in barometric pressure. If barometric pressure is low (cyclone) then sea level is elevated above normal, if barometric pressure is high (anticyclone) then sea level is depressed below normal average levels
buttress A structural support to a (vertical) retaining wall constructed on the seaward side to resist the load of the retained fill on the landward side causing the wall to tilt. See also counterfort
counterfort A structural support to a (vertical) retaining wall constructed on the landward side to resist the load of the retained fill on the landward side causing the wall to tilt. See also buttress
deepwater wave height
Water depth in which the velocity generated by the action of the wave is negligible. Commonly referred to as half the length of the wave in deep water
depth-limited The maximum height of a wave that can be transmitted and break in a given water depth. Commonly used as a limiting design condition for shoreline structures in exposed coastal locations where the biggest wave reaching the structure is controlled by the water depth at the strucutre. Larger waves will break offshore in greater depths, not reaching the structure as an unbroken wave
diffraction The bending of a wave front as it reaches shallow water and slows down. Diffraction can result in focussing or spreading of waves which increase in height as they slow down. On a straight, parallel shoreline as the wave length decreases the wave height increases to maintain the wave energy (shoaling)
dissipative equilibrium
Waves approaching shallow water maintain dissipative equilibrium. As energy dissipates through friction, turbulence diffraction and wave breaking, the wave momentum is in equilibrium with the wave height and velocity
Assessment and Decision Frameworks for Seawall Structures
Appendix E Case Study – Bilgola Beach Page vi
equilibrium profile A theoretical profile shape that would occur on a sandy beach profile with certain sand properties and given wave conditions and water level. Commonly used in numerical models to illustrate the impact of changing conditions on the profile slope
gabion A factor of safety usually expressed as a height above the designated inundation level commonly applied for planning purposes
geotextile A permeable geosynthetic sheet comprised solely of textiles, used in geotechnical engineering construction. Materials may be either woven or needle punched and are robust Commonly geotextiles provide a filter layer under rock armour or can be fashioned into containers filled with sand used as armour units in a structure
groundwater Water beneath the surface of the ground, often perched above an impervious layer
incident wave Wave moving landward at a particular location and time Mean High Water Springs (MHWS)
The ocean level that is the average of all the twice-daily high tides at spring periods
mean sea level The average level of the surface of the sea over a long period of time in all stages of oscillation. Also the average level which would exist in the absence of tides. Approximately 0m AHD
nearshore That section of the shoreline extending from the onshore limit of storm wave action to the landward edge of the offshore region. Commonly defined as the limit of onshore/offshore sediment movement under wave action and typically in a water depth of 10m to 30m
outflank At the end of a seawall or where gaps exist in a discontinuous seawall, during storm events waves and erosion can penetrate behind the exposed ends of the seawall, causing collapse of the structure from the landward side
overtopping bore Where a seawall is significantly overtopped, the volume of water travelling inland beyond the crest as a single wave front
photogrammetry The process of making surveys, maps and measurements using overlapping vertical aerial photography
propagation distance
The distance which a wave has travelled form the original point of origin
recession The landward movement of a shoreline over time (e.g. receding shoreline). Can be caused by erosion resulting in more sediment leaving a coastal compartment than is entering it, or as a result of sea level rise inundating the shoreline over time
reflected wave Waves travelling toward a shoreline or structure will be partly dissipated against the structure and partly reflected from the structure. Where reflection is high (such as a vertical seawall or cliff) wave heights immediately seaward may be increased and the depth of wave scour at the sea bed correspondingly increased
refraction The process by which the direction of a wave train moving in shallow water at an angle to the contours is changed to align itself parallel to the shoreline. That part of the wave in deeper water moves faster than that part in shallower water, causing the wave to bend as it approaches the shore

Assessment and Decision Frameworks for Seawall Structures
Appendix E Case Study – Bilgola Beach Page vii
rubble mound rock armour
The larger size stone intentionally placed on the exposed surface of a seawall or revetment, specifically to resist and dissipate the forces of waves on the structure
scour Erosion, normally by the action of flowing water or wave action sea level rise (SLR) A rise in mean sea level when averaged over an extended time period. In
terms of climate change is usually used to describe the predicted or projected increase in the mean sea level that will occur to a future date measured above the 1990 mean sea level
sediment transport The main agencies by which sediments are moved are gravity (gravity transport); running water (rivers and streams); ice (glaciers); wind; the sea (currents and alongshore drift). Running water and wind are the most widespread transporting agents. In both cases, three mechanisms operate, although the particle size of the transported material involved is very different, owing to the differences in density and viscosity of air and water. The three processes are rolling or traction, in which the particle moves along the bed but is too heavy to be lifted from it; saltation; and suspension, in which particles remain permanently above the bed, sustained there by the turbulent flow of the air or water
significant wave height
The average height of the highest one third of waves recorded in a given monitoring period. Also referred to as H1/3 or Hs. Commonly referenced statistical wave height
stillwater level The surface of the water if all wave and wind action were to cease. In deep water this level approximates the midpoint of the wave height. In shallow water it is nearer to the trough than the crest. Also called the undisturbed water level
storm demand That volume of sand located on a beach that can theoretically be eroded and removed offshore by a single storm event or close spaced series of storms. Provides an indication of the susceptibility of a beach to storm erosion
storm surge The increase in onshore elevation of the mean ocean level associated with a storm. Primarily comprises a tidal component, a barometric component (low pressure) and wind setup caused by strong onshore winds at the shoreline, but does not include wave setup and wave runup
toe level The level of the seaward base of a seawall water table The upper surface of a zone of saturation, where the body of groundwater is
not confined by an overlying impermeable formation. Where an overlying confining formation exists, the aquifer in question has no water table
wave period The time interval occurring between two consecutive wave crests wave return parapet
A small structure constructed at the crest line of a seawall to limit minor wave overtopping by increasing the crest height. Often retro fitted to existing structures and frequently shaped to maximise the seaward wave reflection of the wave crest
wave runup The maximum elevation reached by a broken wave against the beach or shoreline structure, measured above the still ocean level. Storm wave runup is a key element in the design of coastal protection works
Assessment and Decision Frameworks for Seawall Structures
Appendix E Case Study – Bilgola Beach Page viii
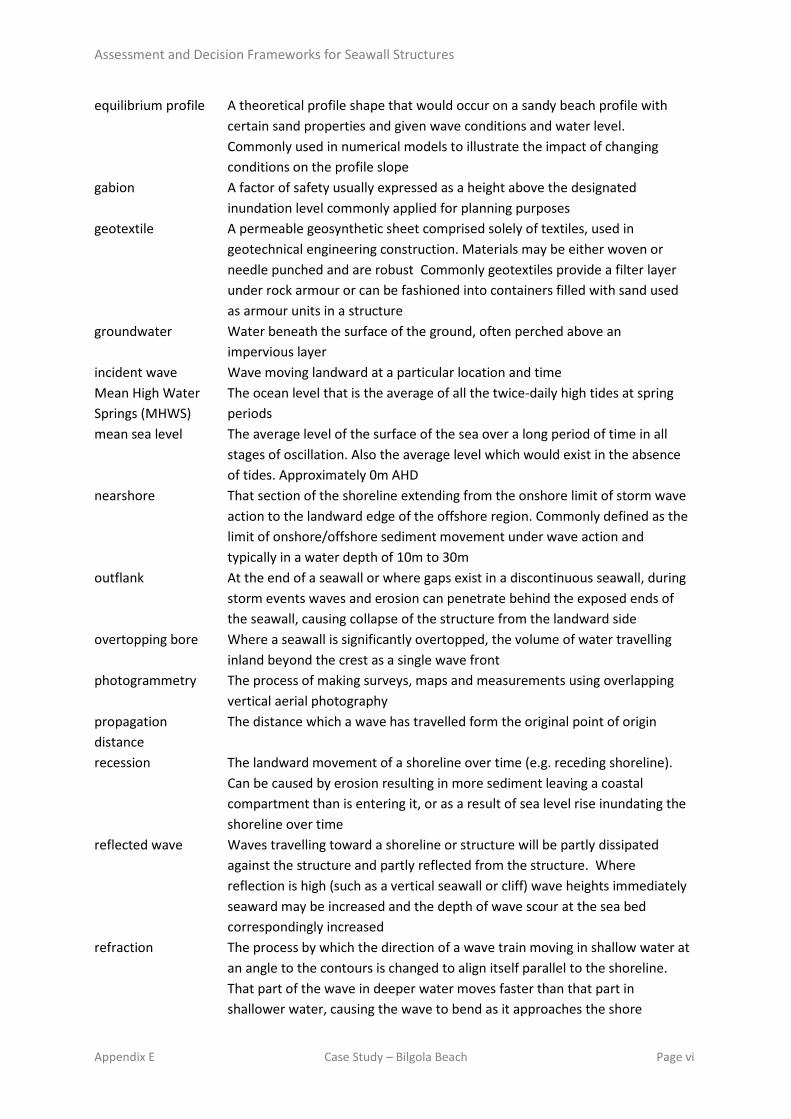
wave setup The amount by which the still water level inshore of the breaking wave zone exceeds that outside; in part due to the kinetic energy in the breaking waves being converted into an elevated inshore water level
ACRONYMS
AEP Annual Exceedance Probability AHD Australian Height Datum - ARI average recurrence interval GPR Ground Penetrating Radar Hs significant wave height LGA Local Government Area MSL Mean Sea Level MHWS Mean High Water Springs SLR Sea Level Rise MHWS Mean High Water Springs SLR Sea Level Rise AHD Australian Height Datum - GCSMP Gold Coast Shoreline Management Plan RL Relative Level

Assessment and Decision Frameworks for Seawall Structures
Chapter 1 Introduction Appendix E Case Study – Bilgola Beach Page 1
1. INTRODUCTION
The Water Research Laboratory (WRL) of the University of New South Wales (UNSW) was engaged by Sydney Coastal Councils Group (SCCG) to undertake three case studies assessing existing seawalls in Sydney. At the request of SCCG, each case study was documented as a stand-alone appendix within the main project report.
The present scope of works included the following case studies:
• Remote Sensing Assessment of a Buried Seawall Structure (Bilgola Beach Case Study), (Appendix D to main report)
• Assessment of Open Coast Seawalls (Bilgola Beach Case Study) (this report, Appendix E to main report)
• Assessment of Estuarine Beach Seawalls (Clontarf Case Study) (Appendix F to main report).
Note that the results presented in this report should not be used to assess the suitability or otherwise of any particular structure, nor to determine the suitability of any structure in protecting development at Bilgola Beach. Rather, the case study has been prepared as a practical, useful and usable framework to assist local government in managing and assessing generic seawall structures where no detailed design information is available.
The objective of this investigation was the trial of a non-intrusive technology (ground penetrating radar (GPR)) to determine several key geometric parameters of an existing buried seawall. This report aimed to verify the reliability and suitability of GPR for this purpose, by comparing the GPR outputs to drilling logs.
The objective of the investigations presented in Appendices E and F was to analyse the suitability of existing seawalls to withstand the occurrence of 1-, 10-, 50- and 100-year-ARI events for present-day conditions and for the 2050 and 2100 planning horizons, including sea level rise projections. The general methodology applied for the assessment of these coastal structures consisted of the following tasks (also presented diagrammatically in Figure 1.1):
• data compilation: an initial data and literature review including review of previous site investigations
• seawall characterisation: establishing relevant engineering design parameters such as crest and toe levels, construction method etc.
• environmental conditions: establishing design parameters in terms of wave and water level conditions and relevant coastal processes such as erosion, recession and inundation
• seawall assessment: a stability assessment with regards specifically to coastal processes
• remedial options: a list of upgrade, replacement and maintenance options, and
• future management: recommendations provided for further monitoring and data collection.

Assessment and Decision Frameworks for Seawall Structures
Chapter 1 Introduction Appendix E Case Study – Bilgola Beach Page 2
Figure 1.1 Methodology Applied for Seawall Suitability Assessment in Appendices E and F

Assessment and Decision Frameworks for Seawall Structures
Chapter 2 Assessment of Open Coast Seawalls Appendix E Case Study – Bilgola Beach Page 3
2. ASSESSMENT OF OPEN COAST SEAWALLS (BILGOLA BEACH CASE STUDY)
2.1 OVERVIEW The Water Research Laboratory of the University of New South Wales was engaged by Sydney Coastal Councils Group to undertake an assessment of seawalls on an open coast beach. In consultation with SCCG, Bilgola Beach was selected as an appropriate location to undertake the case study on the condition of a variety of existing seawalls. Note that the results presented in this report should not be used to assess the suitability or otherwise of any particular structure, nor to determine the suitability of any structure in protecting development at Bilgola Beach. Rather, the case study has been prepared as a practical, useful and usable framework to assist local government in managing and assessing small seawall structures where no detailed design information is available.
Bilgola Beach is part of the Pittwater Council Local Government Area (LGA) and its coastline includes the 500 m long sandy foreshore bordered by rocky headlands at both ends of the beach (Bilgola Head in the north and Newport Head in the south). A cul-de-sac road, eight private properties, a café, a car park, Bilgola Surf Life Saving Club (SLSC), a promenade and a swimming pool are located along the foreshore. Figure 2.1 presents the study area location.
There are several discrete seawall structures along Bilgola Beach. For the purpose of this study the following three sections (from north to south) were assessed:
• Bilgola Beach Seawall 1: the sloping section of rock seawall located seaward of seven private properties (1, 3, 5, 7, 9, 11 and 13 Allen Avenue). At the time of writing, this section of wall was almost entirely buried by the dune.
• Bilgola Beach Seawall 2A: the vertical stone and concrete section of seawall located seaward of one private property (21 Bilgola Avenue).
• Bilgola Beach Seawall 2B: the sloping gabion seawall located 15 to 20 m landward of Seawall 2A. At the time of writing, this section of wall was entirely buried by fill.
• Bilgola Beach Seawall 3: the vertical section of seawall located seaward of Billies Café, a car park and Bilgola SLSC. This section of wall is constructed of dressed or cut sandstone blocks.
Consideration of the promenade/seawall located between the southern end of Bilgola SLSC and the swimming pool is considered outside the scope of works. Figure 2.2 shows the location of the three sections within the Bilgola Beach foreshore area. Table 2.1 presents a summary of the seawalls assessed.

Assessment and Decision Frameworks for Seawall Structures
Chapter 2 Assessment of Open Coast Seawalls Appendix E Case Study – Bilgola Beach Page 4
Table 2.1 Summary of Assessed Seawalls at Bilgola Beach
Seawall Location Construction Year of Construction
Length (m)
1 Buried under dune fronting Allen Avenue properties
Sloping (1V:2H or flatter) rock seawall, 0.05-4 t rock
1967, 1974, 1979 160
2A Fronting 21 Bilgola Avenue Vertical stone and concrete seawall; includes buttresses and counterforts at least 1951 30
2B Buried under fill landward of Seawall 2A
Sloping gabion seawall (1H:1V) 1993 30
3 Fronting Bilgola SLSC Vertical sandstone blocks set in mortar late 1950s 100
Figure 2.1 Location of Bilgola Beach Sydney NSW

Assessment and Decision Frameworks for Seawall Structures
Chapter 2 Assessment of Open Coast Seawalls Appendix E Case Study – Bilgola Beach Page 5
Figure 2.2 Seawall Locations at Bilgola Beach
2.2 LITERATURE REVIEW A substantial body of literature in the form of consultant, state government and council technical and management reports exists for the Pittwater Council LGA coastline. All available literature addressing coastal processes, coastal protection works and coastal management within the Bilgola Beach foreshore was consulted, with the most important listed in the following discourse.
2.2.1 Coastal Hazard Definition Studies
A coastal hazard definition study is included in the Pittwater Council Coastline Hazard Definition and Climate Change Vulnerability Study currently being prepared by WorleyParsons. The report will provide information on the coastal hazards relevant to Bilgola Beach, particularly in terms of coastal erosion and coastal recession due to sediment loss and sea level rise. Since the WorleyParsons report is still in preparation, WRL liaised directly with WorleyParsons to acquire information relevant to this seawalls assessment project to minimise any differences resulting from a repeat of existing work. As part of their scope of works, WorleyParsons also prepared an Emergency Action Subplan specific to Bilgola Beach. The reports consulted for the current study are as follows:
• WorleyParsons (2012a), Coastal Erosion Emergency Action Subplan for Bilgola Beach (Bilgola) and Basin Beach (Mona Vale): Reference Document, Report prepared for Pittwater Council.
• WorleyParsons (in prep. 2012b), Coastline Hazard Definition and Climate Change Vulnerability Study for Pittwater Council.
Assessment and Decision Frameworks for Seawall Structures
Chapter 2 Assessment of Open Coast Seawalls Appendix E Case Study – Bilgola Beach Page 6
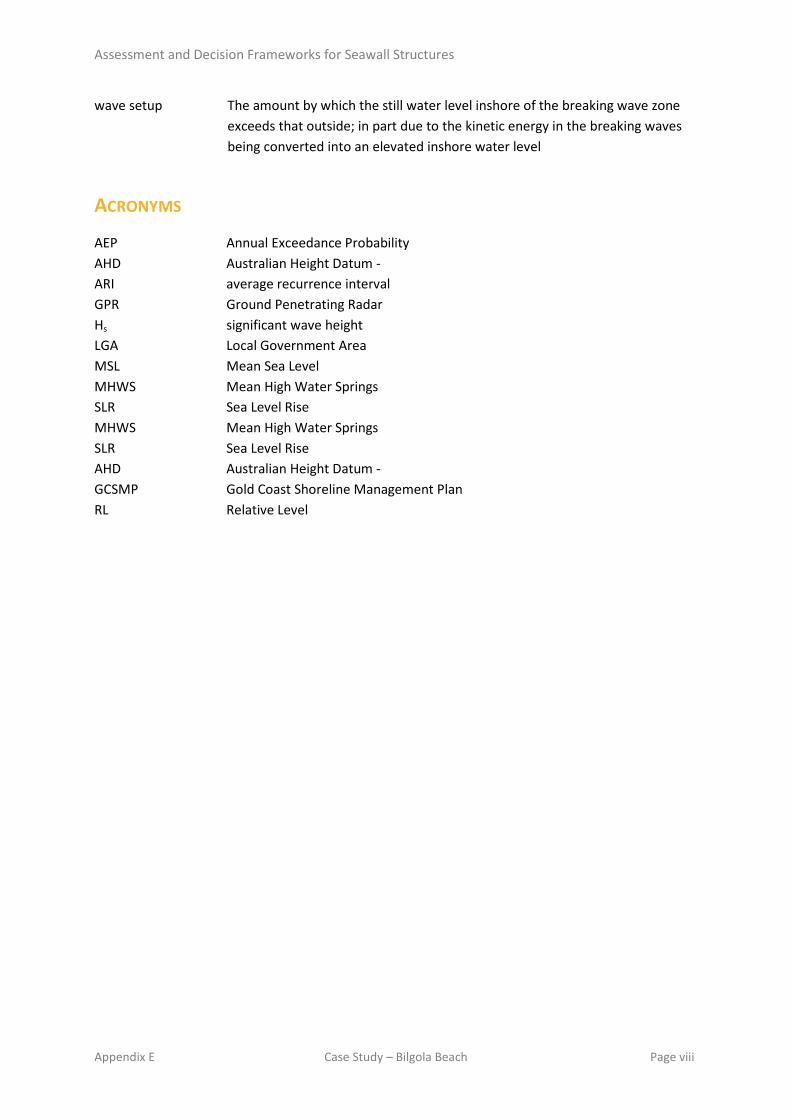
2.2.2 Coastal Process Studies
WRL previously prepared a report for the owner of 1 Allen Avenue. While commissioned by an individual, private property owner, the report concerned the sediment transport processes along the full length of Bilgola Beach, particularly with respect to storms in June 1964 and June 1966. Suggestions for coastal protection works in the form of a seawall and beach nourishment were presented in the report:
• Foster, D N and Hattersley, R T (1966), Interim Report on the Erosion of Bilgola Beach, WRL Technical Report 1966/02.
2.2.3 Coastline Management Studies
Two management documents concerning Bilgola Beach were referred to in the present report:
• Public Works Department (1985), Coastal Management Strategy, Warringah Shire, Report to Working Party, PWD Report 85016, June, prepared by Gordon, A D, Hoffman, J G and Kelly, M T for Warringah Shire Council.
• Pittwater Council (2009), ‘Coastline Risk Management Policy for Development in Pittwater’, Appendix 6, Pittwater 21 Development Control Plans.
2.2.4 Coastal Engineering Reports
A range of coastal engineering reports have been prepared by various consultants concerning individual private properties and for public (Pittwater Council) assets. WRL also sought out further reports to be included in its literature review which were not readily available. The coastal engineering reports referred to are as follows:
• Foster, D N (1990), Coastal Engineering Assessment: 11 Allen Avenue, Bilgola Beach, Report No. UT90/1, Unisearch Limited, Tasmania.
• Christopher Miller Consultants (2002), Coastal Engineering Investigation: Proposed Alterations and Additions at 13 Allen Avenue, Bilgola, Letter Report to Pittwater Council.
• SMEC (2002), Coastal Engineering Advice: 5 Allen Avenue, Bilgola Beach, Document No. 31226-066.
• Patterson Britton and Partners (2005), Coastline Risk Management Report: 21 Bilgola Avenue, Bilgola, Letter Report to Mrs Irene Newport.
• Patterson Britton and Partners (2007), Coastal Engineering Assessment: Billies Café at Bilgola Beach, Letter Report to Pittwater Council.
For additional background information, WRL also referred to a range of letters archived in its correspondence files from 1966 to the present. These letters generally concerned coastal hazards and structures at Bilgola Beach and addressed a range of stakeholders.

Assessment and Decision Frameworks for Seawall Structures
Chapter 2 Assessment of Open Coast Seawalls Appendix E Case Study – Bilgola Beach Page 7
2.2.5 Data Collection Reports
In parallel to this appendix, WRL also included in their report for SCCG a range of geophysical and geotechnical investigations to establish the seawall characteristics at Bilgola Beach. The report produced was:
• Mariani, A and Coghlan I R (2012), Report WRL2012/13 titled Seawall Structure Assessment at Bilgola and Clontarf, Sydney, NSW. The information in this Appendix is taken from that report.
2.3 STRUCTURE CHARACTERISATION The locations of the three sections (four structures) investigated with overview photos of the main features are shown in Figures 2.3, 2.4 and 2.5 and summarised in Figure 2.2. Table 2.1 reports on seawall location, extent and construction.
Representative design cross-sections were prepared for the seawall structures assessed and are presented in Figures 2.6 (Seawalls 1, 2A and 2B) and 2.7 (Seawall 3). The sections were based on the review of all relevant documents including council records and technical drawings, consultant reports, geotechnical investigations and topographic surveys. Structure details and information that could not be verified are clearly identified in the cross-section figures.
Seawall 1 is located seaward of seven private properties in Allen Avenue. As a result of the 1966 storms, several houses were at risk of being undermined, and WRL recommended that a sloping rock seawall be constructed in addition to beach nourishment (Foster and Hattersley, 1966). In 1967, the recommendations had not yet been implemented and, with coastal storms threatening properties seaward of Allen Avenue, emergency rock protection was installed. The crest level of these works was approximately 2.5 m AHD (the toe level was unknown), with a face slope of 1V:3.0H and constructed from a single layer of 50 kg rocks with unknown composition (likely sandstone or basalt) (Foster, 1990). No secondary armour or geotextile underlayer was used. It is not known if outflanking protection was included in the emergency works. It is noted that the ‘as-built’ emergency seawall was not in accordance with WRL’s design which included a gravel graded filter blanket and a toe level of -1.4 m AHD.
However, during the storms in May and June 1974, the wall was severely overtopped and several houses were threatened by wave action and inundation. The house at 9 Allen Avenue was badly damaged due to the combined effects of gale force winds and wave overtopping and was demolished (PWD, 1985). A swimming pool at 11 Allen Avenue was also destroyed during these storms, with some of its debris distributed within the seawall. Immediately following this storm, emergency coastal protection works consisting of timber poles (7 Allen Avenue) and sandbags (1 Allen Avenue) were also added to the damaged seawall. More extensive emergency protection works were undertaken in two stages later in 1974 using existing rock from the 1967 works and imported 2.0 t basalt rock (Foster 1990). Again, no secondary armour or geotextile underlayer was used, and it is not known if outflanking protection was included in these additional emergency works.
Based on the advice of WRL (Foster, 1990), approximately 28 rocks of unknown composition (likely sandstone or basalt) with mass varying from 2.0 to 4.0 t were placed seaward of the property at 11 Allen Avenue only. This was undertaken to ‘strengthen the wall to a uniform standard’ and to

Assessment and Decision Frameworks for Seawall Structures
Chapter 2 Assessment of Open Coast Seawalls Appendix E Case Study – Bilgola Beach Page 8
raise the crest to 6.5 m AHD (Foster, 1990). It was noted that since the seawall did not have an adequate filter layer, some settlement may be expected as sand will leach through the structure voids which may require maintenance following severe storm events.
At the time of writing, Seawall 1 was almost entirely buried by the dune (typical dune crest elevation 5.5 to 7.5 m AHD) and its condition was not able to be assessed. No information is available detailing the ‘as-built’ cross-section, however, data collected by WRL (Mariani and Coghlan, 2012) indicated that the seawall had a slope of 1V:2H or flatter, the crest level of the seawall varied from 5.5 to 6.5 m AHD and the toe level varied from 0 to 1.5 m AHD. It was not possible to determine the number of layers of rock in Seawall 1. In assessing the stability of the seawall, WRL has assumed that the seawall has a slope of 1V:2H, is composed of two layers of rough, randomly placed 2.0 t basalt (density ≈ 2700 kg/m3) with a porosity of 40 %, a crest level of 6.0 m AHD and a toe level of 0 m AHD.
Two seawalls are located seaward of the house at 21 Bilgola Avenue. The more seaward structure, Seawall 2A, is a vertical stone and concrete seawall and has been present since at least 1951 (PBP, 2005). This structure has successfully protected this property from erosion since that time. During the storms in May and June 1974, minor damage was reported to Seawall 2A, with wave overtopping of the seawall and deposition of sand landward of the structure (PBP, 2005). During storms in May 1997, the crest of the structure was slightly damaged with several sandstone blocks dislodged and carried landward. During the same storms, sand was washed into the property for a distance of about 10 m landward of Seawall 2A (PBP, 2005). During the overtopping events in 1974 and 1997, it is understood that waves would ‘fold over’ the crest of the structure and travel as a sheet flow with shallow depth across the property. The seawall was constructed as a buttressed counterfort wall. At least four buttresses (acting in compression against retained soil) with a spacing of approximately 10 m, strengthen and stiffen the wall against overturning forces on its seaward side. An unknown number of counterforts (acting in tension against retained soil) also extend from the wall on its landward side to stabilise Seawall 2 against overturning. The structure has outflanking protection, that is, protection extending landward and perpendicular to the seaward face of the seawall at the ends. PBP (2005) indicates that this seawall has a variable crest level of 4.4 to 4.6 m AHD and a constant toe level of 2.0 m AHD. In assessing the stability of the seawall, WRL assumed that the seawall has a crest level of 4.5 m AHD. No information is available detailing the precise construction of the wall; the exact cross-section is unknown. While of relatively early construction, it is generally in good condition and appears to be performing adequately at the present time.
Seawall 2B is the more landward structure located east of the house at 21 Bilgola Avenue. This structure is a sloping gabion and reno mattress seawall that was constructed underground in 1993. Seawall 2B is the only coastal protection structure on Bilgola Beach which has been designed and constructed to contemporary coastal engineering standards. Although it was recognised that this structure was not designed to provide complete protection in an extreme storm event, its designers asserted that failure of Seawall 2B would not imply loss of the dwelling and would abdicate the requirement for piered foundations (Geomarine, 1993a, 1993b and 1993c). The designers also asserted that Seawall 2B would not exacerbate erosion at neighbouring public and private properties due to the protection offered by existing seawalls (Seawalls 1 and 3) and its footprint being located further landward. The conceptual design drawings indicate that Seawall 2B has a crest elevation of

Assessment and Decision Frameworks for Seawall Structures
Chapter 2 Assessment of Open Coast Seawalls Appendix E Case Study – Bilgola Beach Page 9
3.9 m AHD and a toe level of -0.15 m AHD. The structure includes a 1 m thick box gabion section at the crest, 2× 0.5 m thick reno mattresses along its slope (1V:1H) and toe protection provided by a 0.3 m thick reno mattress. The underside of Seawall 2B is also protected by a geotextile underlayer. In assessing the stability of the seawall, WRL assumed that the gabion and reno mattresses were composed of sandstone (density ≈ 2300 kg/m3). It is noted that this structure has been redundant up until the present, and will continue to be so unless Seawall 2A fails (PBP, 2005). The structure also has outflanking protection with stepped cut-off walls provided at the ends. At the time of writing, Seawall 2B was entirely buried by fill (typical ground elevation 4.3 m AHD) and its condition was not able to be assessed, but can likely be presumed to be good as it has never been exposed to wave attack.
Seawall 3 is located seaward of Billies Café, a car park and Bilgola SLSC. This vertical stone gravity structure is composed of dressed or cut sandstone blocks and was constructed in the late 1950s (Gordon, 1989). The seawall was damaged (with some blocks and steps dislodged) during the storms in May and June 1974 (Foster et al, 1975). During storms in May and June 1978, toe protection for the wall was exposed by erosion (PBP, 2005). During storms in May 1997, Seawall 3 was overtopped by waves causing damage to the Bilgola SLSC roller doors and some equipment in a ground floor storage area (but there was no damage to the building structure) (WorleyParsons, 2012b). Parts of the seawall were cosmetically upgraded (the sandstone capping was replaced) in the late 1990s along with the construction of steps (PBP, 2005). Exposure of the structure to outflanking is minimal, with the wall bordered by a mortared sandstone and concrete drain in the north (Bilgola Creek) and the promenade/seawall located between the southern end of Bilgola SLSC and the swimming pool in the south (PBP, 2007). Data collection by WRL (Mariani and Coghlan, 2012) indicated that the seawall has a variable crest level of 4.5 to 5.0 m AHD, a constant toe level of approximately 2 m AHD and toe protection in the form of flat rock blocks (high length-to-thickness ratio) densely placed in a double layer at approximately 3.0 m AHD. In assessing the stability of the seawall, WRL assumed that the seawall has a crest level of 5.0 m AHD. No information is available detailing the precise construction of the wall; the exact cross-section is unknown. While of relatively early construction (late 1950s), it is in reasonable condition and appears to be performing adequately at the present time.
Table 2.2 lists the crest elevation, the toe level, the average sand level against each seawall (inferred from historical photogrammetry analysis) and the present condition of each surveyed wall. Where crest and toe elevations are variable; the levels adopted to assess the stability of each seawall are also tabulated.

Assessment and Decision Frameworks for Seawall Structures
Chapter 2 Assessment of Open Coast Seawalls Appendix E Case Study – Bilgola Beach Page 10
Table 2.2 Bilgola Beach Seawall Characteristics and Present Conditions
Seawall Location Crest Level (m AHD)
Toe Level (m AHD)
(2)Ave. Sand Level at Toe
(m AHD)
(5)Present Condition
1 Buried under dune fronting Allen Avenue properties
(1)4.5-6.5 (6 adopted)
(1)0-1.5 (0 adopted)
4.0 Condition was not able to be assessed. No adequate filter layer; settlement of armour expected during severe storms
2A Fronting 21 Bilgola Avenue
(3)4.4-4.6 (4.5 adopted)
(1)2 3.3 Good condition. Minor damage incurred during storms in 1974 and 1997 has been repaired
2B Buried under fill landward of Seawall 2A
(4)3.9 (4)-0.15 4.3 Condition was not able to be assessed. Installed as designed in 1993 in a workmanlike manner and to a high standard
3 Fronting Bilgola SLSC
(1)4.55.0 (5.0 adopted)
(1)2 3.7 Reasonable condition, weathering of mortar
Notes: (1) as determined by previous geotechnical investigations (2) as determined by historical photogrammetry analysis (3) as determined in previous surveys (4) as indicated in design drawings (5) present condition inferred from visual assessment by experienced coastal engineers

Assessment and Decision Frameworks for Seawall Structures
Chapter 2 Assessment of Open Coast Seawalls Appendix E Case Study – Bilgola Beach Page 11
Figure 2.3 Bilgola Beach Seawall 1 Fronting Allen Avenue Properties
Seawall 1 Bottom Left: 11 June, 1974 Damaged due to severe storms (Source: PWD, 1985) Seawall 1 Bottom Right: 10 April, 2012 Buried under vegetated sand dune

Assessment and Decision Frameworks for Seawall Structures
Chapter 2 Assessment of Open Coast Seawalls Appendix E Case Study – Bilgola Beach Page 12
Figure 2.4 Bilgola Beach Seawalls 2A and 2B Fronting 21 Bilgola Avenue
Seawall 2A Centre: 11 April, 2012 Seawall 2B Bottom Left: October, 1993 (Source: PBP, 2005) Bottom Right: 1 July, 2012

Assessment and Decision Frameworks for Seawall Structures
Chapter 2 Assessment of Open Coast Seawalls Appendix E Case Study – Bilgola Beach Page 13
Figure 2.5 Bilgola Beach Seawall 3 Fronting Bilgola SLSC 10 April, 2012

Assessment and Decision Frameworks for Seawall Structures
Chapter 2 Assessment of Open Coast Seawalls Appendix E Case Study – Bilgola Beach Page 14
Figure 2.6 Bilgola Beach Seawall Cross-sections (1, 2A and 2B)
Seawall 1
Seawall 2A
Seawall 2B

Assessment and Decision Frameworks for Seawall Structures
Chapter 2 Assessment of Open Coast Seawalls Appendix E Case Study – Bilgola Beach Page 15
Figure 2.7 Bilgola Beach Seawall Cross Section 3
2.4 ENVIRONMENTAL CONDITIONS 2.4.1 General
Design parameters for the seawalls assessed include ocean wave and water level conditions and the expected beach scour level at the toe of the structure. The geotechnical conditions at the site which determine the adequacy of existing foundation conditions were outside the scope of this assessment. The toe scour level influences the water depth at the structure which, together with the design water level, determines the maximum depth-limited breaking wave height that can impact the structure. The design wave and water level conditions at the structure affect the hydraulic performance (wave runup and overtopping) and stability of the structure.
2.4.2 Design Life and Design Event
Establishing the design working life of the assessed seawalls is critical for estimation of subsequent design parameters. The typical design life is 50 years for a normal maritime structure and 100 years for a structure protecting residential developments (AS 4997, 2005). Clause 2.0 of the Pittwater Council Coastline Risk Management Policy (2009) also recommends that a design life of 100 years be used and, as such, was adopted by WRL for this assessment. The Australian Standard 4997 recommends design significant wave heights for marine structures based on the function and design life of the structure as reproduced in Table 2.3. Note that while this standard covers maritime structures (e.g. wharves and vertical seawalls), it specifically excludes the design of rubble mound rock armoured walls. AS 4997 recommends that the design water levels accompanying these waves should not be below Mean High Water Springs (MHWS).
Seawall 3

Assessment and Decision Frameworks for Seawall Structures
Chapter 2 Assessment of Open Coast Seawalls Appendix E Case Study – Bilgola Beach Page 16
Table 2.3 Annual Probability of Exceedance of Design Wave Events (Source: AS 4997)
Structure Description
Design Working Life (Years)
5 or less (temporary
works)
25 (small craft facilities)
50 (normal
maritime structures)
100 or more (special structures/
residential developments)
Structures presenting a low degree of hazard to life or property
1/20 1/50 1/200 1/500
Normal structures 1/50 1/200 1/500 1/1000 High property value of high risk to people 1/100 1/500 1/1000 1/2000
Based on this guideline, selection of the 1-in-500 to 1-in-1000-year ARI event would be suitable for seawalls as they may be regarded as a ‘special’ maritime structures protecting residential developments. However, the seawalls assessed are typically only one component of a more comprehensive and holistic foreshore management solution. Additionally, best practice in coastal hazard assessments for local government areas typically considers the 1-in-100-year ARI as the design criteria for deriving coastal setbacks and inundation areas. As such, there is a reasonable basis for accepting some reduction in the design conditions. The guideline gives no further direction on the recommended design water level.
A further consideration is that the maximum significant wave height that can reach the structures is a function of design water level. WRL has selected the 1-in-100-year ARI event for both wave conditions (height, period and direction) and water level conditions (tide plus anomaly). Due to depth-limited conditions, the design wave heights at the seawalls could be generated by an event where the recurrence interval of the deepwater wave height was lower than 100-year ARI but the water level was higher than 100-year ARI.
2.4.3 Design Wave Conditions
Bilgola Beach is subject to waves originating from offshore storms (swell) or produced locally (wind waves) within the nearshore coastal zone. Swell waves reaching the seawalls will be modified by the processes of refraction, diffraction, wave-wave interaction, dissipation by bed friction, wave breaking and wind. Locally generated waves undergo generation processes as well as the aforementioned propagation and dissipation processes.
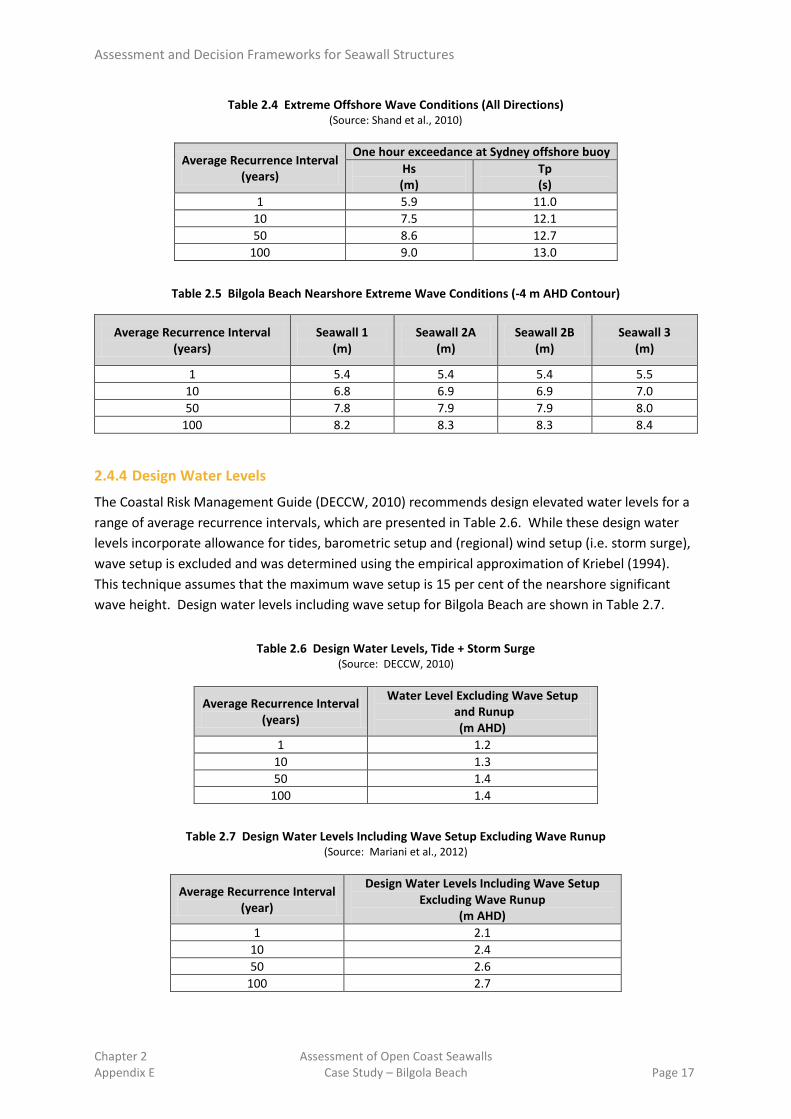
Offshore wave characteristics were derived through statistical analysis of recorded data from the Sydney directional wave buoy and extrapolated to extreme events (Shand et al., 2010). Design offshore wave conditions for the 1-in-1, 10-, 50- and 100-year ARI events adopted within the present study are shown in Table 2.4. Nearshore wave conditions for Bilgola Beach at the -4 m AHD contour have been inferred from transformation coefficients (WorleyParsons, in prep. 2012b) and are presented in Table 2.5. The offshore design swell direction for each structure is as follows: Seawall 1 (east to east-south-east), Seawalls 2A and 2B (east) and Seawall 3 (east). Further wave transformation modelling was also undertaken in conjunction with the assessment of toe scour levels to determine the depth-limited wave height at each structure.
Assessment and Decision Frameworks for Seawall Structures
Chapter 2 Assessment of Open Coast Seawalls Appendix E Case Study – Bilgola Beach Page 17
Table 2.4 Extreme Offshore Wave Conditions (All Directions) (Source: Shand et al., 2010)
Average Recurrence Interval (years)
One hour exceedance at Sydney offshore buoy Hs (m)
Tp (s)
1 5.9 11.0 10 7.5 12.1 50 8.6 12.7
100 9.0 13.0
Table 2.5 Bilgola Beach Nearshore Extreme Wave Conditions (-4 m AHD Contour)
Average Recurrence Interval (years)
Seawall 1 (m)
Seawall 2A (m)
Seawall 2B (m)
Seawall 3 (m)
1 5.4 5.4 5.4 5.5 10 6.8 6.9 6.9 7.0 50 7.8 7.9 7.9 8.0
100 8.2 8.3 8.3 8.4
2.4.4 Design Water Levels
The Coastal Risk Management Guide (DECCW, 2010) recommends design elevated water levels for a range of average recurrence intervals, which are presented in Table 2.6. While these design water levels incorporate allowance for tides, barometric setup and (regional) wind setup (i.e. storm surge), wave setup is excluded and was determined using the empirical approximation of Kriebel (1994). This technique assumes that the maximum wave setup is 15 per cent of the nearshore significant wave height. Design water levels including wave setup for Bilgola Beach are shown in Table 2.7.
Table 2.6 Design Water Levels, Tide + Storm Surge (Source: DECCW, 2010)
Average Recurrence Interval (years)
Water Level Excluding Wave Setup and Runup
(m AHD) 1 1.2
10 1.3 50 1.4
100 1.4
Table 2.7 Design Water Levels Including Wave Setup Excluding Wave Runup (Source: Mariani et al., 2012)
Average Recurrence Interval (year)
Design Water Levels Including Wave Setup Excluding Wave Runup
(m AHD) 1 2.1
10 2.4 50 2.6
100 2.7

Assessment and Decision Frameworks for Seawall Structures
Chapter 2 Assessment of Open Coast Seawalls Appendix E Case Study – Bilgola Beach Page 18
2.4.5 Sea Level Rise Projections
The sea level rise (SLR) projections for the 2050 and 2100 planning periods adopted in this study were derived from the NSW Sea Level Rise Policy Statement (DECCW, 2009a) and are shown in Table 2.8. These benchmarks were established considering the most recent international (Intergovernmental Panel on Climate Change, IPCC, 2007a and 2007b) and national (McInnes, 2007) projections.
Table 2.8 Sea Level Rise Projections (Source: DECCW, 2010)
Planning Period (year)
(1)Sea Level Rise (m)
2050 0.40
2100 0.90
Notes: (1) increase above 1990 Mean Sea Level
The design still water levels adopted for 2050 and 2100 also require a reduction of 66 mm to accommodate the estimated amount of global average sea level rise that has occurred between 1990 and the present (2012). This is estimated at approximately 3 mm/year from satellite altimetry (DECCW, 2009b).
2.4.6 Erosion and Recession
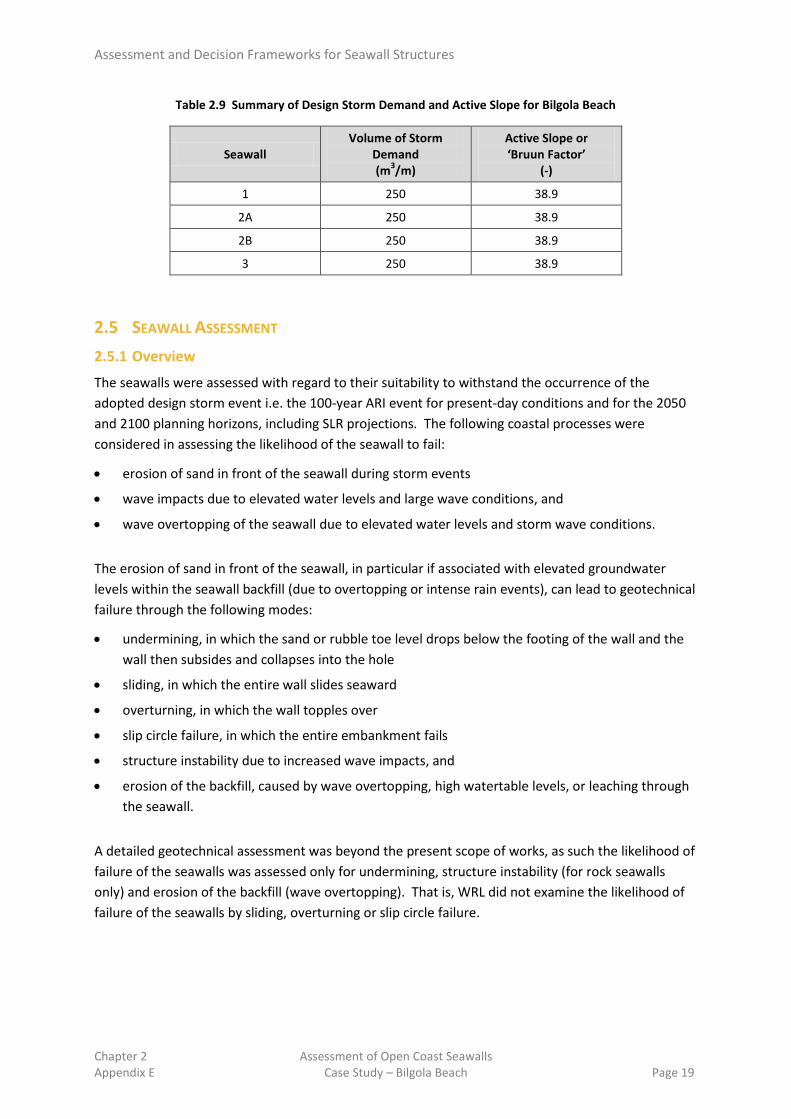
Beach erosion processes and the active slope (‘Bruun Factor’) at Bilgola Beach were reported in the Pittwater Council CZMP (WorleyParsons, in prep. 2012b). Bilgola Beach is characterised by a moderate to high energy wave climate (typically offshore-generated swell waves) with some protection offered from swell waves from the south by Newport Head and Little Reef (offshore of Bungan Head). Considering the full length of the Bilgola Beach, nearshore wave heights are typically 90% of those at a fully exposed open ocean beach (PBP, 2007 and WorleyParsons, in prep. 2012b). The estimated storm demand (from photogrammetry) for the 100-year ARI storm event is 250 m3/m and was determined between 9 July 1970 and 19 June 1974 which includes the May-June 1974 storms (WorleyParsons, in prep. 2012b). At the time of writing, no study had examined photogrammetric data in detail to determine if there was an ongoing underlying recession trend of long-term sand loss from the beach. However, cursory examinations in several studies (Geomarine, 1993a, 1993b and 1993c, PBP, 2005 and 2007) observed no indication of long-term recession. As such, zero long-term recession due to net sediment loss was adopted by WRL for this assessment. Table 2.9 summarises the design storm demand for the sandy foreshores of Bilgola Beach as well as estimated active slopes. Note also that the median particle size (d50) for the sand fraction of sediment on Bilgola Beach (60 μm to 2 mm) was assumed to be 0.28 mm (Foster and Hattersley, 1966).
Assessment and Decision Frameworks for Seawall Structures
Chapter 2 Assessment of Open Coast Seawalls Appendix E Case Study – Bilgola Beach Page 19
Table 2.9 Summary of Design Storm Demand and Active Slope for Bilgola Beach
Seawall Volume of Storm
Demand (m3/m)
Active Slope or ‘Bruun Factor’
(-)
1 250 38.9
2A 250 38.9
2B 250 38.9
3 250 38.9
2.5 SEAWALL ASSESSMENT 2.5.1 Overview
The seawalls were assessed with regard to their suitability to withstand the occurrence of the adopted design storm event i.e. the 100-year ARI event for present-day conditions and for the 2050 and 2100 planning horizons, including SLR projections. The following coastal processes were considered in assessing the likelihood of the seawall to fail:
• erosion of sand in front of the seawall during storm events
• wave impacts due to elevated water levels and large wave conditions, and
• wave overtopping of the seawall due to elevated water levels and storm wave conditions.
The erosion of sand in front of the seawall, in particular if associated with elevated groundwater levels within the seawall backfill (due to overtopping or intense rain events), can lead to geotechnical failure through the following modes:
• undermining, in which the sand or rubble toe level drops below the footing of the wall and the wall then subsides and collapses into the hole
• sliding, in which the entire wall slides seaward
• overturning, in which the wall topples over
• slip circle failure, in which the entire embankment fails
• structure instability due to increased wave impacts, and
• erosion of the backfill, caused by wave overtopping, high watertable levels, or leaching through the seawall.
A detailed geotechnical assessment was beyond the present scope of works, as such the likelihood of failure of the seawalls was assessed only for undermining, structure instability (for rock seawalls only) and erosion of the backfill (wave overtopping). That is, WRL did not examine the likelihood of failure of the seawalls by sliding, overturning or slip circle failure.

Assessment and Decision Frameworks for Seawall Structures
Chapter 2 Assessment of Open Coast Seawalls Appendix E Case Study – Bilgola Beach Page 20
2.5.2 Toe Undermining
The erosion of sand during storm events can cause the reduction of beach levels fronting the seawall and consequently undermine the foundations of the seawall. This can potentially cause failure of the seawall by exposing the toe of the structure to direct wave impact, or by reducing foundation support. For each seawall section, the likelihood of seawall undermining is related to the following factors:
• seawall toe design and toe levels as determined by previous geotechnical investigations or from design drawings (when available)
• seawall slope and porosity
• level of sand against the seawall prior to the commencement of a severe storm
• pre-storm volume of sand above mean sea level seaward of the structure
• storm demand or estimated volume of sand eroded (above mean sea level) during an extreme erosion event, and
• exposure (magnitude, direction and duration) to nearshore wave conditions.
Seawall toe levels, sand levels above the toe of the seawall, average sand volume of the beach fronting the seawall and design storm demand are presented for each assessed structure in Table 2.10. Toe levels were based on previous geotechnical investigations and design drawings (where available). For Seawalls 2A and 3, average and minimum beach levels above the toe of the seawall were derived from photogrammetry analysis undertaken by WRL. It should be noted that the levels determined with this technique may not represent the full range of conditions which have occurred and depend on the dates of available photos. The average sand volumes for Seawalls 2A and 3 were derived from photogrammetry analysis in coastal engineering reports. Average volumes for Seawalls 1 and 2B have not previously been analysed and their determination was beyond the present scope of works. The storm demand for Bilgola Beach was also derived from photogrammetry analysis (WorleyParsons, in prep. 2012b).
Table 2.10 Summary of Factors Influencing the Likelihood of Toe Undermining at Bilgola Beach
Seawall Location Toe level (m AHD)
(2)Beach level at wall toe (m AHD)
Ave. Sand Volume
Available
Storm Demand
Min Ave (m3/m) (m3/m)
1 Buried under dune fronting Allen Avenue properties
(1)0.0 0.0 4.0 unknown 250
2A Fronting 21 Bilgola Avenue (1)2.0 2.0 3.3 (4)150 250
2B Buried under fill landward of Seawall 2A
(3)-0.15 4.3 4.3 unknown 250
3 Fronting Bilgola SLSC (1)2.0 2.3 3.7 (5)200 250
Notes: (1) as determined by previous geotechnical investigations (2) from photogrammetry (3) as indicated in design drawings (4) from photogrammetry, profile 4, 1941 to 2001 (PBP, 2005) (5) from photogrammetry, profile 3, 1941 to 2001 (PBP, 2007)

Assessment and Decision Frameworks for Seawall Structures
Chapter 2 Assessment of Open Coast Seawalls Appendix E Case Study – Bilgola Beach Page 21
A range of methods was considered to determine the design scour level. These are indicated below:
• engineering ‘rules of thumb’
• photogrammetry, and
• erosion modelling.
In NSW, a foundation level of approximately -1.0 m AHD is commonly adopted as an engineering rule of thumb for rigid coastal structures located at the back of the active beach area within open coast beaches. This is based on stratigraphic evidence of historical scour levels and observed scour levels during major storms in front of existing permeable and non-permeable seawalls along the NSW coast (Nielsen et al. 1992; Foster et al. 1975). However, the location of the seawall on the beach system influences the extent to which the structure interacts with coastal processes such as waves, and hazards such as erosion. That is, adopting a uniform scour level for all structures and all storm events does not consider their relative risk of toe undermining.
Photogrammetry can be used to investigate historical sand level variations in front of seawalls. However, this method can only be applied if the scour levels are located above 0 m AHD as, depending on the water level at the time of the photo, photogrammetry generally does not extend out to levels below approximately 0 m AHD.
Seawalls are commonly classified using the Weggel (1988) classification system depending on their location within the active beach system (see Figure 2.8 and Table 2.11). By definition, scour due to wave action is not a hazard for Type 1 seawalls. CEM (2006) provides design recommendations for scour in front of seawalls due to incident and reflected waves where seawalls are located below the level of storm surge (Types 3-6). That is, guidance is provided where the sand above the toe of the seawall will be submerged at the commencement of an extreme storm event. For seawalls which are located high up the beach above the still water level of maximum storm surge (Type 2, as each of the seawalls at Bilgola Beach are at the time of writing), empirical scour techniques are not available. Despite considerable research into the processes responsible for wave-induced scour at such seawalls, there are no generally accepted techniques for estimating maximum scour depth for Type 2 seawalls. However, numerical models such as SBEACH (Storm-induced BEach Change) can be used to estimate scour levels in such cases. It should be noted that while SBEACH does not model wave reflection processes from vertical walls in detail, good agreement with full scale physical model results and other numerical models which include wave reflections has been demonstrated for SBEACH (McDougal et al, 1996). As such, WRL adopted the numerical model SBEACH (version 4.03) to determine the design scour level at each seawall.

Assessment and Decision Frameworks for Seawall Structures
Chapter 2 Assessment of Open Coast Seawalls Appendix E Case Study – Bilgola Beach Page 22
Figure 2.8 Seawall Location According to Weggel Classification (Source: Weggel 1988)
Table 2.11 Weggel Seawall Classification (Source: Weggel 1988)
Type Location of Seawall
1 Landward of maximum level of runup during storms. The wall does not affect either hydraulic or sedimentation processes under any wave or water level conditions, although may affect aeolian processes
2 Above still water level of maximum storm surge and below the level of maximum runup. Exposed only to the runup of waves during storm events
3 Above normal high water and below the still water level of storm surge. Base will be submerged during storms and during exceptionally high astronomical tides but will normally be above water
4 Within the normal tide range; base is submerged at high water
5 Seaward of mean low water; base is always submerged; subjected to breaking and broken waves
6 So far seaward that incident waves do not break on or seaward (of the wall)
The SBEACH model is a two-dimensional numerical cross-shore sediment transport and profile change model developed by the United States Army Corps of Engineers, Coastal Engineering Research Center. Details of the model are given in Larson and Kraus (1989) and Larson, Kraus and Byrnes (1990). SBEACH considers sand grain size, the pre-storm beach profile and dune height, plus time series of wave height, wave period and water level in calculating a post-storm beach profile.
SBEACH modelling was undertaken in accordance with the principles of Carley and Cox (2003), and Nielsen and Adamantidis (2007). Using idealised, deepwater synthetic design storms derived in Shand et al. (2011), synthetic design storm time series comprising wave height and period were constructed for extreme swell and wind-wave events. Example time series for the 100-year ARI event is shown in Figure 2.9. Consistent with verified modelling undertaken at nearby Narrabeen Beach by Carley and Cox (2003), design event time series comprised three sequential design storms.

Assessment and Decision Frameworks for Seawall Structures
Chapter 2 Assessment of Open Coast Seawalls Appendix E Case Study – Bilgola Beach Page 23
For storm erosion modelling purposes, a spring tide time series was assumed, to which a tidal anomaly was added, such that the peak water level corresponded to the ARI of the storm (i.e. 1.44 m AHD for 100-year ARI event) and the peak significant wave height as described within Section 2.4.3 were used. The peak in the predicted tide and tidal anomaly was assumed to coincide with the peak wave height of the storm. While these combinations remain somewhat conservative, they are not considered unreasonable since intense low pressure systems are responsible for large waves, strong winds and storm surge. Further refinement of the assumptions requiring additional data and a full statistical joint-probability analysis is beyond the present scope of works. The reader is directed to Larson and Kraus (1989) and Larson, Kraus and Byrnes (1990) for detailed descriptions of the coefficients and variables and their effects. For SBEACH modelling at Bilgola Beach, the values indicated in Table 2.12 were used.
Figure 2.9 100 year ARI Synthetic Design Swell Time Series for Bilgola Beach
Table 2.12 SBEACH Validated Model Parameters
Coefficient / Variable (notation used in model) Value Brief Description
DXC Variable (2, 5 and 10 m) X grid DT 15 minutes Time step K 2.2 x 10⁻⁶ m4/N Sediment transport rate coefficient
KB 0.005 Overwash transport parameter EPS 0.002 m2/s Slope dependent transport rate coefficient
LAMM 0.5 Transport rate decay coefficient multiplier TEMPC 20°C Water temperature ISEED 4567 Seed for random number generator RPERC 20% Random variation in wave height
DFS 0.3 m Landward surfzone depth D50 0.28 mm Effective median grain size
BMAX 30° Avalanching angle
0
2
4
6
8
10
12
14
-1
-0.5
0
0.5
1
1.5
2
0 50 100 150 200 250 300 350 400
Hs (m
), Tp
(s)
Wat
er L
evel
(m A
HD)
Time (hrs)
Water Level (m AHD) Hs (m) Tp (s)

Assessment and Decision Frameworks for Seawall Structures
Chapter 2 Assessment of Open Coast Seawalls Appendix E Case Study – Bilgola Beach Page 24
Carley and Cox (2003) found that although SBEACH could model recorded erosion events for which data was available, when a single rational 100-year ARI design storm was applied at Narrabeen Beach, the predicted erosion volumes were less than 80% of reported values for which reliable wave data was not available (e.g. Gordon, 1987; Thom and Hall, 1991; McLean and Shen, 2006). This is likely to be due to sequences (clusters) of storms causing major erosion, rather than a single storm (Callaghan et al., 2008). This same issue led the WA Government (WAPC, 2003) to specify that three back to back ‘design’ storms (nominally 100-year ARI) be run through SBEACH (or similar models) to determine the storm erosion component setback for coastal planning. Additional studies of clustering could be undertaken, but are beyond the present scope of works. Subject to the assumption made on storm clustering, the actual ARI of three closely spaced 100-year ARI storms could range from 300 to 100,000 years. However, the purpose of using three closely spaced 100-year ARI storms in SBEACH is to model a sequence of lesser storms which have been observed to cause ‘design’ erosion volumes on well monitored beaches while still properly considering the wave exposure of each beach. As shown in Thom and Hall (1991), when the time gap between individual storms is small (of the order of one week to several months), beach recovery does not have sufficient time to progress, as it occurs at much slower timescales than erosion (Carley et al., 1998). Therefore, for SBEACH erosion modelling, defining the time gap between storms within a cluster is not needed.
Ideally, the model would be calibrated against field measurements of erosion (beach profiles) with wave and water level data records. However, as adequate measurements are not available for calibration, generic parameters have been assumed and a validation exercise undertaken. In order to validate the methodology at Bilgola Beach without interactions with the seawall structures, WRL modelled three sequential 100-year ARI design storms. No allowance was made for beach recovery in between these storms. The pre-storm beach cross-section was based on photogrammetry profile 10 (3 July 2008) and ignored the presence of the underlying rock protection works (Seawall 1) (Figure 2.10). This photogrammetric profile was selected as it was the most recent and had one of the largest dune systems. Photogrammetric profiles indicate relatively accreted beach conditions at the validation date. The effective mean grain size for the beach was adopted from available literature. Nearshore bathymetric data was derived from surveys by Gordon and Hoffman (1990). This bathymetric data should be considered indicative only because of its small scale (1:25,000) and its dated nature (1990), but this was the best nearshore bathymetric data available to WRL. The change in dune volume (where negative volumes indicate erosion) above 0 m AHD without a seawall in place is shown in Table 2.13.

Assessment and Decision Frameworks for Seawall Structures
Chapter 2 Assessment of Open Coast Seawalls Appendix E Case Study – Bilgola Beach Page 25
Figure 2.10 Selected Photogrammetry Profiles at Bilgola Beach
Table 2.13 Change in Dune Volume for Three Consecutive Design Storms (No Seawall)
No. of Storms in Sequence
(1)Change in Dune Volume (m3/m above 0 m AHD)
Per Storm Cumulative Initial 0 0
1×100 year ARI 120 120 2×100 year ARI 65 185 3×100 year ARI 55 240
Notes: (1) rounded to the nearest 5 m3/m
It can be seen that the change in dune volume for each storm becomes asymptotic as the profile approaches a dissipative equilibrium. Good agreement (within 10 m3/m) was found between the modelled storm demand for three sequential 100-year ARI storms (240 m3/m) and that determined from photogrammetric analysis (250 m3/m). This approach is considered to model similar erosion volumes as those recorded during the most erosive period for which accurate measurements exist; three weeks during May-June 1974. On this basis, the erosion modelled from three sequential storms for each event (1-, 20-, 50- and 100-year ARI) was adopted to determine the scour level at each seawall.

Assessment and Decision Frameworks for Seawall Structures
Chapter 2 Assessment of Open Coast Seawalls Appendix E Case Study – Bilgola Beach Page 26
Profile response to the design events was assessed at three locations along Bilgola Beach coinciding with the four seawall structures. Pre-storm beach cross-sections were based on 2008 photogrammetry profiles 7 (Seawall 1), 4 (Seawalls 2A and 2B) and 1 (Seawall 3). These profiles provide just a single snapshot, and would in fact be changing in time. It should be emphasised that modelled scour levels are specific to the pre-storm beach profile conditions. However, a more eroded pre-storm profile would likely asymptote to equilibrium dissipative more quickly and therefore have smaller sand volume changes than those shown in Table 2.13. For those structures with multiple photogrammetry profiles, Seawall 1 (profiles 5 to 11) and Seawall 3 (profiles 1 to 3), WRL only considered one representative profile in assessing the stability of the seawall with respect to toe undermining. Note that profile 7 for Seawall 1 is co-linear with Section 13 from Mariani and Coghlan (2012). An example of model input and output with a seawall in place (such that erosion of the dune is prevented), is shown in Figure 2.11 for Seawall 2A. This illustrates that the predicted 100-year ARI (present day) scour level at Seawall 2A is approximately 1.8 m AHD and indicates undermining of the structure toe by 0.2 m.
Figure 2.11 Example SBEACH Erosion Modelling for 100-year ARI Event on Seawall 2A
Table 2.14 presents estimates of the 100-year ARI scour depth at the toe of the four seawalls at Bilgola Beach.
Table 2.14 100-year ARI Scour Depth Predictions at Bilgola Beach Seawalls
Seawall Toe Level (m AHD)
(1)Pre-Storm Beach Level at Wall Toe
(m AHD)
Predicted Scour for 100-year ARI Undermining (1)Depth
(m) Level
(m AHD) 1 0.0 4.0 3.3 0.7 no(2)
2A 2.0 3.1 1.3 1.8 yes 2B -0.15 4.3 0.0 4.3 no(3) 3 2.0 3.6 3.2 0.4 yes
Notes (1) pre-storm beach cross-sections were based on photogrammetry profiles dated 3 July, 2008 (2) this assumes that the seawall has a toe level of 0 m AHD (3) this assumes that Seawall 2A fails due to toe undermining during the event and erosion is ongoing
00.5
11.5
22.5
33.5
44.5
5
0 20 40 60 80 100 120 140
Elev
atio
n (m
AHD
)
Distance (m)
Bilgola Beach - Seawall 2A (Photogrammetry Profile 4)
Seawall 2A Structure Pre-Storm Beach Profile Post-Storm Beach Profile

Assessment and Decision Frameworks for Seawall Structures
Chapter 2 Assessment of Open Coast Seawalls Appendix E Case Study – Bilgola Beach Page 27
Based on the scour predictions, Seawall 1 is not at risk of failure from undermining during the 100-year ARI storm event (equivalent to 1% annual exceedance probability, AEP). However, it should be noted that this analysis is based on one cross-section of the seawall. For other sections of the structure where the toe level is as high as 1.5 m AHD, the risk of undermining is likely. As noted earlier, Seawall 2A is at risk of failure from undermining during the 100-year ARI storm event, however Seawall 2B is not (even assuming failure of Seawall 2A during the event and ongoing erosion). Seawall 3 is also at risk of failure from toe undermining. However, it should be noted that this analysis is based on photogrammetry profile 1 where the active beach zone seaward of the structure is most narrow (i.e. undermining may not occur further to the north along Seawall 3) and does not consider any protection provided by the flat rock blocks at 3 m AHD (Section 3.1). It should be noted that this assessment of scour does not consider additional erosion from Bilgola Creek entrance, stormwater outlets and freshwater runoff which is considered beyond the present scope of works.
While WRL has selected the 100-year ARI event as the ‘design’ condition for each of the seawalls, scour for more frequent storms (1-, 10- and 50-year ARI events) was also assessed and are presented in Table 2.15. Based on the scour predictions, Seawalls 1, 2A and 2B are not at risk of toe undermining from these more frequent storms. However, Seawall 3 is at risk of being undermined during all present-day modelled storms except for the 1-year ARI event.
Table 2.15 Scour Depth Predictions at Bilgola Beach Seawalls for a Range of ARI
Seawall Predicted Scour Depth (m) Predicted Scour Level (m AHD)
50-year ARI 10-year ARI 1-year ARI 50-year ARI 10-year ARI 1-year ARI 1 3.2 2.8 0.0 0.9 1.2 4.0
2A 1.1 0.6 0.0 2.0 2.5 3.1 2B 0.0 0.0 0.0 4.3 4.3 4.3 3 3.1 2.7 1.1 0.5 0.9 2.5
Figure 2.12 presents for each seawall plots of:
• predicted scour levels for the 1-, 10-, 50- and 100-year ARI storm events
• estimated seawall toe levels, and
• minimum sand levels against the seawall as derived from photogrammetry analysis.

Assessment and Decision Frameworks for Seawall Structures
Chapter 2 Assessment of Open Coast Seawalls Appendix E Case Study – Bilgola Beach Page 28
Figure 2.12 Comparison of Predicted Scour Levels with Existing Toe Levels
-1.0
0.0
1.0
2.0
3.0
4.0
5.0
1 10 100
Leve
l (m
AHD
)
ARI (yr)
Bilgola Beach Seawall 1
Predicted scour level
Estimated toe level
Minimum sand level
-1.0
0.0
1.0
2.0
3.0
4.0
5.0
1 10 100
Leve
l (m
AHD
)
ARI (yr)
Bilgola Beach Seawall 2A
Predicted scour level
Estimated toe level
Minimum sand level
-1.0
0.0
1.0
2.0
3.0
4.0
5.0
1 10 100
Leve
l (m
AHD
)
ARI (yr)
Bilgola Beach Seawall 2B
Predicted scour level
Estimated toe level
Minimum sand level
-1.0
0.0
1.0
2.0
3.0
4.0
5.0
1 10 100
Leve
l (m
AHD
)
ARI (yr)
Bilgola Beach Seawall 3
Predicted scour level
Estimated toe level
Minimum sand level

Assessment and Decision Frameworks for Seawall Structures
Chapter 2 Assessment of Open Coast Seawalls Appendix E Case Study – Bilgola Beach Page 29
2.5.3 Wall Stability Under Wave Action
Having established the design scour levels for each seawall and each storm event, WRL assessed the stability of the rock structures (Seawalls 1 and 2B) under wave action. In order to do this, the depth-limited significant wave height at each structure was determined using an empirical technique considering each of the combined wave, water level and scour level conditions. The breaker depth index (γ) is generally defined by the ratio of the breaker significant wave height (HS) to the break point water depth (db). Note that wave setup has been included in all calculations involving db. Note that where the post-storm scour level is below the toe of the seawall, the design HS has been calculated based upon the water depth above the toe of the seawall. That is, the stability of the rock structures was only considered up to the point of failure by toe undermining.
An empirical technique for estimating the breaker depth index was derived from laboratory experiments by Goda (2007) on slopes between 1V:9H and horizontal. These experiments indicated ratios of HS/db = 0.51 to 0.60 (generally). Estimates of the breaker depth index at each seawall (nearshore slope of 1V:25H) based on this technique range between 0.63 and 0.65. Following the derivation of the depth-limited HS (summarised in Table 2.16), this parameter was also used to derive the additional depth limited wave statistics H1/10 and H2% according to Battjes and Groenendijk (2000).
Table 2.16 Bilgola Beach ‘At Structure’ Extreme Wave Conditions
Seawall
100-year ARI 50-year ARI 10-year ARI 1-year ARI (1)Scour
Level (m AHD)
Hs (m)
(1)Scour Level
(m AHD)
Hs (m)
(1)Scour Level
(m AHD)
Hs (m)
(1)Scour Level
(m AHD)
Hs (m)
1 0.7 1.2 0.9 1.1 1.2 0.7 4.0 (2)n/a 2A 2.0 0.4 2.0 0.4 2.5 (2)n/a 2.5 (2)n/a 2B 4.3 (2)n/a 4.3 (2)n/a 4.3 (2)n/a 4.3 (2)n/a 3 2.0 0.4 2.0 0.4 2.0 0.2 2.5 (2)n/a
Notes (1) where the post-storm scour level is below the toe of the seawall, HS calculations are based upon the level of the toe of the seawall (2) where the post-storm scour level is above the design water level (including setup) but below the wave runup level, depth-limited HS values have not been calculated
For an existing flexible rubble mound structure such as Seawall 1, armour stability may be assessed using several different empirical methods as detailed in The Rock Manual (CIRIA, 2007): Hudson (SPM, 1977), Hudson (SPM, 1984), Van der Meer (deep water) and Van der Meer (shallow water). To compare the results of each of these techniques which use different measures of rock stability, rock armour damage was classified based on guidelines presented in the Coastal Engineering Manual (CEM, 2006) and The Rock Manual (CIRIA, 2007) and reproduced in Table 2.17. Damage for rock was defined as rocks which are displaced a distance greater than the Dn50 (median nominal rock diameter, equivalent cube). The damage percentage for rock is then determined by relating the number of rocks displaced as a proportion of the total number of rocks in the complete primary armour layer or within a reference area. KD and SD are empirical stability (or damage) coefficients for the Hudson and Van der Meer techniques, respectively. As discussed in Section 2.3, WRL assumed that Seawall 1 has a slope of 1V:2H and is composed of two layers of rough, randomly placed 2.0 t basalt (density ≈ 2700 kg/m3) with a porosity of 40%.

Assessment and Decision Frameworks for Seawall Structures
Chapter 2 Assessment of Open Coast Seawalls Appendix E Case Study – Bilgola Beach Page 30
Table 2.17 Classification of Rock Armour Damage Limits
Qualitative % Hudson (1977)
Kd
Hudson (1984)
Kd
Van der Meer (deep water)
Sd
Van der Meer (shallow water)
Sd No Damage (Some Settlement) 0 <1.8 <1.0 <1.0 <1 Rocking but no Damage <5 1.8-3.5 1.0-2.0 1.0-2.0 1.0-2.0 Initial Damage 5-10 3.5-6.0 2.0-3.0 2.0-4.0 2.0-4.0 Intermediate Damage 10-20 6.0-9.0 3.0-5.0 4.0-8.0 4.0-8.0 Failure >20 >9.0 >5.0 >8.0 >8.0
Table 2.18 presents estimates of rock armour stability for Seawall 1 for all modelled ARI events based on the depth-limited HS presented in Table 2.16 and the assumptions regarding structural composition discussed in Section 2.3.
Table 2.18 Armour Stability Predictions for Bilgola Beach Seawall 1
ARI Hudson (1977)
Hudson (1984)
Van der Meer (deep water)
Van der Meer (shallow water) Armour Stability
Kd Kd Sd Sd 100 0.3 0.6 0.1 0.1 No Damage (Some Settlement) 50 0.2 0.4 0.0 0.0 No Damage (Some Settlement) 10 0.1 0.1 0.0 0.0 No Damage (Some Settlement) 1 (1)n/a (1)n/a (1)n/a (1)n/a No Damage (Remains Buried)
Notes (1) where the post-storm scour level is below the toe of the seawall, Seawall 1 remains buried
Based on the scour and rock armour stability predictions, Seawall 1 is not at risk of failure from wave action during all present-day modelled storms. However, note that that while no damage is predicted to occur, some settlement is expected, particularly since there is not an adequate filter layer underneath the structure. Also, this stability assessment assumes that the armour rock is 2.0 t basalt. For armour rocks of smaller mass and/or lighter density (i.e. sandstone) which are known to exist within Seawall 1, the degree of damage will be more significant.
For an existing sloping gabion and reno mattress structure such as Seawall 2B, wall stability may be assessed using several different empirical methods as detailed by Brown (1979) and Pilarczyk (1990 and 1998). Both authors relate the static stability of each part of the structure to the characteristic size/thickness of the gabion (or reno mattress). However, the techniques proposed by Pilarczyk contain many variables for which reasonable assumptions cannot readily be made for Seawall 2B. Accordingly, WRL adopted the technique of Brown (1979) to assess the stability of Seawall 2B under wave action. Since scour predictions indicate that Seawall 2B remains buried during all present-day modelled storms, it is not at risk of failure from wave action and wall stability was not assessed for present day conditions. Stability for projected conditions in 2050 and 2100 are discussed in Section 2.5.5. Downslope sliding is expected to be the predominant form of failure for this structure due to its steep slope of 1V:1H. Note also that this technique considers the overall global stability of a box gabion or reno mattress and not the dynamic stability of stones contained within these units. As discussed in Section 2.3, WRL assumed that Seawall 2B is composed of sandstone (density ≈ 2300 kg/m3).
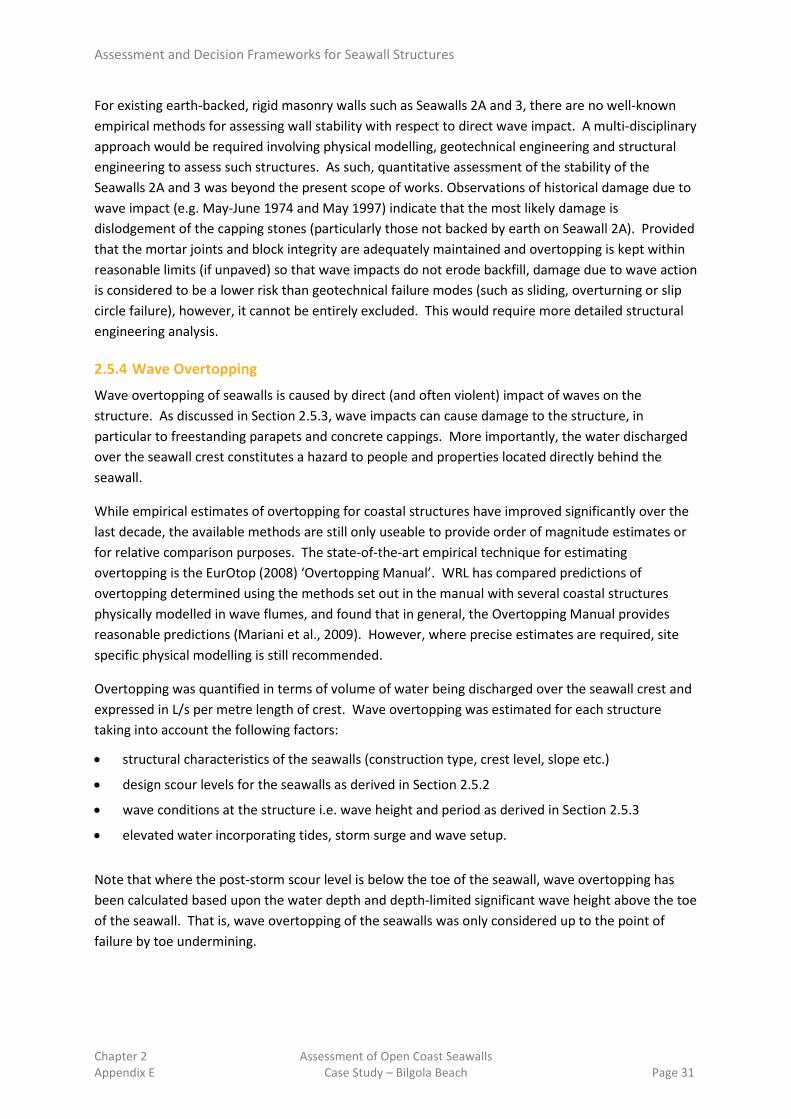
Assessment and Decision Frameworks for Seawall Structures
Chapter 2 Assessment of Open Coast Seawalls Appendix E Case Study – Bilgola Beach Page 31
For existing earth-backed, rigid masonry walls such as Seawalls 2A and 3, there are no well-known empirical methods for assessing wall stability with respect to direct wave impact. A multi-disciplinary approach would be required involving physical modelling, geotechnical engineering and structural engineering to assess such structures. As such, quantitative assessment of the stability of the Seawalls 2A and 3 was beyond the present scope of works. Observations of historical damage due to wave impact (e.g. May-June 1974 and May 1997) indicate that the most likely damage is dislodgement of the capping stones (particularly those not backed by earth on Seawall 2A). Provided that the mortar joints and block integrity are adequately maintained and overtopping is kept within reasonable limits (if unpaved) so that wave impacts do not erode backfill, damage due to wave action is considered to be a lower risk than geotechnical failure modes (such as sliding, overturning or slip circle failure), however, it cannot be entirely excluded. This would require more detailed structural engineering analysis.
2.5.4 Wave Overtopping
Wave overtopping of seawalls is caused by direct (and often violent) impact of waves on the structure. As discussed in Section 2.5.3, wave impacts can cause damage to the structure, in particular to freestanding parapets and concrete cappings. More importantly, the water discharged over the seawall crest constitutes a hazard to people and properties located directly behind the seawall.
While empirical estimates of overtopping for coastal structures have improved significantly over the last decade, the available methods are still only useable to provide order of magnitude estimates or for relative comparison purposes. The state-of-the-art empirical technique for estimating overtopping is the EurOtop (2008) ‘Overtopping Manual’. WRL has compared predictions of overtopping determined using the methods set out in the manual with several coastal structures physically modelled in wave flumes, and found that in general, the Overtopping Manual provides reasonable predictions (Mariani et al., 2009). However, where precise estimates are required, site specific physical modelling is still recommended.
Overtopping was quantified in terms of volume of water being discharged over the seawall crest and expressed in L/s per metre length of crest. Wave overtopping was estimated for each structure taking into account the following factors:
• structural characteristics of the seawalls (construction type, crest level, slope etc.)
• design scour levels for the seawalls as derived in Section 2.5.2
• wave conditions at the structure i.e. wave height and period as derived in Section 2.5.3
• elevated water incorporating tides, storm surge and wave setup.
Note that where the post-storm scour level is below the toe of the seawall, wave overtopping has been calculated based upon the water depth and depth-limited significant wave height above the toe of the seawall. That is, wave overtopping of the seawalls was only considered up to the point of failure by toe undermining.
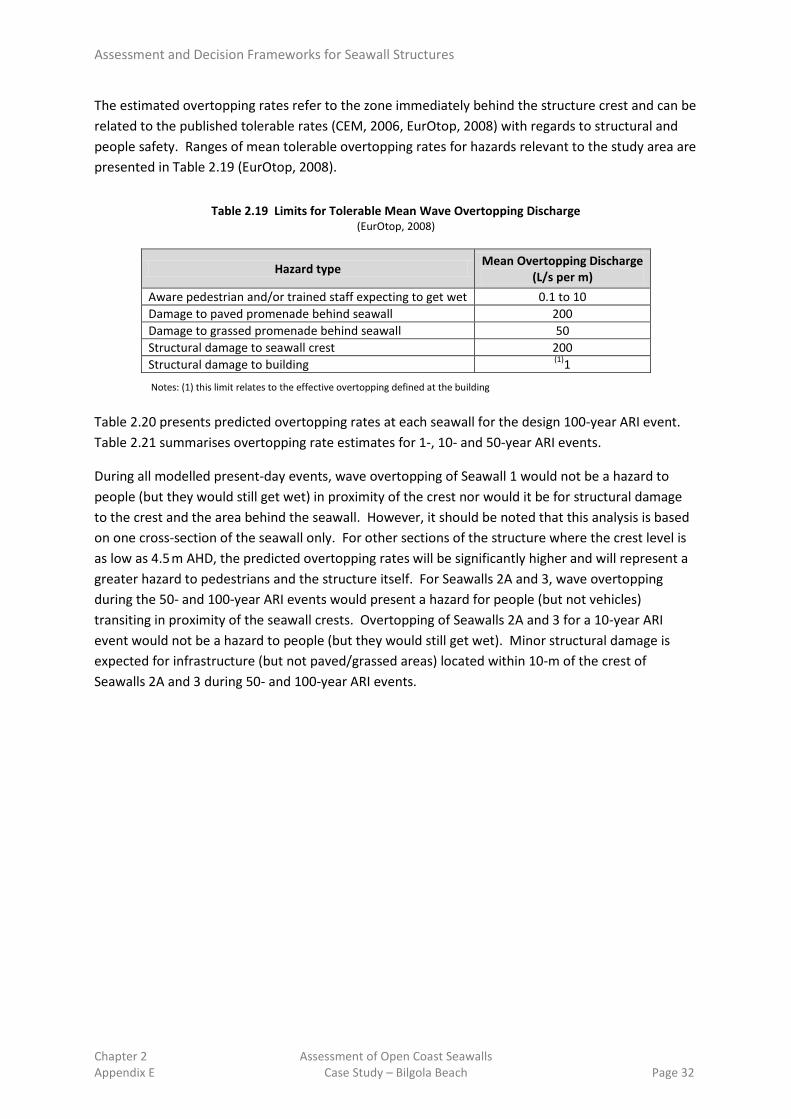
Assessment and Decision Frameworks for Seawall Structures
Chapter 2 Assessment of Open Coast Seawalls Appendix E Case Study – Bilgola Beach Page 32
The estimated overtopping rates refer to the zone immediately behind the structure crest and can be related to the published tolerable rates (CEM, 2006, EurOtop, 2008) with regards to structural and people safety. Ranges of mean tolerable overtopping rates for hazards relevant to the study area are presented in Table 2.19 (EurOtop, 2008).
Table 2.19 Limits for Tolerable Mean Wave Overtopping Discharge (EurOtop, 2008)
Hazard type Mean Overtopping Discharge (L/s per m)
Aware pedestrian and/or trained staff expecting to get wet 0.1 to 10 Damage to paved promenade behind seawall 200 Damage to grassed promenade behind seawall 50 Structural damage to seawall crest 200 Structural damage to building (1)1
Notes: (1) this limit relates to the effective overtopping defined at the building
Table 2.20 presents predicted overtopping rates at each seawall for the design 100-year ARI event. Table 2.21 summarises overtopping rate estimates for 1-, 10- and 50-year ARI events.
During all modelled present-day events, wave overtopping of Seawall 1 would not be a hazard to people (but they would still get wet) in proximity of the crest nor would it be for structural damage to the crest and the area behind the seawall. However, it should be noted that this analysis is based on one cross-section of the seawall only. For other sections of the structure where the crest level is as low as 4.5 m AHD, the predicted overtopping rates will be significantly higher and will represent a greater hazard to pedestrians and the structure itself. For Seawalls 2A and 3, wave overtopping during the 50- and 100-year ARI events would present a hazard for people (but not vehicles) transiting in proximity of the seawall crests. Overtopping of Seawalls 2A and 3 for a 10-year ARI event would not be a hazard to people (but they would still get wet). Minor structural damage is expected for infrastructure (but not paved/grassed areas) located within 10-m of the crest of Seawalls 2A and 3 during 50- and 100-year ARI events.

Assessment and Decision Frameworks for Seawall Structures
Chapter 2 Assessment of Open Coast Seawalls Appendix E Case Study – Bilgola Beach Page 33
Table 2.20 Predicted Overtopping Rates at Bilgola Beach Seawalls for 100-year ARI Storm Event
Seawall Crest Level (m AHD)
Hs (m)
Tp (s)
Inundation Level (m AHD)
Q (L/s per m)
(1)Hazard to Pedestrians
(1)Structural Damage
1 6.0 1.2 13.0 2.7 <0.1 no no 2A 4.5 0.4 13.0 2.7 0.7 dangerous minor 2B 3.9 (2)n/a (2)n/a 2.7 (2)n/a (2)n/a (2)n/a 3 5.0 0.4 13.0 2.7 0.3 dangerous minor
Notes: Based on EurOtop, 2008 where the post-storm scour level is above the design water level (including setup) but below the wave runup level, depth limited HS values and wave overtopping values have not been calculated, but are expected to be small
Table 2.21 Predicted Overtopping Rates for 1-, 10- and 50-year ARI Storm Events
Seawall Q (L/s per m)
1-yr ARI 10-yr ARI 50-yr ARI 1 (1)n/a <0.1 <0.1
2A (1)n/a (1)n/a 0.4 2B (1)n/a (1)n/a (1)n/a 3 (1)n/a <0.1 0.2
Notes: where the post-storm scour level is above the design water level (including setup) but below the wave runup level, depth limited HS values and wave overtopping values have not been calculated
2.5.5 Sea Level Rise Impacts
Following assessment of each of the seawalls with regard to their suitability to withstand the occurrence of the present-day storm conditions, WRL considered the stability of the structures for the 2050 and 2100 planning horizons. The same methodology was used to re-assess the likelihood of undermining, structure instability and erosion of the backfill including effects of projected sea level rise. Sea level rise was accounted for in two ways in the revised analysis:
(1) increasing still water levels in accordance with NSW benchmarks, and
(2) adjusting the pre-storm beach profiles to account for recession due to sea level rise.
The most widely known model for beach response to future sea level rise is that of Bruun (1962, 1983 and 1988). The Bruun model (as separately defined from the Bruun Rule) assumes that as sea level is raised, the equilibrium profile is moved upward and landward conserving mass and original shape. The limitations of this methodology are well recognised (Ranasinghe et al., 2007) and were taken into consideration. However, no robust and scientifically recognised alternative currently exists and the application of the Bruun rule is currently supported by State Government Policy (DECCW, 2010). Accordingly, to re-assess scour levels in 2050 and 2100, WRL raised and receded each of the selected 2008 photogrammetry profiles (1, 4 and 7) by the values shown in Table 2.22. Note that the ‘Bruun Factor’ is essentially a cross-shore slope. Response to sea level rise is then simply a translation of the existing nearshore profile up a regional slope.

Assessment and Decision Frameworks for Seawall Structures
Chapter 2 Assessment of Open Coast Seawalls Appendix E Case Study – Bilgola Beach Page 34
Table 2.22 Beach Profile Response to Sea Level Rise Projections
Planning Period (year)
(1)Sea Level Rise above 1990
Level (m)
(2)Sea Level Rise above Present
Level (m)
Vertical Profile Rise
(m)
‘Bruun Factor’
(-)
Horizontal Profile Recession
(m)
2050 0.40 0.33 0.33 38.9 13.2 2100 0.90 0.83 0.83 38.9 32.7
Where the adjusted profile intersected with the face of each seawall (for non-buried structures), the profile landward of the seawall remained unchanged for the analysis. An example of SBEACH model input to determine the scour levels for Seawall 3 (photogrammetry profile 1) for present-day, 2050 and 2100 conditions is shown in Figure 2.13.
Figure 2.13 Example SBEACH Erosion Modelling Input for Seawall 3
While obviously influencing beach recession, sea level rise will also exacerbate the process of erosion on sandy beaches. Further to any reduction in pre-storm sand levels at the toe of the seawalls from recession due to sea level rise (no underlying recession was assumed), increased still water levels will also allow higher waves to impact the structures and generate deeper scour compared to present day conditions. Accordingly, the risk of seawall instability due to undermining will increase over time. Table 2.23 summarises estimates of scour levels for 2050 and 2100.
0
1
2
3
4
5
6
0 20 40 60 80 100 120 140
Elev
atio
n (m
AHD
)
Distance (m)
Bilgola Beach - Seawall 3 (Photogrammetry Profile 1)
Seawall 3 Structure Present Day Pre-Storm Beach Profile
2050 Pre-Storm Beach Profile 2100 Pre-Storm Beach Profile
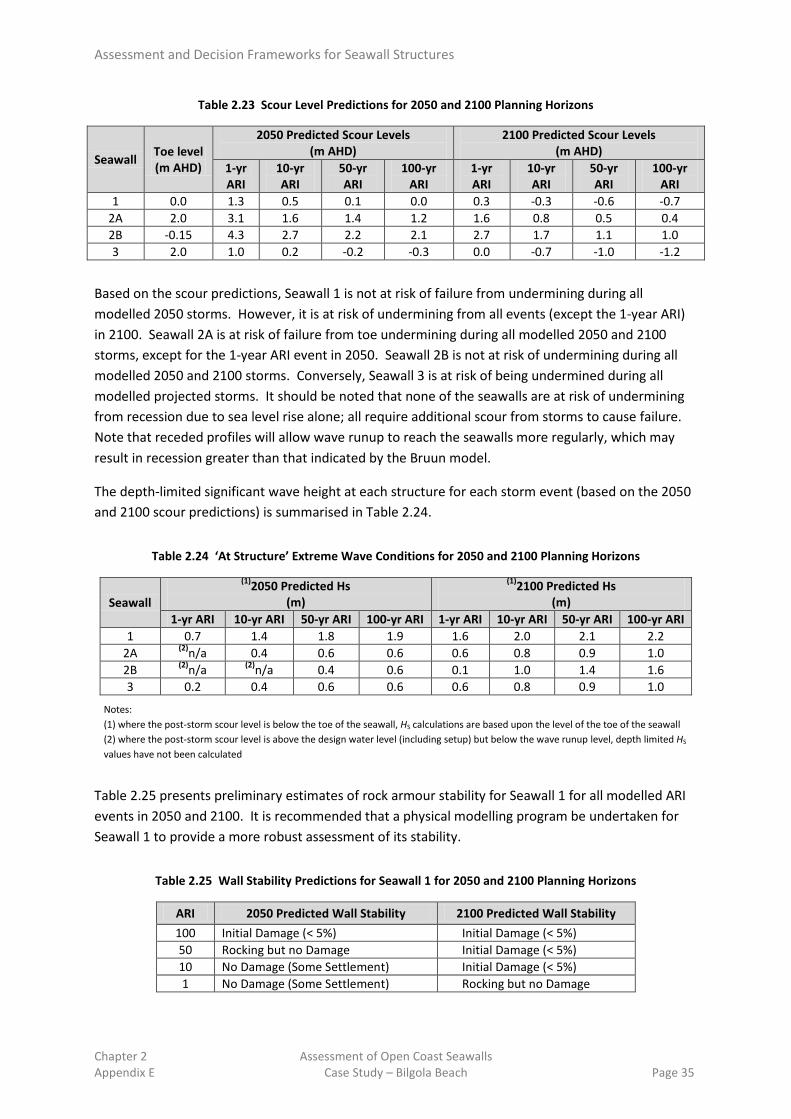
Assessment and Decision Frameworks for Seawall Structures
Chapter 2 Assessment of Open Coast Seawalls Appendix E Case Study – Bilgola Beach Page 35
Table 2.23 Scour Level Predictions for 2050 and 2100 Planning Horizons
Seawall Toe level (m AHD)
2050 Predicted Scour Levels (m AHD)
2100 Predicted Scour Levels (m AHD)
1-yr ARI
10-yr ARI
50-yr ARI
100-yr ARI
1-yr ARI
10-yr ARI
50-yr ARI
100-yr ARI
1 0.0 1.3 0.5 0.1 0.0 0.3 -0.3 -0.6 -0.7 2A 2.0 3.1 1.6 1.4 1.2 1.6 0.8 0.5 0.4 2B -0.15 4.3 2.7 2.2 2.1 2.7 1.7 1.1 1.0 3 2.0 1.0 0.2 -0.2 -0.3 0.0 -0.7 -1.0 -1.2
Based on the scour predictions, Seawall 1 is not at risk of failure from undermining during all modelled 2050 storms. However, it is at risk of undermining from all events (except the 1-year ARI) in 2100. Seawall 2A is at risk of failure from toe undermining during all modelled 2050 and 2100 storms, except for the 1-year ARI event in 2050. Seawall 2B is not at risk of undermining during all modelled 2050 and 2100 storms. Conversely, Seawall 3 is at risk of being undermined during all modelled projected storms. It should be noted that none of the seawalls are at risk of undermining from recession due to sea level rise alone; all require additional scour from storms to cause failure. Note that receded profiles will allow wave runup to reach the seawalls more regularly, which may result in recession greater than that indicated by the Bruun model.
The depth-limited significant wave height at each structure for each storm event (based on the 2050 and 2100 scour predictions) is summarised in Table 2.24.
Table 2.24 ‘At Structure’ Extreme Wave Conditions for 2050 and 2100 Planning Horizons
Seawall
(1)2050 Predicted Hs (m)
(1)2100 Predicted Hs (m)
1-yr ARI 10-yr ARI 50-yr ARI 100-yr ARI 1-yr ARI 10-yr ARI 50-yr ARI 100-yr ARI 1 0.7 1.4 1.8 1.9 1.6 2.0 2.1 2.2
2A (2)n/a 0.4 0.6 0.6 0.6 0.8 0.9 1.0 2B (2)n/a (2)n/a 0.4 0.6 0.1 1.0 1.4 1.6 3 0.2 0.4 0.6 0.6 0.6 0.8 0.9 1.0
Notes: (1) where the post-storm scour level is below the toe of the seawall, HS calculations are based upon the level of the toe of the seawall (2) where the post-storm scour level is above the design water level (including setup) but below the wave runup level, depth limited HS values have not been calculated
Table 2.25 presents preliminary estimates of rock armour stability for Seawall 1 for all modelled ARI events in 2050 and 2100. It is recommended that a physical modelling program be undertaken for Seawall 1 to provide a more robust assessment of its stability.
Table 2.25 Wall Stability Predictions for Seawall 1 for 2050 and 2100 Planning Horizons
ARI 2050 Predicted Wall Stability 2100 Predicted Wall Stability 100 Initial Damage (< 5%) Initial Damage (< 5%) 50 Rocking but no Damage Initial Damage (< 5%) 10 No Damage (Some Settlement) Initial Damage (< 5%) 1 No Damage (Some Settlement) Rocking but no Damage
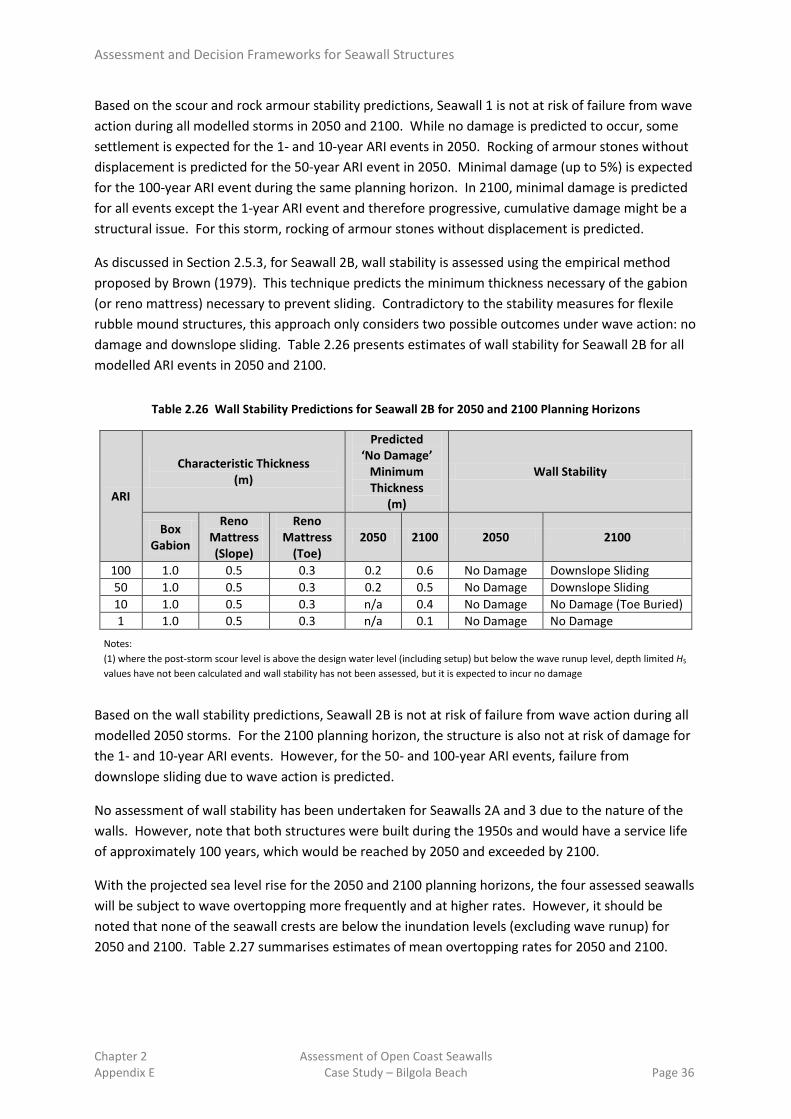
Assessment and Decision Frameworks for Seawall Structures
Chapter 2 Assessment of Open Coast Seawalls Appendix E Case Study – Bilgola Beach Page 36
Based on the scour and rock armour stability predictions, Seawall 1 is not at risk of failure from wave action during all modelled storms in 2050 and 2100. While no damage is predicted to occur, some settlement is expected for the 1- and 10-year ARI events in 2050. Rocking of armour stones without displacement is predicted for the 50-year ARI event in 2050. Minimal damage (up to 5%) is expected for the 100-year ARI event during the same planning horizon. In 2100, minimal damage is predicted for all events except the 1-year ARI event and therefore progressive, cumulative damage might be a structural issue. For this storm, rocking of armour stones without displacement is predicted.
As discussed in Section 2.5.3, for Seawall 2B, wall stability is assessed using the empirical method proposed by Brown (1979). This technique predicts the minimum thickness necessary of the gabion (or reno mattress) necessary to prevent sliding. Contradictory to the stability measures for flexile rubble mound structures, this approach only considers two possible outcomes under wave action: no damage and downslope sliding. Table 2.26 presents estimates of wall stability for Seawall 2B for all modelled ARI events in 2050 and 2100.
Table 2.26 Wall Stability Predictions for Seawall 2B for 2050 and 2100 Planning Horizons
ARI
Characteristic Thickness (m)
Predicted ‘No Damage’
Minimum Thickness
(m)
Wall Stability
Box Gabion
Reno Mattress (Slope)
Reno Mattress
(Toe) 2050 2100 2050 2100
100 1.0 0.5 0.3 0.2 0.6 No Damage Downslope Sliding 50 1.0 0.5 0.3 0.2 0.5 No Damage Downslope Sliding 10 1.0 0.5 0.3 n/a 0.4 No Damage No Damage (Toe Buried) 1 1.0 0.5 0.3 n/a 0.1 No Damage No Damage
Notes: (1) where the post-storm scour level is above the design water level (including setup) but below the wave runup level, depth limited HS values have not been calculated and wall stability has not been assessed, but it is expected to incur no damage
Based on the wall stability predictions, Seawall 2B is not at risk of failure from wave action during all modelled 2050 storms. For the 2100 planning horizon, the structure is also not at risk of damage for the 1- and 10-year ARI events. However, for the 50- and 100-year ARI events, failure from downslope sliding due to wave action is predicted.
No assessment of wall stability has been undertaken for Seawalls 2A and 3 due to the nature of the walls. However, note that both structures were built during the 1950s and would have a service life of approximately 100 years, which would be reached by 2050 and exceeded by 2100.
With the projected sea level rise for the 2050 and 2100 planning horizons, the four assessed seawalls will be subject to wave overtopping more frequently and at higher rates. However, it should be noted that none of the seawall crests are below the inundation levels (excluding wave runup) for 2050 and 2100. Table 2.27 summarises estimates of mean overtopping rates for 2050 and 2100.

Assessment and Decision Frameworks for Seawall Structures
Chapter 2 Assessment of Open Coast Seawalls Appendix E Case Study – Bilgola Beach Page 37
Table 2.27 Predicted Overtopping Rates for 2050 and 2100 Planning Horizons
Seawall 2050 Predicted Overtopping Rates
(L/s per m) 2100 Predicted Overtopping Rates
(L/s per m) 1-yr ARI 10-yr ARI 50-yr ARI 100-yr ARI 1-yr ARI 10-yr ARI 50-yr ARI 100-yr ARI
1 <0.1 <0.1 <0.1 <0.1 <0.1 0.2 0.7 1 2A (1)n/a 0.8 3 5 2 14 27 26 2B (1)n/a <0.1 <0.1 <0.1 <0.1 4 116 243 3 <0.1 0.4 1 2 0.8 5 14 22
Notes: where the post-storm scour level is above the design water level (including setup) but below the wave runup level, depth limited HS values and wave overtopping values have not been calculated, but are expected to be small
During all modelled events in 2050 and the 1-year ARI event in 2100, wave overtopping of Seawall 1 would not be a hazard to people (but they would still get wet) in proximity of the crest nor would structural damage to the crest and the area behind the seawall occur. However, overtopping of this structure for 10-, 50- and 100-year ARI events in 2100 would constitute a hazard for people and result in minor structural damage for infrastructure (but not paved/grassed areas) located within 10 m of the crest. For all events in 2050 and 2100 (except the 1-year ARI event in 2050), wave overtopping of Seawall 2A would be a hazard for people and would result in minor structural damage. For Seawall 2B, wave overtopping would not be a hazard to people (but they would still get wet) in proximity of the crest and structural damage would not be a risk during all considered events in 2050 and the 1-year ARI event in 2100. However, for the 50- and 100-year ARI events in 2100, extensive damage constituting failure is expected. Structural damage to the crest of the seawall and damage to the grassed and paved area leeward of Seawall 2B is projected. For Seawall 3, wave overtopping would not be a hazard to people (but they would still get wet) in proximity of the crest for the 1-year ARI event in 2050. For all other modelled events in 2050 and 2100, wave overtopping would be a hazard for people and would result in minor structural damage. It is noteworthy that wave overtopping would also be a hazard for vehicles transiting in proximity of the crest of this seawall (in the Bilgola SLSC car park) for the 50- and 100-year ARI events in 2100.
2.5.6 Summary
WRL has undertaken a detailed assessment for each of the four seawalls at Bilgola Beach with regard to their suitability to withstand the occurrence of 1-, 10-, 50- and 100-year ARI events for present day conditions and for the 2050 and 2100 planning horizons, including sea level rise projections. The likelihood of failure of the seawalls was assessed for undermining, structure instability (for rock seawalls only) and erosion of the backfill (wave overtopping), though excluded geotechnical considerations. Each of the four structures was found to be at risk of failure by one of the assessed modes by the 2100 planning horizon. A summary detailing if structural failure is likely to occur is presented in Table 2.28 for each seawall within each planning period and for each storm event considered.

Assessment and Decision Frameworks for Seawall Structures
Chapter 2 Assessment of Open Coast Seawalls Appendix E Case Study – Bilgola Beach Page 38
Table 2.28 Summary of Seawall Assessment for Present Day, 2050 and 2100 Planning Horizons Pl
anni
ng
Horiz
on
ARI
Structural Failure Seawall 1 Seawall 2A Seawall 2B Seawall 3
Scour Stability OT Scour Stability OT Scour Stability OT Scour Stability OT
Pres
ent D
ay
1 no no no no (1)n/a no no no no no (1)n/a no 10 no no no no (1)n/a no no no no yes (1)n/a no 50 no no no no (1)n/a no no no no yes (1)n/a no
100 no no no yes (1)n/a no no no no yes (1)n/a no
2050
1 no no no no (1)n/a no no no no yes (1)n/a no 10 no no no yes (1)n/a no no no no yes (1)n/a no 50 no no no yes (1)n/a no no no no yes (1)n/a no
100 no no no yes (1)n/a no no no no yes (1)n/a no
2100
1 no no no yes (1)n/a no no no no yes (1)n/a no 10 yes no no yes (1)n/a no no no no yes (1)n/a no 50 yes no no yes (1)n/a no no yes yes yes (1)n/a no
100 yes no no yes (1)n/a no no yes yes yes (1)n/a no
Notes: For existing earth backed, rigid masonry walls, wall stability was not assessed
To consider the likely time to failure for each of the seawalls at Bilgola Beach it is helpful to consider the probability of encountering one of the modelled storm events (1-, 10-, 50- and 100-year ARI). The ‘encounter probability’ is the chance of a given ARI event occurring during the service life a seawall. Tabulated values for this probability are presented in Table 2.29. Ignoring the variable length of service already provided by each of the seawalls (i.e. commencing calculations from 2012), it can be seen that the probability of encountering 1-and 10-year ARI events by 2050 and 2100 is near certain. However, the probability of encountering a 100-year ARI storm event by 2050 is 32% and by 2100, 59%. While this analysis has its limitations, it is useful for considering the planning horizon over which failure may be likely. Note that this technique assumes that the consequences of each respective ARI storm are stationary. As noted earlier, this is not the case under sea level rise projections and the consequences (and hence risk) for a given ARI storm will increase with time.
Table 2.29 Encounter Probability for ARI Event and Service Life
ARI Encounter Probability (%) for ARI Event (years) 1 10 50 100
AEP 63.21 9.52 1.98 1.00 Service Life
(Years) Calendar Year
1 2013 63.21 9.52 1.98 1.00 2 2014 86.47 18.13 3.92 1.98 5 2017 99.33 39.35 9.52 4.88
10 2022 100.00 63.21 18.13 9.52 20 2032 100.00 86.47 32.97 18.13 38 2050 100.00 97.76 53.23 31.61 50 2062 100.00 99.33 63.21 39.35 88 2100 100.00 99.98 82.80 58.52
100 2112 100.00 100.00 86.47 63.21

Assessment and Decision Frameworks for Seawall Structures
Chapter 2 Assessment of Open Coast Seawalls Appendix E Case Study – Bilgola Beach Page 39
Considering the mechanism by which structural failure is first likely to occur and the likely time to failure (to within a planning horizon) for each of the seawalls at Bilgola Beach, a summary presenting the most likely outcomes is presented in Table 2.30. This indicates that scour is the most likely failure mechanism for Seawalls 1, 2A and 3. Structural instability due to sliding and damage due to wave overtopping are likely to occur within the same storm events for Seawall 2B. In relative terms, Seawall 3 is at the most imminent risk of failure, with Seawall 2A having a similar but slightly longer estimated time to failure (Present Day to 2050). The time to failure for Seawalls 1 and 2B is expected to be later than these structures (2050 to 2100).
Table 2.30 Predicted Failure Mechanism and Timing for Bilgola Beach Seawalls
Seawall Location Predicted Failure
Mechanism Timing
1 Buried under dune fronting Allen Avenue properties Toe Undermining 2050-2100
2A Fronting 21 Bilgola Avenue Toe Undermining Present Day-2050 2B Buried under fill landward of Seawall 2A Stability/Overtopping 2050-2100 3 Fronting Bilgola SLSC Toe Undermining Present Day-2050
It is also helpful to qualitatively consider the likely outcomes from a major storm occurring at present and within the 2050 and 2100 planning horizons. Since the 100-year ARI storm is the adopted design event, the likely impacts of such a storm are considered in the following discourse based on the assumptions set out in the preceding sections.
At the present time, a scenario involving a 100-year ARI event would likely involve a series of three storms over two months. Each storm would have a likely duration of almost six days, with insufficient time between storms (approximately three weeks) for significant natural beach recovery to occur. It is assumed that Bilgola Beach would be in a relatively accreted state prior to the commencement of the first storm without any effort made to mitigate erosion damage in between storm events. Large, long period waves generated offshore from a low pressure system combined with a high storm surge on a spring tidal cycle would cause extensive erosion of the beach. Gale force onshore winds and intense rainfall would also be expected. The rate of erosion and extent of inundation would be greatest for approximately 2 hours at each high tide (occurring approximately every 12.5 hours). It is expected that most of the sand covering the sloping rock seawall seaward of Allen Avenue (Seawall 1) would be removed by erosion. Seawall 1 is unlikely to be damaged by wave action, and the toe would generally not be undermined. However, some rocks are expected to settle (or sink) into the sand underneath the structure as there is not an adequate filter layer. Where the crest level of the structure is relatively high, wave overtopping would not be unsafe for aware pedestrians standing leeward of the crest. However, they would still get wet from waves occasionally overtopping the wall.
At 21 Bilgola Avenue, the vertical stone and concrete seawall (Seawall 2) is expected to fail due to toe undermining. Once the sand level in front of the wall is reduced below the toe level, the structure is likely to subside and collapse seaward. Prior to the failure of Seawall 2A, wave overtopping is likely to be unsafe not only for pedestrians standing landward but also in the vicinity of the structure crest.

Assessment and Decision Frameworks for Seawall Structures
Chapter 2 Assessment of Open Coast Seawalls Appendix E Case Study – Bilgola Beach Page 40
Any infrastructure in close proximity to the crest is also expected to be damaged. While it is predicted that Seawall 2A would fail in such a storm, erosion would not be so great as to remove the fill covering the sloping gabion structure (Seawall 2B). Failure of Seawall 2A may also lead to the outflanking of Seawall 1 at its southern end.
The vertical seawall fronting Bilgola SLSC (Seawall 3) is also expected to be partially undermined (particularly at its southern end), resulting in its collapse. Prior to the failure of Seawall 3, wave overtopping is likely to be unsafe for pedestrians (but not vehicles in the car park) near the structure crest. Any infrastructure in close proximity to the crest (including the roller doors of Bilgola SLSC) is also expected to be damaged. Ongoing erosion following the failure of Seawall 3 may threaten the Bilgola SLSC building itself (if it is not founded on rock) and the adjacent car park. While wave runup and overtopping would directly affect those buildings in the front row facing the ocean, relatively high back beach levels mean that ‘quasi-static’ inundation (excluding wave runup but including storm surge and wave setup) is unlikely to affect infrastructure located further landward. However, it is likely that stormwater drainage systems would be affected.
The same scenario involving a 100-year ARI event occurring in 2050 is also considered. The details of the storm event are assumed to be the same except that the mean sea level is higher. It is assumed that Bilgola Beach would be approximately 15-m narrower than the present-day accreted state prior to the commencement of the first storm and that Seawall 2A has not yet failed between 2012 and 2050. However, since the toe of Seawall 3 is undermined during events less than the 100-year ARI event, it is assumed that by 2050 this structure has failed and/or been replaced by a more robust structure designed and constructed to conventional coastal engineering standards. As such, Seawall 3 is not considered in this qualitative discussion. It is expected that all of the sand covering the sloping rock seawall seaward of Allen Avenue (Seawall 1) would be removed by erosion. Seawall 1 is likely to incur minor damage with up to 5% of armour stones displaced by wave action. While complete undermining is not expected, the predicted scour level will be approximately equivalent to the toe level. Settlement of rocks within the structure is expected to be further exacerbated by the displacement of rocks in the top armour layer; creating zones of weakness within the wall. The extent of overtopping would not be too dissimilar to the present day scenario. At 21 Bilgola Avenue, the vertical stone and concrete seawall (Seawall 2A) is again expected to fail due to toe undermining. However, in 2050, erosion of the area in its lee would be more extensive leading to partial uncovering of the sloping gabion structure (Seawall 2B). Seawall 2B is unlikely to be at risk of sliding due to wave action and the toe would not be undermined. Up until the point of failure of Seawall 2A, wave overtopping is likely to be unsafe for pedestrians standing landward of its crest, with any infrastructure in close proximity also predicted to incur damage. However, leeward of the crest of Seawall 2B (which is located 15 to 20 m landward of Seawall 2A), wave overtopping would not be unsafe for aware pedestrians standing leeward of the crest.
Finally, the occurrence of a 100-year ARI event in 2100 is discussed. The details of the storm event are again unchanged, except that the mean sea level is higher still. It is assumed that Bilgola Beach would be approximately 35-m narrower than the present-day accreted state and that Seawalls 2A and 3 have failed between 2012 and 2100. As such, Seawalls 2A and 3 are not considered in this qualitative discussion. It is again expected that all of the sand covering the sloping rock seawall seaward of Allen Avenue (Seawall 1) would be removed by erosion. However, in 2100, scour of the sand seaward of the toe would be more extensive leading to undermining. Once the sand level in

Assessment and Decision Frameworks for Seawall Structures
Chapter 2 Assessment of Open Coast Seawalls Appendix E Case Study – Bilgola Beach Page 41
front of Seawall 1 is reduced below the toe level, the rocks in the structure are expected to progressively collapse forward leading to an overall reduction in the crest elevation and general weakening of the structure. Ongoing erosion following partial collapse of Seawall 1 may threaten houses seaward of Allen Avenue (if they are not founded on rock or piles). Up until the point of failure of Seawall 1, damage to the rock armour from direct wave action is expected to be minor, but wave overtopping is likely to be unsafe for pedestrians standing landward but in the vicinity of its crest, with any infrastructure in close proximity also predicted to incur damage. At 21 Bilgola Avenue, while the toe of Seawall 2B would not be undermined, failure may be induced by direct wave impacts and/or wave overtopping. Wave action is likely to induce sliding of the gabion revetment down its 1V:1H batter slope. Seawall 2B is also likely to suffer structural damage to the crest and the grassed and paved area in its lee due to extensive overtopping bores. Ongoing erosion following the failure of Seawall 2B may threaten the house on this property.
2.6 REMEDIAL OPTIONS 2.6.1 Emergency and Short Term
In the event of major erosion of the wall toe or collapse of one of the seawalls, rock (basalt or sandstone) or concrete blocks are recommended as an emergency measure to prevent the seawalls being undermined or to prevent further loss of the infrastructure defended (WorleyParsons, 2012a). The implementation of rock or concrete blocks in an emergency situation would require a degree of advance planning. It is noted that sand-filled geotextile containers (geocontainers) have not been recommended as an emergency protection measure for the Bilgola Beach seawalls. It has been asserted that they are unlikely to be stable as protective works in severe storms, would be difficult to install correctly during an emergency situation and risk puncture on existing rock works such as Seawall 1 and the toe of Seawall 3 (WorleyParsons, 2012a).
2.6.2 Medium and Long-term Structural Options
In the longer term, it is recommended that modifications be made to each of the seawalls prior to their exposure to a storm event which is likely to cause structural failure. This should consider the likely time to failure presented in Table 2.30. The following structural options implying upgrade or replacement of the seawall are considered viable:
• rock or piled toe protection would reduce the risk of undermining failure, but (subject to detailed geotechnical investigation) may not prevent other types of geotechnical failure
• a wave return parapet would reduce the risk associated with wave overtopping during storm events
• a new seawall, comprising deeper toe levels and/or toe protection and higher crest level, subject to detailed design and stakeholder acceptance
• reinforcing the rock wall with additional armour or the vertical walls with a new face and deeper toe
• changing the conditions which cause erosion (installation of offshore breakwater and/or beach nourishment).

Assessment and Decision Frameworks for Seawall Structures
Chapter 2 Assessment of Open Coast Seawalls Appendix E Case Study – Bilgola Beach Page 42
Since Seawall 3 has a high toe level and is located where the active beach zone is most narrow, it has the greatest risk of failure under present-day conditions. It is recommended that a new seawall be constructed to replace this wall. If the front appearance of Seawall 3 is important, the outside face of the wall could be retained or simulated by a replica, with a new seawall (sheet piles or vertical concrete wall) built immediately leeward. Seawall 2A is also at risk of failure from scour for the present day and 2050 planning horizons. Construction of a new seawall here is unnecessary (due to the presence of Seawall 2B), however, the service life of Seawall 2A could be extended with the addition of rock or piled toe protection.
Remediation works for Seawalls 1 and 2B are not necessary until the 2050 and 2100 planning horizons. However, the toe of Seawall 1 could be excavated and additional rock placed below the existing structure to lower its toe to at least -1 m AHD. This could be undertaken when the beach is eroded to minimise earthworks. For Seawall 2B, a wave return parapet could be added leeward of the crest to reduce the risk associated with wave overtopping during a design event. These additional protective works could also have a secondary function as a landscape feature during accreted conditions. Other than the installation of an offshore breakwater and/or beach nourishment, no remedial upgrade options are likely to be practical to mitigate the risk of wave action inducing sliding of the gabion revetment.
2.7 FUTURE MANAGEMENT The coastal protection structures at Bilgola Beach have been assessed as a case study of existing seawalls on an open coast beach. From this review, generic information to inform local government in managing and assessing seawall structures may be derived. It is recommended that the following aspects of existing structures be measured, monitored and recorded to assist in future management of existing open coast seawalls and adjacent beach areas:
• seawall crest level
• seawall toe level
• sand level at the seawall
• slope of seawall (if non-vertical)
• estimated rock dimensions and type (if flexible rubble mound seawall)
• condition of blockwork and mortar (if masonry seawall)
• estimated depth and propagation distance for overtopping bores during a storm
• presence of rock scour protection at the toe, and
• presence of bedrock below seawall toe.
Seawall managers are encouraged to maintain photographic and written records of significant storm events (including an inventory of any damage). Further to this information, if an open coast seawall is to be assessed to the same level of detail as that for the case study at Bilgola Beach, the following information should be collected:

Assessment and Decision Frameworks for Seawall Structures
Chapter 2 Assessment of Open Coast Seawalls Appendix E Case Study – Bilgola Beach Page 43
• any available drawings (conceptual, detailed design, ‘as-built’)
• extent of structure in plan (including outflanking protection)
• extent of structure below the sand level (i.e. test pit excavation, borehole drilling, GPR)
• characteristic sand sample from the beach (mean grain size diameter)
• cross-shore photogrammetry profiles and/or recent beach survey by traditional means
• information regarding human intervention in beach processes (dredging/nourishment)
• nearshore bathymetric data, and
• confirmation of sub-surface structure (multiple rock layers, geotextile underlayer).
However, in practical terms it should be noted that there are no well-known empirical methods for assessing wall stability for existing earth-backed, rigid masonry walls with respect to direct wave impact. A multi-disciplinary approach would be required involving physical modelling, geotechnical engineering and structural engineering to assess such structures.
For an existing flexible rubble mound seawall, it is recommended that a physical modelling program be undertaken to provide a more robust assessment of its stability rather than the use of empirical techniques alone (though these empirical techniques are not unreasonable).
When existing seawalls (such as earth-backed, rigid masonry structures and flexible rubble mound structures) are examined rigorously, significant unknowns are likely to remain, requiring various assumptions to be made. Accordingly, it is unlikely that a professional coastal engineer would issue a certificate declaring the suitability of such a structure (including the four seawalls at Bilgola Beach) to provide adequate protection during a design event, without clarification of these unknowns.
2.8 CONCLUSIONS The assessment of four existing seawalls located along Bilgola Beach was undertaken with regard to storm erosion and inundation hazards. The structures were characterised in terms of the most relevant engineering features based on the consultation of available literature and field investigation reports. Environmental conditions were defined for Bilgola Beach, in particular design wave and water level conditions were established at each structure. High toe levels generally made the structures vulnerable to undermining due to storm erosion. The risk associated with the reduction of sand levels at the toe of the structures is likely to be exacerbated by sea level rise. Wave overtopping considering the safety of people and seawall structural integrity was assessed. Recommendations were provided for remedial options for each seawall, as well as generic advice for the management of open coast seawalls.
Assessment and Decision Frameworks for Seawall Structures
Chapter 3 References Appendix E Case Study – Bilgola Beach Page 44
3. REFERENCES
Australian Standard 4997 (2005), Guidelines for the Design of Maritime Structures, Standards Australia.
Battjes, J A and Groenendijk, H W (2000), Wave Height Distributions on Shallow Foreshores, Coastal Engineering, 40, 161-182.
Bruun P (1962), Sea-level rise as a cause of shore erosion. J. Waterways Harbors Division 88:117–130
Bruun, P (1983), Review of conditions for uses of the Bruun Rule of erosion. Coastal Engineering, 7, 77-89.
Bruun, P (1988), The Bruun Rule of erosion by sea level rise: a discussion on large-scale two- and three-dimensional usages. Journal of Coastal Research, 4, 627–648.
Brown, C T (1979), ‘Gabion Report or Some Factors Affecting the Use of Maccaferri Gabions and Reno-Mattresses for Coastal Revetments’, WRL Research Report 156.
Callaghan, D P, Nielsen, P, Short, A D. and Ranasinghe, R (2008), Statistical Simulation of Wave Climate and Extreme Beach Erosion, Coastal Engineering, 55(5), 375-390.
Carley, J T, Couriel, E D and Cox, D R (1998), ‘Numerical Modelling Sand Nourishment Profiles/Quantities and Beach Erosion due to Storms and Sea Level Rise’, WRL Technical Report 98/04.
Carley, J T and Cox, R J (2003), ‘A Methodology for Utilising Time-Dependent Beach Erosion Models for Design Events’, Proceedings of 16th Australasian Coasts and Ports Conference, Auckland, New Zealand.
Christopher Miller Consultants (2002), Coastal Engineering Investigation: Proposed Alterations and Additions at 13 Allen Avenue, Bilgola, Letter Report to Pittwater Council.
CEM (2006), Coastal Engineering Manual. Coastal Engineering Research Center, Waterways Experiment Station, US Army Corps of Engineer, Vicksburg, USA.
CIRIA; CUR; CETMEF (2007), The Rock Manual. The use of rock in hydraulic engineering (2nd edition). C683, CIRIA, London.
Department of Environment, Climate Change and Water (2009a), Sea Level Rise Policy, NSW Government.
Department of Environment, Climate Change and Water (2009b), Draft Coastal Risk Management Guide: Incorporating Sea Level Rise Benchmarks in Coastal Risk Assessments, NSW Government.
Department of Environment, Climate Change and Water (2010), Coastal Risk Management Guide: Incorporating sea level rise benchmarks in coastal risk assessments, NSW Government.

Assessment and Decision Frameworks for Seawall Structures
Chapter 3 References Appendix E Case Study – Bilgola Beach Page 45
EurOtop (2008), Wave Overtopping of Sea Defences and Related Structures: Assessment Manual, Environmental Agency (UK), Expertise Netwerk Waterkeren (NL), Kuratorium für Forschung im Küsteningenieurwesen (DE).
Foster, D N and Hattersley, R T (1966), Interim Report on the Erosion of Bilgola Beach, WRL Technical Report 1966/02.
Foster, D N (1990), Coastal Engineering Assessment: 11 Allen Avenue, Bilgola Beach, Report No. UT90/1, Unisearch Limited, Tasmania.
Foster, D N, Gordon A D and Lawson, N V (1975), The Storms of May-June 1974, Sydney, NSW, Proceedings of the 2nd Australian Conference on Coastal and Ocean Engineering, Gold Coast, Queensland.
Geomarine (1993a), ‘Re: DA No. 1992/137 21 Bilgola Avenue; Consent No. P39/1, Council ref: PF 050/21 RH:GB/0115D, our ref: 69-063’, Letter to Ms I Hewitt, 31 August.
Geomarine (1993b), ‘Re: DA No. 1992/137 21 Bilgola Avenue; Consent No. P39/1, Council ref: PF 050/21 RH:GB/0115D, our ref: 69-063’, Letter to Ms I Hewitt, 21 September.
Geomarine (1993c), ‘Re: DA No. 1992/137 21 Bilgola Avenue; Consent No. P39/1, Council ref: PF 050/21 RH:GB/0115D, our ref: 69-063’, Letter to Ms I Hewitt, 8 November.
Goda, Y (2007), Reanalysis of Regular and Random Breaking Wave Statistics, 54th Japanese Coastal Engineering Conference.
Gordon, A D (1987), Beach Fluctuations and Shoreline Change: NSW, 8th Australasian Conference on Coastal and Ocean Engineering, pp. 104-108.
Gordon, A D (1989), Sydney’s Sea Defences, Proceedings of the 9th Australasian Conference on Coastal and Ocean Engineering, Adelaide, South Australia.
Gordon, A D and Hoffman, J G (1990), Broken Bay Seabed Information, 1:25,000 Scale Survey Plan No. 82310-575, Prepared by NSW Public Works Department.
IPCC (2007a), Summary for Policymakers. In: Climate Change 2007: The Physical Science Basis. Contribution of Working Group I to the Fourth Assessment Report of the Intergovernmental Panel on Climate Change [Solomon, S., D. Qin, M. Manning, Z. Chen, M. Marquis, K.B. Averyt, M. Tignor and H.L. Miller (eds.)]. Cambridge University Press, Cambridge, United Kingdom and New York, NY, USA.
IPCC (2007b), Climate Change 2007 - The Physical Science Basis. Contribution of Working Group I to the Fourth Assessment Report of the Intergovernmental Panel on Climate Change, (ISBN 978 0521 88009-1 Hardback; 978 0521 70596-7 Paperback), [Solomon, S., D. Qin, M. Manning, Z. Chen, M. Marquis, K.B. Averyt, M. Tignor and H.L. Miller (eds.)]. Cambridge University Press, Cambridge, United Kingdom and New York, NY, USA, 996 pp.
Kriebel, D (1994), Swash Zone Wave Characteristics from Supertank, Proceedings of the 24th International Conference on Coastal Engineering, Kobe, Japan.

Assessment and Decision Frameworks for Seawall Structures
Chapter 3 References Appendix E Case Study – Bilgola Beach Page 46
Larson M and Kraus N C (1989), SBEACH: Numerical Model for Simulating Storm-Induced Beach Change, Report 1: Theory and Model Foundation. Technical Report CERC-89-9, US Army Engineer Waterways Experiment Station, Coastal Engineering Research Center, Vicksburg USA.
Larson M, Kraus N C and Byrnes M R (1990), SBEACH: Numerical Model for Simulating Storm-Induced Beach Change, Report 2: Numerical Formulation and Model Tests. Technical Report CERC-89-9, US Army Engineer Waterways Experiment Station, Coastal Engineering Research Center, Vicksburg USA.
Mariani, A, Blacka, M, Cox, R, Coghlan, I and Carley, J (2009), Wave Overtopping of Coastal Structures, Physical Model Versus Desktop Predictions, Journal of Coastal Research, SI 56 p.534-538.
Mariani, A and Coghlan I R (2012), ‘Remote Sensing Assessment of a Buried Seawall Structure (Bilgola Beach Case Study)’, Appendix A, Seawall Structure Assessment at Bilgola and Clontarf Sydney NSW, WRL Technical Report 2012/13.
McDougal, W G, Kraus, N C and Ajiwibowo, H (1996), ‘The Effects of Seawalls on the Beach: Part II, Numerical Modeling of SUPERTANK Seawall Tests’, Journal of Coastal Research, Volume 12, Number 3, pp. 702-713.
McInnes, K, Abbs, D, O’Farrell, S, Macadam, I, O’Grady, J and Ranasinghe, R (2007). Projected changes in climatological forcing for coastal erosion in NSW, a project undertaken for the Department of Environment and Climate Change NSW, CSIRO Marine and Atmospheric Research, Victoria.
McLean, R and Shen, J-S (2006), ‘From Foreshore to Foredune: Foredune Development Over the Last 30 Years at Moruya Beach, New South Wales, Australia’, Journal of Coastal Research, Volume 22, Number 1, pp. 28-36.
Nielsen, AF and Adamantidis, C A (2007), ‘Defining the Storm Erosion Hazard for Beaches’, Australian Journal of Civil Engineering, Volume 3, Number 1, pp. 39-50.
Nielsen, A F, Lord, D B and Poulos, H G (1992), Dune Stability Considerations for Building Foundations, Australian Civil Engineering Transactions, The Institution of Engineers, Australia, Volume CE34, Number 2, p. 167 – 174.
Patterson Britton and Partners (2005), Coastline Risk Management Report: 21 Bilgola Avenue, Bilgola, Letter Report to Mrs Irene Newport.
Patterson Britton and Partners (2007), Coastal Engineering Assessment: Billies Café at Bilgola Beach, Letter Report to Pittwater Council.
Pilarczyk, K W (1990), Dikes and Revetments: Design, Maintenance and Safety Assessment, AA Balkema, Rotterdam.
Pilarczyk, K W (1998), ‘Coastal Protection’, Proceedings of a Short Course on Coastal Protection, Delft University of Technology, 30 June to 1 July, AA Balkema, Rotterdam.

Assessment and Decision Frameworks for Seawall Structures
Chapter 3 References Appendix E Case Study – Bilgola Beach Page 47
Pittwater Council (2009), ‘Coastline Risk Management Policy for Development in Pittwater’, Appendix 6, Pittwater 21 Development Control Plans.
Public Works Department (1985), Coastal Management Strategy, Warringah Shire, Report to Working Party, PWD Report 85016, June, prepared by Gordon, A D, Hoffman, J G and Kelly, M T for Warringah Shire Council.
Ranasinghe, Roshanka, Phil Watson, Doug Lord, David Hanslow and Peter Cowell (2007), ‘Sea Level Rise, Coastal Recession and the Bruun Rule’, Proceedings of Australasian Coasts and Ports Conference, Melbourne, The Institution of Engineers Australia.
Shand, T D, Goodwin, I D, Mole, M A, Carley, J T, Coghlan, I R, Harley, M D and Peirson, W L (2010), NSW Coastal Inundation Hazard Study: Coastal Storms and Extreme Waves, WRL Technical Report 2010/16.
Shand, T D, Mole, M A, Carley, J T, Peirson, W L and Cox, R J (2011), Coastal Storm Data Analysis: Provision of Extreme Wave Data for Adaptation Planning, WRL Research Report 242.
SMEC (2002), Coastal Engineering Advice: 5 Allen Avenue, Bilgola Beach, Document No. 31226-066.
SPM (1977), Shore Protection Manual, US Army Coastal Engineering Research Center, Vicksburg, Mississippi, USA.
SPM (1984), Shore Protection Manual, US Army Coastal Engineering Research Center, Vicksburg, Mississippi, USA.
Thom, B G and Hall, W (1991), ‘Behaviour of Beach Profiles During Accretion and Erosion Dominated Periods’, Earth Surface Processes and Landforms, Volume 16, pp. 113-127.
Weggel, J R (1988) Seawalls: The Need for Research, Dimensional Considerations and a Suggested Classification In The Effects of Seawalls on the Beach, N C Kraus and O H Pilkey (Volume Editors), Journal of Coastal Research, SI 4: 29-40.
Western Australian Planning Commission (2003), ‘Statement Of Planning Policy No. 2.6 State Coastal Planning Policy Prepared Under Section 5aa Of The Town Planning And Development Act 1928’, Government of Western Australia.
WorleyParsons (2012a), Coastal Erosion Emergency Action Subplan for Bilgola Beach (Bilgola) and Basin beach (Mona Vale): Reference Document, Report prepared for Pittwater Council.
WorleyParsons (in prep. 2012b), Coastline Hazard Definition and Climate Change Vulnerability Study for Pittwater Council.


Sydney Coastal Councils Group Inc.
councils caring for the coastal environment
Level 14, Town Hall House
456 Kent Street
GPO Box 1591
SYDNEY NSW 2001
t: +61 2 9246 7326
f: +61 2 9265 9660
w: www.sydneycoastalcouncils.com.au.com.au