Embed Size (px)
Citation preview
Assessing the Telecom Regulatory & Policy
Environment in Bangladesh and 6 other
Emerging Asian Economies
Dhaka, May 2011Dhaka, May 2011
Helani Galpaya ([email protected])
Faheem Hussain ([email protected])
This work was carried out with the aid of a grant from the International Development
Research Centre, Canada and the Department for International Development, UK.
How to assess the regulatory &
policy environmentHelani GalpayaHelani Galpaya

Factors impacting performance of the ICT
sector in a country
• Global factors– E.g. Global recession
• Country-level macro factors– political (in) stability, exchange rates etc.
• Market factors– actions of competitors, availability of substitutable products, cost of – actions of competitors, availability of substitutable products, cost of
capital to firm
• Regulatory factors: risks emanating from government, including but not limited to actions (or inactions) of the regulator
• All these impact investment– Investment � sector performance
• Need to understand, quantify and lower
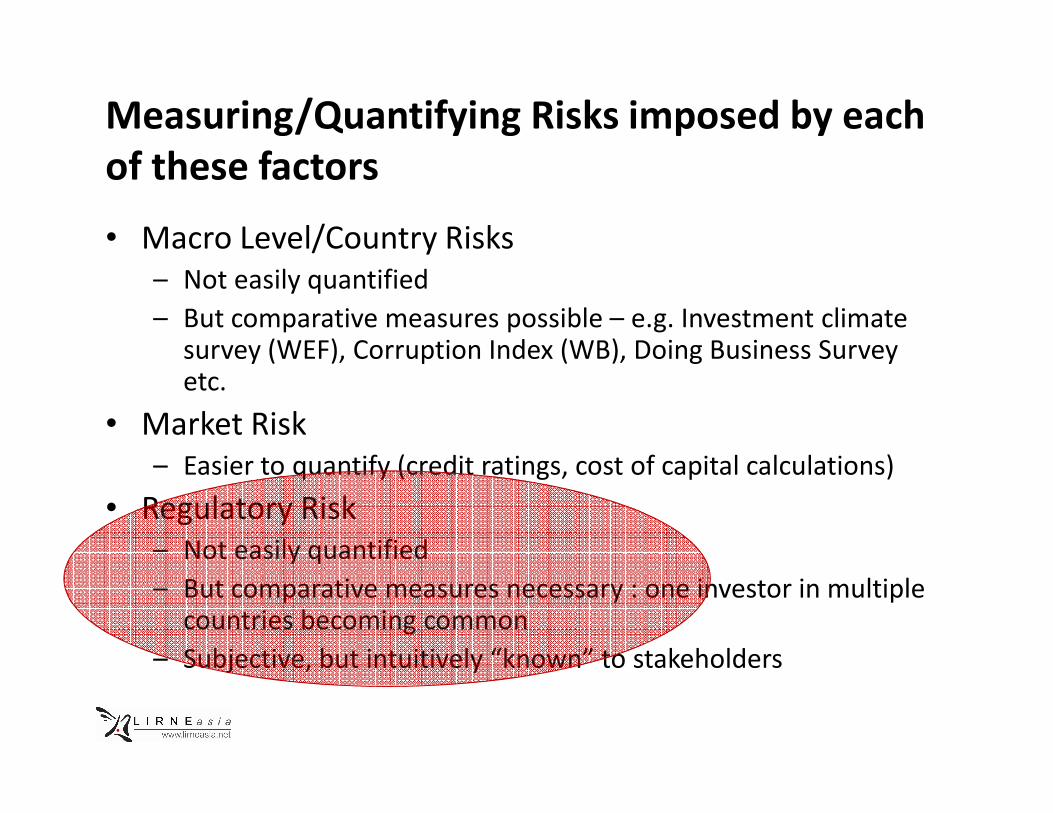
Measuring/Quantifying Risks imposed by each
of these factors
• Macro Level/Country Risks
– Not easily quantified
– But comparative measures possible – e.g. Investment climate survey (WEF), Corruption Index (WB), Doing Business Survey etc.
• Market Risk• Market Risk
– Easier to quantify (credit ratings, cost of capital calculations)
• Regulatory Risk
– Not easily quantified
– But comparative measures necessary : one investor in multiple countries becoming common
– Subjective, but intuitively “known” to stakeholders
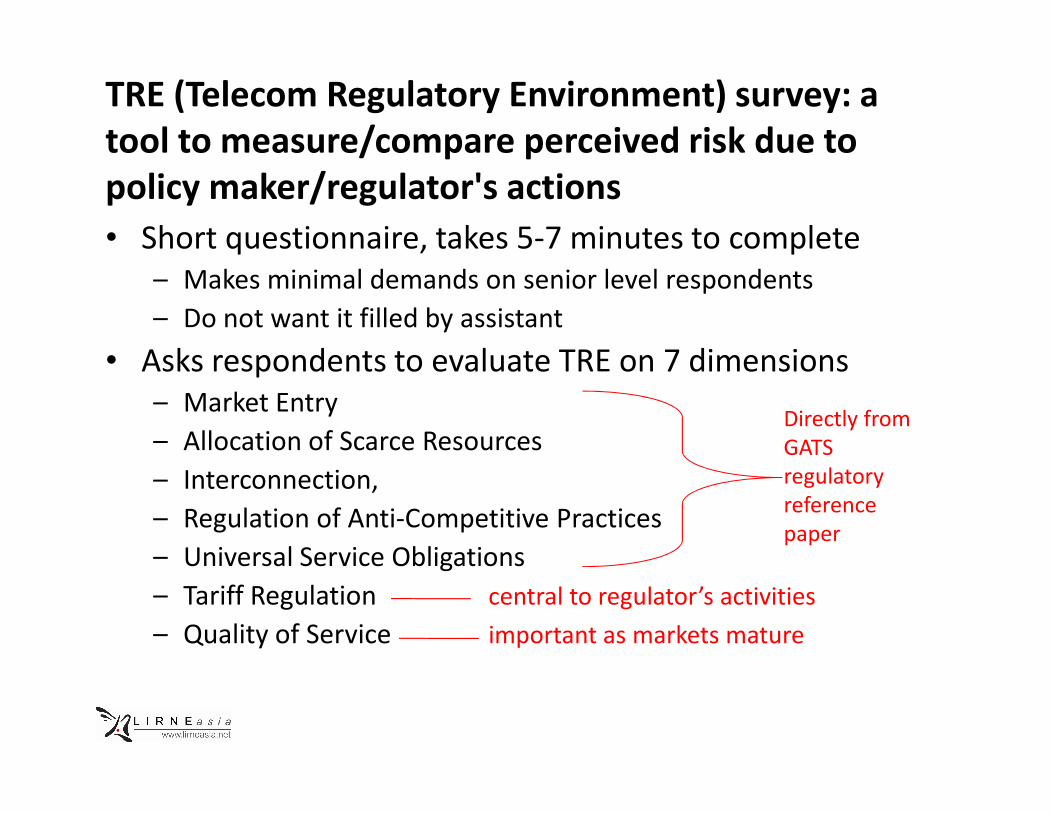
TRE (Telecom Regulatory Environment) survey: a
tool to measure/compare perceived risk due to
policy maker/regulator's actions
• Short questionnaire, takes 5-7 minutes to complete
– Makes minimal demands on senior level respondents
– Do not want it filled by assistant
• Asks respondents to evaluate TRE on 7 dimensions
– Market EntryDirectly from
– Market Entry
– Allocation of Scarce Resources
– Interconnection,
– Regulation of Anti-Competitive Practices
– Universal Service Obligations
– Tariff Regulation central to regulator’s activities
– Quality of Service important as markets mature
Directly from
GATS
regulatory
reference
paper

• Each dimension evaluated on Likert Scale of 1 to 5– Minimum 1 = highly ineffective
– Maximum 5 = highly effective
• Average/acceptable performance = score of 3 (mid-point between 1 and 5)
• 3 (sub) sectors evaluated separately• 3 (sub) sectors evaluated separately– Fixed
– Mobile
– Broadband
• List of “significant regulatory and policy events” in relevant period sent to each respondent, to refresh memory

3 Respondent categories. Weights to ensure
even contribution to final score
• Respondents fall into 3 categories: – Category 1: those directly involved in the sector such as
operators, equipment vendors
– Category 2: those indirectly impacted by the sector or those studying/observing the sector with broader interest such as consultants and lawyers
– Category 3: those who represent the broader public interest such as media personnel, other government officials, retired regulators, civil society organizations
• Each category equally important. – But hard to predict number of completed survey responses
– Use weights to equalize each category’s contribution to final score

7 countries studied in 2011 (to evaluate sector
performance in 2010)
• South Asia:
– Bangladesh
– India
– Pakistan
– Sri Lanka
• South East Asia
– Philippines
– Thailand
– Indonesia

Plan for the rest of the afternoon
• Bangladesh ICT Sector Performance and TRE survey
results
– Faheem Hussain
• Benchmarking BD against other countries•
– Helani Galpaya
• Question and Answers, Discussion
– Faheem Hussain
– Helani Galpaya
– Rohan Samarajiva
ICT Sector Performance Review of
BangladeshFaheem HussainFaheem Hussain
ICT Sector Performance Review of
Bangladesh
Faheem Hussain, Ph.D.
This work was carried out with the aid of a grant from the International Development
Research Centre, Canada and the Department for International Development, UK.

Country Overview
• Bangladesh’s functional literacy rate is approximately
48% (BANBEIS, 2011)
• It is the 47th largest economy in the world with a per
capita income of US$ 1,700 (IMF, 2010)
• Population: 158,570,535 (estimated) • Population: 158,570,535 (estimated)
• There are around 70 million active access paths of
telecommunications
– Mobile SIM and PSTN penetration of 43% and 1% respectively
• Around 6 million Internet subscriber (4% penetration)
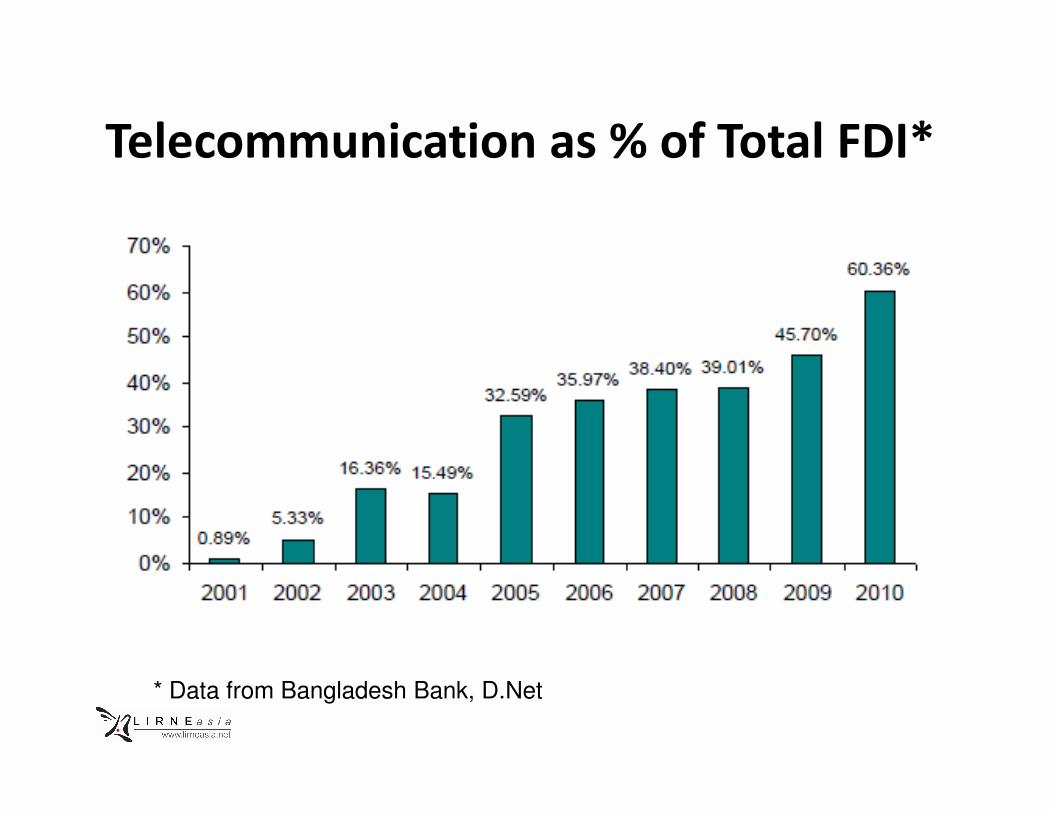
Telecommunication as % of Total FDI*
* Data from Bangladesh Bank, D.Net

Growth of SIMs/Access Paths
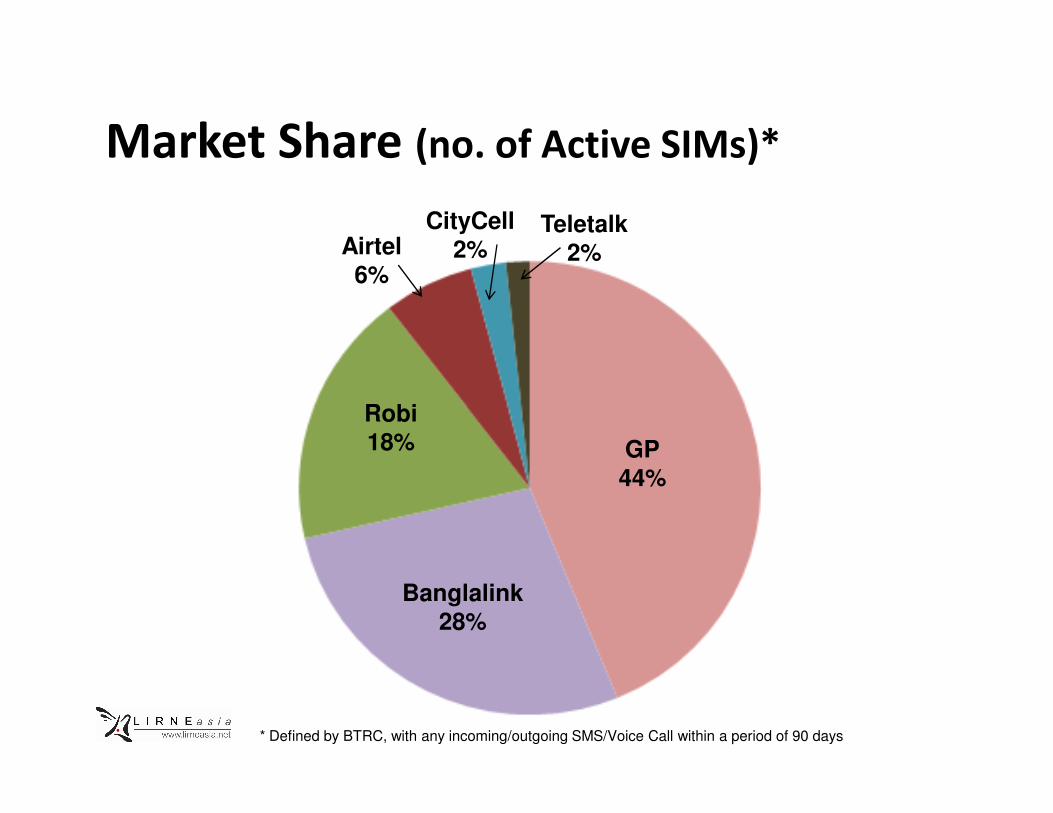
Market Share (no. of Active SIMs)*
CityCell
2%Teletalk
2%Airtel
6%
Robi
GP
44%
Banglalink
28%
Robi18%
* Defined by BTRC, with any incoming/outgoing SMS/Voice Call within a period of 90 days
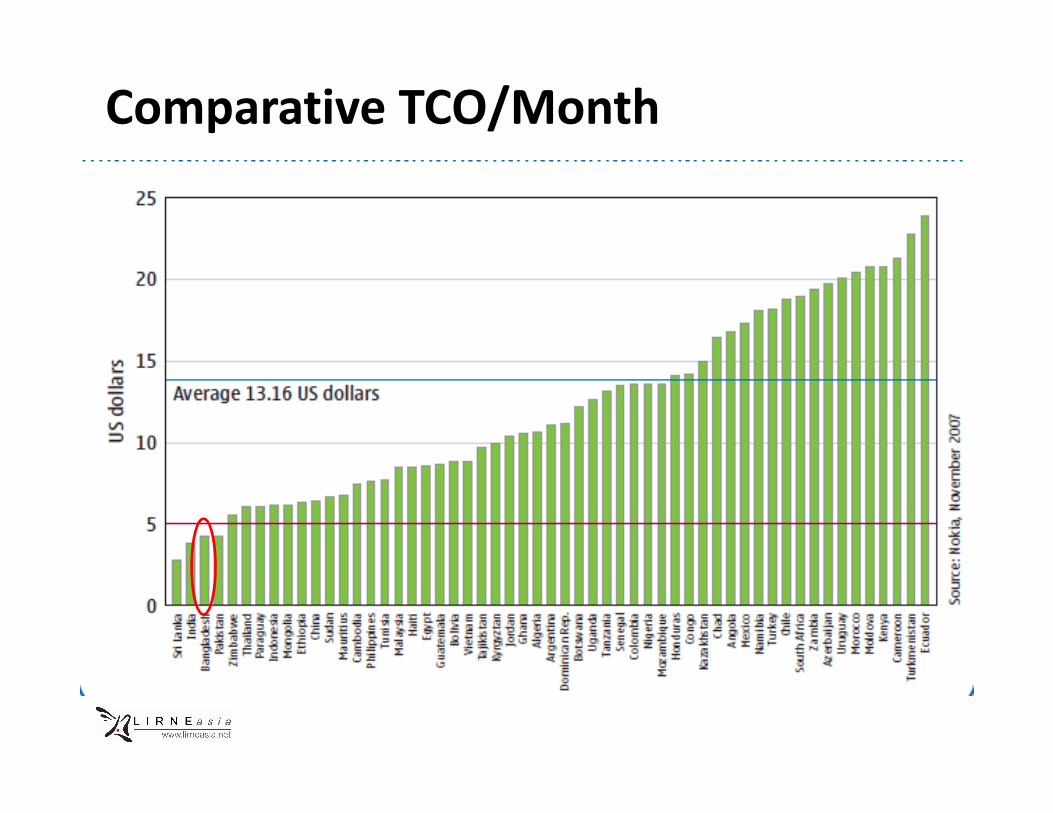
Comparative TCO/Month

Monthly Post-Paid Mobile Cost (US$ PPP)*
* Mobile Benchmarks, LIRNEasia, February, 2010

Monthly Pre-Paid Mobile Cost (US$ PPP)*
* Mobile Benchmarks, LIRNEasia, February, 2010

Internet Subscribers in Bangladesh (based on access mode)
Fixed Internet6%
Mobile Internet
94%

New Layers of Gateways/Exchanges

Policies, Regulations, Acts
• The Telegraphy Act of 1885
• The Wireless Telegraphy Act of 1933
• The National Telecommunication Policy of 1998
• Bangladesh Telecommunications Act of 2001 (and • Bangladesh Telecommunications Act of 2001 (and
the amendment in 2010)
• The National ICT Policy of 2002
• International long Distance Telecommunication
Services (ILDTS) Policy 2007 and 2010
Policies, Regulations, Acts
• International Long Distance Telecommunication
Services (ILDTS) Policy, 2007/2010:
– Changed the course of full liberalization
– Government controlling the market entry
– Inefficient layers of gateways/exchanges

Policies, Regulations, Acts
• Telecommunication Act (amended), 2010
– Ministry now has full control
– Delay in the “time sensitive” decision making process
– Provisions for heavy fines and punishment
– BTRC now just recommends (no independence)

Survey
Response Category No. of
Respondents
Weight
assigned
1 – operators, equipment makers etc. 17 0.76
2 – observers, lawyers, consultants 7 1.852 – observers, lawyers, consultants
etc.
7 1.85
3 – stakeholders representing
consumer interest
15 0.87
Total 39
25 (or 64%) of the respondents participated in the survey online,
18% through email and 18% via face-to-face interview.
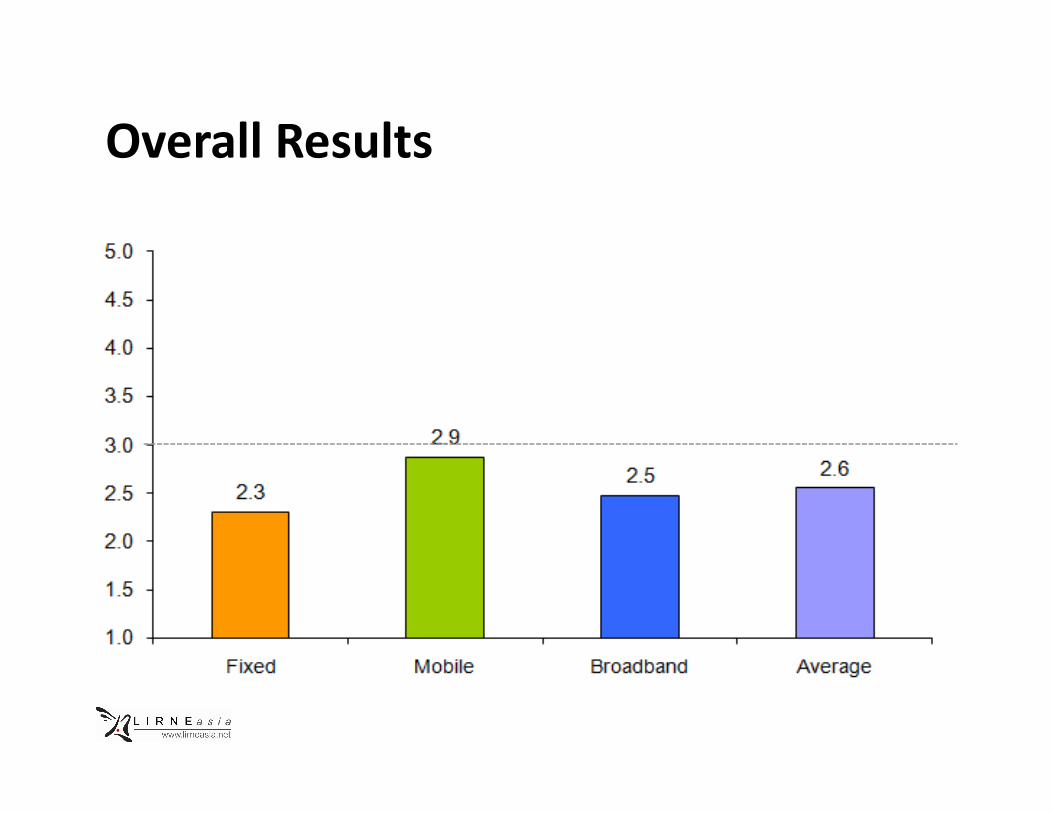
Overall Results
Results
• The license cancellation of five PSTN operators and nationwide decline in fixed line usage contributed to lowest scores for fixed sector
• Regulator’s facilitation for competition, low access price for the users, nationwide coverage and interconnection, usage the users, nationwide coverage and interconnection, usage flexibility, and better QoS are some of the key reasons for mobile industry to top the list
• Mobile’s score to be just below 3 can be from the sense of uncertainty created by the amended Telecommunication Act, 2010 and for the proposed 2G license renewal guidelines

Scores by Regulatory Dimension
2.72.5
3.1
2.7
2.3 2.42.5
3.0
3.5
4.0
4.5
5.0
2.52.3 2.2
2.4
1.0
1.5
2.0
2.5
Mar
ket E
ntry
Acces
s to
Res
ourc
es
Inte
rcon
nect
ion
Tariff R
egula
tion
Anti-C
omp. P
ract
ices
USO
QoS
Results
• Interconnection received the highest average score of 3.1. It is a positive shift from the time when it was very costly, time consuming, and sometime impossible
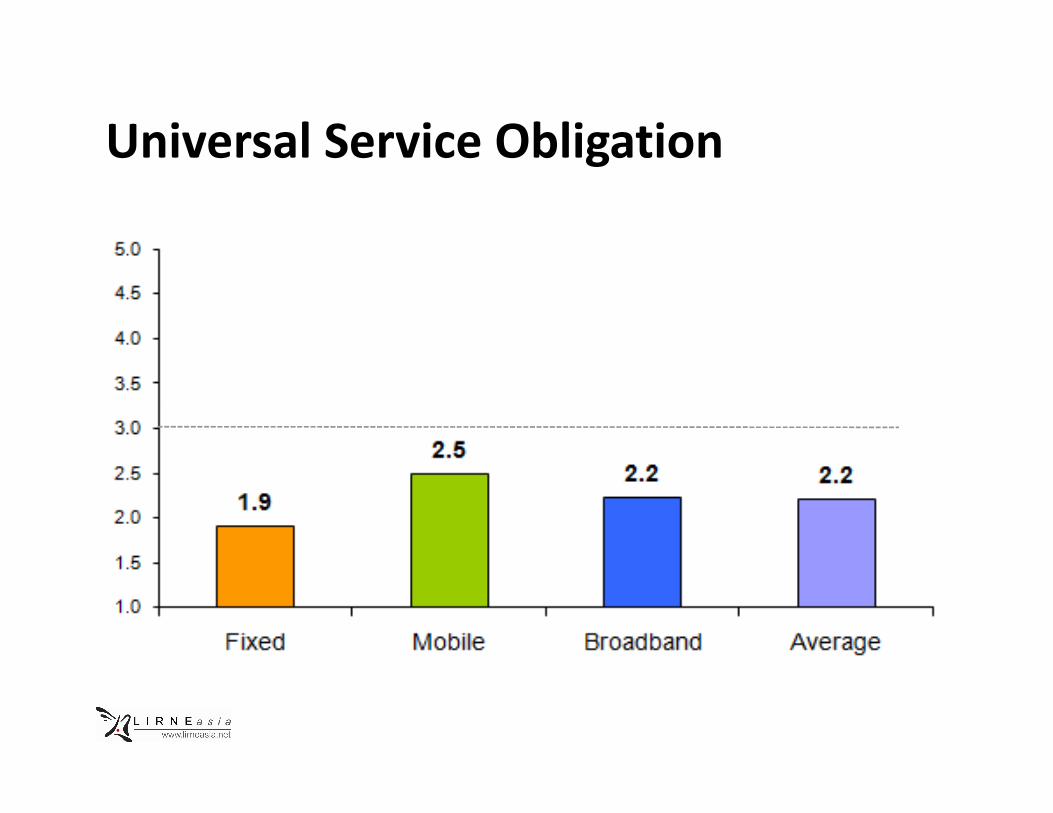
• USO received the lowest average score (2.2). As the mobile phone service is available all over the country, mobile phone service is available all over the country, many experts and stakeholders feel that the creation of USF is not required
• There is no clear roadmap from the regulators on how the USO will function or how the money from the SOF will be disbursed among the service providers

Market Entry

Market Entry
• PSTN: Failure to grow, cancellation of 5 PSTN licenses
• Broadband: Restricted WiMax Licensing
• Mobile: Uncertainties with 2G License Renewal
processprocess
– License and spectrum renewal fees are tied up
– Exorbitant price of spectrum
– Investors are doubtful
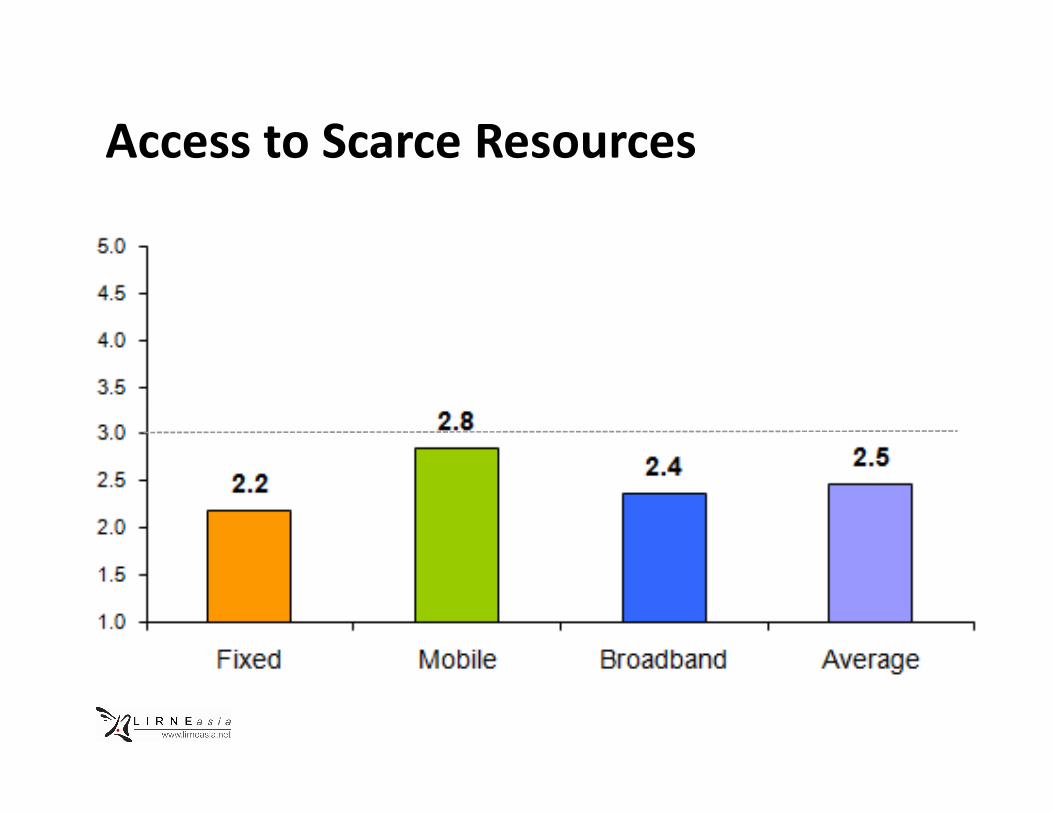
Access to Scarce Resources
Access to Scarce Resources
• PSTN:
– No recent allocation for WLL spectrum
• Broadband:
– BTCL is controlling the access to fiber – BTCL is controlling the access to fiber
– High cost of transitioning to NTTN infrastructure
• Mobile:
– Putting towers, base stations, resource sharing are
relatively easy
– Spill over from the issues related to Market Entry
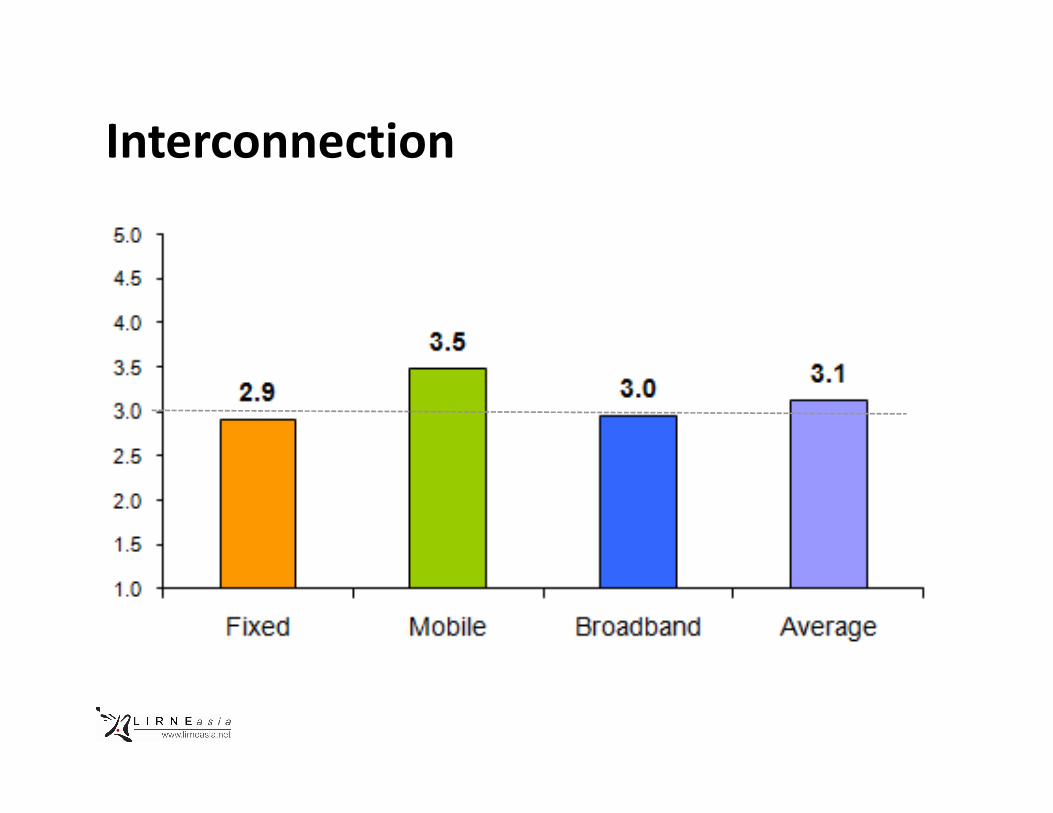
Interconnection
Interconnection
• Voice Service:
– The ability for any subscriber to call anywhere without any
significant connection or cost issue at present is a great
improvement
– BTRC explicitly introduced the definitions and provisions – BTRC explicitly introduced the definitions and provisions
on interconnection
• Internet Service Providers:
– The presence of national internet exchange (NIX) meant
higher internal traffic in lower cost, which was not the case
before

Tariff Regulation

Tariff Regulation
• Mobile:
– As retail prices are low, it’s good for the consumers and people from academia, research organizations, journalists, civil society organizations gave high scores
– But high competition and low profit margin in the service – But high competition and low profit margin in the service industry caused low scores from the other categories’ respondents
– The Ministry is now in charge of tariff regulation, it is a time consuming process and can cause unexpected delays in a competitive market where one needs to act quickly to ensure a market edge

Tariff Regulation
• Broadband:
– The absence of any active intervention to regulate the
tariff
– Many community-based “broadband” entrepreneurs offer
packages at very low price, but cannot maintain the packages at very low price, but cannot maintain the
minimum level of service
– People have also complained about not getting the desired
broadband speed even after paying the premium

Anti-Competitive Practices

Anti-Competitive Practices
• Till now, there are no concrete guidelines to prevent
monopolistic or anti-competitive practices
• The regulator also did not mention or clarify how any
service provider can be classified as a monopoly in
any given market under its jurisdiction, and in which
ways consumers and other market players can be
protected if such practices occur
Anti-Competitive Practices
• The mobile service stakeholders are dissatisfied with the amount of money GoB is proposing for the 2G license renewal and spectrum allocation, as the other operators (who are not scheduled to renew their licenses anytime soon) got access to similar their licenses anytime soon) got access to similar resources at much cheaper rates
• Service providers’ access to the nationwide fiber network of certain incumbents are still facing non-tariff barriers, such as long waiting queue and unregulated sharing price for infrastructure usage

Anti-Competitive Practices
• There is no specific guideline from the regulators on
how the mobile operators (client and developers of
VAS) and independent VAS providers should
cooperate and function
• License cancellation of five PSTN operators was on
the ground of illegal VoIP. The leading mobile service
providers got hefty fines for the same offence but
their licenses were not revoked

Anti-Competitive Practices
• Broadband service providers are not allowed to
directly deal with the competitive international
carriers
• This provision is hindering the possibilities of direct and
efficient negotiation with the international entities, which efficient negotiation with the international entities, which
could be converted into cheaper broadband services
Universal Service Obligation

Universal Service Obligation
• BTRC is yet to clarify how it’s planning to disburse
and use the USF/SOF
• GoB or the regulator has also not decided on how to
define “urban” and “rural” areas for voice and
internet services
• The absence of guidelines and the question towards
its relevance resulted in the lowest scores from every
sector analyzed

Quality of Service
Quality of Service
• The absence of clear directives to ensure quality voice and data services for the mass
• The mobile providers are proactive to make sure a good level of services, mostly because of the extreme competitioncompetition
• In PSTN, the QoS situation became worse after the 5 private licenses were revoked, without any buffer time for customer transition• There were no directives issued on providing alternative
telecommunication service for the affected users
Quality of Service
• Lowest in Broadband
• The small service providers usually get small amount
of leased or sub-leased bandwidth and tend to serve
beyond capacity
• There is a considerable dissatisfaction about the
broadband service as a whole
• Due to the nationwide power shortage, even the key
broadband service providers are unable to maintain
uninterrupted and high speed internet connection
for their users

Quality of Service
• ISPs can comfortably expand their user base during
summer time without increasing their bandwidth
capacity
• Lack of electricity means hardly many people can access
the broadband internetthe broadband internet
• The low quality overhead cable, vulnerable to the
adverse weather and frequent disconnections, pose
major hindrances towards ensuring good QoS for
broadband
Recommendations
• Rethinking 2G License Renewal Process (& beyond)
• Should be determined through active consultation, and
can be either:
• market determined (based on auction) or
• a hybrid of auction and reserved price set by BTRC• a hybrid of auction and reserved price set by BTRC
• GoB should initiate the 3G licensing and spectrum
allocation in Bangladesh as soon as possible

Recommendations
• Need of an “Independent” regulator
• Clear demarcation of responsibilities, effective
coordination between MoPT and BTRC
• Making the present Tariff Regulations process faster
• Acting against the Anti-Competitive Practices
• Clear directives to define and prevent monopolistic
practices
• Active implementations of guidelines to prevent non-tariff
barriers for the market entrants in voice, internet, and VAS
sectors

Recommendations
• QoS guidelines need to be introduced alongside
addressing the major structural bottlenecks
• Streamlining the Pro-People Provisions to policy • Streamlining the Pro-People Provisions to policy
documents instead of regulatory ones
• Spectrum Trading, Number Portability, QoS Obligations,
Common platform for VAS providers, Emergency Toll free
numbers, Green Telecom practices
Putting things in perspective:
Benchmarking against other
countries, and identifying best/worst
practicesHelani GalpayaHelani Galpaya

3.13.0
3.5
3.9
3.0
3.3
3.1
3.6
3.13.33.5
4.0
4.5
5.0Market Entry
1. Market Entry: PK leads with clear (yet expensive)
licensing conditions. TH low scores in mobile due to
confusions in new policy
PK: highest
scoresTH:
lowest
in
BD
lowest
in
2.4
2.9
2.6 2.62.8
2.5
3.0
2.5
3.0
2.3
2.8
3.1
2.8
2.5
3.1
1.0
1.5
2.0
2.5
3.0
Bangladesh India Pakistan Sri Lanka Indonesia The Philippines Thailand
Fixed Mobile Broadband
in
mobilein
fixed

PK (top performer): Expensive but transparent
licensing conditions give certainty; no restrictions on
foreign ownership• Clear rules: payment of fee guarantees license renewal
– Even though very expensive @ USD 291 MM, price at least based on auction value
– No uncertainty for operator
• Unbundled licensing for fixed– investors can enter, offer services in area of their choice– investors can enter, offer services in area of their choice
• MNP since 2007 – even smaller (new entrants) have a fighting chance at capturing
market share
• No limitations to foreign ownership, M&A activity– USD 374 million FDI in 2009-2010; accounts for 17% of Pakistan's FDI
• Anti-competitive behavior checked/regulated (more later)
• Result: 64% SIM penetration

TH (lowest mobile sector scores): confusion
caused by new policy
• New Telecom and Broadcasting Act of 2010– Merge National Telecommunications Commission and National
Broadcasting Commission
– Article 46 prohibits licensee from renting out all or parts of its spectrum to others to provide mobile services
– Consequence: TOT delaying signing bids with winners of 3G – Consequence: TOT delaying signing bids with winners of 3G expansion project
• E.g. Worried its MVNO operation not in compliance
• Type 2 (network based services for corporate customers) licensees– Providing commercial services to the public
– Abusing license fees and lower USO fee enjoyed by Type 2 licensees

3.33.5
4.0
4.5
5.0
Allocation of Scarce Resources
2. Allocation of Scarce Resources: PK fast response
gives certainty. IN mobile scores due to 3G and 2G
spectrum issues. BD lowest in fixed
PK: Best in
all sub-
sectorsBD:
lowest
IN:
lowest
in
2.2
3.03.2
2.4 2.42.5
2.82.8
2.2
3.2
2.4
2.8 2.7
2.42.4
2.7
3.3
2.42.3
2.5
3.0
1.0
1.5
2.0
2.5
3.0
3.5
Bangladesh India Pakistan Sri Lanka Indonesia The Philippines Thailand
Fixed Mobile Broadband
lowest
in
fixed
in
mobile

IN (lowest score in mobile): scandals of 2G spectrum
allocation. LK (low overall scores): infrastructure
bottlenecks
• India:
– controversies over 2G renewals
• no auction
• arbitrary pricing of 1651 crores
• corruption scandal
– Delayed 3G spectrum allocation (first ever auction)– Delayed 3G spectrum allocation (first ever auction)
– Spectrum overloading by GSM operators
• Average amount of frequency per operator low: World average 17.18 MHz; India 6.2MHz
• Sri Lanka
– International landing station a major bottleneck
– Incumbent fiber not shared on regulated (cost-based) basis
• PK acts fast. New I-ME-WE cable in 2010
3.1
3.43.5
3.2
3.7
3.1 3.0
3.43.5
4.0
4.5
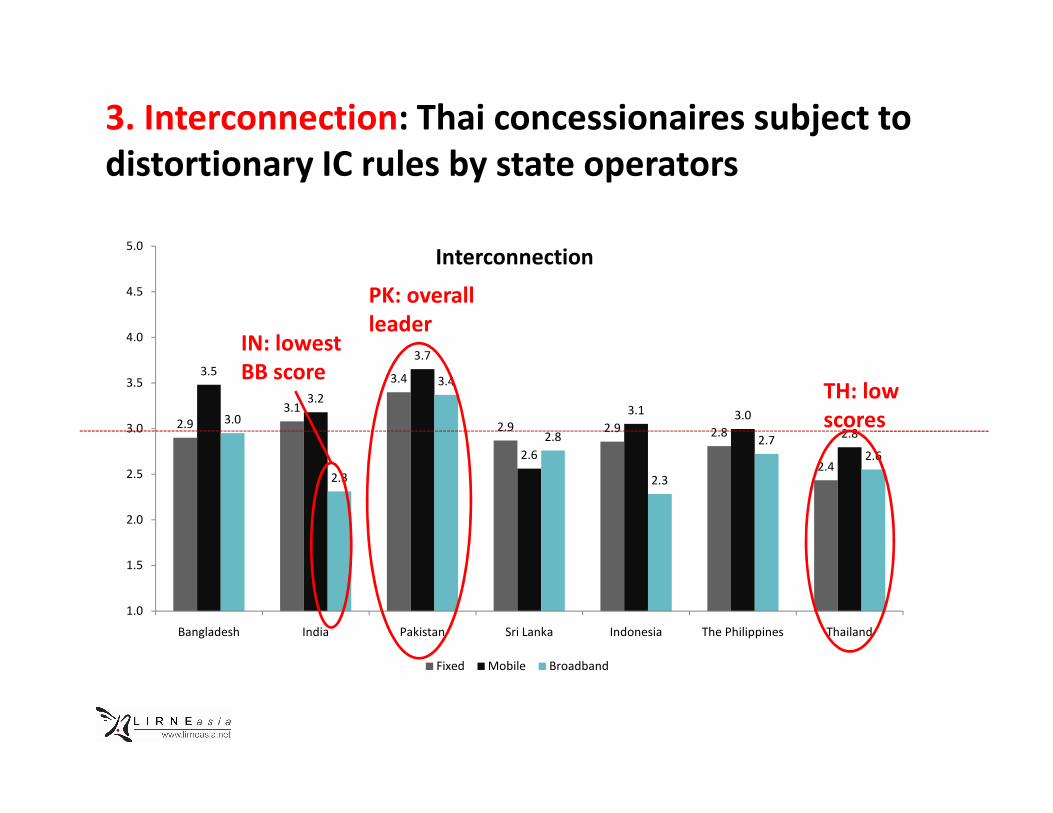
5.0Interconnection
3. Interconnection: Thai concessionaires subject to
distortionary IC rules by state operators
PK: overall
leader
TH: low
scores
IN: lowest
BB score
2.9
3.1
2.9 2.9 2.8
2.42.6
3.1 3.0
2.83.0
2.3
2.8
2.3
2.7
2.6
1.0
1.5
2.0
2.5
3.0
Bangladesh India Pakistan Sri Lanka Indonesia The Philippines Thailand
Fixed Mobile Broadband
scores

Thailand (poor performer): concession regime stacks
the cards against non-state-sector operators
• Only two license holders (TOT & CAT)
• Private operators mere contractors
• Private concessionaires legally owned by two state operators
• All interconnection negotiated via TOT/CAT
• E.g. CATs concessionaires (DTAC, True Move) pay TOT…• E.g. CATs concessionaires (DTAC, True Move) pay TOT…
– flat fee of THB 200 (USD 6.6)/moth per post-paid SIM
– 18% of revenue per pre-paid SIM
– But TOTs concessionaire (AIS) doesn’t have to pay TOT
• Concessionaires refuse to pay TOT since 2006
• Settled in 2007 at rate deemed too high (1 baht per min)
• Only in 2010 regulated to be at 50 satang for all parties

India (lowest BB score): ineffective use of
internet exchanges
• Internet traffic experience bottleneck with local
peering
• Despite neutral internet exchange (NIXI) in India
• Only 36 of 167 ISPs connected to NIXI• Only 36 of 167 ISPs connected to NIXI

3.4
3.1
3.8
3.3
3.1
3.5
4.0
4.5
5.0Tariff Regulation
4. Tariff Regulation: India has some of the lowest
tariffs in the world. Regulator does not regulate
(most) prices
IN: best
performer
BD: low
performer
2.7
3.1
2.92.7 2.7
2.4
2.9 2.82.9
2.8 2.7
2.5
2.9
3.1
2.9
2.2
2.5
2.7
1.0
1.5
2.0
2.5
3.0
Bangladesh India Pakistan Sri Lanka Indonesia The Philippines Thailand
Fixed Mobile Broadband
performer

3.1 3.0
3.6
2.9 2.9
3.2
3.0
3.5
4.0
4.5
5.0Universal Service Obligation
5. Universal Service Obligations: PK collects 1.75%
but has already allocated and seeing results. IN still
sits on large undisbursed USF (USD 4.2 billion +)
BD: poor
PK: best
performer
1.9
2.2
2.7
2.52.4
2.5
2.2
2.9
2.5 2.5
2.9
2.2
1.9
2.7
2.2 2.2
2.6
1.0
1.5
2.0
2.5
3.0
Bangladesh India Pakistan Sri Lanka Indonesia The Philippines Thailand
Fixed Mobile Broadband
BD: poor
performerIN: lowest
performer

PK (best performer): USF decisions made by private
sector and government, effective disbursement
• USF board consists of private sector operators as well
as government
– Practical decisions based on real market needs
• High disbursement rate•
– Compared to India which has nearly USD 5 Billion unspent
• Clear definition of which technologies included, and
where funds can go
– E.g. fiber backbone recently installed, PKR 4.5 billion
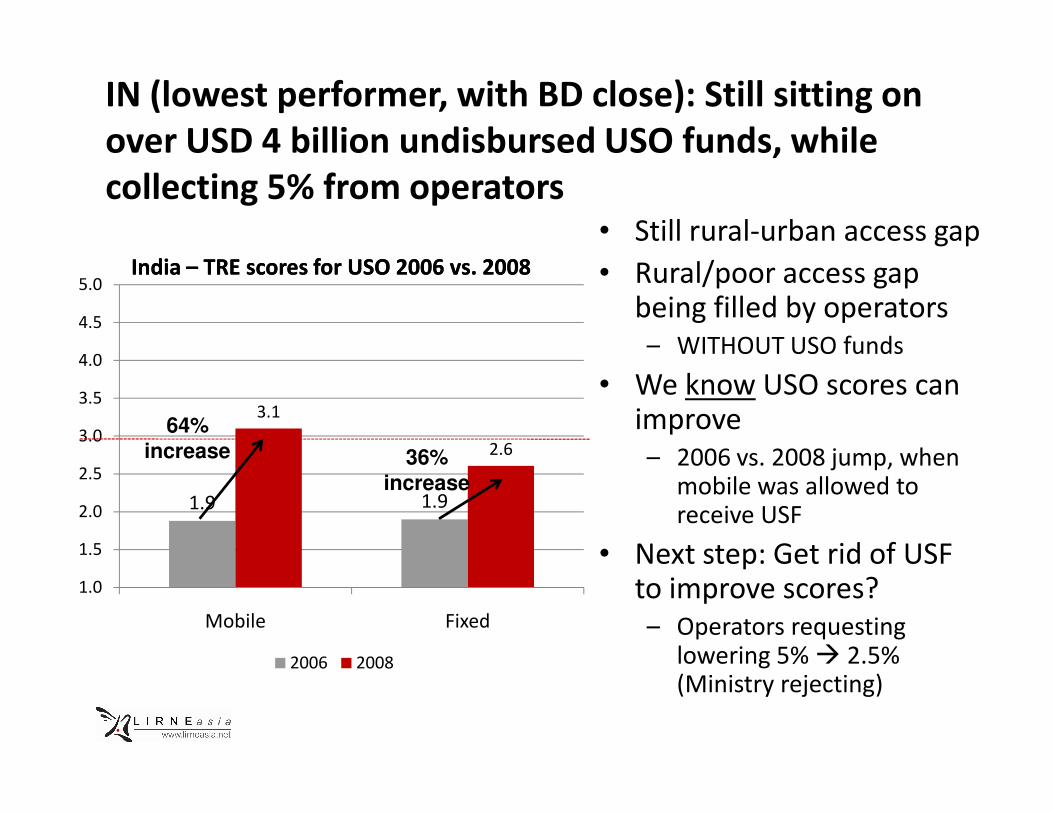
IN (lowest performer, with BD close): Still sitting on
over USD 4 billion undisbursed USO funds, while
collecting 5% from operators• Still rural-urban access gap
• Rural/poor access gap being filled by operators– WITHOUT USO funds
• We know USO scores can improve3.1
3.5
4.0
4.5
5.0India – TRE scores for USO 2006 vs. 2008India – TRE scores for USO 2006 vs. 2008
improve– 2006 vs. 2008 jump, when
mobile was allowed to receive USF
• Next step: Get rid of USF to improve scores? – Operators requesting
lowering 5% � 2.5% (Ministry rejecting)
1.9 1.9
3.1
2.6
1.0
1.5
2.0
2.5
3.0
3.5
Mobile Fixed
2006 2008
64%
increase 36%
increase

ID (still low performer): Current USO scheme
another step in a line of failed policies.
• Initially: Force incumbent to invest 20% of revenues in rural connectivity– Order not followed by incumbent
• Then: government funds to set up telephone units in ~ 3000 villages using satellite connectivity– Only contribute towards achieving 15% of universal service targets– Only contribute towards achieving 15% of universal service targets
• …etc…
• Then: operators changed 0.75% of revenues– Collected funds undisbursed (cancelled and halted tenders)
– Low penetration: 6.5 (fixed) and 35 (mobile) phones per 100 people.
• Now: rate increased from 0.75% � 1.25
• USD 1.254 million collected, mostly undisbursed– Despite new ICT Institute established

6. Anti-competitive Practices: PK actively monitoring
and taking action to promote competition
3.03.13.1
3.6
3.23.5
4.0
4.5
5.0Regulation of anti-competitive practices
LK: Worst
performer
PK: best
performer
2.0
3.0
2.2
2.52.4
2.62.6
3.1
2.2
2.62.5
2.6
2.42.2
2.62.6
2.4
2.7
1.0
1.5
2.0
2.5
3.0
Bangladesh India Pakistan Sri Lanka Indonesia The Philippines Thailand
Fixed Mobile Broadband
performer

Pakistan (best performer): actively regulates market
with the view of promoting competition
• Action against China Mobile PK Ltd
– Advertising “World’s cheapest call”
– Not mentioning rate is for 30 seconds, not 1 minute
• Approval of cross border mergers
– Acquisition of Wind Telecom by Vimplecom Ltd– Acquisition of Wind Telecom by Vimplecom Ltd
– No Objection Certification issued
• Action against Wateen Telecom and Defense Housing Authority
– Against entering into agreement that would have limited competition in relevant market.

Sri Lanka (worst performer): advantages of
incumbent not investigated/stopped
• Cable landing station: tariff and non-tariff barriers
– Operators forced to use incumbents expensive fiber to
connect to landing station
– “delays” when operators want to increase/purchase more
capacitycapacity
• Possible cross subsidization between fixed and
mobile arms of incumbent
– Mobile loosing money thanks to populist package
“promoted” by government

6. QoS: Budget telecom networks give poor quality
in the region and many choke points in in networks.
3.1
3.4
3.02.9
3.5
3.2
3.5
4.0
4.5
5.0Quality of Service
2.2
2.7
2.5
2.7
3.02.92.8
2.7 2.7 2.7 2.8
2.1
2.5 2.5
2.1
2.3
2.6
1.0
1.5
2.0
2.5
3.0
Bangladesh India Pakistan Sri Lanka Indonesia The Philippines Thailand
Fixed Mobile Broadband
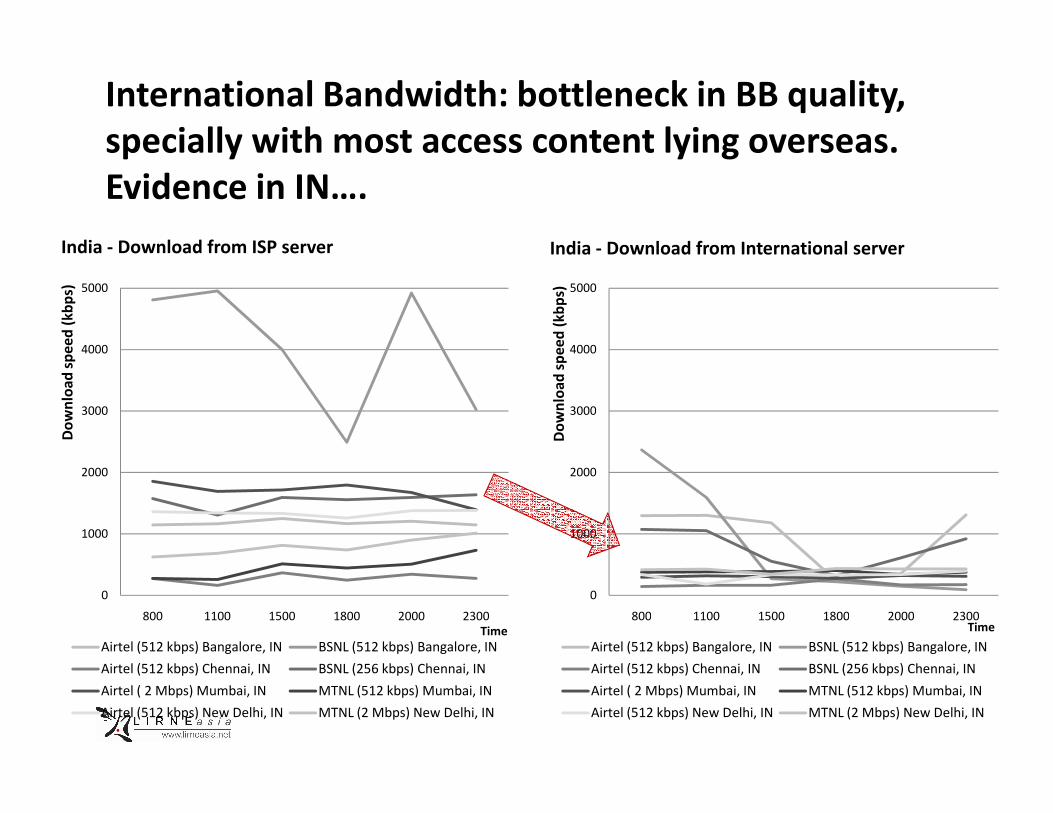
International Bandwidth: bottleneck in BB quality,
specially with most access content lying overseas.
Evidence in IN….
3000
4000
5000
Do
wn
loa
d s
pe
ed
(k
bp
s)
India - Download from ISP server
3000
4000
5000
Do
wn
loa
d s
pe
ed
(k
bp
s)
India - Download from International server
0
1000
2000
3000
800 1100 1500 1800 2000 2300
Do
wn
loa
d s
pe
ed
(k
bp
s)
Time
Airtel (512 kbps) Bangalore, IN BSNL (512 kbps) Bangalore, IN
Airtel (512 kbps) Chennai, IN BSNL (256 kbps) Chennai, IN
Airtel ( 2 Mbps) Mumbai, IN MTNL (512 kbps) Mumbai, IN
Airtel (512 kbps) New Delhi, IN MTNL (2 Mbps) New Delhi, IN

…and Sri Lanka
3000
3500
4000
4500
5000
Do
wn
loa
d s
pe
ed
(k
bp
s)
Sri Lanka - Download from ISP server
3000
3500
4000
4500
5000
Do
wn
loa
d s
pe
ed
(k
bp
s)
Sri Lanka - Download from International
server
0
500
1000
1500
2000
2500
3000
800 1100 1500 1800 2000 2300Time
SLT (2 Mbps) Colombo, LK
0
500
1000
1500
2000
2500
3000
800 1100 1500 1800 2000 2300
Do
wn
loa
d s
pe
ed
(k
bp
s)
Time
SLT (2 Mbps) Colombo, LK

Local peering is also a problem. Network
exchange points a bottleneck. E.g. India
41
60 59 59
55
60
40
50
60
70
RTT (in ms) from Airtel Delhi to tataindicombroadband.comEven though IN has
7+ IXPs, the IXPs
themselves act as
bottleneck. Why?
1
30 30
0
10
20
30
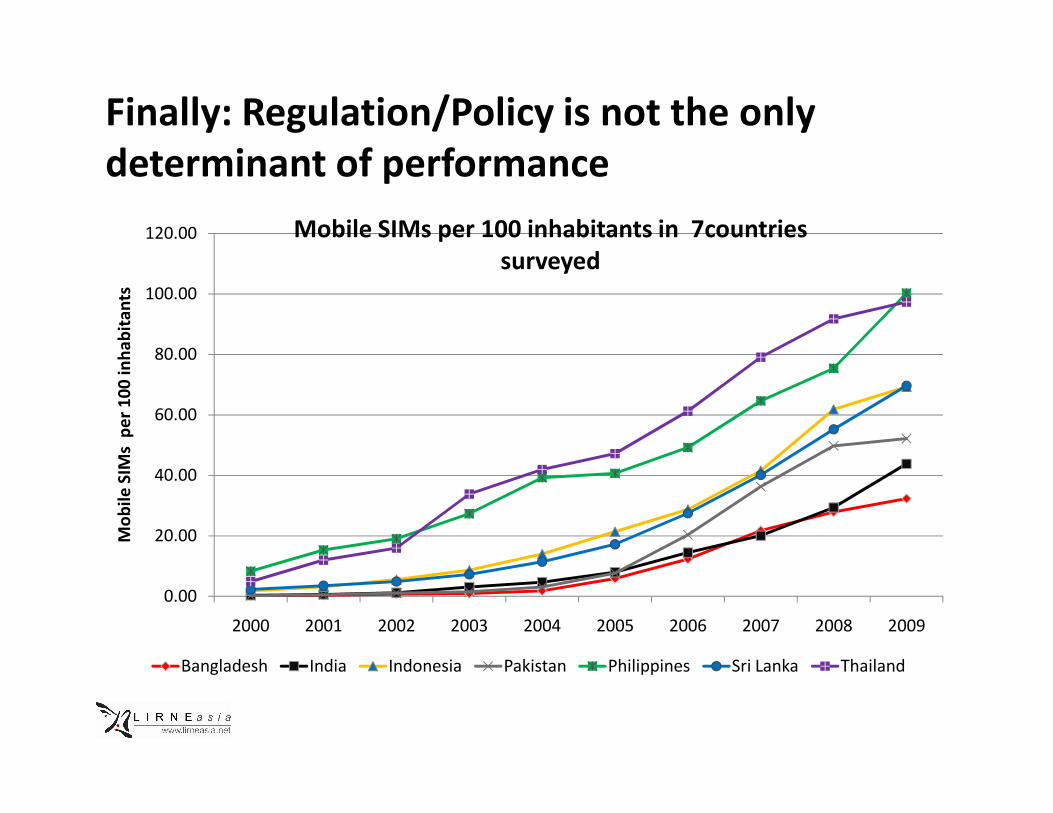
Finally: Regulation/Policy is not the only
determinant of performance
60.00
80.00
100.00
120.00
pe
r 1
00
in
ha
bit
an
ts
Mobile SIMs per 100 inhabitants in 7countries
surveyed
0.00
20.00
40.00
60.00
2000 2001 2002 2003 2004 2005 2006 2007 2008 2009
Mo
bil
e S
IMs
pe
r 1
00
in
ha
bit
an
ts
Bangladesh India Indonesia Pakistan Philippines Sri Lanka Thailand

Questions, Comments, ReactionsAudienceAudience
+ Faheem Hussain, Helani Galpaya, Rohan Samarajiva

Hidden slide: Number of completed survey responses
received per country and per respondent category
Country Category 1 Category 2 Category 3 Total
Responses
Bangladesh 17 7 15 39
Pakistan 15 14 23 52
India 16 7 18 41India 16 7 18 41
Sri Lanka 14 21 19 54
The Philippines 19 10 30 59
Thailand 16 17 17 50
Indonesia 15 15 17 47
342

Our mission
To improve the lives of the people of the emerging Asia-Pacific by facilitating
their use of ICTs and related infrastructures; by catalyzing the reform of
laws, policies and regulations to enable those uses through the conduct of
policy-relevant research, training and advocacy with emphasis on building
in-situ expertise


![3) Bangladesh Telecom Regulatory Commission [BTRC]](https://img.pdfslide.us/doc/110x75/577d23321a28ab4e1e993e55/3-bangladesh-telecom-regulatory-commission-btrc.jpg)