Embed Size (px)
Citation preview
1
For immediate release (Press Release No. 47/2015) Information Note to the Press
TELECOM REGULATORY AUTHORITY OF INDIA New Delhi, 1st September, 2015
(www.trai.gov.in)
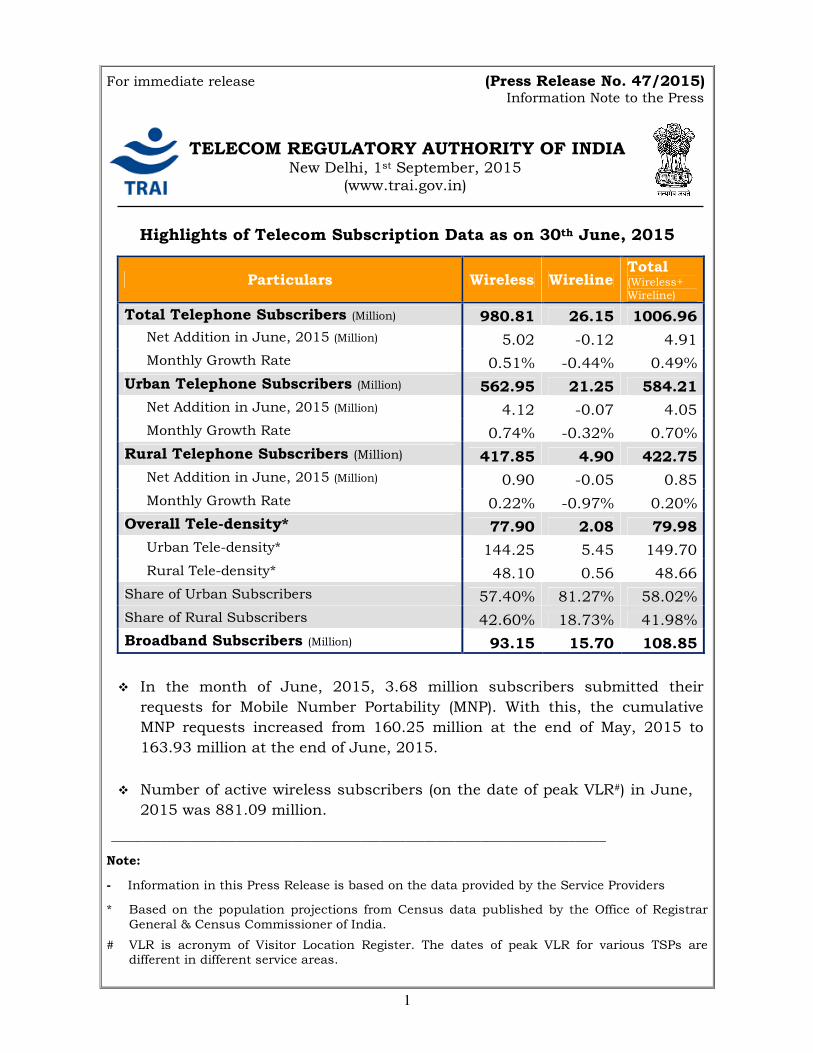
Highlights of Telecom Subscription Data as on 30th June, 2015
� In the month of June, 2015, 3.68 million subscribers submitted their
requests for Mobile Number Portability (MNP). With this, the cumulative
MNP requests increased from 160.25 million at the end of May, 2015 to
163.93 million at the end of June, 2015.
� Number of active wireless subscribers (on the date of peak VLR#) in June,
2015 was 881.09 million.
_______________________________________________________________________________
Note:
- Information in this Press Release is based on the data provided by the Service Providers
* Based on the population projections from Census data published by the Office of Registrar
General & Census Commissioner of India.
# VLR is acronym of Visitor Location Register. The dates of peak VLR for various TSPs are different in different service areas.
Particulars Wireless Wireline Total (Wireless+ Wireline)
Total Telephone Subscribers (Million) 980.81 26.15 1006.96
Net Addition in June, 2015 (Million) 5.02 -0.12 4.91
Monthly Growth Rate 0.51% -0.44% 0.49%
Urban Telephone Subscribers (Million) 562.95 21.25 584.21
Net Addition in June, 2015 (Million) 4.12 -0.07 4.05
Monthly Growth Rate 0.74% -0.32% 0.70%
Rural Telephone Subscribers (Million) 417.85 4.90 422.75
Net Addition in June, 2015 (Million) 0.90 -0.05 0.85
Monthly Growth Rate 0.22% -0.97% 0.20%
Overall Tele-density* 77.90 2.08 79.98
Urban Tele-density* 144.25 5.45 149.70
Rural Tele-density* 48.10 0.56 48.66
Share of Urban Subscribers 57.40% 81.27% 58.02%
Share of Rural Subscribers 42.60% 18.73% 41.98%
Broadband Subscribers (Million) 93.15 15.70 108.85
2
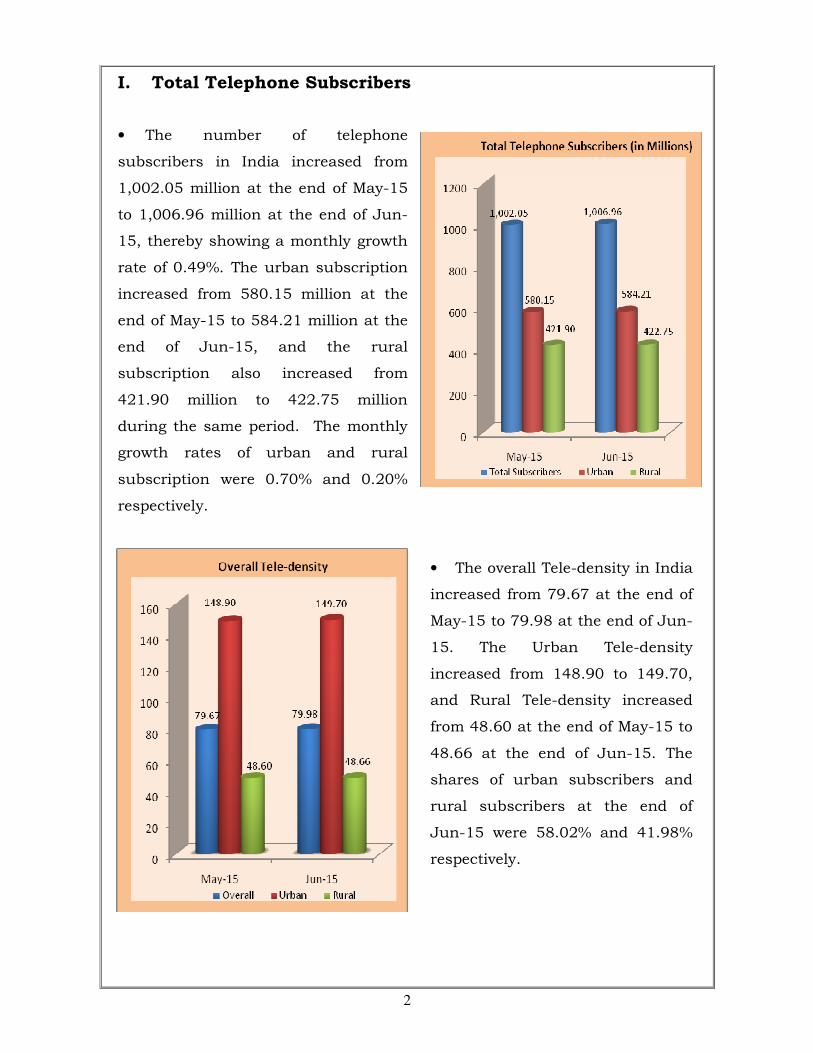
I. Total Telephone Subscribers
• The number of telephone
subscribers in India increased from
1,002.05 million at the end of May-15
to 1,006.96 million at the end of Jun-
15, thereby showing a monthly growth
rate of 0.49%. The urban subscription
increased from 580.15 million at the
end of May-15 to 584.21 million at the
end of Jun-15, and the rural
subscription also increased from
421.90 million to 422.75 million
during the same period. The monthly
growth rates of urban and rural
subscription were 0.70% and 0.20%
respectively.
• The overall Tele-density in India
increased from 79.67 at the end of
May-15 to 79.98 at the end of Jun-
15. The Urban Tele-density
increased from 148.90 to 149.70,
and Rural Tele-density increased
from 48.60 at the end of May-15 to
48.66 at the end of Jun-15. The
shares of urban subscribers and
rural subscribers at the end of
Jun-15 were 58.02% and 41.98%
respectively.
3
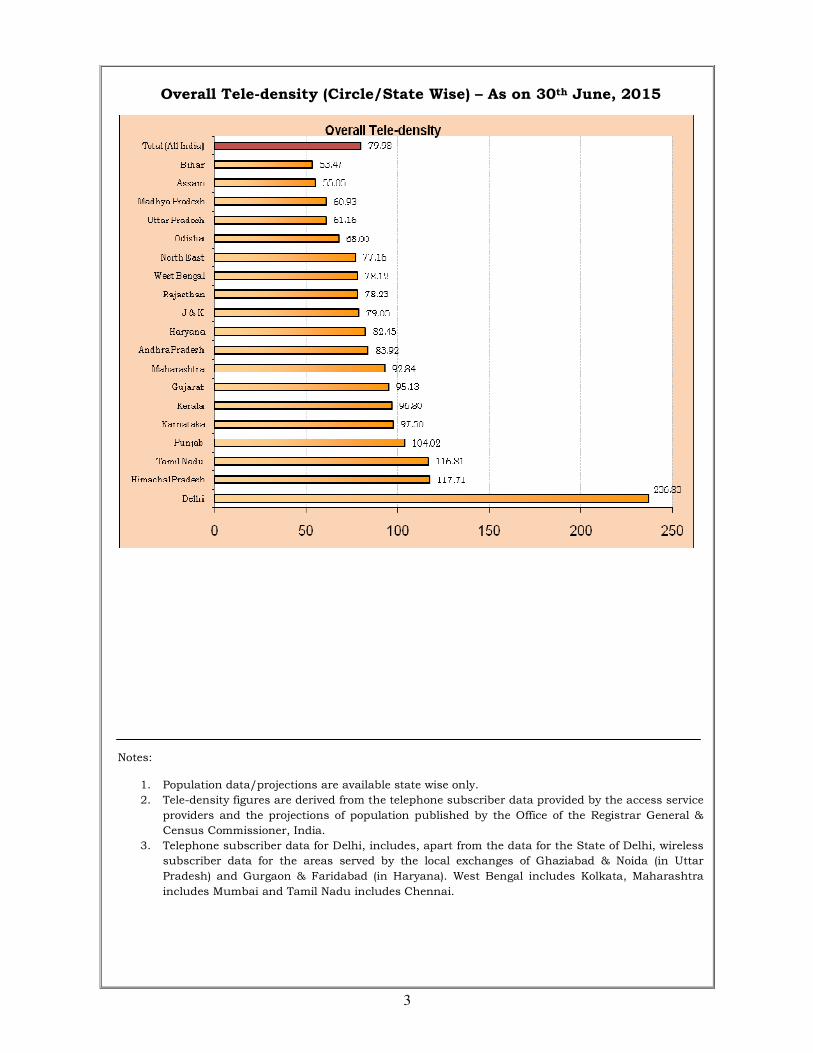
Overall Tele-density (Circle/State Wise) – As on 30th June, 2015
Notes:
1. Population data/projections are available state wise only.
2. Tele-density figures are derived from the telephone subscriber data provided by the access service
providers and the projections of population published by the Office of the Registrar General &
Census Commissioner, India.
3. Telephone subscriber data for Delhi, includes, apart from the data for the State of Delhi, wireless
subscriber data for the areas served by the local exchanges of Ghaziabad & Noida (in Uttar
Pradesh) and Gurgaon & Faridabad (in Haryana). West Bengal includes Kolkata, Maharashtra
includes Mumbai and Tamil Nadu includes Chennai.
4
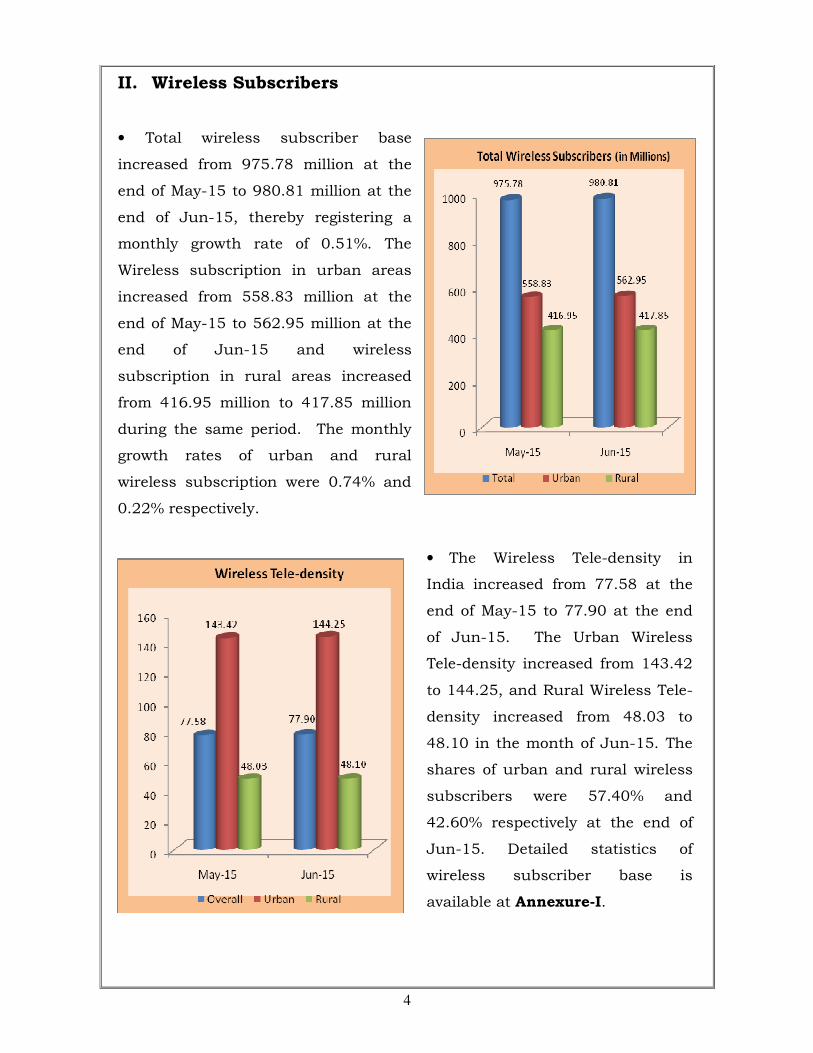
II. Wireless Subscribers
• Total wireless subscriber base
increased from 975.78 million at the
end of May-15 to 980.81 million at the
end of Jun-15, thereby registering a
monthly growth rate of 0.51%. The
Wireless subscription in urban areas
increased from 558.83 million at the
end of May-15 to 562.95 million at the
end of Jun-15 and wireless
subscription in rural areas increased
from 416.95 million to 417.85 million
during the same period. The monthly
growth rates of urban and rural
wireless subscription were 0.74% and
0.22% respectively.
• The Wireless Tele-density in
India increased from 77.58 at the
end of May-15 to 77.90 at the end
of Jun-15. The Urban Wireless
Tele-density increased from 143.42
to 144.25, and Rural Wireless Tele-
density increased from 48.03 to
48.10 in the month of Jun-15. The
shares of urban and rural wireless
subscribers were 57.40% and
42.60% respectively at the end of
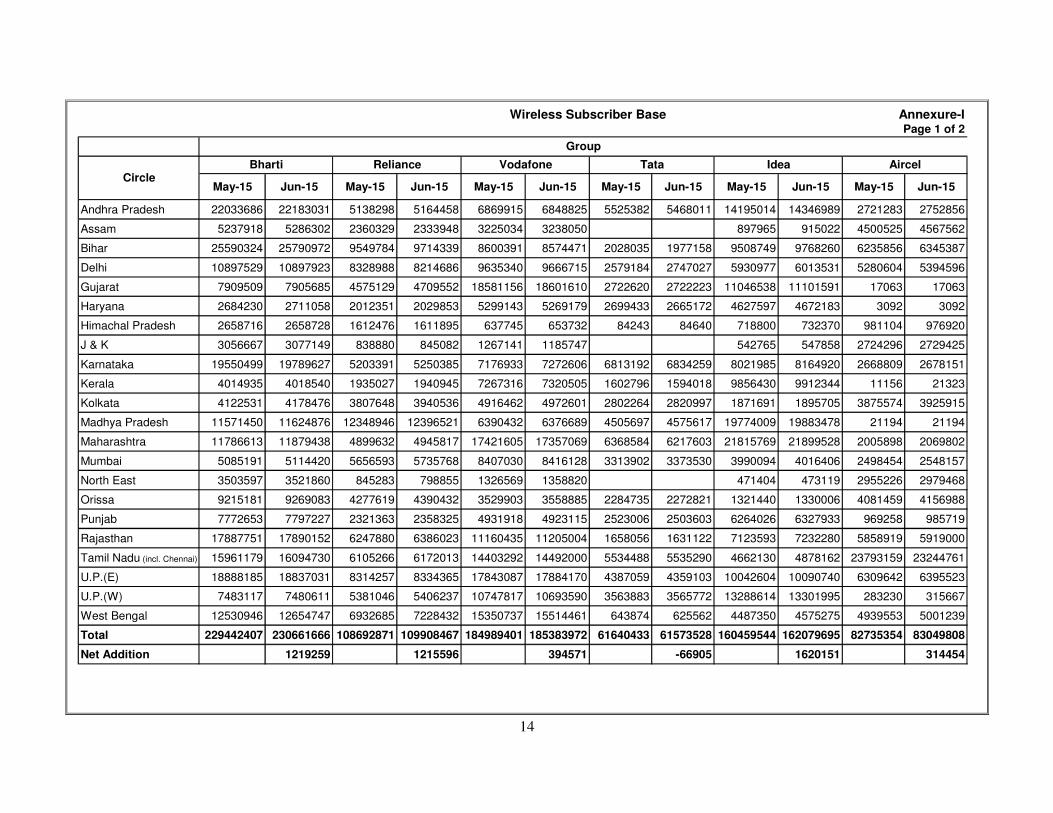
Jun-15. Detailed statistics of
wireless subscriber base is
available at Annexure-I.
5
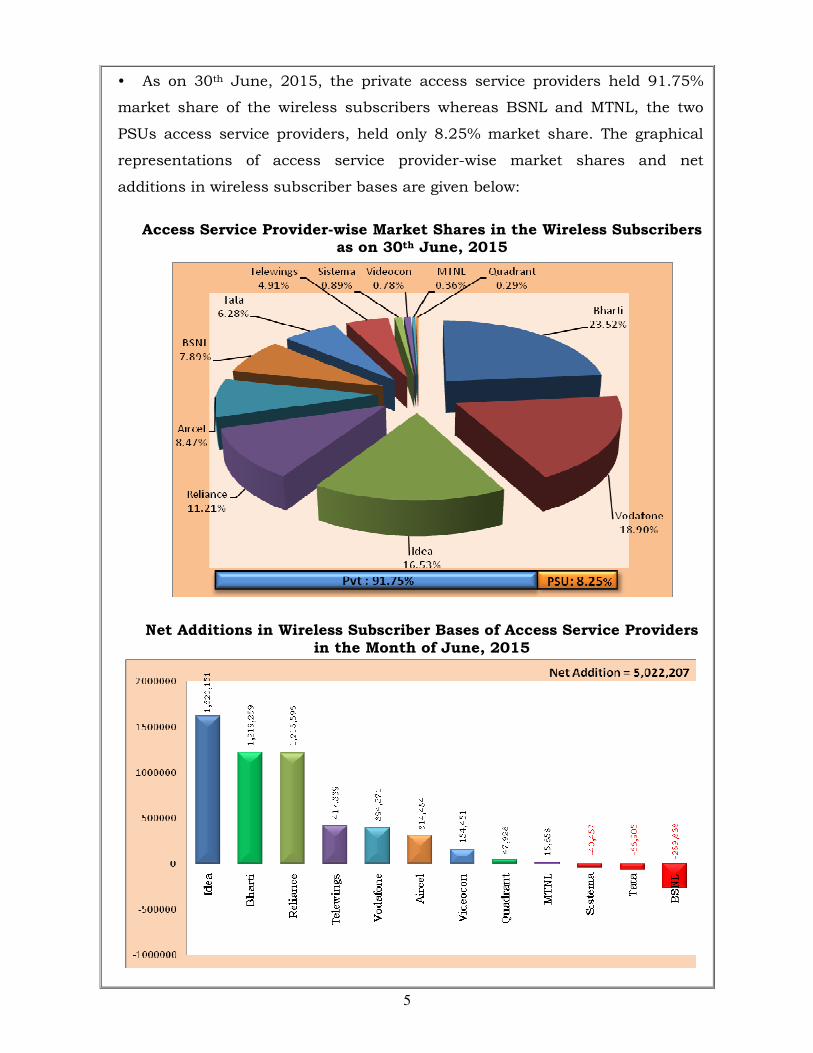
• As on 30th June, 2015, the private access service providers held 91.75%
market share of the wireless subscribers whereas BSNL and MTNL, the two
PSUs access service providers, held only 8.25% market share. The graphical
representations of access service provider-wise market shares and net
additions in wireless subscriber bases are given below:
Access Service Provider-wise Market Shares in the Wireless Subscribers as on 30th June, 2015
Net Additions in Wireless Subscriber Bases of Access Service Providers in the Month of June, 2015
6
III. Active Wireless Subscribers (VLR Data)
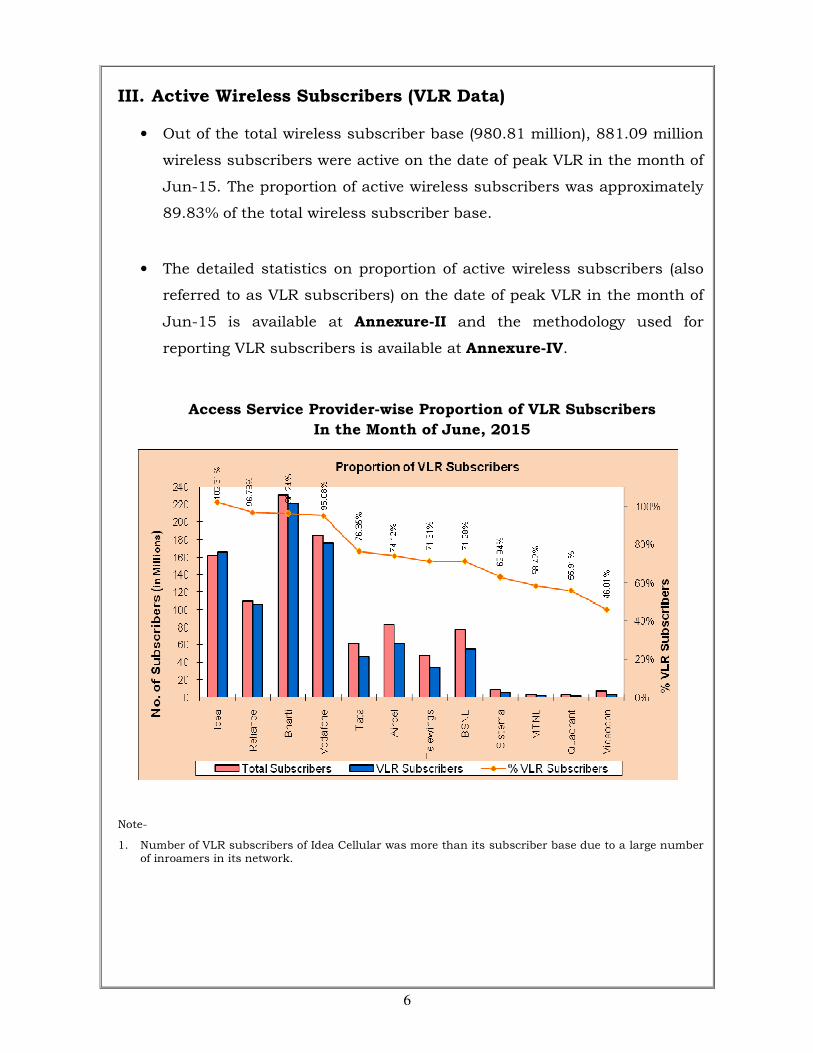
• Out of the total wireless subscriber base (980.81 million), 881.09 million
wireless subscribers were active on the date of peak VLR in the month of
Jun-15. The proportion of active wireless subscribers was approximately
89.83% of the total wireless subscriber base.
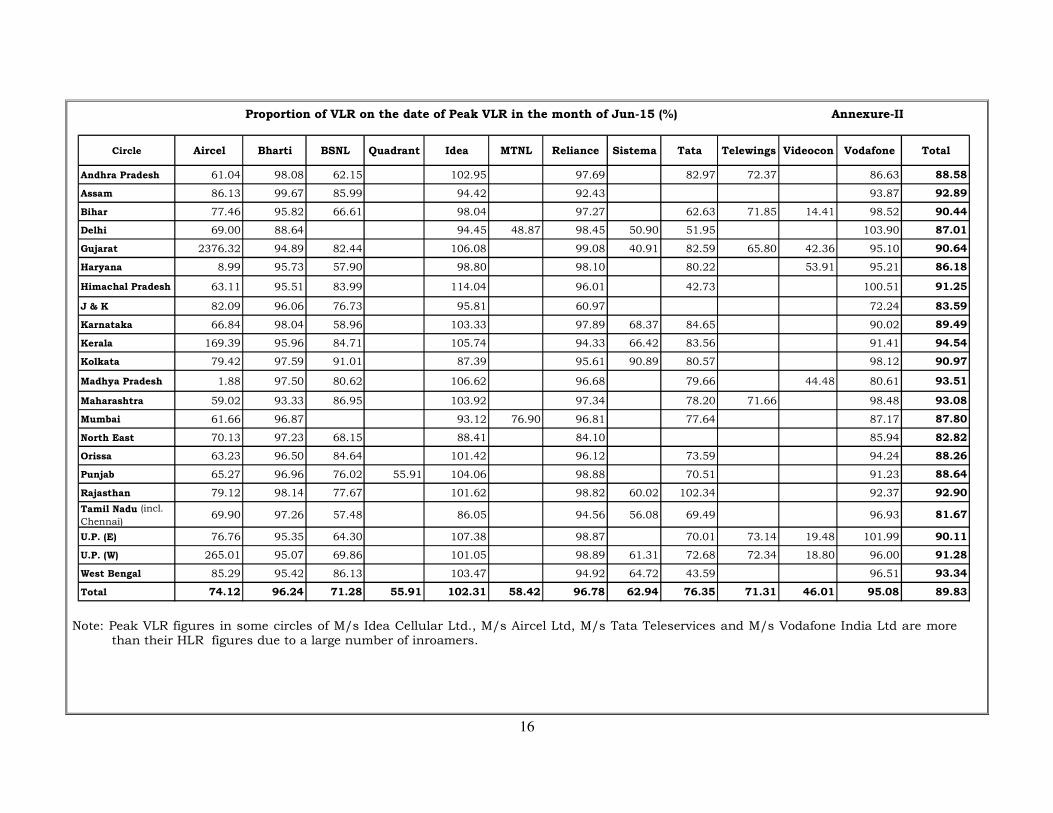
• The detailed statistics on proportion of active wireless subscribers (also
referred to as VLR subscribers) on the date of peak VLR in the month of
Jun-15 is available at Annexure-II and the methodology used for
reporting VLR subscribers is available at Annexure-IV.
Access Service Provider-wise Proportion of VLR Subscribers
In the Month of June, 2015
Note-
1. Number of VLR subscribers of Idea Cellular was more than its subscriber base due to a large number of inroamers in its network.
7
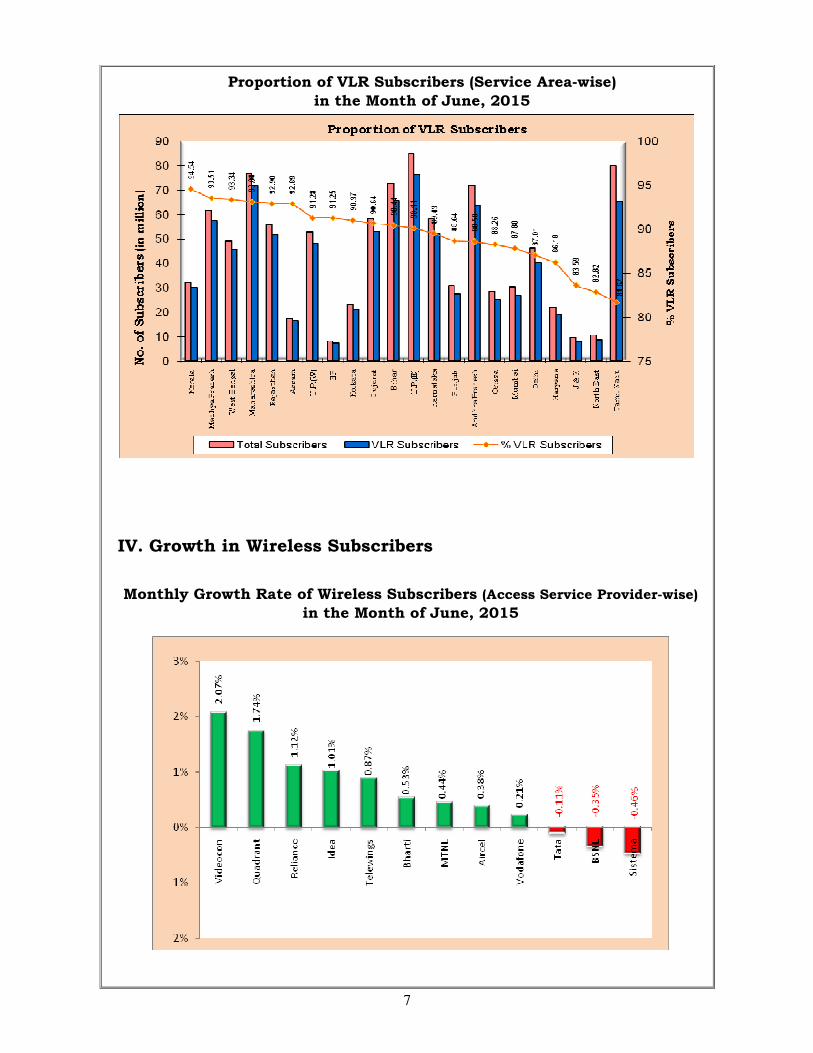
Proportion of VLR Subscribers (Service Area-wise)
in the Month of June, 2015
IV. Growth in Wireless Subscribers
Monthly Growth Rate of Wireless Subscribers (Access Service Provider-wise)
in the Month of June, 2015
8
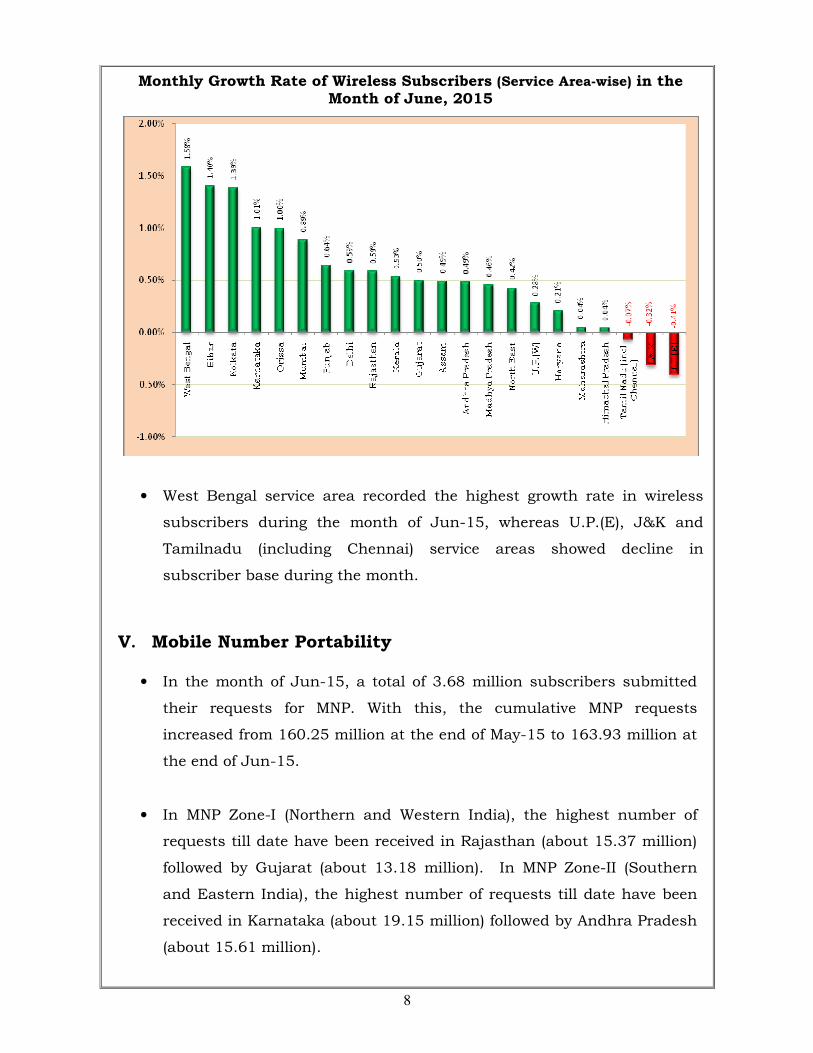
Monthly Growth Rate of Wireless Subscribers (Service Area-wise) in the Month of June, 2015
• West Bengal service area recorded the highest growth rate in wireless
subscribers during the month of Jun-15, whereas U.P.(E), J&K and
Tamilnadu (including Chennai) service areas showed decline in
subscriber base during the month.
V. Mobile Number Portability
• In the month of Jun-15, a total of 3.68 million subscribers submitted
their requests for MNP. With this, the cumulative MNP requests
increased from 160.25 million at the end of May-15 to 163.93 million at
the end of Jun-15.
• In MNP Zone-I (Northern and Western India), the highest number of
requests till date have been received in Rajasthan (about 15.37 million)
followed by Gujarat (about 13.18 million). In MNP Zone-II (Southern
and Eastern India), the highest number of requests till date have been
received in Karnataka (about 19.15 million) followed by Andhra Pradesh
(about 15.61 million).
9
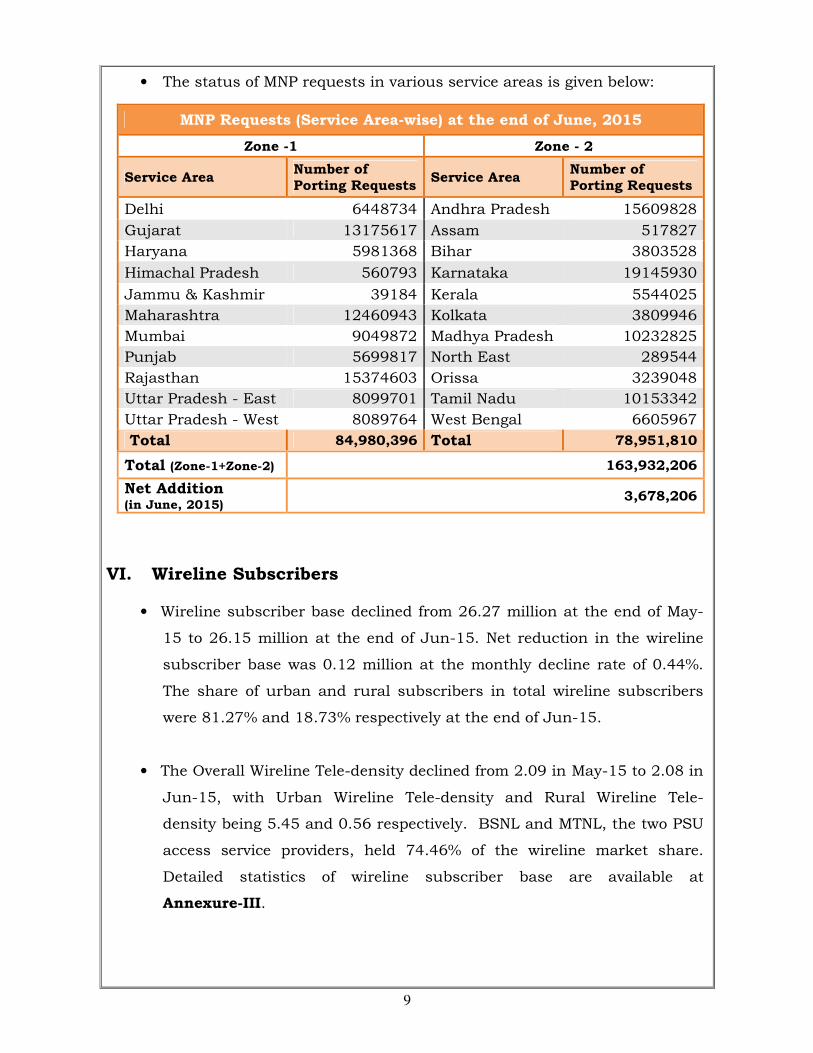
• The status of MNP requests in various service areas is given below:
MNP Requests (Service Area-wise) at the end of June, 2015
Zone -1 Zone - 2
Service Area Number of Porting Requests
Service Area Number of Porting Requests
Delhi 6448734 Andhra Pradesh 15609828
Gujarat 13175617 Assam 517827
Haryana 5981368 Bihar 3803528
Himachal Pradesh 560793 Karnataka 19145930
Jammu & Kashmir 39184 Kerala 5544025
Maharashtra 12460943 Kolkata 3809946
Mumbai 9049872 Madhya Pradesh 10232825
Punjab 5699817 North East 289544
Rajasthan 15374603 Orissa 3239048
Uttar Pradesh - East 8099701 Tamil Nadu 10153342
Uttar Pradesh - West 8089764 West Bengal 6605967
Total 84,980,396 Total 78,951,810
Total (Zone-1+Zone-2) 163,932,206
Net Addition (in June, 2015)
3,678,206
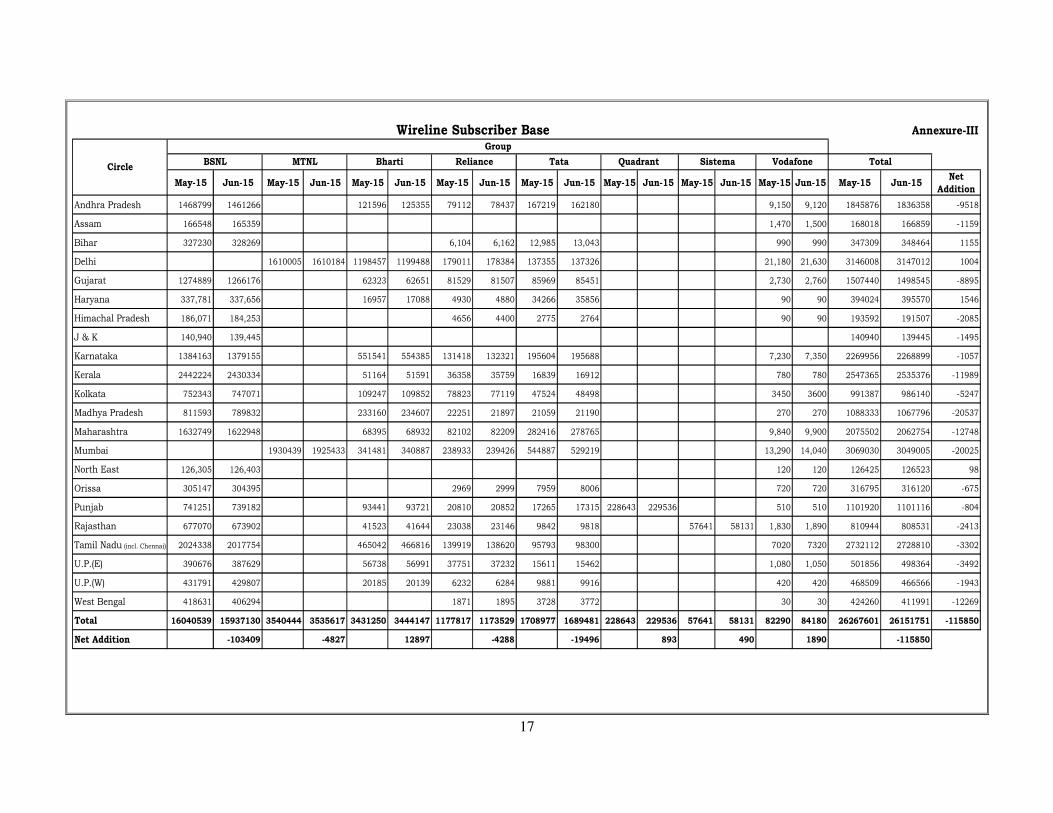
VI. Wireline Subscribers
• Wireline subscriber base declined from 26.27 million at the end of May-
15 to 26.15 million at the end of Jun-15. Net reduction in the wireline
subscriber base was 0.12 million at the monthly decline rate of 0.44%.
The share of urban and rural subscribers in total wireline subscribers
were 81.27% and 18.73% respectively at the end of Jun-15.
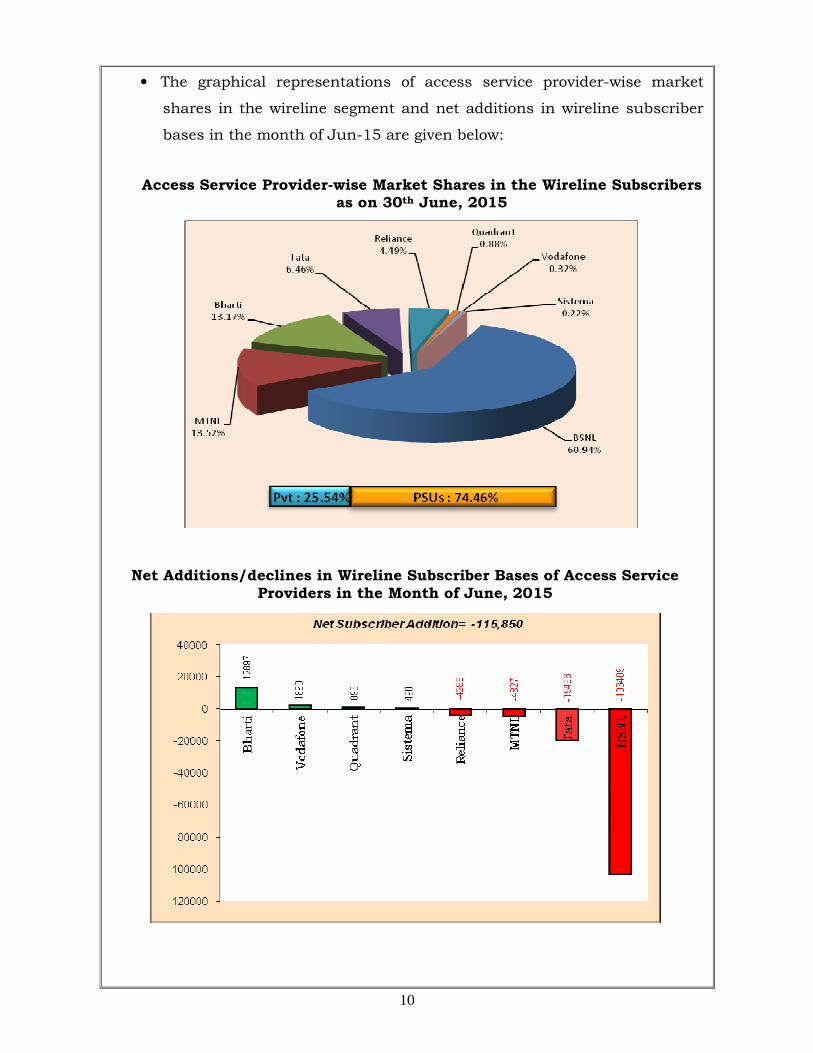
• The Overall Wireline Tele-density declined from 2.09 in May-15 to 2.08 in
Jun-15, with Urban Wireline Tele-density and Rural Wireline Tele-
density being 5.45 and 0.56 respectively. BSNL and MTNL, the two PSU
access service providers, held 74.46% of the wireline market share.
Detailed statistics of wireline subscriber base are available at
Annexure-III.
10
• The graphical representations of access service provider-wise market
shares in the wireline segment and net additions in wireline subscriber
bases in the month of Jun-15 are given below:
Access Service Provider-wise Market Shares in the Wireline Subscribers as on 30th June, 2015
Net Additions/declines in Wireline Subscriber Bases of Access Service Providers in the Month of June, 2015
11
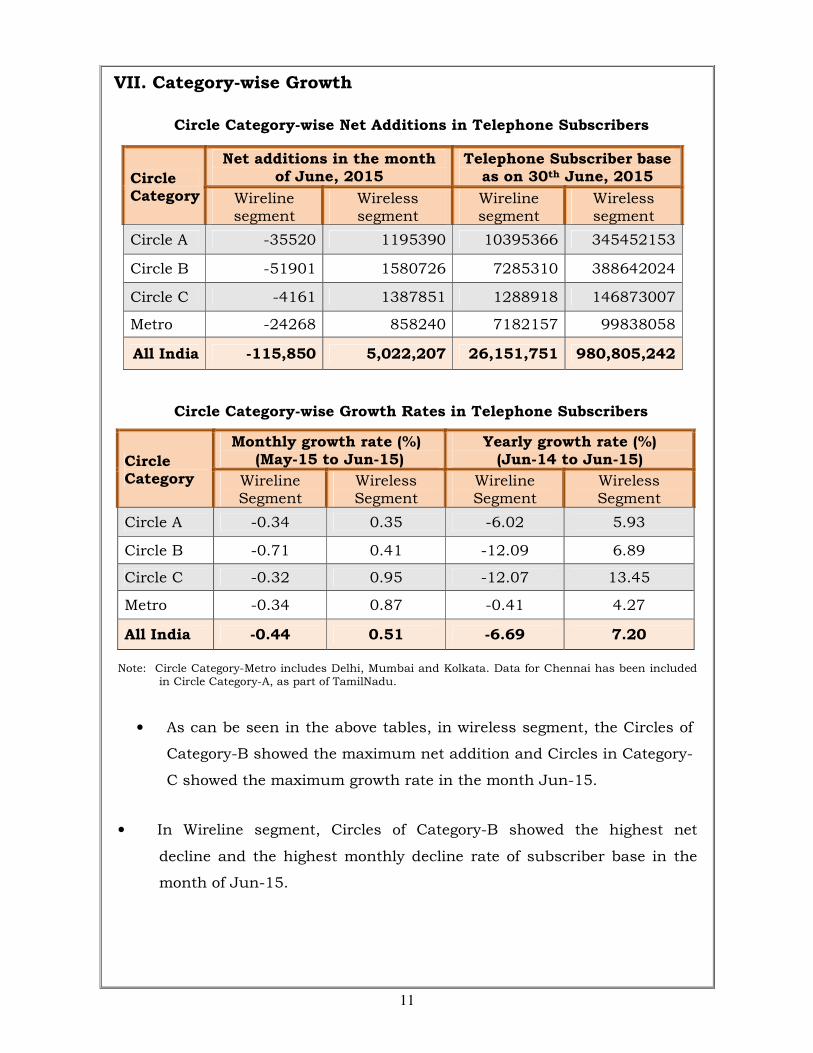
VII. Category-wise Growth
Circle Category-wise Net Additions in Telephone Subscribers
Circle Category
Net additions in the month of June, 2015
Telephone Subscriber base as on 30th June, 2015
Wireline segment
Wireless segment
Wireline segment
Wireless segment
Circle A -35520 1195390 10395366 345452153
Circle B -51901 1580726 7285310 388642024
Circle C -4161 1387851 1288918 146873007
Metro -24268 858240 7182157 99838058
All India -115,850 5,022,207 26,151,751 980,805,242
Circle Category-wise Growth Rates in Telephone Subscribers
Circle Category
Monthly growth rate (%) (May-15 to Jun-15)
Yearly growth rate (%) (Jun-14 to Jun-15)
Wireline Segment
Wireless Segment
Wireline Segment
Wireless Segment
Circle A -0.34 0.35 -6.02 5.93
Circle B -0.71 0.41 -12.09 6.89
Circle C -0.32 0.95 -12.07 13.45
Metro -0.34 0.87 -0.41 4.27
All India -0.44 0.51 -6.69 7.20
Note: Circle Category-Metro includes Delhi, Mumbai and Kolkata. Data for Chennai has been included in Circle Category-A, as part of TamilNadu.
• As can be seen in the above tables, in wireless segment, the Circles of
Category-B showed the maximum net addition and Circles in Category-
C showed the maximum growth rate in the month Jun-15.
• In Wireline segment, Circles of Category-B showed the highest net
decline and the highest monthly decline rate of subscriber base in the
month of Jun-15.
12
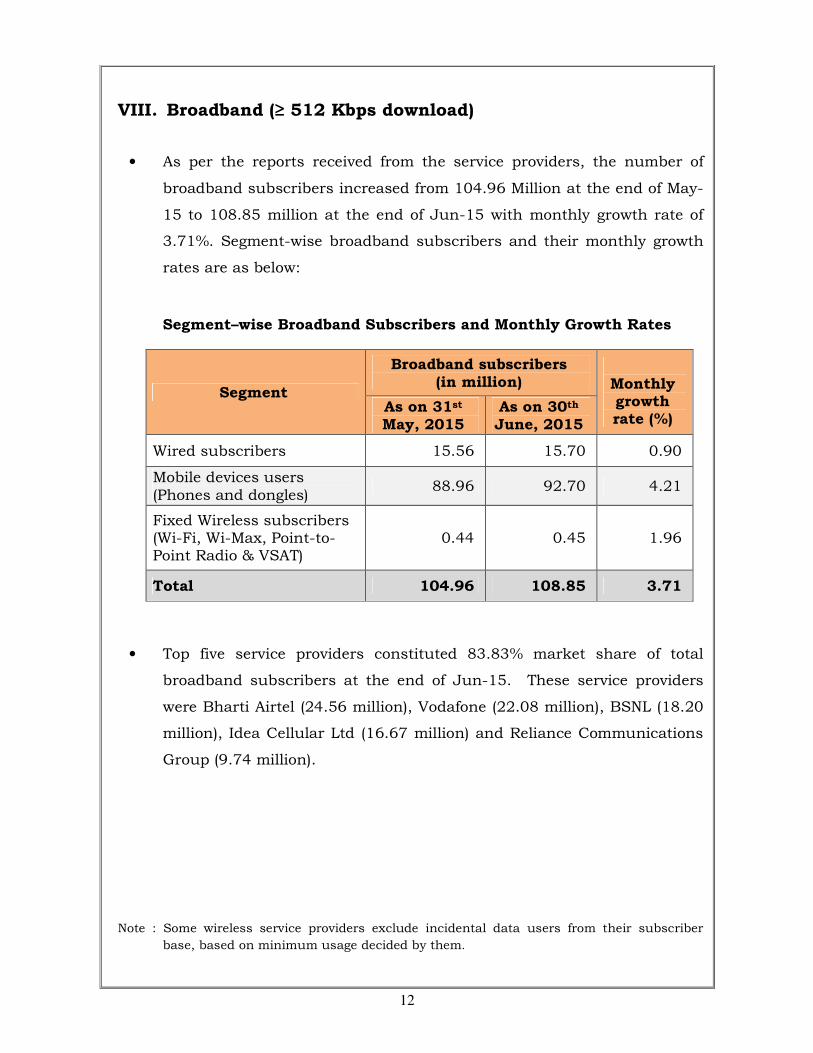
VIII. Broadband (≥ 512 Kbps download)
• As per the reports received from the service providers, the number of
broadband subscribers increased from 104.96 Million at the end of May-
15 to 108.85 million at the end of Jun-15 with monthly growth rate of
3.71%. Segment-wise broadband subscribers and their monthly growth
rates are as below:
Segment–wise Broadband Subscribers and Monthly Growth Rates
Segment
Broadband subscribers (in million)
Monthly growth rate (%)
As on 31st May, 2015
As on 30th June, 2015
Wired subscribers 15.56 15.70 0.90
Mobile devices users (Phones and dongles)
88.96 92.70 4.21
Fixed Wireless subscribers (Wi-Fi, Wi-Max, Point-to-Point Radio & VSAT)
0.44 0.45 1.96
Total 104.96 108.85 3.71
• Top five service providers constituted 83.83% market share of total
broadband subscribers at the end of Jun-15. These service providers
were Bharti Airtel (24.56 million), Vodafone (22.08 million), BSNL (18.20
million), Idea Cellular Ltd (16.67 million) and Reliance Communications
Group (9.74 million).
Note : Some wireless service providers exclude incidental data users from their subscriber
base, based on minimum usage decided by them.
13
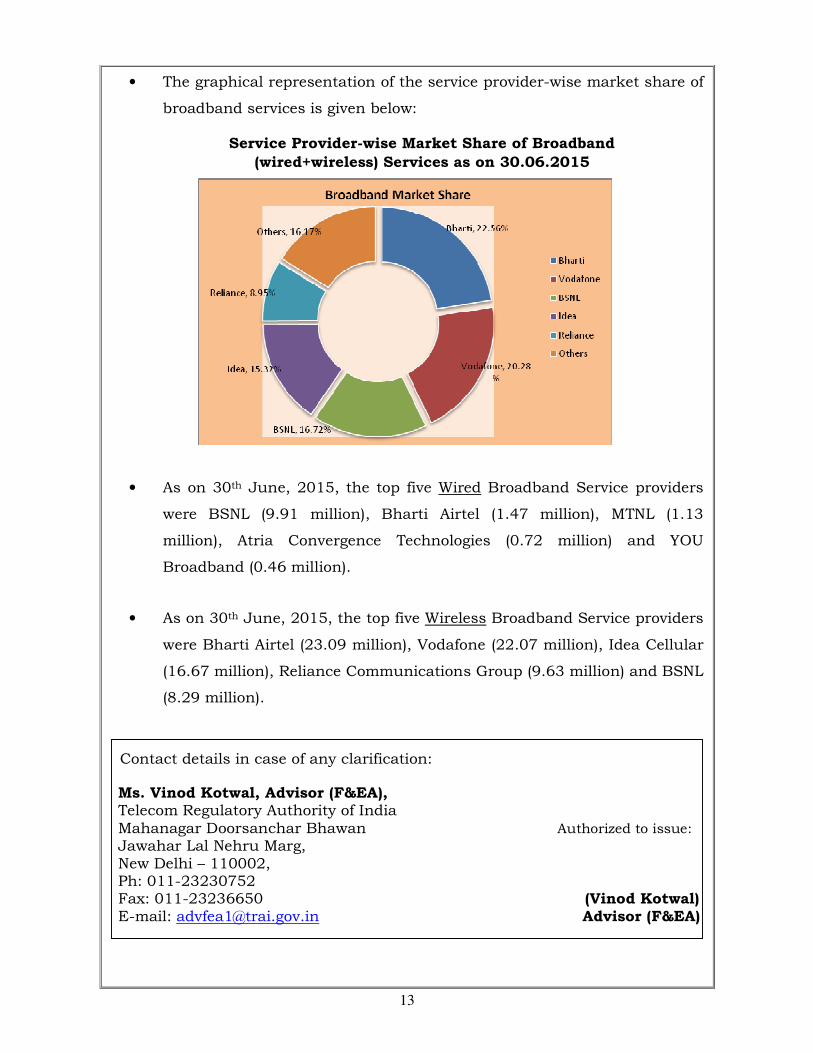
• The graphical representation of the service provider-wise market share of
broadband services is given below:
Service Provider-wise Market Share of Broadband
(wired+wireless) Services as on 30.06.2015
• As on 30th June, 2015, the top five Wired Broadband Service providers
were BSNL (9.91 million), Bharti Airtel (1.47 million), MTNL (1.13
million), Atria Convergence Technologies (0.72 million) and YOU
Broadband (0.46 million).
• As on 30th June, 2015, the top five Wireless Broadband Service providers
were Bharti Airtel (23.09 million), Vodafone (22.07 million), Idea Cellular
(16.67 million), Reliance Communications Group (9.63 million) and BSNL
(8.29 million).
Contact details in case of any clarification:
Ms. Vinod Kotwal, Advisor (F&EA), Telecom Regulatory Authority of India
Mahanagar Doorsanchar Bhawan Authorized to issue: Jawahar Lal Nehru Marg, New Delhi – 110002, Ph: 011-23230752 Fax: 011-23236650 (Vinod Kotwal) E-mail: [email protected] Advisor (F&EA)
14
May-15 Jun-15 May-15 Jun-15 May-15 Jun-15 May-15 Jun-15 May-15 Jun-15 May-15 Jun-15
Andhra Pradesh 22033686 22183031 5138298 5164458 6869915 6848825 5525382 5468011 14195014 14346989 2721283 2752856
Assam 5237918 5286302 2360329 2333948 3225034 3238050 897965 915022 4500525 4567562
Bihar 25590324 25790972 9549784 9714339 8600391 8574471 2028035 1977158 9508749 9768260 6235856 6345387
Delhi 10897529 10897923 8328988 8214686 9635340 9666715 2579184 2747027 5930977 6013531 5280604 5394596
Gujarat 7909509 7905685 4575129 4709552 18581156 18601610 2722620 2722223 11046538 11101591 17063 17063
Haryana 2684230 2711058 2012351 2029853 5299143 5269179 2699433 2665172 4627597 4672183 3092 3092
Himachal Pradesh 2658716 2658728 1612476 1611895 637745 653732 84243 84640 718800 732370 981104 976920
J & K 3056667 3077149 838880 845082 1267141 1185747 542765 547858 2724296 2729425
Karnataka 19550499 19789627 5203391 5250385 7176933 7272606 6813192 6834259 8021985 8164920 2668809 2678151
Kerala 4014935 4018540 1935027 1940945 7267316 7320505 1602796 1594018 9856430 9912344 11156 21323
Kolkata 4122531 4178476 3807648 3940536 4916462 4972601 2802264 2820997 1871691 1895705 3875574 3925915
Madhya Pradesh 11571450 11624876 12348946 12396521 6390432 6376689 4505697 4575617 19774009 19883478 21194 21194
Maharashtra 11786613 11879438 4899632 4945817 17421605 17357069 6368584 6217603 21815769 21899528 2005898 2069802
Mumbai 5085191 5114420 5656593 5735768 8407030 8416128 3313902 3373530 3990094 4016406 2498454 2548157
North East 3503597 3521860 845283 798855 1326569 1358820 471404 473119 2955226 2979468
Orissa 9215181 9269083 4277619 4390432 3529903 3558885 2284735 2272821 1321440 1330006 4081459 4156988
Punjab 7772653 7797227 2321363 2358325 4931918 4923115 2523006 2503603 6264026 6327933 969258 985719
Rajasthan 17887751 17890152 6247880 6386023 11160435 11205004 1658056 1631122 7123593 7232280 5858919 5919000
Tamil Nadu (incl. Chennai) 15961179 16094730 6105266 6172013 14403292 14492000 5534488 5535290 4662130 4878162 23793159 23244761
U.P.(E) 18888185 18837031 8314257 8334365 17843087 17884170 4387059 4359103 10042604 10090740 6309642 6395523
U.P.(W) 7483117 7480611 5381046 5406237 10747817 10693590 3563883 3565772 13288614 13301995 283230 315667
West Bengal 12530946 12654747 6932685 7228432 15350737 15514461 643874 625562 4487350 4575275 4939553 5001239
Total 229442407 230661666 108692871 109908467 184989401 185383972 61640433 61573528 160459544 162079695 82735354 83049808
Net Addition 1219259 1215596 394571 -66905 1620151 314454
CircleBharti Reliance Vodafone Tata Idea
Wireless Subscriber Base
Group
Annexure-IPage 1 of 2
Aircel
15
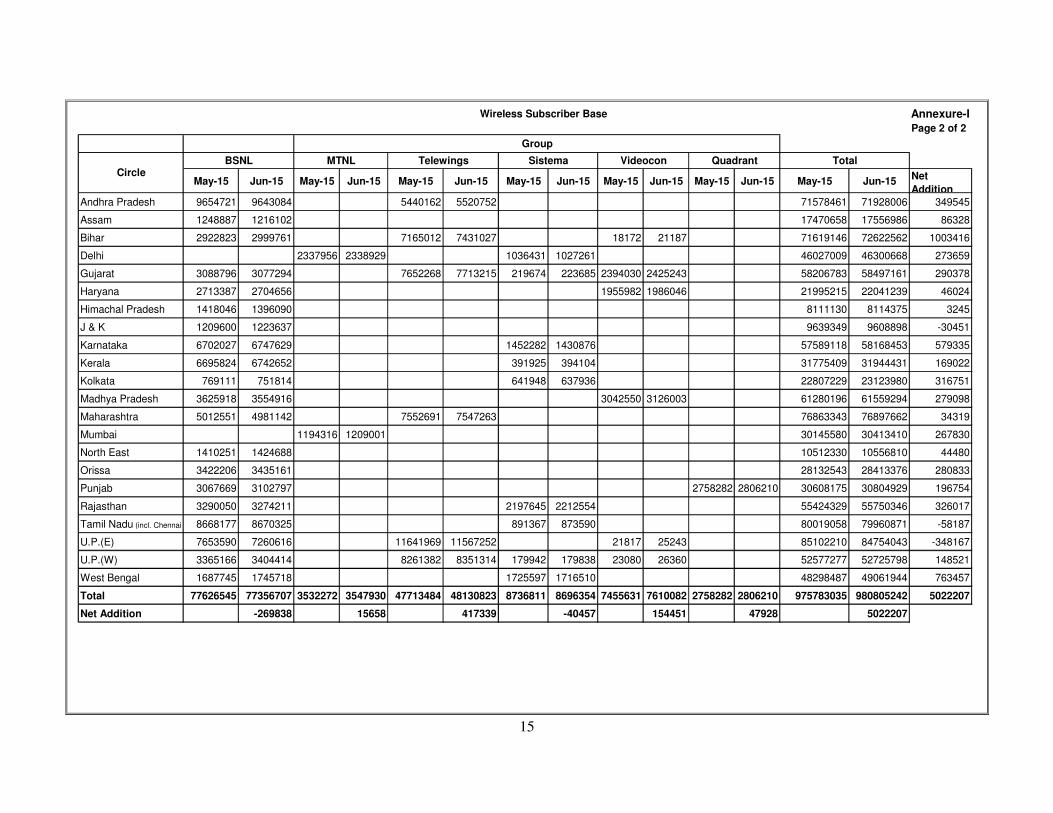
Page 2 of 2
May-15 Jun-15 May-15 Jun-15 May-15 Jun-15 May-15 Jun-15 May-15 Jun-15 May-15 Jun-15 May-15 Jun-15Net
Addition
Andhra Pradesh 9654721 9643084 5440162 5520752 71578461 71928006 349545
Assam 1248887 1216102 17470658 17556986 86328
Bihar 2922823 2999761 7165012 7431027 18172 21187 71619146 72622562 1003416
Delhi 2337956 2338929 1036431 1027261 46027009 46300668 273659
Gujarat 3088796 3077294 7652268 7713215 219674 223685 2394030 2425243 58206783 58497161 290378
Haryana 2713387 2704656 1955982 1986046 21995215 22041239 46024
Himachal Pradesh 1418046 1396090 8111130 8114375 3245
J & K 1209600 1223637 9639349 9608898 -30451
Karnataka 6702027 6747629 1452282 1430876 57589118 58168453 579335
Kerala 6695824 6742652 391925 394104 31775409 31944431 169022
Kolkata 769111 751814 641948 637936 22807229 23123980 316751
Madhya Pradesh 3625918 3554916 3042550 3126003 61280196 61559294 279098
Maharashtra 5012551 4981142 7552691 7547263 76863343 76897662 34319
Mumbai 1194316 1209001 30145580 30413410 267830
North East 1410251 1424688 10512330 10556810 44480
Orissa 3422206 3435161 28132543 28413376 280833
Punjab 3067669 3102797 2758282 2806210 30608175 30804929 196754
Rajasthan 3290050 3274211 2197645 2212554 55424329 55750346 326017
Tamil Nadu (incl. Chennai) 8668177 8670325 891367 873590 80019058 79960871 -58187
U.P.(E) 7653590 7260616 11641969 11567252 21817 25243 85102210 84754043 -348167
U.P.(W) 3365166 3404414 8261382 8351314 179942 179838 23080 26360 52577277 52725798 148521
West Bengal 1687745 1745718 1725597 1716510 48298487 49061944 763457
Total 77626545 77356707 3532272 3547930 47713484 48130823 8736811 8696354 7455631 7610082 2758282 2806210 975783035 980805242 5022207
Net Addition -269838 15658 417339 -40457 154451 47928 5022207
VideoconMTNL Telewings Sistema
Group
CircleQuadrant
Annexure-I
BSNL Total
Wireless Subscriber Base
16
Circle Aircel Bharti BSNL Quadrant Idea MTNL Reliance Sistema Tata Telewings Videocon Vodafone Total
Andhra Pradesh 61.04 98.08 62.15 102.95 97.69 82.97 72.37 86.63 88.58
Assam 86.13 99.67 85.99 94.42 92.43 93.87 92.89
Bihar 77.46 95.82 66.61 98.04 97.27 62.63 71.85 14.41 98.52 90.44
Delhi 69.00 88.64 94.45 48.87 98.45 50.90 51.95 103.90 87.01
Gujarat 2376.32 94.89 82.44 106.08 99.08 40.91 82.59 65.80 42.36 95.10 90.64
Haryana 8.99 95.73 57.90 98.80 98.10 80.22 53.91 95.21 86.18
Himachal Pradesh 63.11 95.51 83.99 114.04 96.01 42.73 100.51 91.25
J & K 82.09 96.06 76.73 95.81 60.97 72.24 83.59
Karnataka 66.84 98.04 58.96 103.33 97.89 68.37 84.65 90.02 89.49
Kerala 169.39 95.96 84.71 105.74 94.33 66.42 83.56 91.41 94.54
Kolkata 79.42 97.59 91.01 87.39 95.61 90.89 80.57 98.12 90.97
Madhya Pradesh 1.88 97.50 80.62 106.62 96.68 79.66 44.48 80.61 93.51
Maharashtra 59.02 93.33 86.95 103.92 97.34 78.20 71.66 98.48 93.08
Mumbai 61.66 96.87 93.12 76.90 96.81 77.64 87.17 87.80
North East 70.13 97.23 68.15 88.41 84.10 85.94 82.82
Orissa 63.23 96.50 84.64 101.42 96.12 73.59 94.24 88.26
Punjab 65.27 96.96 76.02 55.91 104.06 98.88 70.51 91.23 88.64
Rajasthan 79.12 98.14 77.67 101.62 98.82 60.02 102.34 92.37 92.90
Tamil Nadu (incl.
Chennai)69.90 97.26 57.48 86.05 94.56 56.08 69.49 96.93 81.67
U.P. (E) 76.76 95.35 64.30 107.38 98.87 70.01 73.14 19.48 101.99 90.11
U.P. (W) 265.01 95.07 69.86 101.05 98.89 61.31 72.68 72.34 18.80 96.00 91.28
West Bengal 85.29 95.42 86.13 103.47 94.92 64.72 43.59 96.51 93.34
Total 74.12 96.24 71.28 55.91 102.31 58.42 96.78 62.94 76.35 71.31 46.01 95.08 89.83
Proportion of VLR on the date of Peak VLR in the month of Jun-15 (%) Annexure-II
Note: Peak VLR figures in some circles of M/s Idea Cellular Ltd., M/s Aircel Ltd, M/s Tata Teleservices and M/s Vodafone India Ltd are more than their HLR figures due to a large number of inroamers.
17
May-15 Jun-15 May-15 Jun-15 May-15 Jun-15 May-15 Jun-15 May-15 Jun-15 May-15 Jun-15 May-15 Jun-15 May-15 Jun-15 May-15 Jun-15Net
Addition
Andhra Pradesh 1468799 1461266 121596 125355 79112 78437 167219 162180 9,150 9,120 1845876 1836358 -9518
Assam 166548 165359 1,470 1,500 168018 166859 -1159
Bihar 327230 328269 6,104 6,162 12,985 13,043 990 990 347309 348464 1155
Delhi 1610005 1610184 1198457 1199488 179011 178384 137355 137326 21,180 21,630 3146008 3147012 1004
Gujarat 1274889 1266176 62323 62651 81529 81507 85969 85451 2,730 2,760 1507440 1498545 -8895
Haryana 337,781 337,656 16957 17088 4930 4880 34266 35856 90 90 394024 395570 1546
Himachal Pradesh 186,071 184,253 4656 4400 2775 2764 90 90 193592 191507 -2085
J & K 140,940 139,445 140940 139445 -1495
Karnataka 1384163 1379155 551541 554385 131418 132321 195604 195688 7,230 7,350 2269956 2268899 -1057
Kerala 2442224 2430334 51164 51591 36358 35759 16839 16912 780 780 2547365 2535376 -11989
Kolkata 752343 747071 109247 109852 78823 77119 47524 48498 3450 3600 991387 986140 -5247
Madhya Pradesh 811593 789832 233160 234607 22251 21897 21059 21190 270 270 1088333 1067796 -20537
Maharashtra 1632749 1622948 68395 68932 82102 82209 282416 278765 9,840 9,900 2075502 2062754 -12748
Mumbai 1930439 1925433 341481 340887 238933 239426 544887 529219 13,290 14,040 3069030 3049005 -20025
North East 126,305 126,403 120 120 126425 126523 98
Orissa 305147 304395 2969 2999 7959 8006 720 720 316795 316120 -675
Punjab 741251 739182 93441 93721 20810 20852 17265 17315 228643 229536 510 510 1101920 1101116 -804
Rajasthan 677070 673902 41523 41644 23038 23146 9842 9818 57641 58131 1,830 1,890 810944 808531 -2413
Tamil Nadu (incl. Chennai) 2024338 2017754 465042 466816 139919 138620 95793 98300 7020 7320 2732112 2728810 -3302
U.P.(E) 390676 387629 56738 56991 37751 37232 15611 15462 1,080 1,050 501856 498364 -3492
U.P.(W) 431791 429807 20185 20139 6232 6284 9881 9916 420 420 468509 466566 -1943
West Bengal 418631 406294 1871 1895 3728 3772 30 30 424260 411991 -12269
Total 16040539 15937130 3540444 3535617 3431250 3444147 1177817 1173529 1708977 1689481 228643 229536 57641 58131 82290 84180 26267601 26151751 -115850
Net Addition -103409 -4827 12897 -4288 -19496 893 490 1890 -115850
Wireline Subscriber Base
CircleTotalReliance Tata Quadrant Vodafone
Group
BSNL MTNL Bharti Sistema
Annexure-III
18
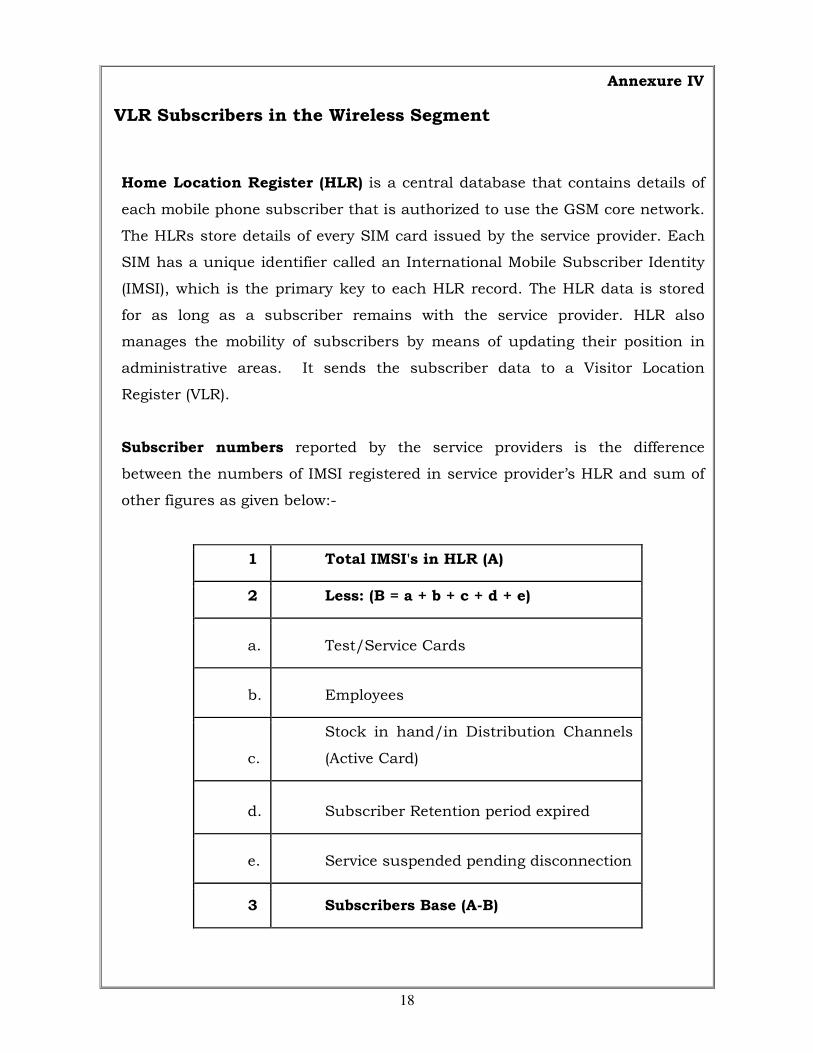
Annexure IV
VLR Subscribers in the Wireless Segment
Home Location Register (HLR) is a central database that contains details of
each mobile phone subscriber that is authorized to use the GSM core network.
The HLRs store details of every SIM card issued by the service provider. Each
SIM has a unique identifier called an International Mobile Subscriber Identity
(IMSI), which is the primary key to each HLR record. The HLR data is stored
for as long as a subscriber remains with the service provider. HLR also
manages the mobility of subscribers by means of updating their position in
administrative areas. It sends the subscriber data to a Visitor Location
Register (VLR).
Subscriber numbers reported by the service providers is the difference
between the numbers of IMSI registered in service provider’s HLR and sum of
other figures as given below:-
1 Total IMSI's in HLR (A)
2 Less: (B = a + b + c + d + e)
a. Test/Service Cards
b. Employees
c.
Stock in hand/in Distribution Channels
(Active Card)
d. Subscriber Retention period expired
e. Service suspended pending disconnection
3 Subscribers Base (A-B)
19
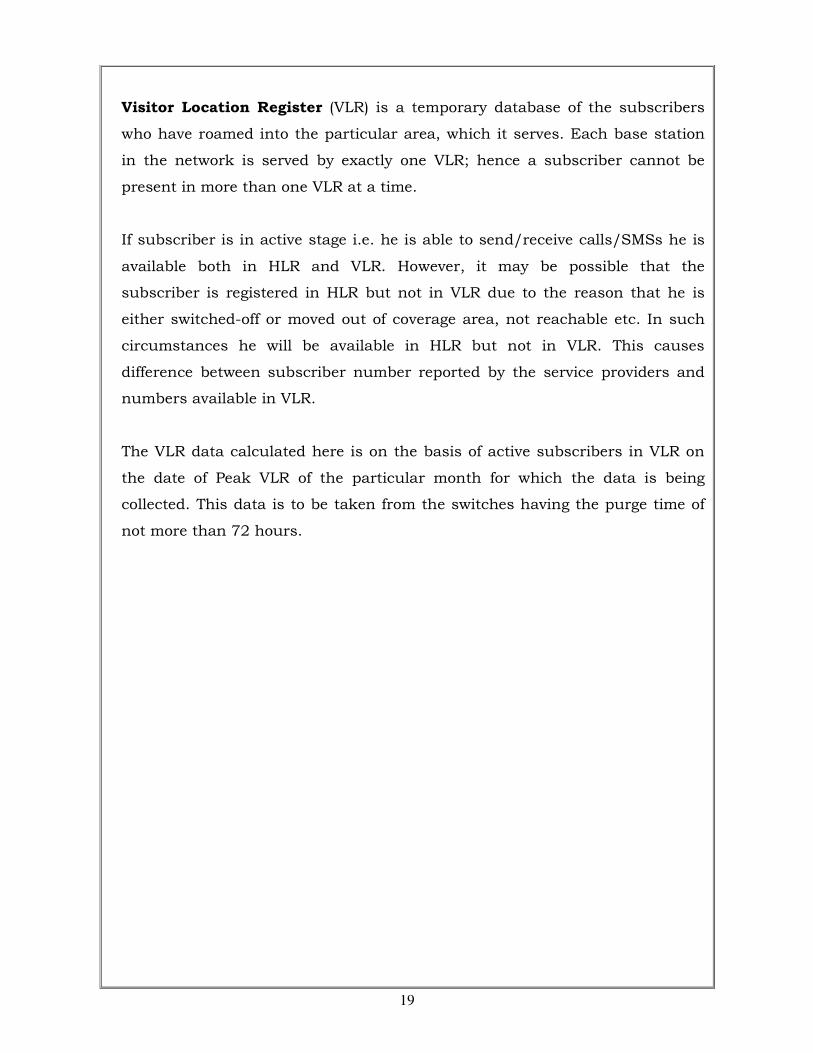
Visitor Location Register (VLR) is a temporary database of the subscribers
who have roamed into the particular area, which it serves. Each base station
in the network is served by exactly one VLR; hence a subscriber cannot be
present in more than one VLR at a time.
If subscriber is in active stage i.e. he is able to send/receive calls/SMSs he is
available both in HLR and VLR. However, it may be possible that the
subscriber is registered in HLR but not in VLR due to the reason that he is
either switched-off or moved out of coverage area, not reachable etc. In such
circumstances he will be available in HLR but not in VLR. This causes
difference between subscriber number reported by the service providers and
numbers available in VLR.
The VLR data calculated here is on the basis of active subscribers in VLR on
the date of Peak VLR of the particular month for which the data is being
collected. This data is to be taken from the switches having the purge time of
not more than 72 hours.


![main.trai.gov.in Cable Network[P] Limited.pdf · BY EMAIL TO pradvbcsôtrai.qov.in I vk.aqanwal@trai.qov.in Dated: 15.11.2016 To, Shri. Sudhir Gupta Secretary TRAI Telecom Regulatory](https://img.pdfslide.us/doc/110x75/5e74d4ca399d5642780fd86b/maintraigovin-cable-networkp-by-email-to-pradvbcstraiqovin-i-vkaqanwaltraiqovin.jpg)