Embed Size (px)
Citation preview
Assessing the reliability of plant-wax markers to delineate diet choice and feed efficiency in beef heifers
Napoleón Vargas Jurado
Thesis submitted to the faculty of the Virginia Polytechnic Institute and State University in partial fulfillment of the requirements for the degree of
Master of Science
In Animal and Poultry Science
Ronald Lewis Mark McCann
Benjamin Franklin Tracy
July, 24th, 2012 Blacksburg, Virginia
Keywords: Beef cattle, diet choice, feed efficiency, grazing, plant-wax markers
Assessing the reliability of plant-wax markers to delineate diet choice and feed efficiency in beef heifers
Napoleón Vargas Jurado
ABSTRACT
Estimating feed efficiency in grazing environments is challenging due to difficulties in
quantifying food intakes and diet choices in free-grazing animals. The plant-wax marker
technique may be a useful tool to redress this problem. However, its reliability needs to
be validated before its wider application. This study was designed to assess the reliability
of plant-wax markers for estimating botanical composition of test diets, and diet choices
in beef cattle, and provided opportunities to evaluate efficiency in growing heifers. To
test estimation of botanical composition, samples of red clover and fescue hay were
mixed to form test diets containing 0-100% of either forage. To test estimation of diet
choices, 24 heifers from large and moderate frame size lines were evaluated at two
instances. Cubed red clover and fescue hays were offered ad libitum. After an
acclimation period, feed intakes and body weights were collected for 10 days; fecal
samples were collected for the final 5 days. Hydrocarbons and alcohols were quantified
with gas chromatography. Estimates were based on least squares. Operator expertise
affected measured concentrations of shorter-chained n-alkanes (P<0.041) and long-chain
alcohols (P<0.02). Still, overall reliability of the technique was unaffected. Large and
moderate framed animals did not differ in efficiency (P>0.05), although large framed
animals had increased red clover intakes (P<0.01). Once corrected for fecal losses of n-
alkanes, diet choices were estimated accurately. Plant-wax markers provided reliable
estimates of botanical composition of diets, and diet choices of animals, suggesting it is a
valuable tool to assess efficiencies of grazing cattle.
iii
DEDICATION This work is dedicated to my parents Napoleón Vargas Palacios and Mirian Jurado, who
have given me their absolute support during this time. It is also lovingly dedicated to my
soul mate and best friend Paulina Arboleda for her unconditional support, and is also
dedicated to my brothers Andrés and Alejandro Vargas.

iv
ACKNOWLEDGEMENTS
There are a number of people without whom this work would have not been
possible and for whose guidance and help I am greatly thankful.
Above all, I would like to thank my parents, my brothers and my fiancée Paulina
Arboleda for their unconditional love, support, and encouragement that helped me
navigate throughout this journey. I would also like to thank my family and friends, in
Ecuador, in the US and in Canada, whose kind words and thoughts I cherish.
This thesis would not have never been possible without the help, guidance, and
knowledge of my advisor Dr. Ron Lewis, who kindly provided me not only with insights
that allowed me to best sort out challenges that arose during the elaboration of this work,
but also with tools that certainly will help me overcome future challenges in my career.
Observations, comments and advice from Dr. Mark McCann, and Dr. Ben Tracy have
been valuable for the development of my thesis, for which I am very grateful.
I am very grateful for the time, effort and help that I received from Amy Tanner,
Sarah Blevins, Jessica Rich, during my experimental work, and for the friendship of Gabi
Marquez and Joe Emenheiser.
Finally, I would like to acknowledge the financial, academic and technical
support of Virginia Tech, the Graduate School and the Department of Animal Science,
that provided the necessary financial support for this project. In addition I am extremely
thankful for the financial support and assistantship of the Fulbright-Senescyt program in
Ecuador, especially for the scholarship that I was awarded, that provided me with the
financial means to complete my degree.
v
TABLE OF CONTENTS Chapter 1 INTRODUCTION ..................................................................................................................... 1
Chapter 2 LITERATURE REVIEW ......................................................................................................... 3
FEED INTAKE ......................................................................................................................... 3
Factors regulating feed intake .................................................................................................. 3
Mature weight ................................................................................................................... 3
Metabolic size.................................................................................................................... 4
Diet quality ............................................................................................................................. 5
ADF and NDF ......................................................................................................................... 5
Protein content ........................................................................................................................ 6
FEED EFFICIENCY ................................................................................................................ 6
Residual feed intake............................................................................................................. 7
Feed conversion ratio................................................................................................... 8
Genetics of feed efficiency .......................................................................................... 8
PREDICTION OF FEED INTAKE ......................................................................................... 9
Quantitative prediction of intake ............................................................................................ 10
Prediction of feed intake using fecal markers ........................................................................ 11
Chromic Oxide ..................................................................................................... 11
Ytterbium ............................................................................................................. 12
n-alkanes, long-chain alcohols and long-chain fatty acids ..................................... 13
N-ALKANES AND LONG-CHAIN ALCOHOLS ................................................................. 14
n-alkanes ............................................................................................................................... 14
Long-chain alcohols .............................................................................................................. 15
Within plant and seasonal variation of the concentration of n-alkanes and LCOH ...... 16
Dosing strategies of even-chain n-alkanes.................................................................. 16
Fecal recovery ........................................................................................................... 18
Fecal sampling scheme .............................................................................................. 19
Digestibility of the diet .............................................................................................. 19
FORAGE PREFERENCE / DIET COMPOSITION ............................................................. 20
vi
PROJECT OVERVIEW AND HYPOTHESES...................................................................... 24
Chapter 3 Using n-alkanes and long-chain alcohols to estimate botanical composition in simple forage
mixtures: effect of the operator and type of marker used...................................................... 36
ABSTRACT ............................................................................................................................ 37
Keywords .............................................................................................................................. 37
INTRODUCTION ................................................................................................................... 37
MATERIALS AND METHODS ............................................................................................ 39
Preparation of forage mixtures .............................................................................................. 39
Operators.............................................................................................................................. 40
Alkane and LCOH extraction................................................................................................ 40
GC Analysis ......................................................................................................................... 40
Estimation of diet compositions ............................................................................................ 42
Statistical analysis ................................................................................................................ 42
Operator differences ........................................................................................................ 42
Estimation of forage mixtures ............................................................................... 43
RESULTS ................................................................................................................................ 44
Operator effect on n-alkane and LCOH concentration ............................................................ 45
Principal component analysis................................................................................................. 45
Estimation of diet composition .............................................................................................. 46
Kulczynski Similarity Index ................................................................................... 46
DISCUSSION .............................................................................................................. 47 Operator effect ...................................................................................................................... 47
Estimation of forage mixtures ................................................................................................ 48
Kulczynski Similarity Index values ........................................................................... 49
IMPLICATIONS .................................................................................................................... 49
ACKNOWLEDGEMENTS .................................................................................................... 50
REFERENCES ........................................................................................................................ 50
Chapter 4 Estimation of feed intake and diet choice in beef cattle using n-alkanes: validation of their
reliability in indoor studies ..................................................................................................... 61
vii
ABSTRACT ............................................................................................................................ 61
Keywords .............................................................................................................................. 62
INTRODUCTION ................................................................................................................... 62
MATERIALS AND METHODS ............................................................................................ 63
Animals ................................................................................................................................ 63
Experimental layout.............................................................................................................. 64
Feeding strategy ................................................................................................................... 64
Grass cubes...................................................................................................................... 64
Bucket position ................................................................................................................ 65
External markers dosing strategy .......................................................................................... 65
Fecal collection .................................................................................................................... 66
Laboratory analyses .............................................................................................................. 66
n-alkane and LCOH extraction ......................................................................................... 66
Gas chromatography analysis ........................................................................................... 67
Derived variables .................................................................................................................. 68
Feed efficiency ................................................................................................................ 68
Estimation of diet composition ......................................................................................... 68
Statistical analysis ................................................................................................................ 69
Observed feed intake ....................................................................................................... 69
Repeatability of feed intake and diet choice .......................................................... 70
Feed efficiency ..................................................................................................... 70
Estimation of and diet choice with the n-alkane technique .................................... 71
RESULTS ................................................................................................................................ 72
n-alkane concentration ........................................................................................................... 72
Observed feed intake ............................................................................................................. 73
Repeatability of feed intake ................................................................................................... 73
Repeatability of diet choice ................................................................................................... 73
Feed efficiency ...................................................................................................................... 74
Estimated diet choice ............................................................................................................. 75
DISCUSSION .............................................................................................................. 76 Observed feed intake ............................................................................................................. 76
Observed diet choice ............................................................................................................. 76
Feed efficiency .......................................................................................................... 77
n-alkane content .................................................................................................................... 78
viii
Estimated diet choice ................................................................................................. 78
CONCLUSION ....................................................................................................................... 79
ACKNOWLEDGEMENT ...................................................................................................... 79
LITERATURE CITED ........................................................................................................... 80
Chapter 5 CONCLUSIONS ..................................................................................................................... 99
Summary .............................................................................................................................. 99
REFERENCES ...................................................................................................................... 101
ix
LIST OF FIGURES
Figure 3.1. A biplot showing the two forage species on a two-dimensional space derived from
principal component analyses based on n-alkanes (C27, C29, C31, and C33) and LCOHs
(C26.OL, C28.OL, and C30.OL)............................................................................................ 58
Figure 3.2. Plots of regressions of estimated on observed fescue proportions, with 95%
confidence (shaded gray) and prediction limits (dotted line), for operator and set of markers:
operator one with test diets botanical compositions estimated based on n-alkanes, LCOH and
their combination (A, C, E); operator two with test diets botanical compositions estimated
based on n-alkanes, LCOH, and their combination (B, D, F). The coefficients and r2 values for
the fit of each regression is also shown. ................................................................................ 59
Figure 4.1. Schematic of the experimental period .................................................................. 93
Figure 4.2. Observed DMI at post-weaning vs. yearling age, in large (white diamonds) and
moderate (black circles) frame size heifers. The solid lines represent the linear fit for large
frame size, and the broken line represents the linear fit for moderate frame size. .................... 94
Figure 4.3. Observed proportions of red clover in diet post-weaning vs. yearling age, in large
(white diamonds) and moderate (black circles) frame size heifers. The solid lines represent the
linear fit for large frame size, and the broken line represents the fit for moderate frame size ... 95
Figure 4.4. Cumulative difference in DMI of red clover and fescue vs. day at two ages (post-
weaning, at approximately 260 days of age, and yearling). The solid line is for the large frame
size, and the broken line for the moderate frame size, heifers ................................................. 96
Figure 4.5. Cumulative DMI vs. cumulative difference in DMI between red clover and fescue,
from animals belonging to large (white diamonds and solid line) and moderate (black circles
and broken line) frame size categories ................................................................................... 97
Figure 4.6. Observed vs. estimated red clover proportions in the diet selected by heifers
offered a choice of cubed red clover and cubed fescue ........................................................... 98
x
LIST OF TABLES
Table 2.1. Means and heritabilities for FCR and related traits ................................................ 26
Table 2.2. Correlations between voluntary food intake and chemical composition of seven
forage species and digestibility .............................................................................................. 27
Table 2.3. Forage n-alkane concentration (mg/kg DM) for grass and legume species ............. 28
Table 2.4. Mean concentration of long-chain fatty alcohols (mg/kg DM) in some forage
species................................................................................................................................... 29
Table 2.5. Recovery rates (proportion of the mean) for various n-alkanes in the gastro-
intestinal tract, and feces in sheep .......................................................................................... 30
Table 2.6. Methods for dosing n-alkanes for use in feeding trials ........................................... 31
Table 2.7. Coefficient of determination for preference of dairy cattle over various forage
families based on chemical composition ................................................................................ 32
Table 2.8. Preference index for selectivity of forage species .................................................. 33
Table 2.9. Proportion of legume (%) in the diet of various species ......................................... 34
Table 2.10. Correlation coefficients between selection index and sward composition
parameters ............................................................................................................................. 35
Table 3.1. Proportion of the two forage species in the mixed diets ......................................... 54
Table 3.2. Mean n-alkane and long-chain alcohol (LCOH) concentration (mg/kg DM) for
fescue and red clover ............................................................................................................. 55
Table 3.3. P-values from the ANOVA analysis on measured n-alkane and long-chain alcohols
(LCOH) concentrations ......................................................................................................... 56
Table 3.4. P-values and least squares means associated with effects of set of markers
and operator for Kulczynski Similarity Index values .................................................. 57
Table 4.1. Mean body weight (BW) and metabolic body weight (MBW) for animals
corresponding to moderate and large frame sizes at two ages (post-weaning, at approximately
260 days, and yearling) .......................................................................................................... 84
Table 4.2. Chemical composition (expressed as percentages) of the forages and feeds used ... 85
Table 4.3. Fecal correction factors (proportion recovery) used for the estimation of diet choice
using the n-alkane technique .................................................................................................. 86
xi
Table 4.4. n-alkane concentration (mg/kg DM) for forages and feeds used in the experiments
.............................................................................................................................................. 87
Table 4.5. Least squares means for daily total dry matter intake (DMI, red clover plus fescue),
and red clover and fescue DMI separately, for beef heifers from moderate and large frame sizes
at two ages (post-weaning, at approximately 260 days of age, and yearling), and physical
position of the feeding buckets ............................................................................................. 88
Table 4.6. Least squares means for three efficiency traits, feed conversion ratio (FCR), average
daily gain (ADG), and Kleiber ratio (KR) in beef heifers from moderate and large frame scores
at two ages (post-weaning, at approximately 260 days of age, and yearling) ........................... 89
Table 4.7. Parameter estimates for the regression of estimated on observed red clover
proportion based on three different correction factors for incomplete fecal recovery,
and without corrections for incomplete fecal recovery (no correction) ........................ 90
Table 4.8. Mean KSI values and significance for the scenarios used, and correction
factors for incomplete fecal recovery ......................................................................... 91
xii
LIST OF ABBREVIATIONS Item Term
ADF Acid Detergent Fiber
ADF Average daily gain
AIA Acid Indigestible Ash
ANOVA Analysis of Variance
ARC Agricultural Research Council
BW Body weight
CP Crude protein
CWC Cell Wall Constituents
D1 Once a day dosing
D2 Twice a day dosing
DM Dry Matter
DMD Dry Matter Digestibility
DMI Dry Matter Intake
DMI1 Dry matter intake from study 1
DMI2 Dry matter intake from study 2
ERCP Estimated Red Clover Proportion
FCR Feed conversion ratio
FS Frame Size
GC Gas Chromatography
I-ADF Indigestible ADF
KR Kleiber ratio
KSI Kulzcynski Similarity Index
LCFA Long Chain Fatty Acids
LCOH Long Chain Alcohols
MBW Metabolic Body Weight
MPE Mean Prediction Error
NDF Neutral Detergent Fiber
NE Net Metabolizable Energy
N-NO3 Nitrate nitrogen
NRC National Research Council
ORCP Observed Red Clover Proportion
xiii
PC1 Principal component 1
PC2 Principal component 2
PCA Principal Components Analysis
RCP1 Red clover proportion from study 1
RCP2 Red clover proportion from study 2
RFI Residual Feed Intake
RMPE Relative Mean Prediction Error
SPE Solid Phase Extraction
SRF Standard Response Factor
SVAREC Shenandoah Valley Agricultural Research and Extension Center
WSC Wall Soluble Carbohydrates
1
CHAPTER 1
INTRODUCTION
Providing feed to cattle is the single largest expense in most commercial beef production enterprises, and
thus any effort toward improving the efficiency of feed use will help reduce input costs (Arthur et al.,
2001). Profitability is the main goal of an animal production system, and it is a function of both the inputs
and outputs. Therefore, in order to accurately determine the profitability of any animal production system,
the components of the inputs and outputs must be known. Most of the constituents related to management
such as labor, facilities and equipment are easily identifiable; however, others such as feed intake are
challenging to quantify.
Feed efficiency characterizes the ability of an animal to use the feed it is offered, and transform it into a
valuable product, such as meat or milk. In order to effectively select for more efficient animals, feed
intake must be adequately estimated. Food intake and feed efficiency have been properly assessed for
some species in controlled environments, such as poultry and swine; however, under normal conditions in
many beef cattle systems, both feedlot and pasture-based, animals are allowed to eat ad libitum. While in
feedlot systems production costs can be fairly estimated, in pasture based systems it is difficult to estimate
the real costs of production, as there is no accurate measure of forages being eaten. These challenges
increase when there is more than one feed offered, as it is the case in animals managed under range or
grazing conditions (Archer, 1999).
Genetic selection for growth in beef cattle has led to animals having larger mature sizes (live weights),
therefore increasing the animals’ requirements for energy and protein to meet metabolic needs. This has
resulted in increased feed intakes, likely having an effect on overall efficiency (Vargas, et al. 1999;
Konaroglu and Hoffman, 2010).
Efforts to assess diet intake of ruminants in free range conditions have led to the use of markers, such as
chromic oxide and plant waxes. Plant cuticular waxes have been successfully used as a tool to predict
feed intake. When used as fecal markers they have been shown to be valuable for estimating diet
composition and digestibility of the diet in a variety of mammalian herbivores, including sheep, goats,
2
and dairy cattle (Dove and Mayes, 2005; Hameleers and Mayes, 2008). However, application of this
technique has been limited in beef cattle.
Although there are some limitations when using this procedure, it has been shown to be robust and useful
in predicting feed intake. Despite the body of literature that supports the validity of this technique, it
could become meaningless if it does not incorporate conditions pertinent to those of the producers or the
industry to which is aimed (e.g., plant species found in the zone, breeds of animals commonly found in
production systems). It is important then to validate the accuracy of a technique that allows not only feed
intake to be estimated, but also diet choice. Such validation must first be done under controlled
conditions, before the technique is applied to grazing animals.
This literature review addresses the prediction of feed intake and diet choice using plant waxes,
specifically n-alkanes and long chain alcohols, as fecal markers. In addition, aspects in both the
methodology and the application of these techniques, as well as the limitations and considerations
necessary for this technique to be useful, are detailed. Finally, the objectives and hypotheses pertaining to
the application of this methodology to delineate feed efficiency in conditions common to beef cattle
systems in the Appalachians are discussed.
3
CHAPTER 2
LITERATURE REVIEW
FEED INTAKE
Feed intake, along with feed quality, determines total nutrient consumption by the animal, and thus is the
foundation for animal production (Vallentine, 2001).
Factors regulating feed intake
According to Dulphy and Demarquilli (1994), the two main factors determining feed intake are the
characteristics of the forage offered, such as physical, chemical and organoleptic qualities, and the intake
capacity of the animal. Most of the mechanisms regulating dry matter intake involve a series of metabolic
pathways as well as physical constraints leading to energy balance in the animal, which can be easily
affected not only by the characteristics of the diet, but also by the feeding time (Illius and Jessop, 1996;
Nikkhah, 2011). Disruptions to these mechanisms may result in loss of performance or metabolic distress
(NRC, 1987; Forbes, 2007). Vallentine (2001) described several factors that influence feed intake, such
as (i) physiological or productive state (e.g., lactation, puberty), (ii) dietary factors (e.g., palatability,
digestibility), (iii) weather, (iv) management, and (v) animal anatomical factors.
In this study, it is pertinent to discuss in more depth body size and diet quality, as these may have
particular importance in the beef industry due to the trend toward increased mature weights, which in part
may be redressed by improving the pastures available for grazing.
Mature Weight
Given a source of feed that is not limiting (a good quality feed ad libitum), the intake of grazing
ruminants will be influenced by energy demands, which are dependent on the physiological state of the
animal. Energy demand and feed intake are related to live weight, live weight change (growth), and milk
production (Allison, 1985).
4
Despite several studies showing that feed intake was affected by live weight, factors other than body size
such as age and previous nutrition level may have a greater impact on feed intake even in animals of the
same breed (Allison, 1985). It has been hypothesized that animals of the same breed and age, and with
similar nutritional backgrounds, will have similar intakes. Once accounting for these factors, the true
effect of body weight on intake can be more properly assessed.
There is evidence that heavier animals will have higher total energy demands compared to lighter animals
of the same type, and in the same physiological stage, thus requiring more feed to meet those demands
(e.g., higher dry matter intake)(Forbes, 2007). If feed efficiency were to be assessed without accounting
for differences in body, or metabolic, weight, inferences may be inaccurate if not incorrect.
Metabolic size
To account for differences in body size, several authors suggested methods to standardize and describe
metabolic rate (heat production in fastened animals or basal metabolism) and body size for various
species including cattle, sheep, and mice. Through various experiments, Brody and Procter (1932)
obtained the following equation:
푀 = 70.4푊 . , [1]
where M is metabolic size, and W represents live weight. Kleiber (1947) on the other hand, maintained
that the relationship between body weight and metabolic rate was 푊 . and that this form was preferably
since it was easier to calculate. Even though initially 푊 . was widely accepted by most scientist
including the NRC, nowadays BW0.75 is most commonly used as studies showed no systematic error when
expressing body weight with either power (Blaxter and Wainman, 1966). However, the biological
estimate remains 0.734, and with modern computers it is no longer a difficulty to work with logarithms,
and thus the ‘true’ estimate should be used. It has been suggested that the energy needs per unit of weight
for smaller animals are greater than those for larger animals (Allison, 1985). The use of metabolic weight
therefore allows comparisons to be made regarding energy needs for animals of different body weight,
which would otherwise not be possible (Kleiber, 1947).
5
Diet Quality
Another important factor effecting feed intake is diet quality. Digestibility of the forages, mainly neutral
detergent fiber (NDF) and acid detergent fiber (ADF) contents, affects intake and preference for different
forages species. Cattle will select forages with a lower ADF, and thereby lower cellulose content (Allison,
1985). Having a general understanding of how these characteristics relate to feed intake is therefore of
considerable importance.
ADF and NDF Content
Acid detergent fiber is a measure of a portion of plant cell walls that includes cellulose, lignin, acid
insoluble ash, and silica (Van Soest, 1991; Beauchemin, 1996). Prediction of voluntary dry matter intake
based on ADF alone was poor as observed by a low coefficient of determination (푟 = 0.40), in studies
using lambs fed mixed diets (Kursli and Russel, 2002). Indigestible ADF (I-ADF) has also been used to
predict feed intake in grazing studies. However, due to its moderately low correlation with dry matter
intake (DMI) (r = 0.37), it also is considered a poor predictor of feed intake (Mendoza et al., 1995).
Neutral Detergent Fiber is a measure of the insoluble fiber found in feeds and consists of the cross linked
matrix of plant cell walls and coarse fibers that forms the rumen mat that stimulates rumen function. The
main components of NDF are cellulose, hemicellulose, and lignin (Van Soest et al., 1991). It traditionally
has been proposed an indicator of intake and gastrointestinal fill (Mertens, 1973; Van Soest et al., 1991).
However, Arelovich et al. (2008) found that NDF was not a consistent predictor of voluntary intake in
dairy and beef cattle. Using regression analyses, they estimated in beef cattle that DMI increased as NDF
content of the forage increased from 7.5% to 35.3% (r2=0.965); conversely, in dairy cattle, DMI
decreased as NDF content increased from 22.5% to 45.8% (r2=0.672). These results suggested that in
animals with different levels of production, and thus with different energy requirements, the effect of
fiber content on DMI will differ appreciably. On the other hand, NDF appears not to be a good enough
6
predictor of DMI when used alone, as shown by the range of the correlation coefficient, which may range
from -0.65 to -0.31 (Decruyenaere et al., 2009).
Protein Content
It has been hypothesized that animals will eat in order to maximize their production potential, although
this may be limited by some constraints such as the quality of the feed and the capacity or volume of the
gut (Decruyenaere et al., 2009). It follows that feeds with different levels of nutrients will affect DMI. For
instance dietary protein influences digestibility of the diet because bacteria in the rumen need nitrogen to
meet their particular needs (Van Soest, 1991). A relationship between the amount of protein in the diet
and DMI should therefore be expected.
Nevertheless, contradictory results have been encountered. Young animals tended to select forages with
higher crude protein levels (Allison et al., 1985), and in sheep feed intakes markedly decreased when
crude protein levels were below 7%. Similarly, Bond et al. (1962) found that Angus cattle had higher
intakes when crude protein contents increased in the diet from 5.0% to 13.4%; DMI increased from 0.44
kg of intake/kg of weight with the lowest level, to 0.76 kg of intake/kg of weight with the highest level.
Comparable outcomes were observed when cattle were fed silage of Beardgrass (Brachiaria sp.) with a
crude protein content of 90 g/kg of DM supplemented with concentrate, with crude protein contents
ranging from 159.6 to 334.9 g/kg of DM. Increasing levels of concentrate resulted in increasing DMI
(Pereira et al., 2008). This suggests the protein level of the diet may have a more noticeable effect on
DMI when poor quality forage is the main component of the diet. On the other hand, Obeid et al. (2006)
found that DMI was not affected by levels of protein in the diet ranging from 9% to 15% in young Zebu
bulls.
FEED EFFICIENCY
In general, feed efficiency of an animal system could be considered as the production of a desired effect
(product) with a minimum of input and measured as the ratio of output to input (Trenkle and Willham,
7
1977). Efficiency can be measured in a number of ways, of which gross efficiency and feed conversion
ratio have been most widely used. Gross efficiency is defined as the ratio of production outputs (i.e.,
animal products) and feed inputs (i.e., herbage consumed), and can be expressed in terms of ratios of
either fresh or dry weights of forage or some constituent of the diet (e.g. energy, nitrogen) and animal
product (Hodgson et al., 1979; Archer, 1999). Partial efficiency is defined as the ratio of weight gain to
feed after the maintenance requirements have been subtracted (Archer, 1999). Alternatively, feed
conversion ratio, usually represents feed intake per unit of weight gain (Arthur et al., 2004).
Although other measures of efficiency have been proposed, those related to feed intake are the most
pertinent to this study, and therefore will be discussed in more detail.
Feed efficiency has been shown to be correlated with other traits such as live weight and growth rate,
suggesting that analysis of feed intake alone likely is not sufficient when characterizing overall efficiency.
Other measures such as residual feed intake (RFI) and feed conversion ratio (FCR) have therefore been
derived, which relate intake to levels of production (Arthur et al., 2004).
Residual Feed intake
Also referred to as net feed efficiency, RFI measures the difference between observed and predicted feed
intake based on the requirements for body weight maintenance and level of production. It therefore
allows for testing the hypothesis that feed intake can be adjusted for a determined level of production by
partitioning intake into portions required for stage and level of production (Crews, 2005), and can be
calculated using regression analysis as:
푦 = 훽 + 훽 (퐴퐷퐺) + 훽 (퐵푊) + 푅퐹퐼, [2]
where y is daily dry matter intake (DMI), β0 is the intercept, β1 is the partial regression of DMI on average
daily gain (ADG), and β2 is the partial regression of daily intake on body weight (BW). As it will be
discussed later, BW can be adjusted to estimate the RFI based on metabolic weight.
8
Feed Conversion Ratio
One constraint when obtaining FCR and RFI is the amount of time the animals have to be measured to
obtain a reliable indicator of their intakes. A period of 28 days may be necessary in order to obtain an
accurate measure of dry matter intake, while for residual feed intake and conversion ratio, 84 days might
be necessary since they depend not only on intake but on body measurements (i.e., body weight) that
may contribute to variability (Castilhos et al., 2011). To try to reduce workload, when estimating FCR,
animals and the feed they consumed usually are weighed at the beginning and end of a phase (e.g.,
finishing); however, this may not be an appropriate approach as any trend regarding feed intake occurring
during this time would not be characterized.
Genetics of Feed efficiency
When trying to explain feed intake, animals of similar genetic background should be used in order to
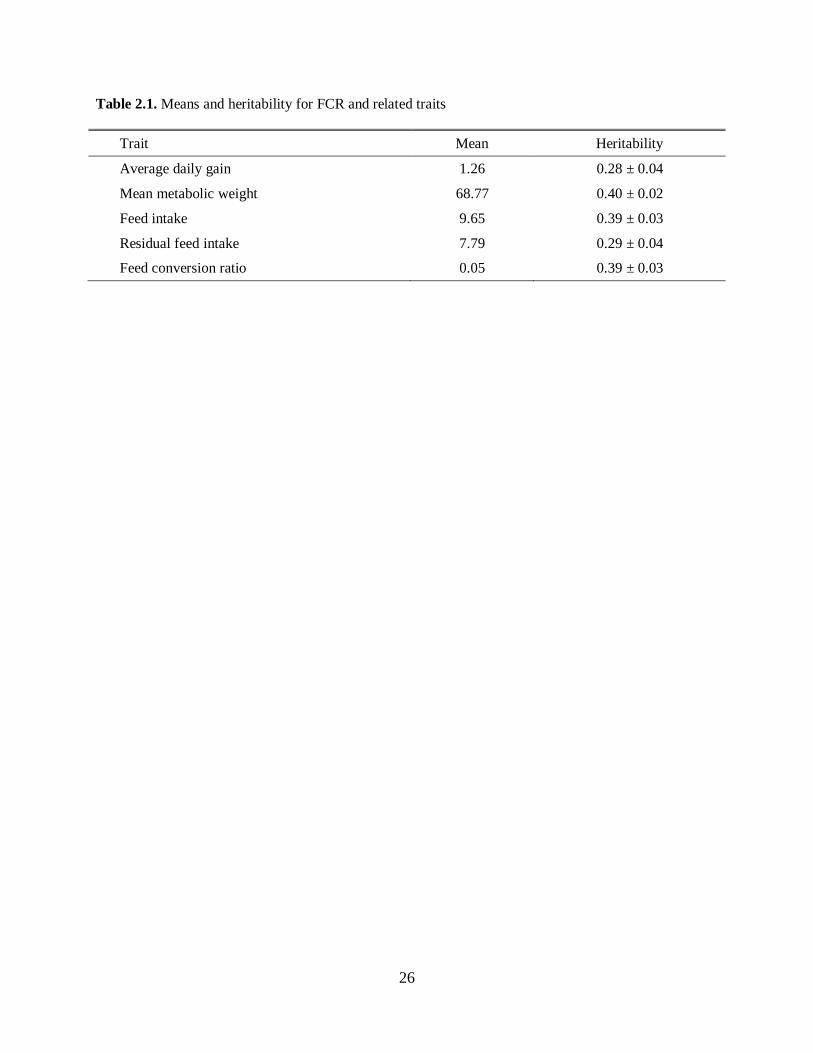
minimize extraneous sources of variability. Table 2.1 (adapted from Arthur et al. (2001)) shows estimates
for means and heritabilities for some feed efficiency related traits in young Charolais bulls:
Please place Table 2.1 about here
Because the heritability for these traits is moderate, there is an opportunity to improve traits related to
feed efficiency, such as residual feed intake, and feed conversion ratio.
In addition, there is a good body of evidence indicating that feed intake and FCR are phenotypically and
genetically correlated with measures of growth and thus body size (Crews, 2005). Estimates of
phenotypic correlations between FCR, weight, and weight gain range from -0.24 to – 0.75, which indicate
that improving efficiency in size and performance, will result in a decrease in FCR (Koots et al., 1994).
9
PREDICTION OF FEED INTAKE
In order to determine the amount of feed to offer to a group of animals it is important to have a means to
accurately predict what those animals will require to satisfy their needs, thus, prediction of feed intake
becomes important as it allows of determination of feed utilization.(Dulphy and Demarquilly, 1994).
Many methods have been developed and studied for the prediction of feed intake, but due to the
variability of the source of feed (many forage species in a sward) there are challenges that need to be
overcome (Fraser et al., 2006).
According to Dulphy and Demarquilly (1994), intake of forages depends largely on the capacity of the
rumen, with its fill dependent on the proportion of plant cell walls, or crude fiber, found in the forages
consumed. This suggests that besides rumen volume, the chemical composition of the forages could be
used for prediction of feed intake.
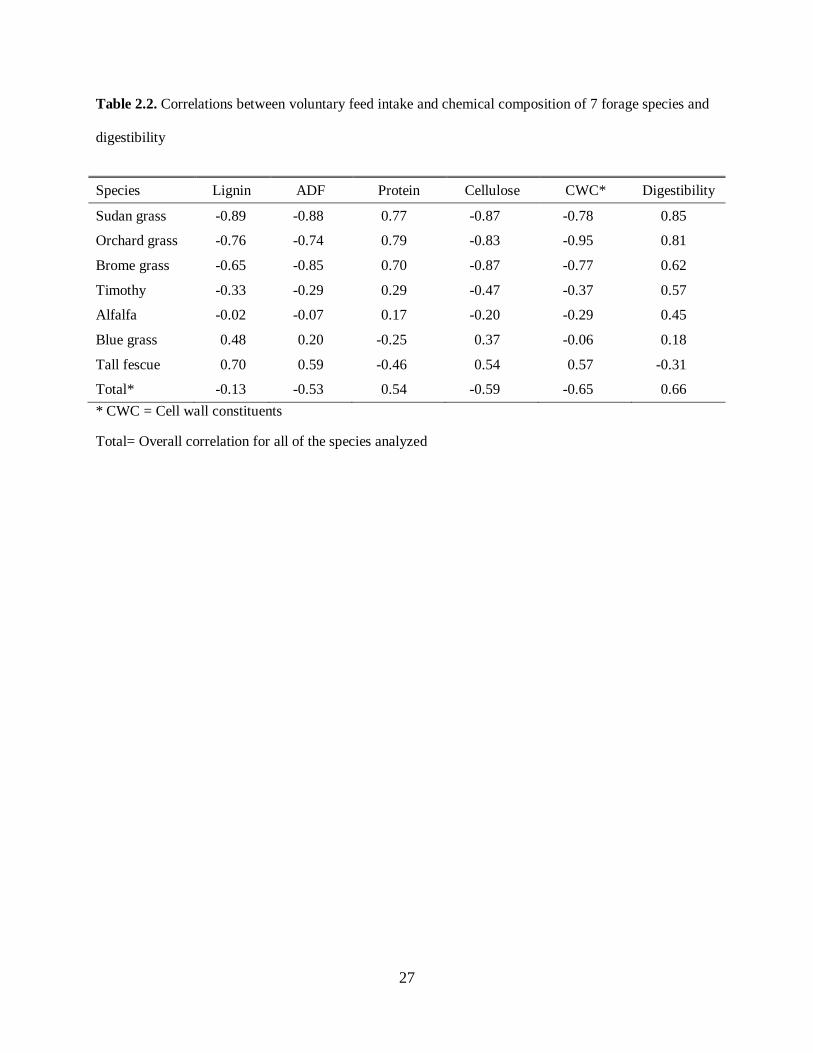
However, in comparison to intake, lignin, ADF, and cell wall constituents have been found to be better
related to digestibility. Table 2.2, adapted from Van Soest (1965), summarizes the correlation between
voluntary feed intake, and nutrient characteristics and digestibility in 7 forage species.
Please place Table 2.2 about here
As mentioned earlier NDF content and crude protein alone are not good indicators of feed intake, as the
strength of this relationship depends on the forage species and the physiological state of the animal.
However, crude protein may have an impact on DMI when its values are lower than the needs of the
rumen microbial population (Allison et al., 1985). In general, animals will tend to have higher intake of
forages with higher digestibility, as denoted by lower ADF and lignin, and higher crude protein
(Hadjigeorgiou et al., 2001).
Nevertheless, other prediction methods have focused on the characteristics of the animals, such as live
weight, energy demands, and productive state (NRC, 1987). These methods yielded prediction models for
voluntary feed intake, which will be discussed in the following sections.
10
Quantitative prediction of intake
Several authors have proposed mathematical models for predicting intake that take into consideration
animal factors, such as body weight and level of production, and dietary factors, such as type of forage
and level of concentrate. Still, Pittroff and Kothman (2001a) mentioned shortcomings for several models
widely used, such as those from the ARC (Agricultural Research Council, 1980) and NRC (National
Research Council, 1987). Although these models have been useful to predict DMI in controlled
conditions, they seem less applicable to grazing conditions.
The following models for prediction of feed intake were developed by the NRC (1984, 1987):
퐷푀퐼(푘푔 푑푎푦⁄ ) = 푊 . (0.1493푁퐸 − 0.046푁퐸 − 0.0196) , and [3]
퐷푀퐼(푘푔 푑푎푦⁄ ) = 푊 . (19.4 + 54.5푁퐸 ) , [4]
where W is the body weight of the animal, and NEm is the net metabolizable energy. Because of their
simplicity, they have been widely used. Nonetheless these models require refinement (adjustments) for
frame size, sex, stage of growth, as well as some other factors, to be more accurate in their predictions.
Usually tables consisting of adjustment terms are used when fitting these models, which might consider
breed, sex, age, and stage of production. Those limitations may have been the reason for the development
of a different model by the NRC in 1996 specific to growing animals:
퐼푇 = 푊∗(0.2435푁퐸푀−0.0466푁퐸푀2 −0.1128)
푁퐸푚 , [5]
which leads to very different predictions when compared with that of models [3] and [4] (Pittroff and
Kothman, 2001a). In their review, Pittroff and Kothman (2001a) concluded that many mathematical
models have serious logical or implementation problems, and most of the models are quite variable even
11
when considering the same type of animal and forage. This emphasizes the need for a technique that
allows a better understanding, description and prediction of feed intake.
Prediction of intake using fecal markers
Fecal markers have been widely used to estimate feed intake in grazing animals, since they allow
estimates to be based on intakes over longer periods and often with minimal disruption of feeding
behavior. Although many compounds have been used as fecal markers, one of the most common is
chromic oxide. As an alternative, Ytterbium has been used with the same success as chromic oxide for
estimation of fecal matter output and feed intake (Delagarde et al., 2010). More recently (since 1985),
wax-like compounds found in plants have been introduced, validated, and successfully used to estimate
and predict DMI, diet choice and digestibility in a variety of herbivore species (Dove and Mayes, 1991).
While the natural occurring n-alkanes (odd-chain) can be used to directly estimate diet choice, the
estimation of feed usually requires the administering of an even-chain n-alkane (external marker) to the
animals. However, the major concern driving not only the n-alkane method, but most fecal marker
methods is diurnal variation of these external markers. As a consequence, sporadic fecal samples might
contain quantities of the marker with different concentrations than the mean, which may lead to
inaccurate estimates of intake (Dove and Mayes, 1991). Subsequently, methods for delivering a
continuous amount of the marker have been developed and analyzed, and will be discussed in following
sections
Chromic Oxide
Chromic Sesquioxide (Cr2O3) has been traditionally accepted as one of the most reliable external
indicators of digestibility and intake (Cross et al., 1973). Studies in beef steers have demonstrated that
fecal recoveries of chromic oxide were high (up to 103%), and that recovery was not affected by external
factors such as the amount of water offered to the animals. However, there was strong evidence of diurnal
12
variation in excretion, ranging from 87% to 103% of the mean concentration (Cross et al., 1973; Lobato et
al. 1980).
Chromic oxide is administered daily to the animals, usually via gel capsules that contain between 2 and
20g of the marker, (Vargas Junior et al., 2011). A period of time is necessary for the marker to reach a
constant rate in the rumen, usually 8 days, after which fecal samples are taken (Malossini et al., 1996).
Controlled release devices for chromic oxide have been developed; however, the delivery rates between
and within animals were inconsistent (Owens and Hanson, 1992).
The chrome oxide procedure has been valuable in estimating intakes of different species including sheep,
and dairy and beef cattle. However several issues, which are common to most fecal markers, must be
considered when applying this technique: (i) chromic oxide must be mixed uniformly into the feed
(typically through some type of adherent), (ii) fecal sample collection must be continued until the entire
marker has been excreted (which is not necessary for the plant-wax marker method), and (iii) a single
value for digestibility of the forage must be adopted (Lobato et al., 1980; Owens and Hanson, 1992;
Malossini et al., 1996). Contamination of fecal samples with soil when collected from the ground may be
an issue with this technique. Ingestion of soil also may pose problems, since animals may consume up to
8% of their DMI as soil (Fries et al., 1982).
Since chromic oxide is an external marker, it is necessary to also use an internal marker for accurate
prediction of feed intake. The use of Acid Indigestible Ash (AIA) as an internal marker, with chromic as
an external marker, has shown high accuracy for predicting feed intake. Estimates of predicted feed intake
for the chromic oxide/AIA method were 5.81 kg DM/day versus the measured feed intake of 5.64 kg DM/
day (Ferreira et al., 2004). This shows that the inclusion of an internal marker for the chromic oxide
technique provides a reliable tool for estimating feed intake.
Ytterbium
Ytterbium is a rare element that has been used to estimate the dynamics of fecal output of grazing animals
including beef cattle. Fecal recoveries of Ytterbium have ranged from 86% to 144% of the mean
13
concentration; like with chromic oxide, such diurnal variation potentially could affect estimates of intake.
Stuth and Lyons (1999) used powdered Ytterbium acetate dosed daily in gelatin capsules to try to
minimize the effect of diurnal variation, with positive results.
When compared to chromic oxide with either a once or twice a day dosing scheme, fecal outputs
estimated from a twice a day dosing were more variable with Ytterbium. Predicted fecal outputs for
mature beef cows from once a day dosing were 2.87 kg DM/day for Ytterbium and 2.55 kg DM/day for
chromic oxide, while for twice a day dosing they were 2.81 kg DM/day for Ytterbium and 3.00 kg
DM/day for chromic oxide. The measured fecal output was 2.83 kg DM/day. Although the predicted
values were more variable for Ytterbium, no overall difference was detected between these two
procedures (Prigge et al., 1981). However, lower accuracy of prediction of feed intake by the Ytterbium
procedure was found when incorporated into a concentrate pellet. Dairy cattle were dosed with Ytterbium
and n-alkanes under two fecal sampling methods, fecal collection at milking time and total fecal
collection. Coefficients of determination for the n-alkane procedure were 0.97 and 0.98 for fecal sampling
at milking and total fecal collection, respectively, compared to r2 of 0.65 and 0.67 for collection at milking
and total fecal collection, respectively, for the Ytterbium procedure (Perez-Ramirez et al., 2012). This
reinforces the concept that for the Ytterbium technique, and other fecal markers, the delivery of the
marker plays an important role in the accuracy of the prediction of feed intake.
N-alkanes, Long Chain Alcohols and Long Fatty Acids
N-Alkanes have been shown to be well suited for the identification of botanical samples because they are
uniformly distributed in plants, and are highly resistant to biochemical degradation (Pietrogrande et al.,
2009). Additionally, they have been useful in the prediction of feed intake for a wide range of species,
most commonly ruminants such as cattle (Malossini et al., 1994; Hameleers and Mayes, 1998), sheep
(Lewis et al., 2003), and goats (Dove and Mayes, 2005), but also in non-ruminant herbivores such as
horses (Stevens et al., 2003) and hares (Rao et al., 2003). They have also been used to assess the
digestibility of feed components in fish (Gudmundsson and Halldorsdottir, 1993). Long chain alcohols
14
and long fatty acids also have demonstrated to be useful for predicting feed intake and diet composition in
free-ranging hervibores (Ali et al., 2005a; Ali et al., 2005b).
Since n-alkanes and long chain alcohols will be used as the basis of estimating feed intake and diet choice
in the studies planned, they will be discussed in detail in the following section.
N-ALKANES AND LONG CHAIN ALCOHOLS
Plant waxes such as n-alkanes and long chain alcohols (LCOH) exhibit the relevant characteristics of the
ideal marker remarkably well. Specifically: (i) their chemistry is fairly simple, so their analysis and
identification is easier, both in feces and plants; (ii) they are largely indigestible, so they are unaltered in
the digestive tract and can be fully recovered in the feces; this is especially true as their chain length
increases; and, (iii) the n-alkane and LCOH profiles are different among plant species (Dove and Mayes,
1991; Ali et al., 2005). This last point, however, is debatable as there is evidence of variation in n-alkane
and LCOH concentrations within different parts of the same plant, and across a season, which will be
discussed later.
N-Alkanes
The use of plant waxes, for taxonomy purposes was suggested by Tulloch (1981), with particular focus on
n-alkanes and free alcohols. These two compounds were selected due to their ease of isolation, and
because the profiles of n-alkanes and alcohols in plants were different to allow characterization of groups
or species of a certain genera (Tulloch, 1981).
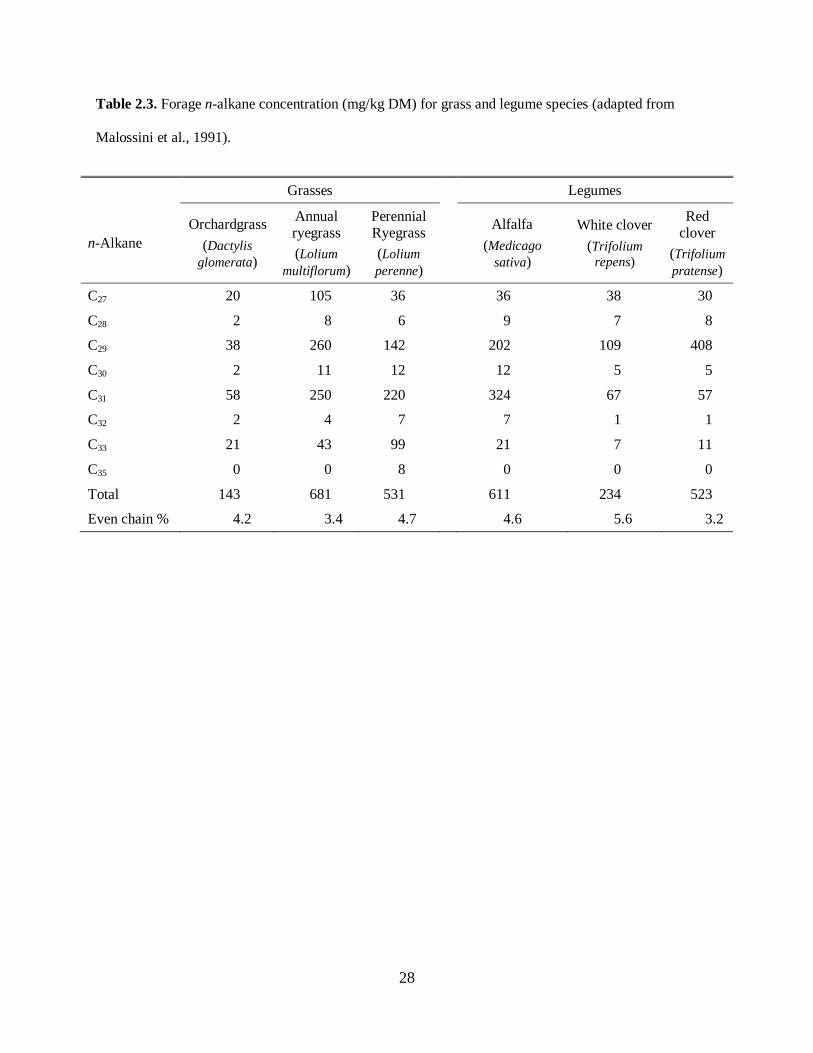
The predominant n-alkanes in most forage species are odd-chain hydrocarbons, C29 and C31, while the
proportion of even chain n-alkanes represents only 3.2% to 5.6% of the total hydrocarbons found
(Malossini et al., 1991). The n-alkane concentrations for several plant species are summarized in Table
2.3.
Please place Table 2.3 about here
15
Based on their profile of the n-alkanes C27, C29, C31 and C33, which are the most abundant and often
provide a unique signature even for species of the same genera, we can differentiate forage species. For
instance, from Table 4, the concentrations of C27, C29 and C33 for annual ryegrass are 105, 260 and 43
mg/kg DM, respectively; for perennial ryegrass the concentrations of the same n-alkanes are 36, 142 and
99 mg/kg DM, respectively. Such distinct patterns of n-alkanes make it possible to identify species of
plants in a mix sward or in a mixed diet.
Long chain alcohols
The main components of plant wax for most species are wax esters of unsaturated, unbranched LCOH
and long chain fatty acids (LCFA). Due to the analytical method used to extract and separate these
compounds, the combined ester and free alcohol concentration is used to assess digestibility and diet
composition (Dove and Mayes, 2005). Bugalho et al. (2004) mentioned challenges in effectively
separating alcohols from sterols, with risk that compounds characterized by GC as 1-C27-OL, and 1-C29-
OL may instead be sterols; that challenge may impact the utility of using LCOH to estimate diet
preferences and digestibility. Alcohols have been found to be in much higher concentrations in plants
than the n-alkanes. Kelman et al. (2005) reported that LCOH concentrations were almost an order of
magnitude higher than the n-alkane concentration for several species of forages including Lotus spp.,
Phalaris spp. and Trifolium spp. Thus, in using compound with such difference in the magnitude of their
concentrations for the estimation of diet composition, the LCOH may reduce the discriminatory power of
the n-alkanes. In such conditions, normalization of the n-alkanes and LCOH may be necessary (Ali et al.,
2005a)
As shown in Table 2.4 (adapted from Dove and Mayes (2005)), the most common LCOH range in length
between C24 and C34, although small concentrations of longer chains have been found (up to C64). The
variation found in LCOH concentrations for different species and for different chain lengths, and high
recovery rates, make them a valuable tool for delineating diet composition.
16
Please place Table 2.4 about here
Within-plant and seasonal variation of the concentration of n-alkanes and LCOH
As mentioned previously, one of the characteristics of an ideal marker is large between species, yet small
within-species, variation in its concentration. Nonetheless, several authors (e.g., Malossini, 1991; Dove
and Mayes, 1991, 2005) suggest variation in n-alkane and LCOH concentrations exists among plant parts
within a species due to phenological state (e.g., vegetative vs. reproductive). For most grasses, the onset
of reproductive states involved a decrease in C31, and an increase in C29 concentration (Dove and Mayes,
1991). This additional variability has to be taken into account when designing experiments which involve
measurements that extend over time as this might lead to biased predictions. Specifically, n-alkanes with
less discriminatory potential for spring were C25, C26, C27, C28, and C29, for summer C26, C27, C28, C29, C30,
and for winter C25, C26, C27, C28 and C29 (Côrtes et al., 2005). This suggests that not every n-alkane
provides useful discriminatory information in all seasons, and that selecting a different group of n-alkanes
for each season may be appropriate.
Moreover, beyond variation in the content of the wax constituents due to stage of development,
differences exist among parts of the same plant. In tropical grasses it was found that there were significant
differences between n-alkane concentrations in leaves versus stems (Dove and Mayes, 1991). Therefore,
in order to address these variations within plants, an appropriate sampling and analysis of each part of the
forage may be necessary.
One of the advantages of the plant wax procedure is that n-alkanes and LCOH in general are not readily
digestible, especially as their chain length increases. Where absorption occurs, it tends to be restricted to
the small intestine. Recovery rates of n-alkanes of different chain lengths in sheep dosed once a day with
n-alkane shredded paper are shown in Table 6 (adapted from Dove and Mayes (1991)).
Please place Table 2.5 about here
17
Although losses in n-alkanes occur during digestion (Table 2.5), those losses decrease with an increase in
chain length. Therefore, a focus on longer-chain n-alkanes should improve recovery rates, and increase
prediction accuracy.
Dosing strategies with even-chain n-alkanes
The use of a dosed n-alkane as an external marker allows for feed intake to be predicted based on the
ratios of odd-chain (found in forages) to even chain (dosed C32 or C36) n-alkanes recovered in feces. This
approach appears to provide accurate predictions, as the ratios of C31:C32, and C33:C32, seem to be more or
less consistent over time. In addition, estimates of recoveries can be made from these ratios, thus there is
no need for total fecal collection (Lewis et al., 2003; Charmley and Dove, 2007).
In order to minimize diurnal variation in n-alkane recovery rates, several methods of delivery have been
suggested by Dove and Mayes (2005), which are described in Table 2.6.
Please place Table 2.6 about here
Among the methods mentioned in Table 6, several have shown positive results. Mann and Stewart (2004)
suggested that dosing of C32 should be performed every 12 hours when used in Xanthan gum, in order to
have more reliable results. According to Perez-Ramirez (2012), the use of C32 dissolved in heptane and
incorporated into a cellulose stopper provided an effective method for obtaining a consistent recovery rate
of the markers, even with varying feeding levels. However, the use of a controlled-release device for n-
alkane dosing has been less successful, with differences between the manufacturer’s release rates and the
actual release rates (Ferreira et al., 2004). Thus, differences in predicted DM intake were found when
using the manufacturer’s release rates for C32, and the calculated (actual) release rates: 6.59 kg DM/day
versus 5.78 kg DM/day, respectively; the actual DM intake was 5.64 kg DM/day.
In relation to the use of LCOH as fecal markers, the same dosing methods as with n-alkanes may be used.
However, instead of dosing with synthetic n-alkanes, Carnauba wax may be used. Carnauba wax, which
18
is derived from the leaves of the palm Copernicia prunifera, is characterized by its free even-chain
alcohol content (1-C28OH – 1-C34OH), with 1-C32OH most abundant (Regert et al., 2005).
Additionally the length of time of dosing animals with the markers has been a topic of discussion and
may induce some variability in the fecal output of the marker. Various experiments have demonstrated
that a dosing period of 5-6 days is necessary for the concentration of the n-alkanes in feces to reach
equilibrium (Dove and Mayes, 1991).
Fecal recovery
Although the fecal recovery of n-alkanes is not complete, and variable, recovery increases with the carbon
chain length: 65% for C26 to over 90% for C37 n-alkanes. In addition, repeatability among diurnal samples
increased from 0.56 for C31, 0.78 for C32 and 0.81 for C33. Therefore, longer-chain n-alkanes may provide
a better prediction of intake, diet composition and digestibility (Malossini et al., 1994; Bovolenta et al.,
1994).
Since n-alkane recovery in feces is incomplete, such losses must be accounted for to accurately estimate
DMI (Dove and Mayes, 1991). Significant differences have been found between predicted and observed
DMI in cattle fed tropical grass (Brachiaria brizantha cv. Marandu) for unadjusted versus adjusted n-
alkane recoveries; while the observed DMI was 62.62 kg, the predicted values for unadjusted recovery
ranged from 45.70 to 50.78 kg, and for adjusted recovery ranged from 62.08 to 63.17 kg (Morais et al.,
2001). The ranges in predicted values were due to the n-alkane (C31, C33, and C35) and sampling method
(spot or total) employed. These results confirm that adjusting for fecal recovery is necessary for this
method to be reliable (Morais et al., 2001).
There is considerable evidence that recoveries of adjacent n-alkanes become more similar as the length of
the carbon chain increases. For instance, the mean values for fecal recovery of C32 and C33 are 0.868
±0.0175, and 0.872 ±0.0125, and for C34 and C35 are 0.948 ±0.0102 and 0.947± 0.0139. However, the
concentration of C35 in most plants is low making DMI estimation difficult using this n-alkane (Dove and
Mayes, 1991). Because the recovery rates of adjacent n-alkanes are relatively high, it could be assumed
19
that the recovery rate of a dosed even-chain n-alkane would be similar to that of the adjacent odd-chain n-
alkane, for instance the ratio of C32 versus C31 or C33 could be used as an indicator of the recovery of C32,
and adjustments made so that prediction of feed intake is more accurate.
Fecal sampling scheme
Diurnal variability in n-alkane concentrations in feces has been a concern, but usually has been overcome
by increasing the frequency of sampling. However, evidence of such diurnal variation is inconsistent
across species. In sheep dosed once a day with n-alkane paper pellets, there were no differences in the n-
alkane output in feces (Dove and Mayes, 1991). However, significant variation in the fecal n-alkane
output in dairy cattle was found when dosed both once and twice a day, with greater variation for the once
a day dosing scheme (Dove and Mayes, 1991).
Digestibility of the diet
Digestive efficiency is an important measure, as it relates directly to the ability of an animal to effectively
use the nutrients found in the diet it is offered (Vallentine, 2001). Digestibility, which is reflected by the
portion of the total diet that has not been excreted in the feces, can be estimated by the plant wax
procedure in a number of ways: (i) using the n-alkanes naturally found in plants as internal markers; and
(ii) using a dosed n-alkane as an external marker, and the plant internal marker. The following equation
can be used to determine digestibility with the use of n-alkanes (from Dove and Mayes, 2006):
퐷푖푔푒푠푡푖푏푖푙푖푡푦 = [6]
Fecal output can be calculated as follows:
퐹푒푐푎푙푂푢푡푝푢푡 푘푔 ( ⁄ ) ( ⁄ ) [7]
20
And feed intake can be calculated by:
퐼푛푡푎푘푒 =
[8]
where, i represent an odd-chain n-alkane, and j represents a dosed even-chain n-alkane.
As with the other estimates derived using the plant wax marker procedure, the reliability of the estimate
of digestibility improves when based on hydrocarbons or alcohols with longer carbon chains. This is
particularly important for this procedure, as errors in the estimation of digestibility will inevitably result
in a reduction of the accuracy of the estimate of intake (Dove and Mayes, 2005).
The possibility to select cattle that are more efficient for turning feed into animal products depends on
accurately predicting feed intake, in a large number of individuals under grazing conditions. Achieving
that aim may be possible if the plant wax procedure proves to be a reliable and practical method for
estimating feed intake in grazing animals. Even though many authors (Elwert et al., 2004; Charmley and
Dove, 2007; Lin et al., 2012) consider this technique to be accurate under controlled feeding conditions,
the challenge is to enhance these technologies so accurate estimates of individual pasture intake by cattle
can be obtained. With such information, phenotypic and genetic relationships between pasture intake,
growth rate, and other performance measures could be estimated, which would allow derivation of
optimal selection indices to improve efficiency (Arthur et al., 2004).
FORAGE PREFERENCE/ DIET COMPOSITION
There are two main concepts that need to be distinguished in regards to diet choice, namely diet
preference and diet selection (Rutter, 2006). Diet preference has been defined as ‘what the animals select
when given the minimum of physical constraints’ (Parsons et al., 1994). Diet selection, on the other hand,
is defined as ‘the removal of some components of a sward or a sample of herbage rather than others, a
function of preference modified by the opportunity for selection’ (Hodgson, 1979).
21
There are a number of factors that influence the preference of an animal toward any particular source of
food when given the chance to select. Most of these factors are inherent to the forage species itself such as
palatability, digestibility, and quality. However, there are some additional factors that may have an effect
on diet choice, and that are pertinent to the animal such as its physiological state, live weight, and
genetics (Vallentine, 2001).
Pigs, poultry, and rodents have the ability to select a diet that allows them to meet their nutritional
requirements when the choice was available. However, likely due to the intricacy of their digestive
system, the capacity to choose a balance diet is less evident in ruminants (James et al., 2001). Still,
through the analysis of various experiments, Horadagoda et al. (2009) suggest that animals tend to be
proactive in balancing their nutrient intake when they have that opportunity.
Palatability is said to be the major element dictating the degree of acceptance of a particular diet over
another. Palatability has been defined as ‘plant characteristic or condition which stimulates a selective
response in animals’ (Horadagoda et al., 2009). However, given that energy and protein requirements
(among others) might have an effect on selection, it seems sensible that other components of the diet may
be useful as predictors of choice.
Traditionally, many experiments have focused on explaining an animal’s selective choice of a diet based
on its protein content, because protein is an essential nutrient for growth and production (meat and milk).
In sheep, James et al. (2001) found that intake was greater for diets with a higher concentration of urea;
they concluded this suggests protein was a major factors affecting diet choice.
Table 2.7, adapted from Horadagoda et al. (2009), summarizes the coefficient of determination for
preferences of dairy cattle (measured in time spent grazing) for several forage species based on their
water soluble carbohydrates (WSC), CP, ADF, NDF, dry matter digestibility (DMD), and nitrate-
nitrogen (N-NO3) content.
Please place Table 2.7 about here
22
The choice of one family of forages over another appears to depend on a number of factors, with relative
the importance of each varying across forages; that is, no single forage characteristics may be a strong
indicator of forage preference in ruminants.
One concept that describes the preferences of one source of feed over another, particularly in grazing
animals, is the selectivity ratio. This ratio is defined as’ the proportion in the animal diet of any species,
species group, or plant part relative to its proportion in the available herbage’, and can be obtained as
follows (Vallentine, 2001):
푆푒푙푒푐푡푖푣푖푡푦푟푎푡푖표 =
[9]
Using this ratio Rossiere et al. (1975) determined that selectivity for forage species was inconsistent
although a preference index scale could be developed as a general guide (Table 2.8). Based on this scale,
forage preference of cattle for clover has been estimated at 1.9, and 1.0 for brome grass (Vallentine,
2001).
Please place Table 2.8 about here
Some experiments have focused on the ratio of grass to legume consumed as a way to show the
preference of animals towards a better source of protein. Table 2.9, adapted from Rutter (2006),
summarizes such preferences in ruminants in different physiological stages. Regardless of species or
stage of production, a clear preference for legume over grass was observed irrespective of the
physiological stage of the animal.
Please place Table 2.9 about here
23
Correlations between sward selection indices and composition parameters, for mixed swards containing
two types of perennial ryegrass (diploid and tetraploid), white clover, and weeds are presented in Table
2.10 (adapted from Stilmant et al., 2005). It can be observed that cattle and sheep prefer a mixed diet
containing legumes grasses and, when given the opportunity, herbs. However, what is not clear is the
reason behind the selection of a mixed diet. A number of theories have been proposed for explaining this
behavior, many of which have been discounted. Still, concepts raised in these theories remain valuable
considerations when attempting to understand the drive for a mixed diet, namely (i) novelty, (ii) sampling,
(iii) rumen function, (iv) carbon and nitrogen balance, (v) conditioned taste aversion, and (vi) anti-
predator behavior (Rutter, 2006).
Please place Table 2.10 about here
However, the estimations of preference using n-alkanes and LCOHs may not be entirely accurate due to
the fact that the rumen would buffer (mix and retain) the forage ingested in such magnitude that the
diurnal patterns that may exist about selection will be masked, being left with only a general estimate for
the composition of the diet consumed (Rutter, 2006).
As noted earlier, animals tend to select one forage species over another based on its nutrient content to
meet their energy demands, although such is not always the case (Emmans and Kyriazakis, 1995).
However, it may be possible that animals of the same species with different requirements will have
different DMI and, if allowed, diet preferences.
Using the n-alkane technique, and the least squares procedure, diet composition can be obtained by (Dove
and Mayes, 2006):
퐶푎푙푐푢푙푎푡푒푑푓푒푐푎푙푎푙푘푎푛푒 = 훼퐴 + 훽퐵 + 훾퐶 [10]
where α, β, and γ represent the respective proportions of dietary components A, B, and C.
24
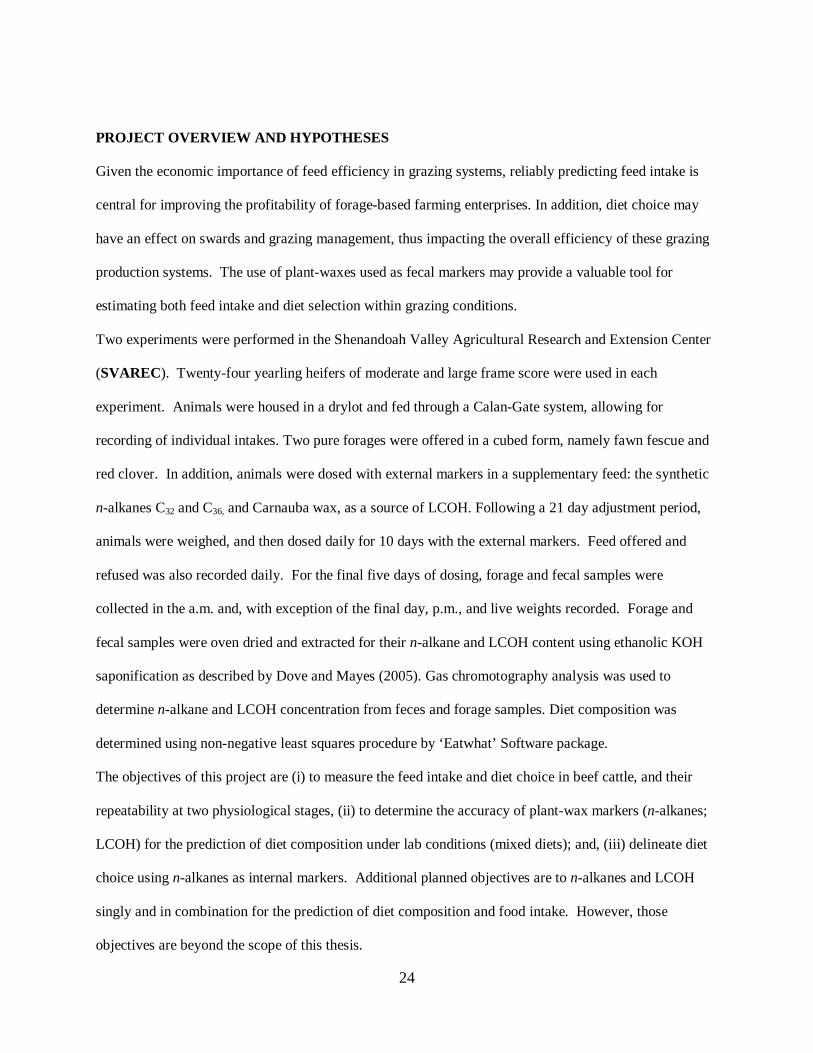
PROJECT OVERVIEW AND HYPOTHESES
Given the economic importance of feed efficiency in grazing systems, reliably predicting feed intake is
central for improving the profitability of forage-based farming enterprises. In addition, diet choice may
have an effect on swards and grazing management, thus impacting the overall efficiency of these grazing
production systems. The use of plant-waxes used as fecal markers may provide a valuable tool for
estimating both feed intake and diet selection within grazing conditions.
Two experiments were performed in the Shenandoah Valley Agricultural Research and Extension Center
(SVAREC). Twenty-four yearling heifers of moderate and large frame score were used in each
experiment. Animals were housed in a drylot and fed through a Calan-Gate system, allowing for
recording of individual intakes. Two pure forages were offered in a cubed form, namely fawn fescue and
red clover. In addition, animals were dosed with external markers in a supplementary feed: the synthetic
n-alkanes C32 and C36, and Carnauba wax, as a source of LCOH. Following a 21 day adjustment period,
animals were weighed, and then dosed daily for 10 days with the external markers. Feed offered and
refused was also recorded daily. For the final five days of dosing, forage and fecal samples were
collected in the a.m. and, with exception of the final day, p.m., and live weights recorded. Forage and
fecal samples were oven dried and extracted for their n-alkane and LCOH content using ethanolic KOH
saponification as described by Dove and Mayes (2005). Gas chromotography analysis was used to
determine n-alkane and LCOH concentration from feces and forage samples. Diet composition was
determined using non-negative least squares procedure by ‘Eatwhat’ Software package.
The objectives of this project are (i) to measure the feed intake and diet choice in beef cattle, and their
repeatability at two physiological stages, (ii) to determine the accuracy of plant-wax markers (n-alkanes;
LCOH) for the prediction of diet composition under lab conditions (mixed diets); and, (iii) delineate diet
choice using n-alkanes as internal markers. Additional planned objectives are to n-alkanes and LCOH
singly and in combination for the prediction of diet composition and food intake. However, those
objectives are beyond the scope of this thesis.
25
The specific hypotheses to be tested were (i) heifers of larger frame score, and thereby mature weight,
will have higher DMI than those of moderate frame score, (ii) heifers of larger frame score will select
forage with a higher nutritional value (red clover versus fescue), since heavier body weights result in
higher energy demands, (iii) animals in general will have higher DMI of a forage with higher nutritional
value (red clover versus fescue); and(vi) the plant wax procedure will allow diet composition to be
predicted within 95% of the observed compositions.
26
Table 2.1. Means and heritability for FCR and related traits
Trait Mean Heritability
Average daily gain 1.26 0.28 ± 0.04
Mean metabolic weight 68.77 0.40 ± 0.02
Feed intake 9.65 0.39 ± 0.03
Residual feed intake 7.79 0.29 ± 0.04
Feed conversion ratio 0.05 0.39 ± 0.03
27
Table 2.2. Correlations between voluntary feed intake and chemical composition of 7 forage species and
digestibility
Species Lignin ADF Protein Cellulose CWC* Digestibility
Sudan grass -0.89 -0.88 0.77 -0.87 -0.78 0.85
Orchard grass -0.76 -0.74 0.79 -0.83 -0.95 0.81
Brome grass -0.65 -0.85 0.70 -0.87 -0.77 0.62
Timothy -0.33 -0.29 0.29 -0.47 -0.37 0.57
Alfalfa -0.02 -0.07 0.17 -0.20 -0.29 0.45
Blue grass 0.48 0.20 -0.25 0.37 -0.06 0.18
Tall fescue 0.70 0.59 -0.46 0.54 0.57 -0.31
Total* -0.13 -0.53 0.54 -0.59 -0.65 0.66 * CWC = Cell wall constituents
Total= Overall correlation for all of the species analyzed
28
Table 2.3. Forage n-alkane concentration (mg/kg DM) for grass and legume species (adapted from
Malossini et al., 1991).
Grasses Legumes
n-Alkane Orchardgrass
(Dactylis glomerata)
Annual ryegrass (Lolium
multiflorum)
Perennial Ryegrass (Lolium perenne)
Alfalfa (Medicago
sativa)
White clover (Trifolium
repens)
Red clover
(Trifolium pratense)
C27 20 105 36 36 38 30
C28 2 8 6 9 7 8
C29 38 260 142 202 109 408
C30 2 11 12 12 5 5
C31 58 250 220 324 67 57
C32 2 4 7 7 1 1
C33 21 43 99 21 7 11
C35 0 0 8 0 0 0
Total 143 681 531 611 234 523
Even chain % 4.2 3.4 4.7 4.6 5.6 3.2
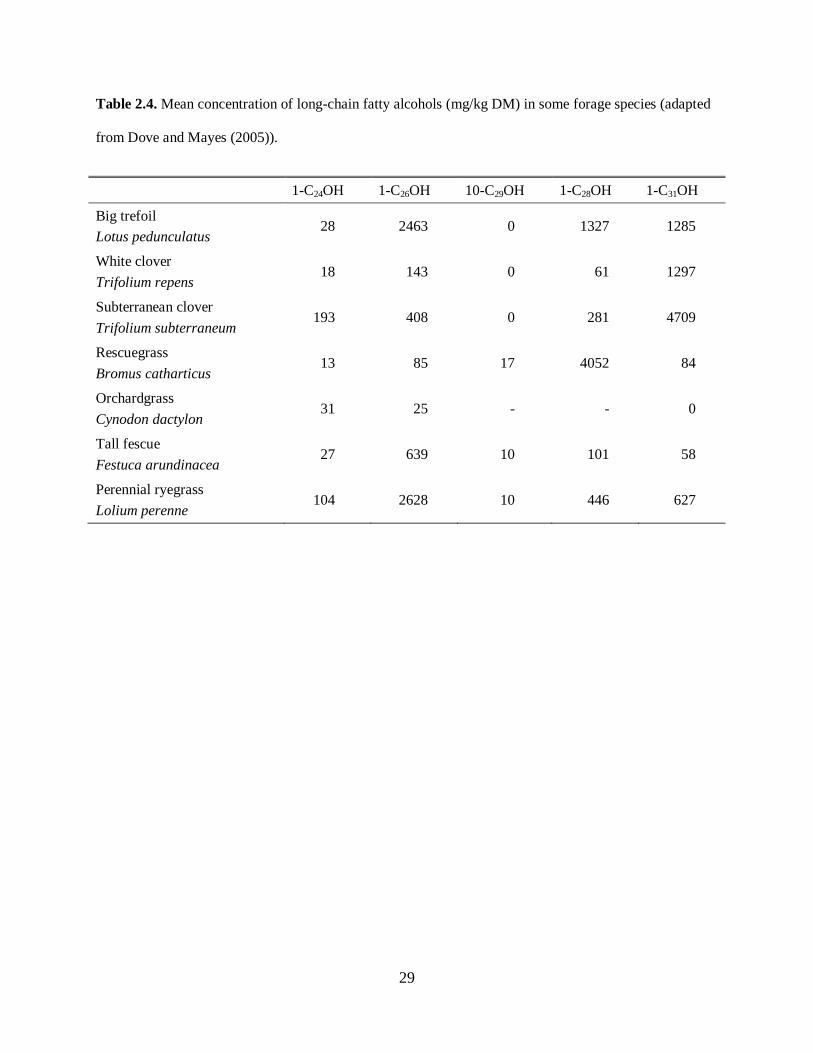
29
Table 2.4. Mean concentration of long-chain fatty alcohols (mg/kg DM) in some forage species (adapted
from Dove and Mayes (2005)).
1-C24OH 1-C26OH 10-C29OH 1-C28OH 1-C31OH
Big trefoil Lotus pedunculatus
28 2463 0 1327 1285
White clover Trifolium repens
18 143 0 61 1297
Subterranean clover Trifolium subterraneum
193 408 0 281 4709
Rescuegrass Bromus catharticus
13 85 17 4052 84
Orchardgrass Cynodon dactylon
31 25 - - 0
Tall fescue Festuca arundinacea
27 639 10 101 58
Perennial ryegrass Lolium perenne
104 2628 10 446 627
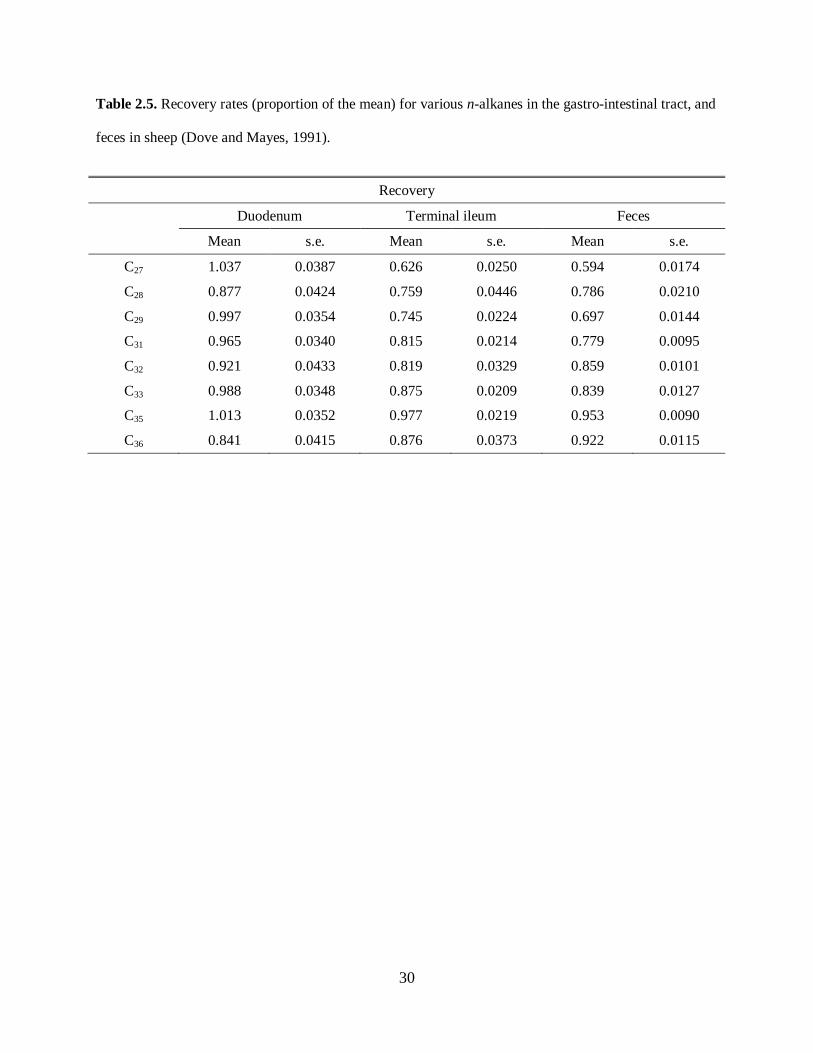
30
Table 2.5. Recovery rates (proportion of the mean) for various n-alkanes in the gastro-intestinal tract, and
feces in sheep (Dove and Mayes, 1991).
Recovery
Duodenum Terminal ileum Feces
Mean s.e. Mean s.e. Mean s.e.
C27 1.037 0.0387 0.626 0.0250 0.594 0.0174
C28 0.877 0.0424 0.759 0.0446 0.786 0.0210
C29 0.997 0.0354 0.745 0.0224 0.697 0.0144
C31 0.965 0.0340 0.815 0.0214 0.779 0.0095
C32 0.921 0.0433 0.819 0.0329 0.859 0.0101
C33 0.988 0.0348 0.875 0.0209 0.839 0.0127
C35 1.013 0.0352 0.977 0.0219 0.953 0.0090
C36 0.841 0.0415 0.876 0.0373 0.922 0.0115
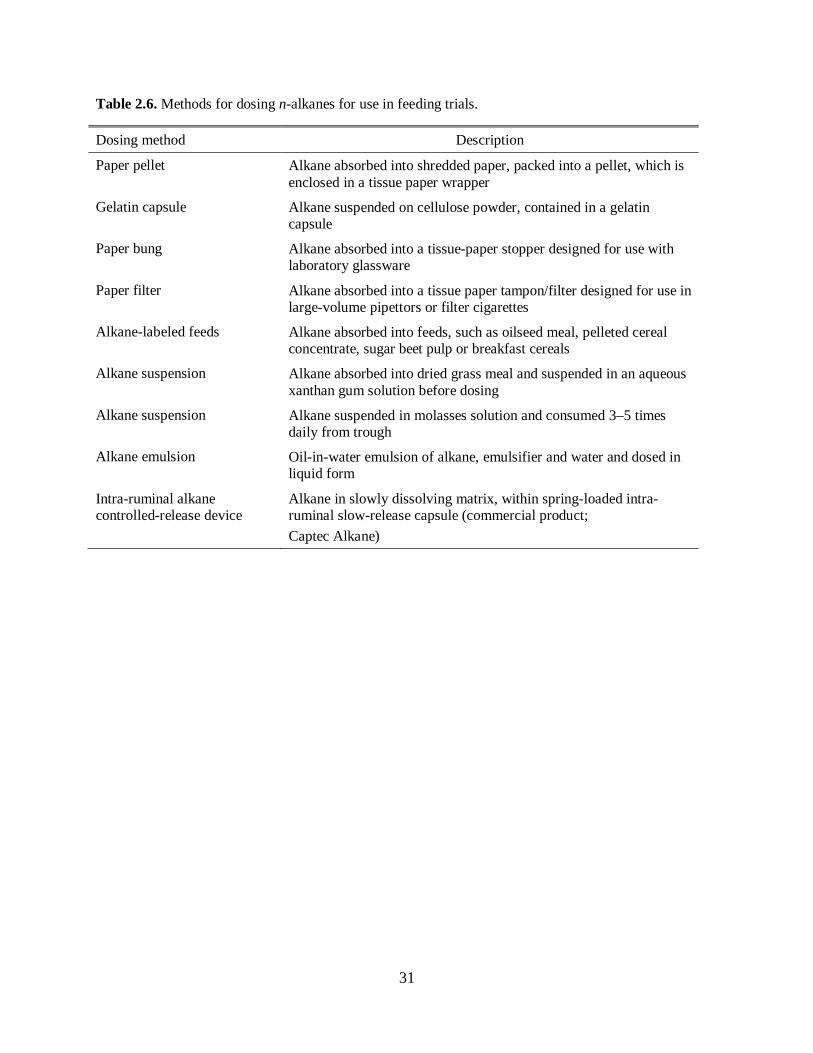
31
Table 2.6. Methods for dosing n-alkanes for use in feeding trials.
Dosing method Description
Paper pellet Alkane absorbed into shredded paper, packed into a pellet, which is enclosed in a tissue paper wrapper
Gelatin capsule Alkane suspended on cellulose powder, contained in a gelatin capsule
Paper bung Alkane absorbed into a tissue-paper stopper designed for use with laboratory glassware
Paper filter Alkane absorbed into a tissue paper tampon/filter designed for use in large-volume pipettors or filter cigarettes
Alkane-labeled feeds Alkane absorbed into feeds, such as oilseed meal, pelleted cereal concentrate, sugar beet pulp or breakfast cereals
Alkane suspension Alkane absorbed into dried grass meal and suspended in an aqueous xanthan gum solution before dosing
Alkane suspension Alkane suspended in molasses solution and consumed 3–5 times daily from trough
Alkane emulsion Oil-in-water emulsion of alkane, emulsifier and water and dosed in liquid form
Intra-ruminal alkane controlled-release device
Alkane in slowly dissolving matrix, within spring-loaded intra-ruminal slow-release capsule (commercial product; Captec Alkane)
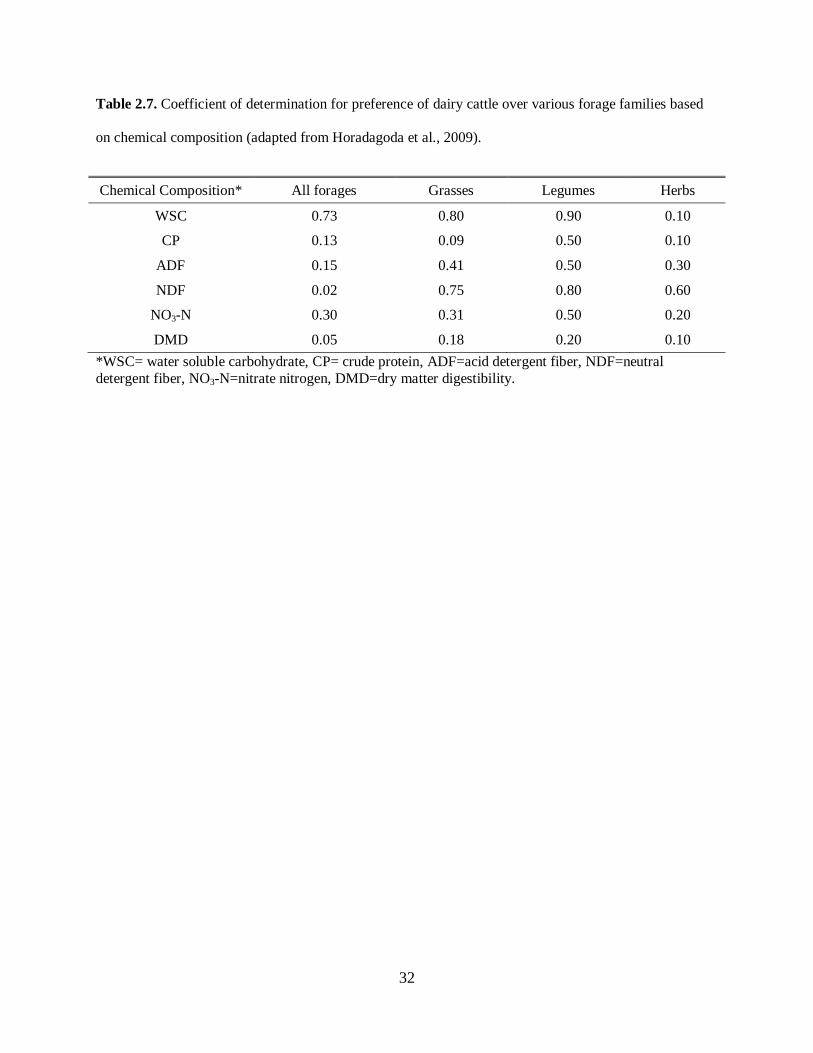
32
Table 2.7. Coefficient of determination for preference of dairy cattle over various forage families based
on chemical composition (adapted from Horadagoda et al., 2009).
Chemical Composition* All forages Grasses Legumes Herbs
WSC 0.73 0.80 0.90 0.10
CP 0.13 0.09 0.50 0.10
ADF 0.15 0.41 0.50 0.30
NDF 0.02 0.75 0.80 0.60
NO3-N 0.30 0.31 0.50 0.20
DMD 0.05 0.18 0.20 0.10 *WSC= water soluble carbohydrate, CP= crude protein, ADF=acid detergent fiber, NDF=neutral detergent fiber, NO3-N=nitrate nitrogen, DMD=dry matter digestibility.
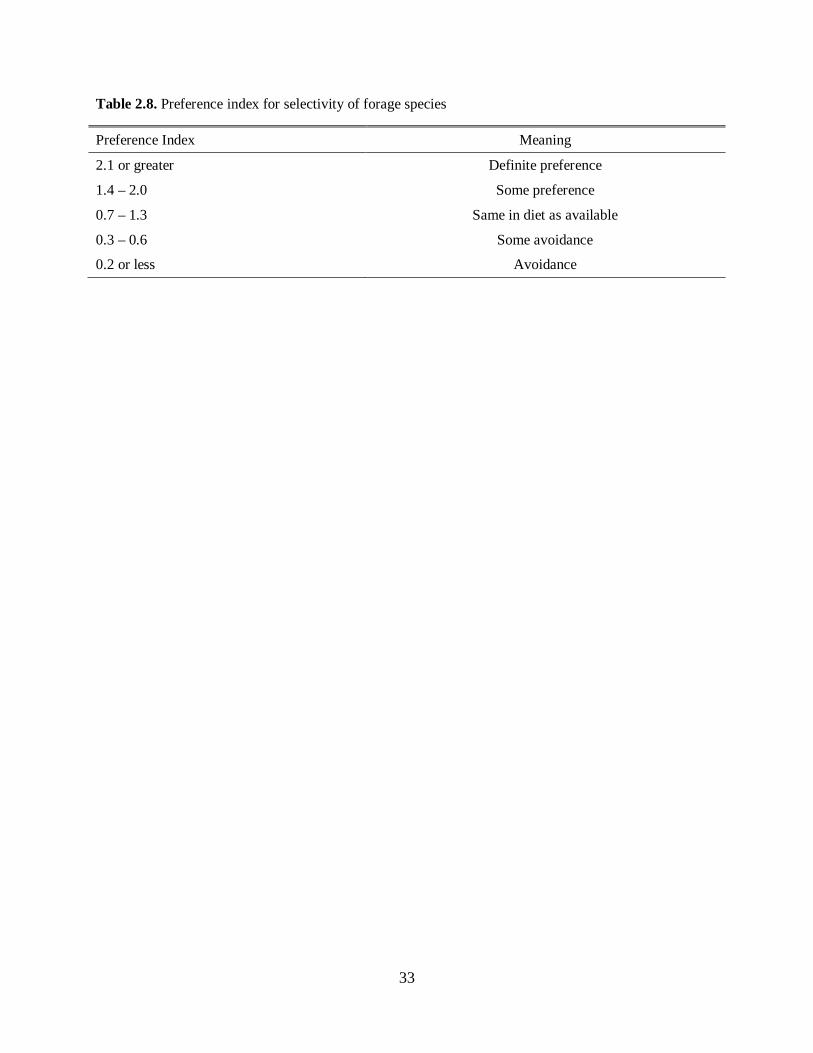
33
Table 2.8. Preference index for selectivity of forage species
Preference Index Meaning
2.1 or greater Definite preference
1.4 – 2.0 Some preference
0.7 – 1.3 Same in diet as available
0.3 – 0.6 Some avoidance
0.2 or less Avoidance
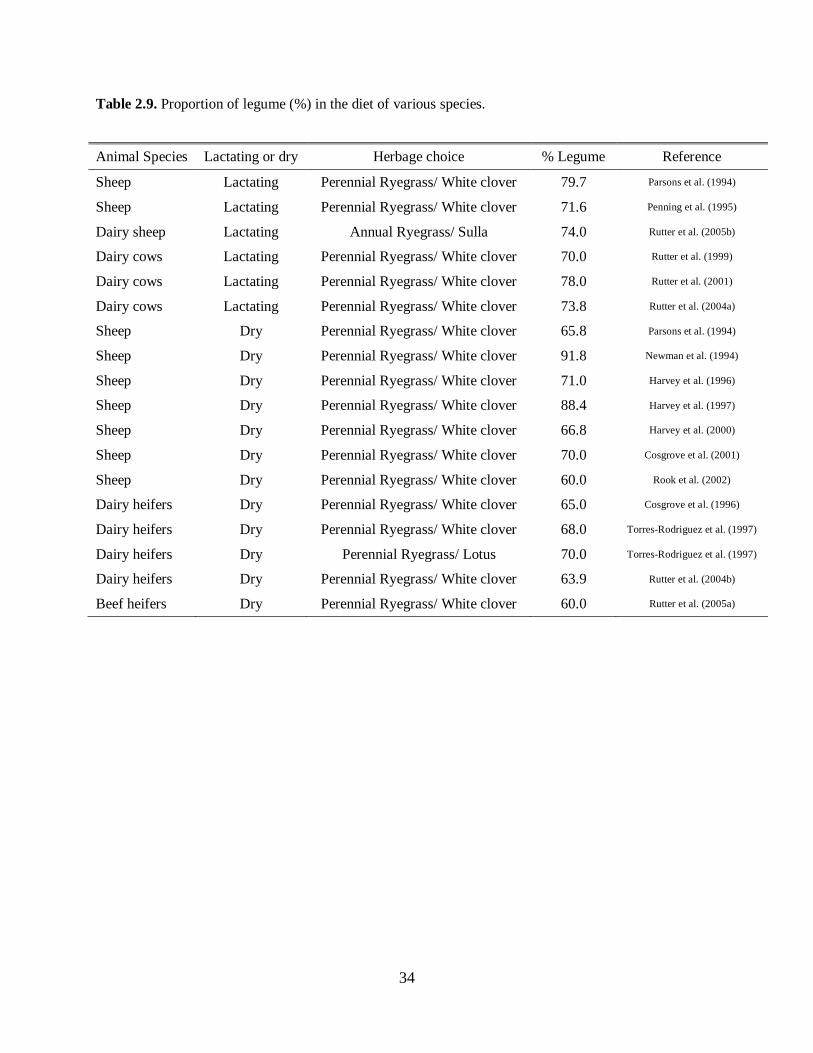
34
Table 2.9. Proportion of legume (%) in the diet of various species.
Animal Species Lactating or dry Herbage choice % Legume Reference
Sheep Lactating Perennial Ryegrass/ White clover 79.7 Parsons et al. (1994)
Sheep Lactating Perennial Ryegrass/ White clover 71.6 Penning et al. (1995)
Dairy sheep Lactating Annual Ryegrass/ Sulla 74.0 Rutter et al. (2005b)
Dairy cows Lactating Perennial Ryegrass/ White clover 70.0 Rutter et al. (1999)
Dairy cows Lactating Perennial Ryegrass/ White clover 78.0 Rutter et al. (2001)
Dairy cows Lactating Perennial Ryegrass/ White clover 73.8 Rutter et al. (2004a)
Sheep Dry Perennial Ryegrass/ White clover 65.8 Parsons et al. (1994)
Sheep Dry Perennial Ryegrass/ White clover 91.8 Newman et al. (1994)
Sheep Dry Perennial Ryegrass/ White clover 71.0 Harvey et al. (1996)
Sheep Dry Perennial Ryegrass/ White clover 88.4 Harvey et al. (1997)
Sheep Dry Perennial Ryegrass/ White clover 66.8 Harvey et al. (2000)
Sheep Dry Perennial Ryegrass/ White clover 70.0 Cosgrove et al. (2001)
Sheep Dry Perennial Ryegrass/ White clover 60.0 Rook et al. (2002)
Dairy heifers Dry Perennial Ryegrass/ White clover 65.0 Cosgrove et al. (1996)
Dairy heifers Dry Perennial Ryegrass/ White clover 68.0 Torres-Rodriguez et al. (1997)
Dairy heifers Dry Perennial Ryegrass/ Lotus 70.0 Torres-Rodriguez et al. (1997)
Dairy heifers Dry Perennial Ryegrass/ White clover 63.9 Rutter et al. (2004b)
Beef heifers Dry Perennial Ryegrass/ White clover 60.0 Rutter et al. (2005a)
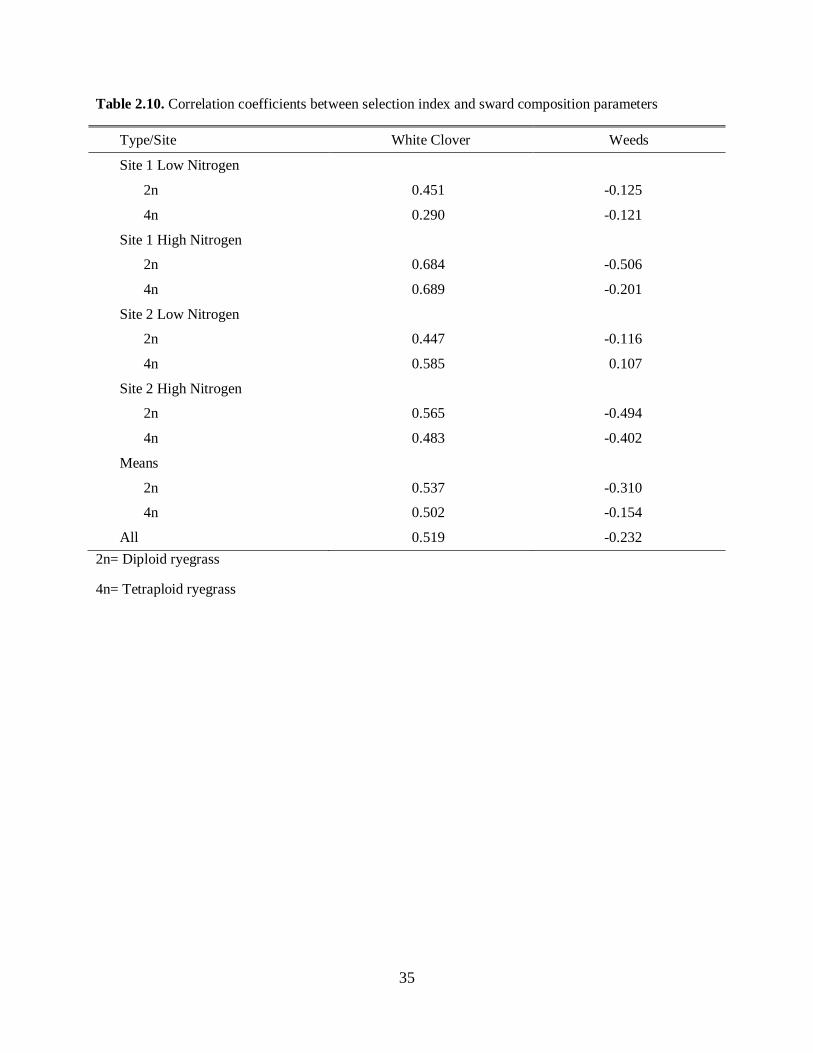
35
Table 2.10. Correlation coefficients between selection index and sward composition parameters
Type/Site White Clover Weeds
Site 1 Low Nitrogen
2n 0.451 -0.125
4n 0.290 -0.121
Site 1 High Nitrogen
2n 0.684 -0.506
4n 0.689 -0.201
Site 2 Low Nitrogen
2n 0.447 -0.116
4n 0.585 0.107
Site 2 High Nitrogen
2n 0.565 -0.494
4n 0.483 -0.402
Means
2n 0.537 -0.310
4n 0.502 -0.154
All 0.519 -0.232 2n= Diploid ryegrass
4n= Tetraploid ryegrass
36
CHAPTER 3 (Formatting of this chapter is consistent with the Journal of Grass and Forage
Science to which it will be submitted)
Using n-alkanes and long-chain alcohols to estimate botanical composition in simple forage
mixtures: effect of the operator and type of marker used
N. Vargas Jurado*, A. E. Tanner*, S. R. Blevins, H. M. McNair†, R. W. Mayes‡, and R. M. Lewis*
* Department of Animal and Poultry Science, Virginia Tech, Blacksburg, VA, USA
† Department of Chemistry, Virginia Tech, Blacksburg, VA, USA
‡ James Hutton Institute, Aberdeen, Scotland, UK
Correspondence to: Ron Lewis, Department of Animal and Poultry Science MC 0306, Virginia Tech,
175 West Campus Drive/Litton-Reaves 3100, Blacksburg, VA, 24061 USA. E-mail: [email protected]
37
Abstract
Feed intake and diet choice have an impact on production efficiency and management of grasslands. N-
alkanes have been used successfully to predict both feed intake and diet choice. Still, when the
hydrocarbon profiles of plants within the sward are similar, n-alkanes alone may not be sufficient for
reliable predictions. Including long chain alcohols (LCOHs) as additional markers may help redress this
problem. Technical expertise of operators in evaluating the n-alkane and LCOH concentrations of forages
also may differ. As a consequence, biases may be introduced due to measurement error. In this study, two
factors contributing to the reliability of predicting the botanical composition of mixed diets were tested:
(i) the forage markers used; and, (ii) the expertise of the laboratory operators conducting the analyses.
Two operators, with different levels of expertise, performed two separate extractions of n-alkanes and
LCOHs from 9 mixed and 2 pure test diets of red clover and fawn fescue. Differences in measured
concentrations of n-alkanes C27, C29, C31, and C33 and alcohols C26-OH, C28-OH, and C30-OH were tested
using ANOVA to detect differences between operators, and between extracts within operator. The
concentrations of C27 and C29 differed (P < 0.041) between extractions within operators. Between
operators, only differences in C26-OH and C28-OH were found (P < 0.002). Principal components analysis
suggested that for this pair of forages, C26-OH did not provide useful information for estimation of
botanical compositions. The slopes from the regression of estimated on actual fescue contents of the test
diets did not differ from unity for any operator or marker combination. Our results suggest that, despite
variability in measured concentrations due to technical expertise of the operator, prediction of forage
mixtures is still reliable.
Keywords: n-alkanes, long chain alcohols, forage mixtures, prediction, operator
Introduction
Providing feed to animals can represent up to 65% of total production costs (Arthur et al., 2004). Because
the performance of animals is affected by the nutrients they consume, an accurate measure of feed intake
38
is necessary to evaluate production efficiency. In addition, understanding the preferences of animals for
particular forages or feeds (diet selection) can assist in developing and managing grazing systems. This is
particularly important with complex sward compositions as diet selection may impact the sustainability
of the vegetation (Ferreira et al., 2009). There also may be opportunity for animal genetic selection to
alter diet choices (Rutter, 2010) if feed intake can be measured reliably in individual animals.
Several approaches to predict nutrient intake, including the use of fecal markers such as chromic oxide,
indigestible cellulose and acid insoluble ash, have been used and are fairly accurate (Penning and
Johnson, 1983; Malossini et al., 1996; Morenz et al., 2006). Still, using the markers mentioned above do
not have the ability to predict diet choice. An alternative approach, using plant waxes as forage and fecal
markers, appears to provide such flexibility. Among the many constituents of plant waxes, n-alkanes (
saturated aliphatic hydrocarbons) have been used to estimate both feed intake and diet choice in many
animal species (Dove and Mayes, 2005). However, the number of plant species that can be delineated in a
mixed composition depends on the number of n-alkane markers available and their profiles in individual
plants (Bugalho et al., 2004). Long chain alcohols (LCOHs); therefore, have been used in addition to n-
alkanes to improve the reliability of plant species estimation (Ali et al., 2005).
The utility of n-alkanes and LCOHs as dietary markers relies on their marker concentrations being
sufficiently different among the forage species on offer. Interestingly, the concentrations of these
compounds can vary even within a plant cultivar, (Kelman et al., 2003). Therefore, the set of markers
requisite to reliably delineate botanical composition may differ (Lin et al., 2012). When the aim is to
estimate diet choices; techniques for identifying markers with greater discriminatory power are needed.
With the plant wax marker procedure, estimation errors may arise due to incomplete or variable recovery
of plant markers in fecal samples (Oliván et al., 2007; Morais et al., 2011)., The technical expertise of the
person assessing the concentrations of these compounds in forages and feces also may introduce
39
measurement error. Such biases may be specific to a compound class. For instance, more steps are
necessary to purify LCOHs than n-alkanes (Dove and Mayes, 2006). Thus, in order to validate the
reliability of the plant wax marker technique, the extent of measurement errors must be quantified.
This study was designed to assess the reliability of n-alkanes and LCOHs for estimating the composition
of a two-plant mixture (red clover and fescue). Our specific objectives were to determine: (i) the effect of
operator experience on measurement of n-alkanes and LCOHs concentrations within test diets; (ii) the
impact of operator expertise on the reliability of estimating the botanical compositions of those diets; and,
(iii) the value of combining different sets of markers (i.e., n-alkanes and LCOH) for such estimation. The
overall aim was to validate the use of n-alkanes and LCOHs as a means for estimating the composition of
a fescue-red clover diet mixture.
Materials and Methods
Since the present study did not include an animal component, no Institutional Animal Care and Use
Committee approval was necessary.
Preparation of forage mixtures
Pure hay from two forage species, fawn fescue (Festuca arundinacea) and red clover (Trifolium
pratense), was finely chopped, pulverized, and pressed to form 3.18 x 3.18 cm cubes, with moisture
added (steam) to facilitate the binding process (McHay Company, Elgin, OK). Cubes from a single forage
were sampled randomly from totes, and combined. The combined samples were oven-dried at 55 °C for
72 hours and then ground through a 1 mm mesh screen using a Wiley Mill. Test diets were prepared by
weighing out dried ground forages on an analytical scale (Mettler Toledo AL204, Columbus, OH) to
produce mixtures ranging from 100 % to 0% fescue, or conversely 0 to 100 % red clover, in 10 %
increments. Nine mixed, and two pure, test diets were prepared (Table 3.1).
40
Please insert Table 3.1 about here
Operators
The experiment was designed so that two operators, one with three years of experience and one just
trained, performed separate extractions and analysis of each test diet. Each operator undertook two
extractions, generating a total of 44 samples (22 per operator) to be analyzed by gas chromatography
(GC).
Alkane and LCOH extraction
Extractions were performed on each test diet in duplicate (Dove and Mayes, 2006). Briefly, 0.2 g of a test
diet was weighed into 16mm x 100mm borosilicate glass tubes. Approximately 0.1g of n-docosane (C22)
and n-tetritriacontane (C34) alkane (0.3 mg/g of each alkane), and 0.1 g of 1-heptacosanol (C27-OH), 1.2
mg/g) LCOH, were added to each sample tube as internal standards. Tubes were saponified for 16 h at 90
◦C in 2 mL of 1 M ethanolic KOH using a dry-block heater (Techne DB-3, Techne Ltd., Duxford,
Cambridge, UK). Heptane (2 mL) and distilled water (0.6 mL) were added to each warmed tube (60°C).
The non-aqueous layer was collected after vigorous shaking, yielding a crude extract. Hydrocarbons were
collected by solid phase extraction (SPE) and heptane elution through a silica-gel column (bed volume 1
mL, 70-230 mesh, Fisher Scientific, Fairlawn, NJ). Crude alcohol extractions were obtained by elution
with heptane/ethyl-acetate (80:20 v/v). Long-chain alcohol fractions were separated from sterols and
stanols by SPE and heptane elution, and then derivatized using 2 µL of a pyridine/acetic anhydride
solution (5:1 v/v). Alkane elutes and LCOH fractions were evaporated to dryness, and then re-dissolved
in 200 µL of n-dodecane for chromatographic analysis.
GC analysis
Quantification of alkanes and LCOHs was carried out by GC, using an Agilent 6890N GC (Agilent
Technologies, Inc., Santa Clara, CA). Alkane and LCOH extracts were injected (0.5µl) via a 7863 Series
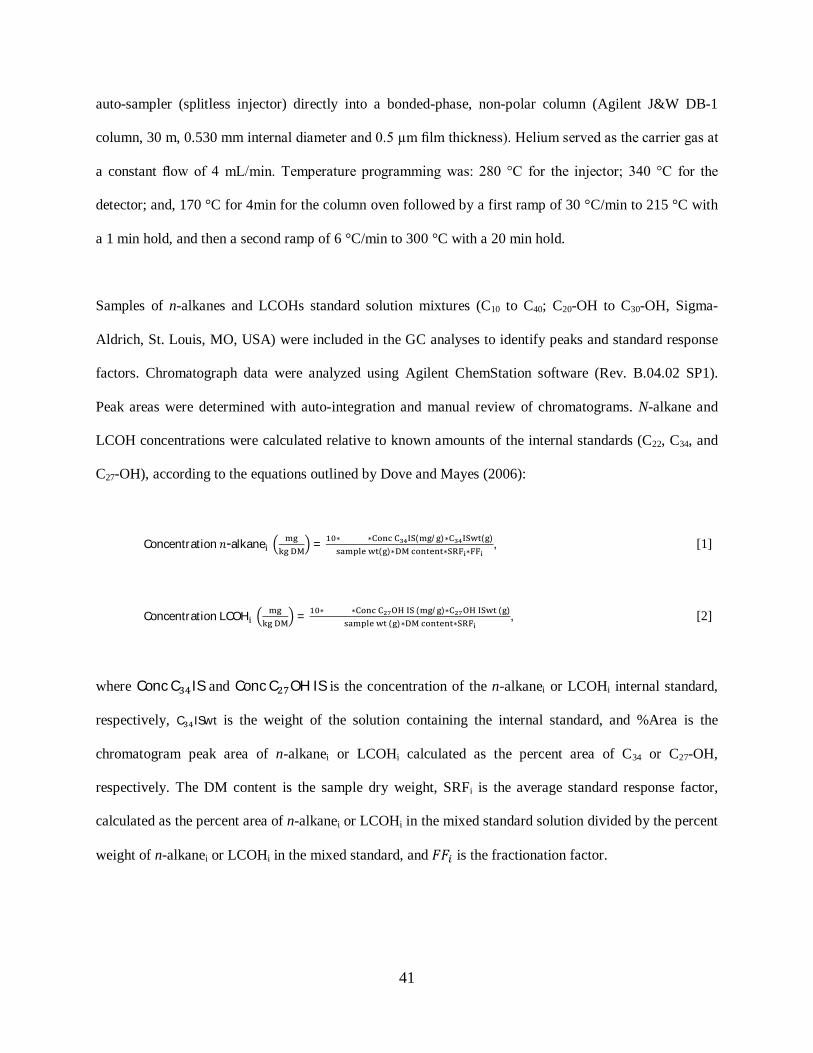
41
auto-sampler (splitless injector) directly into a bonded-phase, non-polar column (Agilent J&W DB-1
column, 30 m, 0.530 mm internal diameter and 0.5 µm film thickness). Helium served as the carrier gas at
a constant flow of 4 mL/min. Temperature programming was: 280 °C for the injector; 340 °C for the
detector; and, 170 °C for 4min for the column oven followed by a first ramp of 30 °C/min to 215 °C with
a 1 min hold, and then a second ramp of 6 °C/min to 300 °C with a 20 min hold.
Samples of n-alkanes and LCOHs standard solution mixtures (C10 to C40; C20-OH to C30-OH, Sigma-
Aldrich, St. Louis, MO, USA) were included in the GC analyses to identify peaks and standard response
factors. Chromatograph data were analyzed using Agilent ChemStation software (Rev. B.04.02 SP1).
Peak areas were determined with auto-integration and manual review of chromatograms. N-alkane and
LCOH concentrations were calculated relative to known amounts of the internal standards (C22, C34, and
C27-OH), according to the equations outlined by Dove and Mayes (2006):
Concentration푛-alkane
= ∗ ∗ ( / )∗ ( ) ( )∗ ∗ ∗
, [1]
ConcentrationLCOH
= ∗ ∗ ( / )∗ ( ) ( )∗ ∗
, [2]
where ConcC IS and ConcC OHIS is the concentration of the n-alkanei or LCOHi internal standard,
respectively, C ISwt is the weight of the solution containing the internal standard, and %Area is the
chromatogram peak area of n-alkanei or LCOHi calculated as the percent area of C34 or C27-OH,
respectively. The DM content is the sample dry weight, SRFi is the average standard response factor,
calculated as the percent area of n-alkanei or LCOHi in the mixed standard solution divided by the percent
weight of n-alkanei or LCOHi in the mixed standard, and 퐹퐹 is the fractionation factor.
42
Estimation of diet composition
Botanical composition of the forage mixtures was estimated using ‘EatWhat’ software, which matches the
marker profile for each forage species to that in the test diet through non-negative, least squares
optimization (Dove and More, 1995).
Estimation of diet composition was performed using either four n-alkanes (C27, C31, C33 and C33), three
LCOHs (C26-OH, C28-OH, and C30-OH), or the combination of these seven compounds.
Statistical Analysis
Operator differences
Statistical analyses were conducted using SAS 9.2 (SAS Institute Inc., Cary, NC) and R (R Development
Core Team).
Potential differences between operators in their measurement of the concentration of individual n-alkanes
and LCOHs were tested using the GLIMMIX procedure in SAS. Extract within operator was the
experimental unit. The model fitted was:
푦 = 휇 + 푂 + 퐸( ) + 푆 + 휀 , [3]
where 푦 is the n-alkane or LCOH concentration measured by operator 푂 (i = 1 or 2, for the two
operators) for extraction 퐸 (j = 1 or 2, for the two extractions by each operator) and sample 푆 (k = 1, …,
11, for the two pure and nine mixed test diets), with 휇 the overall mean concentration. Operator one was
more experienced in extracting and analyzing n-alkanes and LCOHs. Operator and sample were fitted as
fixed effects. Random effects were extraction nested within operator (퐸( ) ) and the residual (휀 ).
Potential differences in measured concentrations of individual n-alkanes and LCOHs within operators
were tested, again using the GLIMMIX procedure. The model fitted was:
43
푦 = 휇 + 푂 + 푆 + (푂푆) + 휀 [4]
where 푦 is the n-alkane or LCOH concentration measured by operator 푂 (i = 1 or 2, for the two
operators) for sample 푆 (j = 1, …, 11, for the two pure and nine mixed test diets), with 휇 the overall mean
concentrations. Operator and sample, and their interaction [(푂푆) ], were fitted as fixed effects. The
random effect was the residual (휀 ).
Estimation of forage mixtures
Principal components analysis (PCA) was conducted with R using the Princomp and Biplot procedures.
The PCA was performed to identify patterns of the four n-alkanes and three LCOHs evaluated in the two
forage species. Since the concentrations of n-alkanes and LCOHs in both forages were similar in
magnitude, no normalization procedure was performed. However, PCA was conducted using standardized
variables and correlation matrices.
The estimated and actual fescue contents of the test diets were compared by regressing the natural log of
predicted on the natural log of actual contents, using the REG procedure in SAS. The reliabilities of the
estimates were assessed by testing the hypotheses that the slope was not different from unity, and that the
intercept was not different from zero. The standard errors of the parameter estimates, 95% confidence
intervals for the parameters, and 95% confidence intervals for predicted values of the fitted lines, were
examined. The latter provide information on how certain the predictions of diet composition will be,
given the current data (Ott and Longnecker, 2010).
Differences in the accuracy of forage mixture estimates, using the n-alkanes and LCOHs separately and in
combination, were tested using the Kulczyński Similarity Index (KSI), where a value of 0 infers total
dissimilarity and a value of 100 infers total similarity (Oosting, 1956; Ferreira et al., 2009; Lin et al.,
2012). The statistic was calculated as:
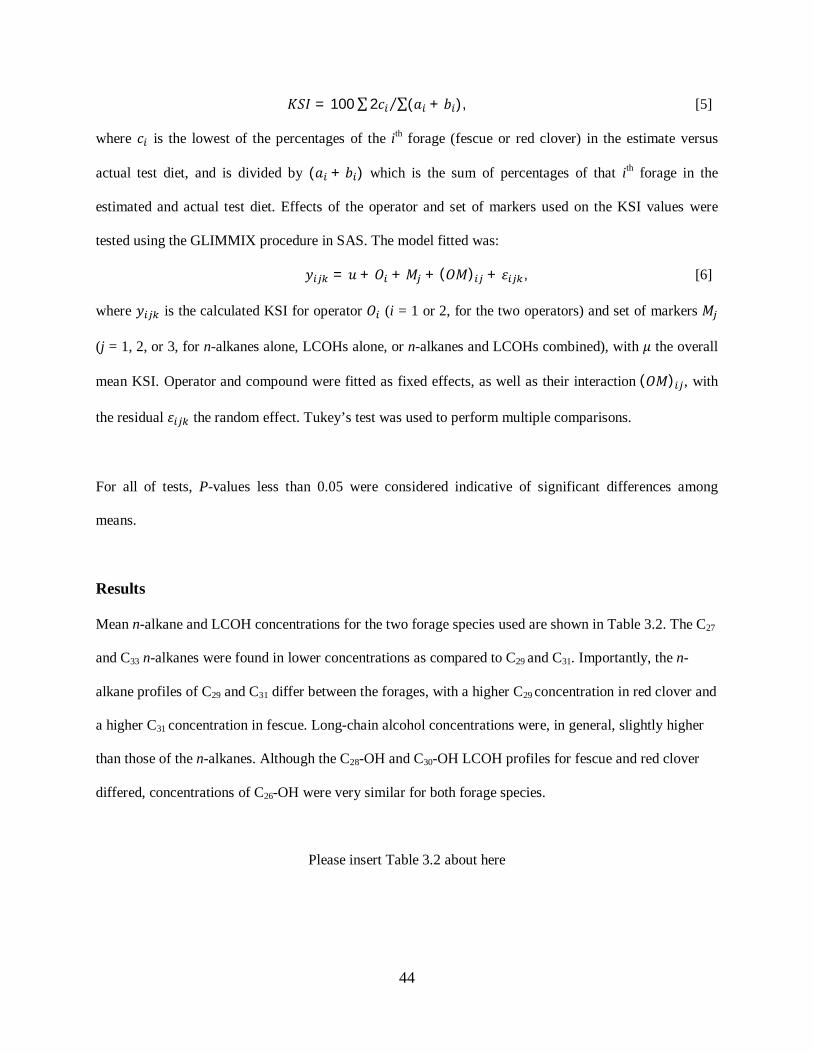
44
퐾푆퐼 = 100∑2푐 ∑(푎 + 푏 )⁄ , [5]
where 푐 is the lowest of the percentages of the ith forage (fescue or red clover) in the estimate versus
actual test diet, and is divided by (푎 + 푏 ) which is the sum of percentages of that ith forage in the
estimated and actual test diet. Effects of the operator and set of markers used on the KSI values were
tested using the GLIMMIX procedure in SAS. The model fitted was:
푦 = 푢 + 푂 + 푀 + (푂푀) + 휀 , [6]
where 푦 is the calculated KSI for operator 푂 (i = 1 or 2, for the two operators) and set of markers 푀
(j = 1, 2, or 3, for n-alkanes alone, LCOHs alone, or n-alkanes and LCOHs combined), with 휇 the overall
mean KSI. Operator and compound were fitted as fixed effects, as well as their interaction(푂푀) , with
the residual 휀 the random effect. Tukey’s test was used to perform multiple comparisons.
For all of tests, P-values less than 0.05 were considered indicative of significant differences among
means.
Results
Mean n-alkane and LCOH concentrations for the two forage species used are shown in Table 3.2. The C27
and C33 n-alkanes were found in lower concentrations as compared to C29 and C31. Importantly, the n-
alkane profiles of C29 and C31 differ between the forages, with a higher C29 concentration in red clover and
a higher C31 concentration in fescue. Long-chain alcohol concentrations were, in general, slightly higher
than those of the n-alkanes. Although the C28-OH and C30-OH LCOH profiles for fescue and red clover
differed, concentrations of C26-OH were very similar for both forage species.
Please insert Table 3.2 about here
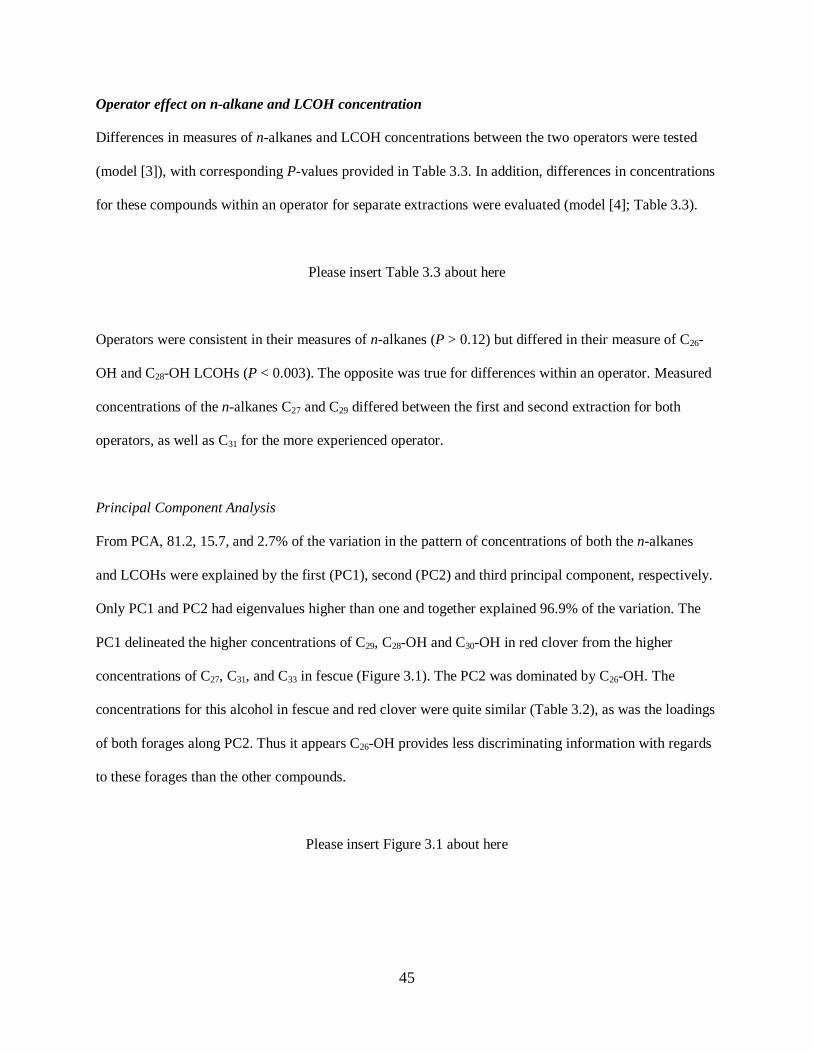
45
Operator effect on n-alkane and LCOH concentration
Differences in measures of n-alkanes and LCOH concentrations between the two operators were tested
(model [3]), with corresponding P-values provided in Table 3.3. In addition, differences in concentrations
for these compounds within an operator for separate extractions were evaluated (model [4]; Table 3.3).
Please insert Table 3.3 about here
Operators were consistent in their measures of n-alkanes (P > 0.12) but differed in their measure of C26-
OH and C28-OH LCOHs (P < 0.003). The opposite was true for differences within an operator. Measured
concentrations of the n-alkanes C27 and C29 differed between the first and second extraction for both
operators, as well as C31 for the more experienced operator.
Principal Component Analysis
From PCA, 81.2, 15.7, and 2.7% of the variation in the pattern of concentrations of both the n-alkanes
and LCOHs were explained by the first (PC1), second (PC2) and third principal component, respectively.
Only PC1 and PC2 had eigenvalues higher than one and together explained 96.9% of the variation. The
PC1 delineated the higher concentrations of C29, C28-OH and C30-OH in red clover from the higher
concentrations of C27, C31, and C33 in fescue (Figure 3.1). The PC2 was dominated by C26-OH. The
concentrations for this alcohol in fescue and red clover were quite similar (Table 3.2), as was the loadings
of both forages along PC2. Thus it appears C26-OH provides less discriminating information with regards
to these forages than the other compounds.
Please insert Figure 3.1 about here
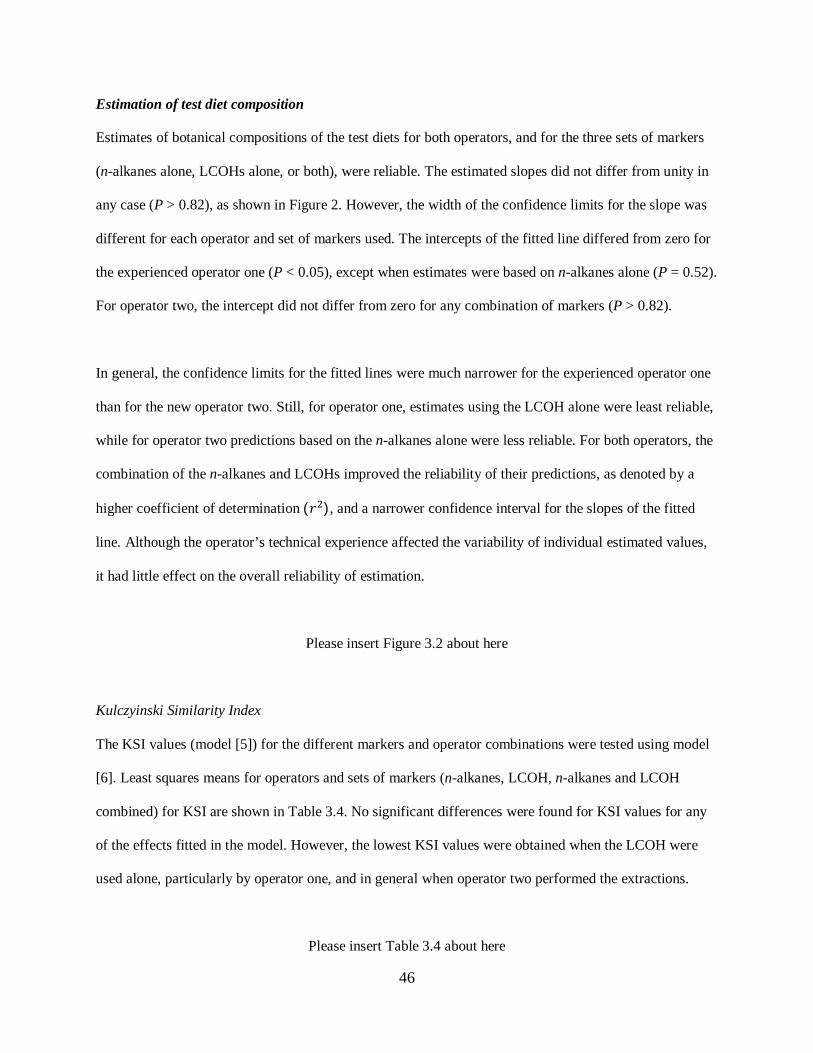
46
Estimation of test diet composition
Estimates of botanical compositions of the test diets for both operators, and for the three sets of markers
(n-alkanes alone, LCOHs alone, or both), were reliable. The estimated slopes did not differ from unity in
any case (P > 0.82), as shown in Figure 2. However, the width of the confidence limits for the slope was
different for each operator and set of markers used. The intercepts of the fitted line differed from zero for
the experienced operator one (P < 0.05), except when estimates were based on n-alkanes alone (P = 0.52).
For operator two, the intercept did not differ from zero for any combination of markers (P > 0.82).
In general, the confidence limits for the fitted lines were much narrower for the experienced operator one
than for the new operator two. Still, for operator one, estimates using the LCOH alone were least reliable,
while for operator two predictions based on the n-alkanes alone were less reliable. For both operators, the
combination of the n-alkanes and LCOHs improved the reliability of their predictions, as denoted by a
higher coefficient of determination(푟 ), and a narrower confidence interval for the slopes of the fitted
line. Although the operator’s technical experience affected the variability of individual estimated values,
it had little effect on the overall reliability of estimation.
Please insert Figure 3.2 about here
Kulczyinski Similarity Index
The KSI values (model [5]) for the different markers and operator combinations were tested using model
[6]. Least squares means for operators and sets of markers (n-alkanes, LCOH, n-alkanes and LCOH
combined) for KSI are shown in Table 3.4. No significant differences were found for KSI values for any
of the effects fitted in the model. However, the lowest KSI values were obtained when the LCOH were
used alone, particularly by operator one, and in general when operator two performed the extractions.
Please insert Table 3.4 about here
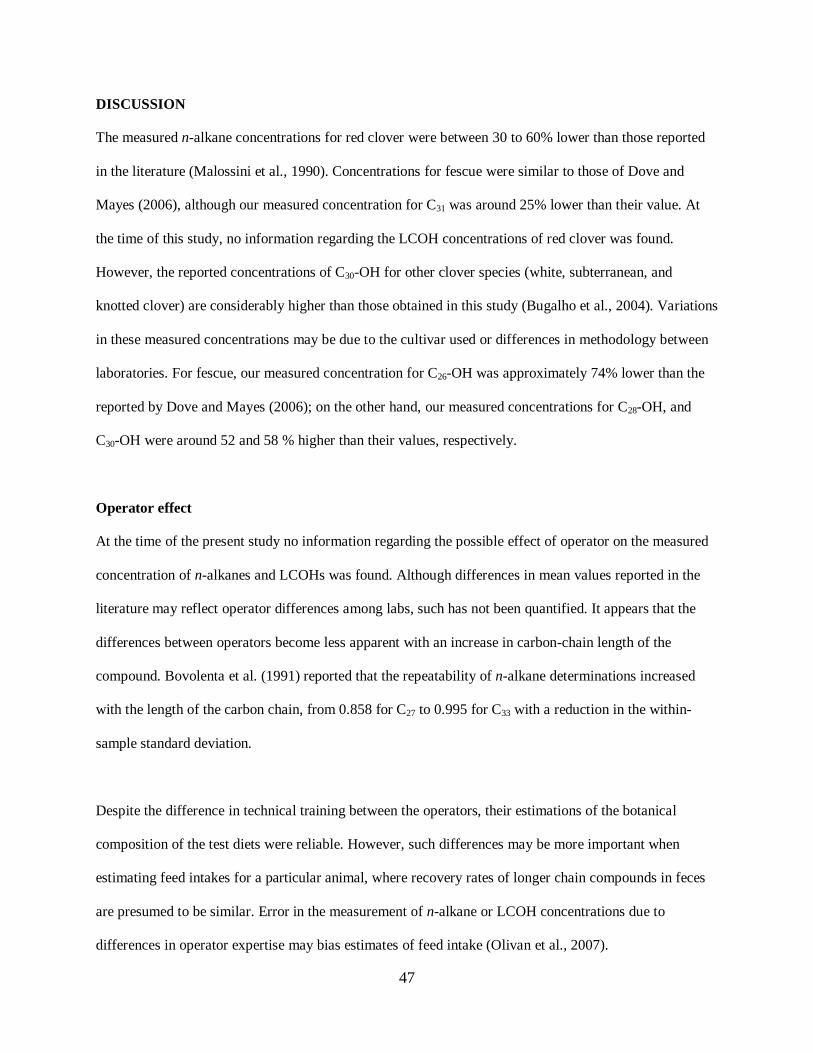
47
DISCUSSION
The measured n-alkane concentrations for red clover were between 30 to 60% lower than those reported
in the literature (Malossini et al., 1990). Concentrations for fescue were similar to those of Dove and
Mayes (2006), although our measured concentration for C31 was around 25% lower than their value. At
the time of this study, no information regarding the LCOH concentrations of red clover was found.
However, the reported concentrations of C30-OH for other clover species (white, subterranean, and
knotted clover) are considerably higher than those obtained in this study (Bugalho et al., 2004). Variations
in these measured concentrations may be due to the cultivar used or differences in methodology between
laboratories. For fescue, our measured concentration for C26-OH was approximately 74% lower than the
reported by Dove and Mayes (2006); on the other hand, our measured concentrations for C28-OH, and
C30-OH were around 52 and 58 % higher than their values, respectively.
Operator effect
At the time of the present study no information regarding the possible effect of operator on the measured
concentration of n-alkanes and LCOHs was found. Although differences in mean values reported in the
literature may reflect operator differences among labs, such has not been quantified. It appears that the
differences between operators become less apparent with an increase in carbon-chain length of the
compound. Bovolenta et al. (1991) reported that the repeatability of n-alkane determinations increased
with the length of the carbon chain, from 0.858 for C27 to 0.995 for C33 with a reduction in the within-
sample standard deviation.
Despite the difference in technical training between the operators, their estimations of the botanical
composition of the test diets were reliable. However, such differences may be more important when
estimating feed intakes for a particular animal, where recovery rates of longer chain compounds in feces
are presumed to be similar. Error in the measurement of n-alkane or LCOH concentrations due to
differences in operator expertise may bias estimates of feed intake (Olivan et al., 2007).
48
Estimation of forage mixtures
The botanical composition of a fescue-red clover test diet was reliably estimated using n-alkanes and
LCOHs individually and in combination. The results of the current study were similar to those of Bezabih
et al. (2011). They regressed proportions of pasture mixes on measured values for forage mixtures
comprised of up to five species. The slope of the regression did not differ from unity, although the fit was
less robust: r2 values ranged from 0.33 to 0.99. With their evaluation of more forage species, such may be
anticipated.
The addition of the LCOHs to the n-alkanes improved the reliability of prediction of the test diet’s
composition. Such an effect has been reported elsewhere. In studies with diets containing several forage
components, predictions based on n-alkanes or LCOHs alone had reduced accuracy compared to that with
a combination of markers (n-alkanes, LCOHs and long chain fatty acids (LCFA); Lin et al., 2012).
Similarly, Ferreira et al. (2009) concluded that the combination of LCFA and n-alkanes as markers
increased the accuracy of prediction, when compared to the use of these markers alone.
Similar concentrations of C26-OH in fescue and red clover suggest that this particular alcohol provides
less information for estimating the botanical composition of their mixture. However, it may be useful if
its profile is sufficiently different in other forage species. In other studies, different markers have been
shown to be less discriminating. Lewis et al. (2003) reported that in a mixture of Lucerne and ryegrass,
C27 appeared to be less useful for prediction of feed intake. Cortes et al. (2005) found that in tropical
grasses and legumes, a number of n-alkanes (including C25, C27, and C29) had different discriminatory
power, depending on the season of the year. Thus, the usefulness of any particular marker might be
plant, season, and climate dependent. Despite low concentrations of C27 and C33, particularly in red
clover, these two n-alkanes appear to provide good discriminating information, as their profiles differ
from that of fescue.
49
Multivariate techniques, such as PCA, or discriminant analysis, provide a means to determine which set
of markers are more useful for predictive purposes. Based on discriminant analysis, Bugalho et al. (2004)
reported that the proportion of variation explained using n-alkanes, LCOHs or their combination differed
among plant mixtures, suggesting that marker choices are diet dependent.
Kulczynski similarity Index Values
As reported by Ferreira et al. (2009), KSI values appeared to be higher for predictions based on n-alkanes.
Adding LCOHs did not improve matters. In contrast, Lin et al. (2012) found that KSI values increased
with combinations of n-alkanes, LCOHs and LCFAs, although the extent of that increase was determined
by the diet. This similarity index appears to offer a means to determine if the combination of different
markers provides additional discriminating information to predict diet composition. In studies assessing
compositional dissimilarity of plant species between different sites, the KSI appeared to be more robust
than other measures of quantitative similarity (Faith et al., 1987).
Implications
Our results suggest that for fawn fescue and red clover forages, the botanical composition of mixed diets
can be reliably predicted. Therefore, we expect that the diet choice of animals when offered these forages
can be successfully determined. Since fescue and red clover are commonly found in pasture systems in
the eastern states (Tracy and Sanderson, 2000; Franzluebbers, 2007), this tool appears appropriate for
estimating the diet choice of grazing animals within this region.
The differences in the reliability of predictions using n-alkanes and LCOHs between the experienced and
less experienced operator were relatively small. Therefore, with only a short training period, it seems
feasible to develop and implement this methodology for the analysis of plant-wax components within a
laboratory.
50
Acknowledgements
Financial support from USDA-ARS for project 1932-21630-003-06 is greatly appreciated. We are
thankful to Donald Wirth (Saddle Butte Ag Inc., Shedd, OR, USA) for supplying the forages (hays), to
Phillip and Edgar McCracken (McHay Company, Elgin, OK, USA) for feed processing (cubing), and
Ellie Stephens (Virginia Tech, Blacksburg, VA, USA) for technical editing.
References
ALI H. A. M., MAYES R. W., HECTOR B. L., and ORSKOV E. R. (2005) Assessment of n-alkanes,
long-chain fatty alcohols and long-chain fatty acids as diet composition markers: The
concentrations of these compounds in rangeland species from Sudan. Animal Feed Science and
Technology, 121, 257-271.
ARTHUR P. F., ARCHER J. A., and HERD R. M. (2004) Feed intake and efficiency in beef cattle:
overview of recent Australian research and challenges for the future. Australian Journal of
Experimental Agriculture, 44, 361-369.
BEZABIH M., PELLIKAAN W. F., and HENDRICKS W. H. (2011) Using n-alkanes and their carbon
isotope enrichments (δ13C) to estimate the botanical composition of pasture mixes from the Mid
Rift Valley grasslands of Ethiopia. Livestock Science, 142, 298-304.
BOVOLENTA S., PIASENTIER E., and MALOSSINI F.(1991) N-alkanes as markers in feeding trials.
In: Proc. EEC Workshop on Grazing Behaviour of Goats and Sheep, Cahiers Options
Méditerranéennes, Vol. 5 pp29-38, CIHEAM, Zaragoza.
BUGALHO M. N., DOVE H., KELMAN W., TODD J. F., and MAYES R. W. (2004) Plant wax alkanes
and alcohols as herbivore diet composition markers. Journal of Range Management, 57, 259-268.
DOVE H. and MAYES R.W. (2005) Using n-alkanes and other plant wax components to estimate intake,
digestibility and diet composition of grazing/browsing sheep and goats. Small Ruminant Research,
59, 123-139.
51
DOVE H. and MAYES R.W. (2006) Protocol for the analysis of n-alkanes and other plant-wax
compounds and for their use as markers for quantifying the nutrient supply of large mammalian
herbivores. Nature Protocols, 1, 1680-1697.
DOVE H. and MOORE A. D. (1995) Using a least squares optimization procedure to estimate botanical
composition based on the alkanes of plant cuticular wax. Australian Journal of Agricultural
Research, 46, 1535-1544.
FAITH D. P., MINCHIN P. R., and BELBIN L. (1987) Compositional dissimilarity as a robust measure
of ecological distance. Vegetatio, 69, 57-68.
FERREIRA L. M .M, CARVALHO S., FRANCO V., CELAYA R., GARCIA U., SANTOS A. S.,
RODRIGUES M. A. M., and OSORO K. (2009) Assessment of very long-chain fatty acids as
complementary or alternative natural fecal markers to n-alkanes for estimating diet composition of
goats feeding on mixed diets. Journal of Animal Science, 87, 2732-2745.
FRANZLUEBBERS A. J. (2007). Integrated crop-livestock systems in the southeastern USA. Agronomy
Journal, 99, 361-372.
KELMAN W., BUGALHO M., DOVE H. (2003) Cuticular wax alkanes and alcohols used as markers to
estimate diet composition of sheep (Ovis aries). Biochemical Systematics and Ecology, 31, 919-
927.
LEWIS R. M., MAGADLELA A. M., JESSOP N. S., and EMMANS G. C. (2003) The ability of the n-
alkane technique to estimate intake and diet choice of sheep. Animal Science, 77, 319-327.
LIN L. J., ZHU X. Y., JIANG C., LUO H. L., WANG H., ZHANG Y. J., and HONG F. Z. (2012) The
potential use of n-alkanes, long-chain alcohols and long-chain fatty acids as diet composition
markers: indoor validation with sheep and herbage species from the rangeland of Inner Mongolia of
China. Animal, 6, 449-458.
MALOSSINI F., BOVOLENTA S., PIASENTIER E., PIRAS C., and MARTILLOTI F. (1996)
Comparison of n-alkanes and chromium oxide methods for estimating herbage intake by grazing
dairy cows. Animal Feed Science and Technology, 61, 155-165.
52
MALOSSINI F., PIASENTIER E., AND BOVOLENTA S. (1990) N-alkane content of some forages.
Journal of the Science of Food and Agriculture, 53, 405-409.
MORAIS J. A. S., BERCHIELLI T. T., DE VEGA A., QUEIROZ M. F. S., KELI A., REIS R. A.,
BERTIPAGLIA L. M. A., and SOUZA S. F. (2011) The validity of n-alkanes to estimate intake
and digestibility in Nellore beef cattle fed a tropical grass (Brachiaria brizantha cv. Marandu).
Livestock Science, 135, 184-192.
MORENZ M. J., COELHO DA SILVA J. F., MAGALHÃES L. J., DERESZ F., MALDONADO H.,
CAMPOS D. S., FERRAZ F. C., WYLLIE A. C., and DETMANN E. (2006) Óxido de cromo e n-
alcanos na estimativa do consumo de forragem de vacas em lactação em condições de pastejo.
Revista Brasileira de Zootecnia, 35, 1535-1542.
OLIVÁN M., L. M. M. FERREIRA, GARCÍA U., CELAYA R., and OSORO K. (2007) Application of
n-alkanes as diet composition markers in grazing/browsing goats and sheep: effect of using
different faecal recovery corrections and plant species grouping approaches. Australian Journal of
Agricultural Science, 58, 1013-1022.
OOSTING, J. H. (ed.) (1956). The Study of plant communities, pp.77, 78. San Francisco, California,
USA: W.H. Freeman and Company.
OTT, R. L. and M. LONGNECKER (eds) (2010). Introduction to statistical methods and data analysis,
pp 572-598. Belmont, California, USA: Brooks/Cole.
PENNING P. D., and JOHNSON R. H. (1983) The use of internal markers to estimate herbage
digestibility and intake 2. Indigestible acid detergent fibre. Journal of Agricultural Science, 100,
133-138.
R DEVELOPMENT CORE TEAM (2011). R: A language and environment for statistical computing. R
foundation for Statistical Computing, Vienna, Austria. ISBN 3-900051-07-0, URL http://www.R-
project.org/.
RUTTER M. S. (2010) Review: Grazing preferences in sheep and cattle: Implications for production, the
environment and animal welfare. Canadian Journal of Animal Science, 90, 285-293

53
TRACY B. F., and SANDERSON M. A. (2000) Patterns of plant species richness in pasture lands of the
northeast United States. Plant Ecology, 149, 169-180.
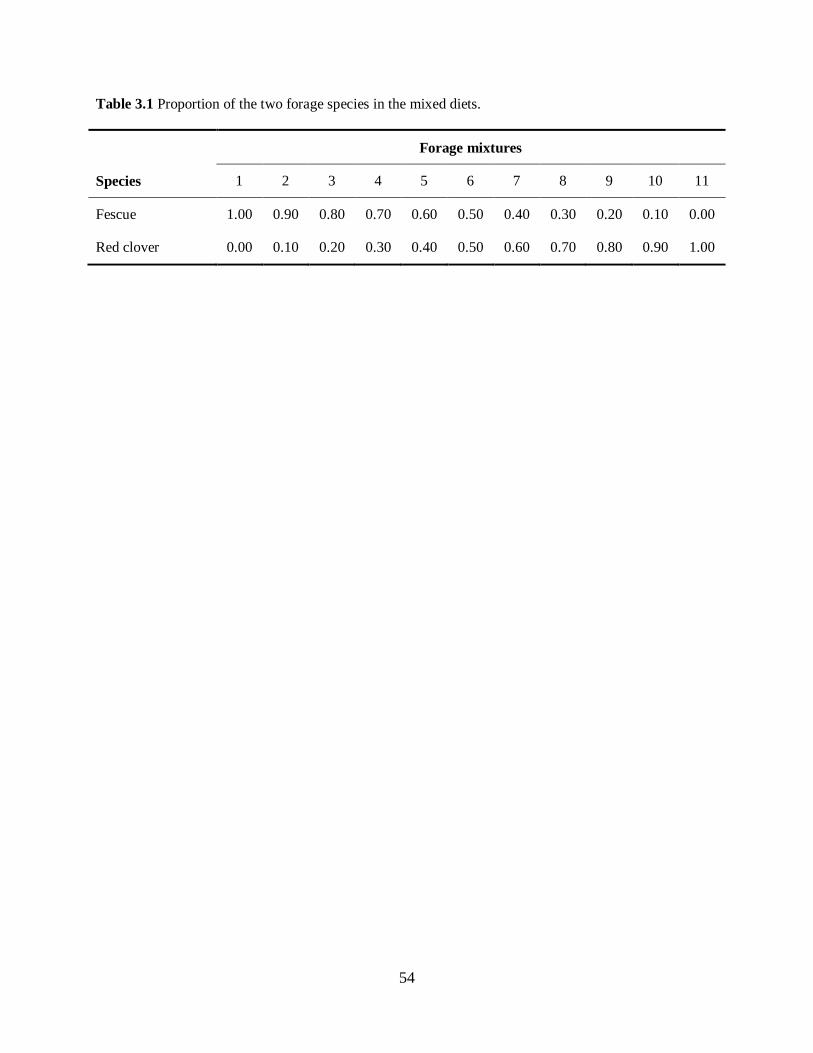
54
Table 3.1 Proportion of the two forage species in the mixed diets.
Forage mixtures
Species 1 2 3 4 5 6 7 8 9 10 11
Fescue 1.00 0.90 0.80 0.70 0.60 0.50 0.40 0.30 0.20 0.10 0.00
Red clover 0.00 0.10 0.20 0.30 0.40 0.50 0.60 0.70 0.80 0.90 1.00
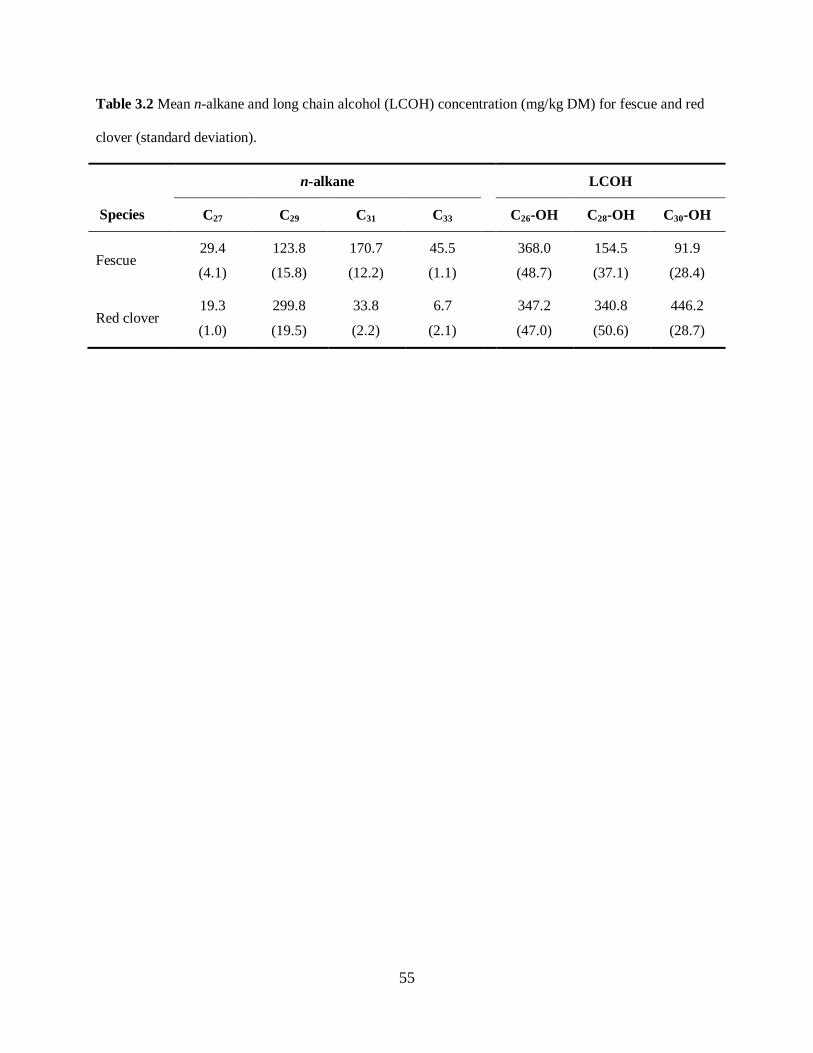
55
Table 3.2 Mean n-alkane and long chain alcohol (LCOH) concentration (mg/kg DM) for fescue and red
clover (standard deviation).
n-alkane LCOH
Species C27 C29 C31 C33 C26-OH C28-OH C30-OH
Fescue 29.4
(4.1)
123.8
(15.8)
170.7
(12.2)
45.5
(1.1)
368.0
(48.7)
154.5
(37.1)
91.9
(28.4)
Red clover 19.3
(1.0)
299.8
(19.5)
33.8
(2.2)
6.7
(2.1)
347.2
(47.0)
340.8
(50.6)
446.2
(28.7)
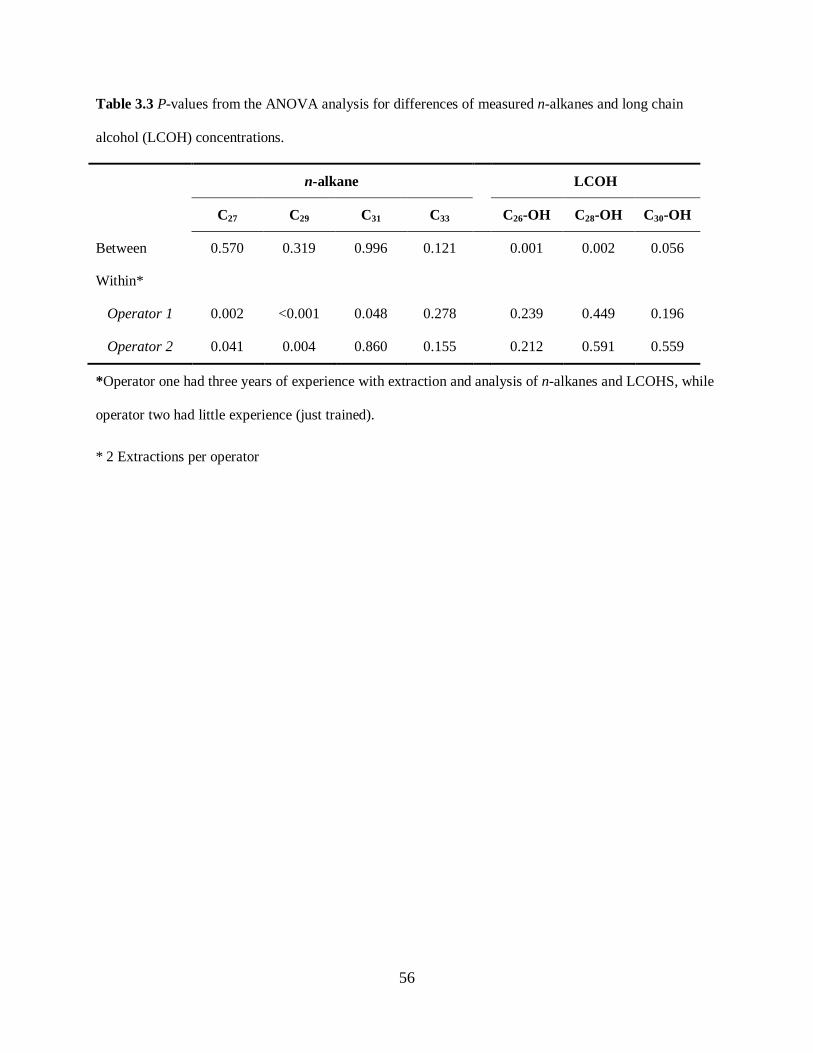
56
Table 3.3 P-values from the ANOVA analysis for differences of measured n-alkanes and long chain
alcohol (LCOH) concentrations.
n-alkane LCOH
C27 C29 C31 C33 C26-OH C28-OH C30-OH
Between 0.570 0.319 0.996 0.121 0.001 0.002 0.056
Within*
Operator 1 0.002 <0.001 0.048 0.278 0.239 0.449 0.196
Operator 2 0.041 0.004 0.860 0.155 0.212 0.591 0.559
*Operator one had three years of experience with extraction and analysis of n-alkanes and LCOHS, while
operator two had little experience (just trained).
* 2 Extractions per operator
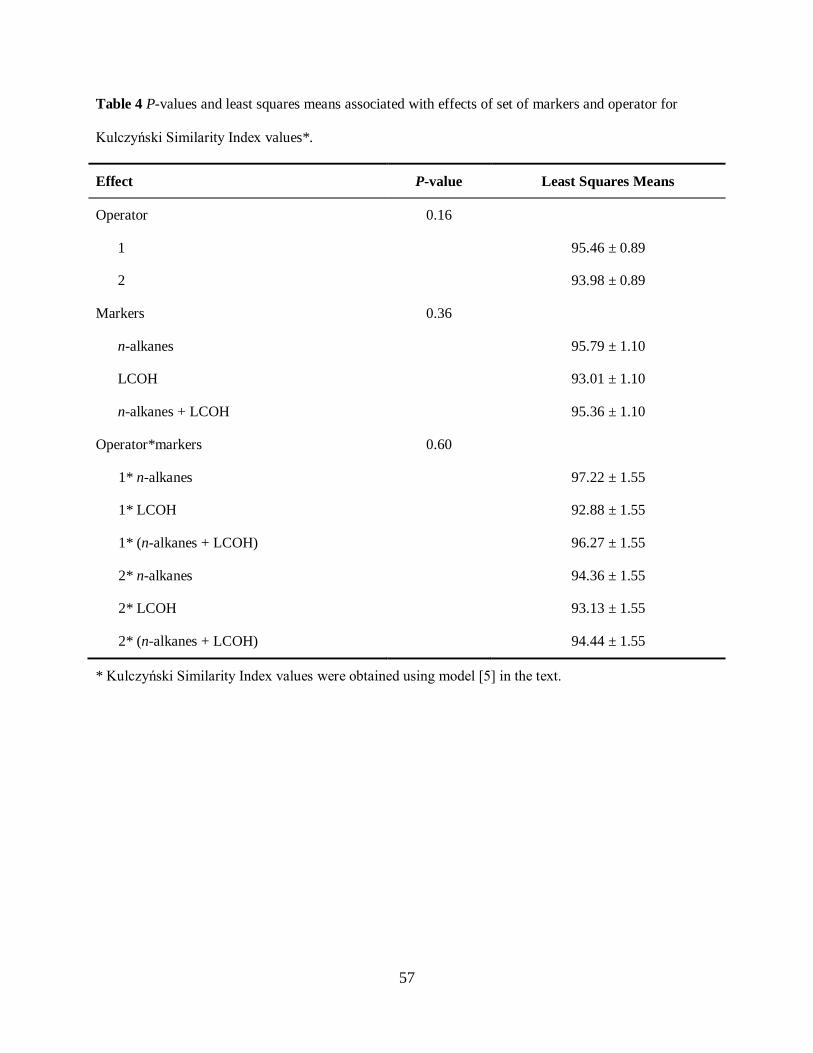
57
Table 4 P-values and least squares means associated with effects of set of markers and operator for
Kulczyński Similarity Index values*.
Effect P-value Least Squares Means
Operator 0.16
1
95.46 ± 0.89
2
93.98 ± 0.89
Markers 0.36
n-alkanes
95.79 ± 1.10
LCOH
93.01 ± 1.10
n-alkanes + LCOH
95.36 ± 1.10
Operator*markers 0.60
1* n-alkanes 97.22 ± 1.55
1* LCOH 92.88 ± 1.55
1* (n-alkanes + LCOH) 96.27 ± 1.55
2* n-alkanes 94.36 ± 1.55
2* LCOH 93.13 ± 1.55
2* (n-alkanes + LCOH) 94.44 ± 1.55
* Kulczyński Similarity Index values were obtained using model [5] in the text.
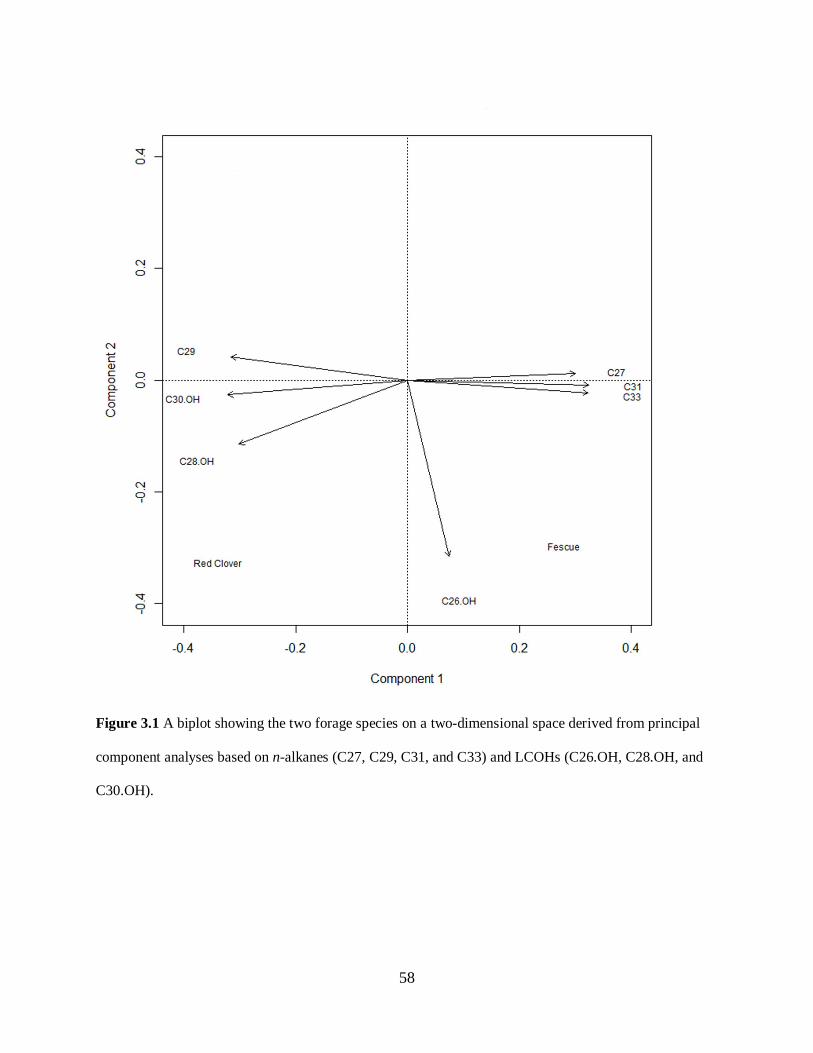
58
Figure 3.1 A biplot showing the two forage species on a two-dimensional space derived from principal
component analyses based on n-alkanes (C27, C29, C31, and C33) and LCOHs (C26.OH, C28.OH, and
C30.OH).
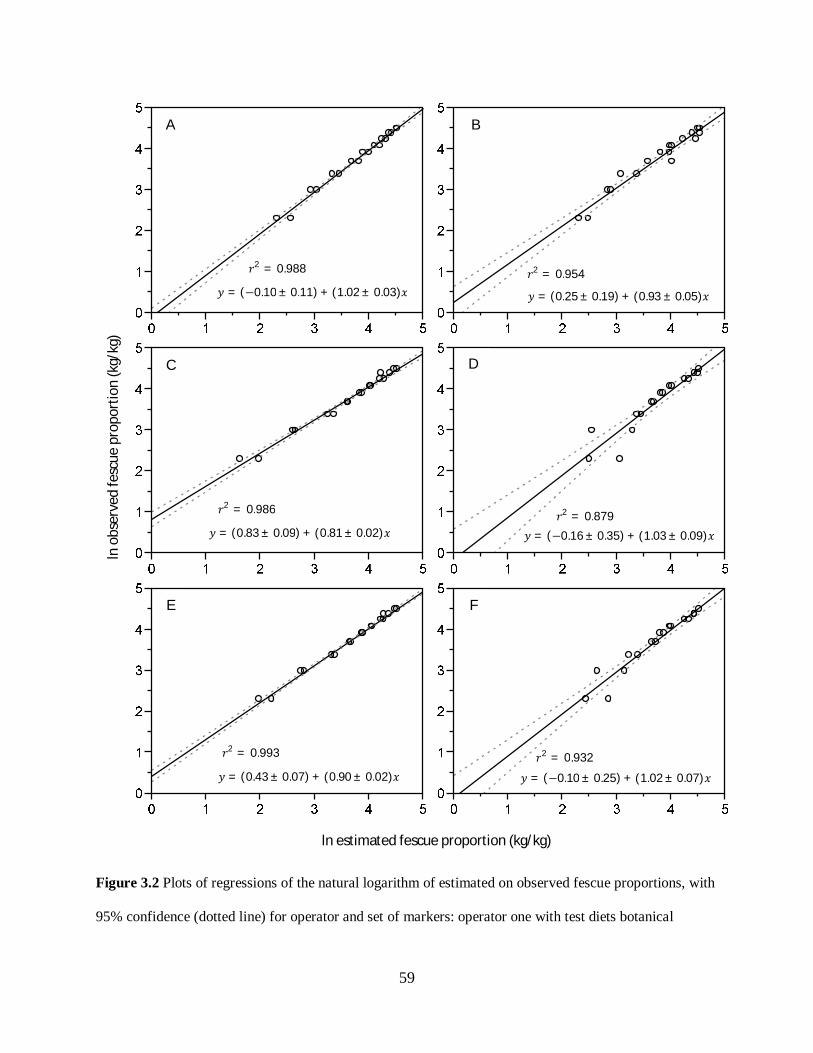
59
Figure 3.2 Plots of regressions of the natural logarithm of estimated on observed fescue proportions, with
95% confidence (dotted line) for operator and set of markers: operator one with test diets botanical
ln estimated fescue proportion (kg/kg)
ln o
bser
ved
fesc
ue p
ropo
rtio
n (k
g/kg
) A B
C D
E F
푦 = (−0.10 ± 0.11) + (1.02 ± 0.03)푥 푟2 = 0.988
푦 = (0.25 ± 0.19) + (0.93 ± 0.05)푥 푟2 = 0.954
푦 = (0.83 ± 0.09) + (0.81 ± 0.02)푥 푟2 = 0.986
푦 = (−0.16 ± 0.35) + (1.03 ± 0.09)푥 푟2 = 0.879
푦 = (0.43 ± 0.07) + (0.90 ± 0.02)푥 푟2 = 0.993
푦 = (−0.10 ± 0.25) + (1.02 ± 0.07)푥 푟2 = 0.932
60
compositions estimated based on n-alkanes, LCOH and their combination (A, C, E); operator two with
test diets botanical compositions estimated based on n-alkanes, LCOH, and their combination (B, D, F).
The coefficients and R2 values for the fit of each regression is also shown.
61
CHAPTER 4
Estimation of feed intake and diet choice in beef cattle using n-alkanes: validation of their
reliability in indoor studies
Vargas Jurado, N., A. E. Tanner, S. Blevins, J. Rich, D. Fiske, W. S. Swecker, Jr., H. M. McNair, R.
W. Mayes and R. M. Lewis
ABSTRACT
Measuring feed intake and diet choice in grazing animals is challenging, complicating the assessment of
feed efficiency in pasture-based systems. Furthermore, animals may modify their intake of a particular
forage species depending on its nutritive value and on their own physiological status. For instance,
animals growing to larger mature sizes have higher maintenance requirements, which may affect their
dietary choices. Various fecal markers have been used to estimate feed intake in grazing animals.
However, plant-wax markers such as long-chain n-alkanes appear to provide reliable estimates of both
dietary choices and intakes. Still, their use in beef cattle has been relatively limited. The present study was
designed to test the reliability of the n-alkane technique to estimate beef heifer’s diet choices. In addition,
its aim was to evaluate diet choice and feed efficiency in beef heifers of large and moderate frame size
(FS) at two ages (post-weaning at approximately 260 days of age, and as yearlings). Twenty four Angus-
cross heifers were evaluated at the two ages. At each age, they were housed in a drylot equipped with a
Calan-Gate system, and fed red clover and fescue hay as cubes. Following 3-week acclimation periods,
DMI of each forage species was assessed daily for 10 days. During the final 5 days, fecal grab samples
were collected twice daily. Body weights were recorded at least weekly, and as often as daily during the
fecal collection periods. Large frame size and moderate frame size did not differ in ADG, feed conversion
ratio and Kleiber ratio (P>0.05). However, animals from large FS had higher total and red clover DMI
(P<0.05), and higher proportions of red clover in their diet (P<0.001), as yearlings. Diet choices were
reliability estimated when n-alkane concentrations in the feces were corrected for incomplete recoveries.
62
Relative errors in estimation varied from 5.6 to 12.2%. It appears that the n-alkane technique is a useful
tool for the estimation of diet choice in animals fed forages at least under controlled conditions.
KEYWORDS: n-alkanes, feed intake, diet choice, beef cattle, efficiency
INTRODUCTION
Quantification of feed intake by grazing animals presents a number of challenges. Although animals in
grazing conditions may have ad libitum access to forages, their nutritive values can be limiting. Animals
may modify their intake of the available forages over time in order to meet their needs. Therefore, having
a measure of diet choice becomes important to estimate feed efficiency in grassland systems (Rutter,
2010; Vargas Junior et al., 2011), and in their management.
Beyond the characteristics of the forages on offer, the risk of productive and reproductive inefficiencies of
larger frame size (FS) cattle within pasture-based systems has been raised (Vargas et al., 1999). It has
been suggested that smaller FS cattle are better suited to such production systems (Taylor et al., 2008;
Koknaroglu and Hoffman, 2010).
Although several approaches for the predicting feed intake have been used, fecal markers seem to provide
the most reliable estimates (Prigge et al., 1981; Owens and Hanson, 1992). However, some of these
techniques, such as chromic oxide, do not allow for diet choice to be predicted (Dove and Mayes, 2000).
Plant-wax markers, such as n-alkanes (aliphatic hydrocarbons) and long chain alcohols (LCOH), have
been demonstrated to be fairly reliable for prediction of both feed intake and diet choice (Dove and
Mayes, 2006).
The majority of n-alkanes found in plant species are odd-chain. Therefore, even-chain n-alkanes have
been used as external markers. Particularly when long-chained, the recovery rates of adjacent n-alkanes
are similar, and the ratio of natural (odd-chain) and dosed n-alkanes have been used to estimate feed
intake without the need for complete fecal collections. However, incomplete recovery of n-alkanes (both
natural and dosed) may occur, necessitating use of a correction factor to improve the reliability of
estimates of diet choice. (Dove and Mayes, 1991; Elwert et al., 2008).
63
Since the estimation of feed intake requires dosing with even-chain n-alkanes, commonly C32 or C36, the
process of dosing need to be considered. Several methodologies have been used, some requiring daily
handling of animals. In studies aiming to describe feed intake in grazing conditions, minimal disturbance
of feeding behavior is undoubtedly important (Charmley and Dove, 2007). Moreover, diurnal variation in
the concentration of the dosed n-alkane in the feces needs to be considered when implementing a dosing
and fecal sampling scheme (Olivan et al., 2007; Elwert et al., 2008).
The ability of the n-alkane technique for the delineation of feed efficiency under grazing conditions needs
to be addressed and tested first in controlled conditions so extraneous sources of error can be taken into
account (Lin et al., 2012). This study was designed to address the validity of the n-alkane technique for
the prediction of feed intake and diet choice in beef heifers and to delineate the feed efficiency (actual
intake and diet choice) of animals of large and moderate frame size at two physiologically immature ages
(post-weaning and yearling). Two forages, fescue and red clover, commonly found in grazing systems in
the Appalachian region were considered (Tracy and Sanderson, 2000; Franzluebbers, 2007).
MATERIALS AND METHODS
All of the techniques and procedures used were approved and performed in compliance with the
Institutional Animal Care and Use Committee at Virginia Tech.
Animals
The experiment was performed at the Shenandoah Valley Agricultural Research and Extension Center
(SVAREC), in western Virginia. Twenty-four spring born heifers, at least 75% Angus in breeding, were
drawn from a moderate and a large frame score line at SVAREC. Measurements on these heifers were
recorded at two ages or studies: (i) at approximately 260 days of age (post-weaning) at an average body
weight (BW) of 285.3 ± 7.1 kg for the moderate line and 317.7 ± 7.4 for the larger line; and (ii) at
approximately 365 days of age (yearlings) at average BW of 342.8 ± 7.8 kg, and 390.7 ± 7.8 kg for the
moderate and large frame size lines, respectively (Table 4.1). During study 1 (post-weaning), one animal
64
was removed due to ill health and another due to its refusal to eat the matrix with the external markers.
These two animals were replaced for the measurements recorded during study 2 (yearling).
Please place Table 4.1 about here
Experimental layout
All animals were housed in a drylot, in two separate pens. Each pen was equipped with 12 Calan gates
(American Calan, NH) to allow measurement of individual animal intakes. For each study, animals were
allowed an adaptation period of 7 days to adjust to the facilities and feeds (Figure 4.1). Gates remained
unlocked, with animals having access to any feeding bunk. During this period preferences of animals for
feeding in a particular gate were noted, so that assignment of the keys corresponding to individual gates
best matched animal preference. After this adaptation period (on day 8), animals were acclimated to the
use of the Calan gates for 14 days. Gates were locked, and only animals with the key corresponding to a
particular gate had access to the individual feed bunk. During this time animals were also fed ground
peanut hulls, as this was the matrix used later to dose them with external markers. At day 21 animals
started receiving the labeled matrix. Dosing with this matrix lasted for 11 days, of which the last 5 days
overlapped with fecal collection. Each study was 32 days.
Please insert Figure 4.1 about here
Feeding strategy
Grass cubes
In order to minimize wastage, and to more accurately weigh the amount of forage consumed, pure fawn
fescue (Festuca arundinacea) and red clover (Trifolium pratense) hay was finely chopped, pulverized,
and pressed to form 3.18 x 3.18cm cubes, with steam as a moistening agent to facilitate the process
65
(McHay Company, Elgin, OK). Cubes were bagged and stored. Both forages were analyzed for crude
protein (CP), neutral detergent fiber (NDF), acid detergent fiber (ADF), and ash contents (Table 4.2).
Please insert Table 4.2 about here
Animals had ad libitum access to feed from either forage. An insert designed to hold two separate buckets
was placed in each feeding bunk, with each bucket filled with a single cube-type. Each morning (8:00
a.m.), refusals from the previous day were weighed and, if dusty, discarded. The buckets were then re-
filled and their weight recorded. The buckets were checked in the afternoon (3:00 p.m.) and, if necessary,
additional feed weighed and added.
Bucket position
To determine if the physical location of the feed had an effect on the diet choice of an animal, buckets
were switched from left to right daily in study 1 and every other week in study 2. The strategy adopted in
study 2 was to allow animals more opportunity to learn the position of their preferred forage. It would be
anticipated that the bucket located on the right of the feeding bunk insert may be favored as it was easier
to access due to the design of the Calan-Gate system.
External markers dosing strategy
Dosing with the external markers took place from day 21 to 31 (Figure 4.1). A mixture of C32 (n-
Dotriacontane; CAS# 544-85-4; Minakem, SAS, France), C36 (n-Hexatriacontane; CAS# 630-06-8;
Minakem, SAS, France), and Carnauba wax (as a source of C32-OH; CAS# 8015-86-9; Sigma Aldrich, St.
Louis, MO, USA) were melted onto 20g of peanut hulls, previously grounded through a 5mm screen.
Both C32 and C36 were supplied at 1.3mg/kg of BW, while carnauba was offered at 40mg/kg BW. The
average BW of the heifers at the start of the experimental periods was predicted to be 319 kg in study 1,
66
and 352 kg in study 2. Thus 415mg of each n-alkane and 10g of Carnauba wax, or 458mg of each n-
alkane and 14g of Carnauba wax, was fed daily in study 1 and 2, respectively.
The labeled supplement was provided to animals in two ways, either once (D1) or twice (D2) daily.
Animals belonging to D1 received their entire dose in the morning. Animals assigned to D2 received half
their dose in the morning and half in the afternoon. Peanut hulls – either with or without the external
markers depending on dosing treatment – were mixed with 0.25 kg of sweet feed. The feed buckets were
removed from the bunkers, and replaced with separate buckets containing the allotted sweet feed mixture.
The bunkers were checked to ensure the sweet feed was consumed entirely before the buckets with hay
cubes were reinserted. The sweet feed mixture typically was consumed quickly (within a few minutes).
Fecal collection
During the final 5 days of each study, fecal samples were collected twice a day for all animals, either by
rectal grab or from the ground if the animal was identified. When possible, 200g of fecal matter was
obtained from each animal. Samples were placed in individual aluminum containers, and oven dried at 65
°C for 6 to 8 days, or until 1g or less of difference in weight was noted. The dried samples were then
ground on a Wiley Mill through a 1mm screen and stored until analysis.
Laboratory analyses
n-alkane and LCOH extraction
Extractions were performed in duplicate (Mayes and Dove, 2006). Briefly, 0.2g of ground forage sample,
or 0.1g of ground fecal sample, from individual daily a.m. or a.m. samplings, and from pooled a.m. and
pooled p.m. samples were weighed into 16mm x 100mm borosilicate glass tubes. Approximately 0.1g of
n-docosane (C22) and n-tetritriacontane (C34) alkane (0.3mg/g of each alkane), and 0.1g of 1-heptacosanol
(C27-OH), 1.2mg/g) long-chain alcohol (LCOH), were added to each sample tube as internal standards.
Tubes were saponified for 16h at 90◦C in 2ml of ethanolic KOH 1M for forage samples, and 1.5 mL for
fecal samples, using a dry-block heater (Techne DB-3,Techne Ltd., Duxford, Cambridge, UK). Heptane
67
(2mL for forage samples, or 1.5 mL for fecal samples) and distilled water (0.6mL for forage samples and
0.5 for fecal samples) were added to each warmed tube (60°C). The non-aqueous layer was collected after
vigorous shaking yielding a crude extract. Hydrocarbons were collected by solid phase extraction and
heptane elution through a silica-gel column (bed volume 1ml, 70-230 mesh, Fisher Scientific, Fairlawn,
NJ). Crude alcohol extractions were obtained by elution with heptane/ethyl-acetate (80:20 v/v). Long-
chain alcohol fractions were separated from sterols and stanols by solid phase extraction and heptane
elution, and then derivatized using 2µl of a pyridine/acetic anhydride solution (5:1 v/v). Alkane elutes and
LCOH fractions were evaporated to dryness, and then re-dissolved in 200µl of n-dodecane for
chromatographic analysis.
Gas chromatography analysis
Quantification of n-alkanes and LCOH was carried out by gas chromatography (GC), using an Agilent
6890N GC (Agilent Technologies, Inc., Santa Clara, CA). Alkane and LCOH extracts were injected
(0.5µl) via a 7863 Series auto-sampler (splitless injector) directly into a bonded-phase, non-polar column
(Agilent J&W DB-column, 30-meter, 0.530mm internal diameter and 0.5µm film thickness). Helium
served as the carrier gas at a constant flow of 4ml/min. Temperature programming was: 280°C for the
injector; 340°C for the detector; and, 170◦C for 4min for the column oven followed by a first ramp of
30°C/min to 215°C with a 1min hold, and then a second ramp of 6°C/min to 300°C with a 20 min hold.
Samples of an n-alkane and LCOH standard solution mixture (C10 to C40; C20-OH to C30-OH, Sigma-
Aldrich, St. Louis, MO) were included in the GC analyses to determine peak identification and standard
response factors. Chromatograph data were analyzed using Agilent ChemStation software (Rev. B.04.02
SP1). Peak areas were determined with auto-integration and manual review of chromatograms. n-alkane
and LCOH concentrations were calculated relative to known amounts of the internal standards (C22, C34,
and C27-OH), according to the equations outlined by Mayes and Dove (2006):
68
퐶표푛푐푒푛푡푟푎푡푖표푛푛 − 푎푙푘푎푛푒
= ∗% ∗ ( / )∗ ( ) ( )∗ ∗ ∗
, [1]
퐶표푛푐푒푛푡푟푎푡푖표푛퐿퐶푂퐻
= ∗% ∗ ( / )∗ ( ) ( )∗ ∗
, [2]
where 퐶표푛푐퐶 퐼푆 and 퐶표푛푐퐶 푂퐻퐼푆 is the concentration of the n-alkanei or LCOHi internal standard,
respectively, 퐶 퐼푆푤푡 is the weight of the solution containing the internal standard, and %Area is the area
of n-alkanei or LCOHi calculated as the percent area of C34 or C27-OH, respectively. The DM content is
the sample dry weight, SRFi is the average response factor, calculated as the percent area of n-alkanei or
LCOHi in the mixed standard solution divided by the percent weight of n-alkanei or LCOHi in the mixed
standard, and 퐹퐹 is the fractionation factor.
Derived variables
Feed efficiency
Efficiency of feed utilization was assessed through average daily gain (ADG), feed conversion ratio
(FCR), and Kleiber ratio (KR). The ADG and FCR were obtained as the regression of body weight on
days, and as the regression of cumulative feed intake on body weight, respectively. Kleiber ratio was
obtained as the ratio between ADG and mean metabolic body weight (MBW) and multiplied by 100
(Arthur et al., 2001). The values of these variables were obtained from performance levels over the last 10
days of the experiment.
Estimation of diet composition
The amount of fescue and red clover in the diet of each animal was estimated from four n-alkanes found
in the forages and feces: C27, C29, C31, and C33. Estimates were obtained using ‘Eatwhat’ software, which
uses non-negative least squares optimization. This technique best matches the n-alkane profile in the
forages to that of a fecal sample (Dove and Moore, 1995; Newman et al., 1995). These estimates were
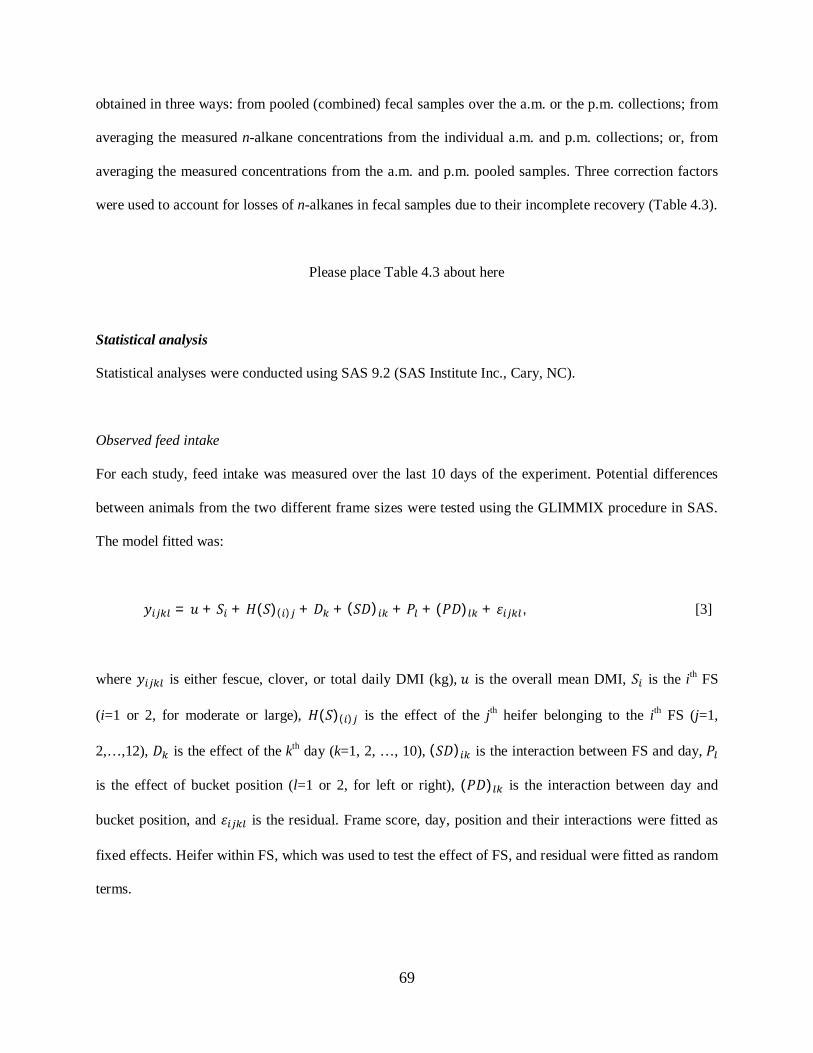
69
obtained in three ways: from pooled (combined) fecal samples over the a.m. or the p.m. collections; from
averaging the measured n-alkane concentrations from the individual a.m. and p.m. collections; or, from
averaging the measured concentrations from the a.m. and p.m. pooled samples. Three correction factors
were used to account for losses of n-alkanes in fecal samples due to their incomplete recovery (Table 4.3).
Please place Table 4.3 about here
Statistical analysis
Statistical analyses were conducted using SAS 9.2 (SAS Institute Inc., Cary, NC).
Observed feed intake
For each study, feed intake was measured over the last 10 days of the experiment. Potential differences
between animals from the two different frame sizes were tested using the GLIMMIX procedure in SAS.
The model fitted was:
푦 = 푢 + 푆 + 퐻(푆)( ) + 퐷 + (푆퐷) + 푃 + (푃퐷) + 휀 , [3]
where 푦 is either fescue, clover, or total daily DMI (kg),푢 is the overall mean DMI, 푆 is the ith FS
(i=1 or 2, for moderate or large), 퐻(푆)( ) is the effect of the jth heifer belonging to the ith FS (j=1,
2,…,12), 퐷 is the effect of the kth day (k=1, 2, …, 10), (푆퐷) is the interaction between FS and day,푃
is the effect of bucket position (l=1 or 2, for left or right), (푃퐷) is the interaction between day and
bucket position, and 휀 is the residual. Frame score, day, position and their interactions were fitted as
fixed effects. Heifer within FS, which was used to test the effect of FS, and residual were fitted as random
terms.
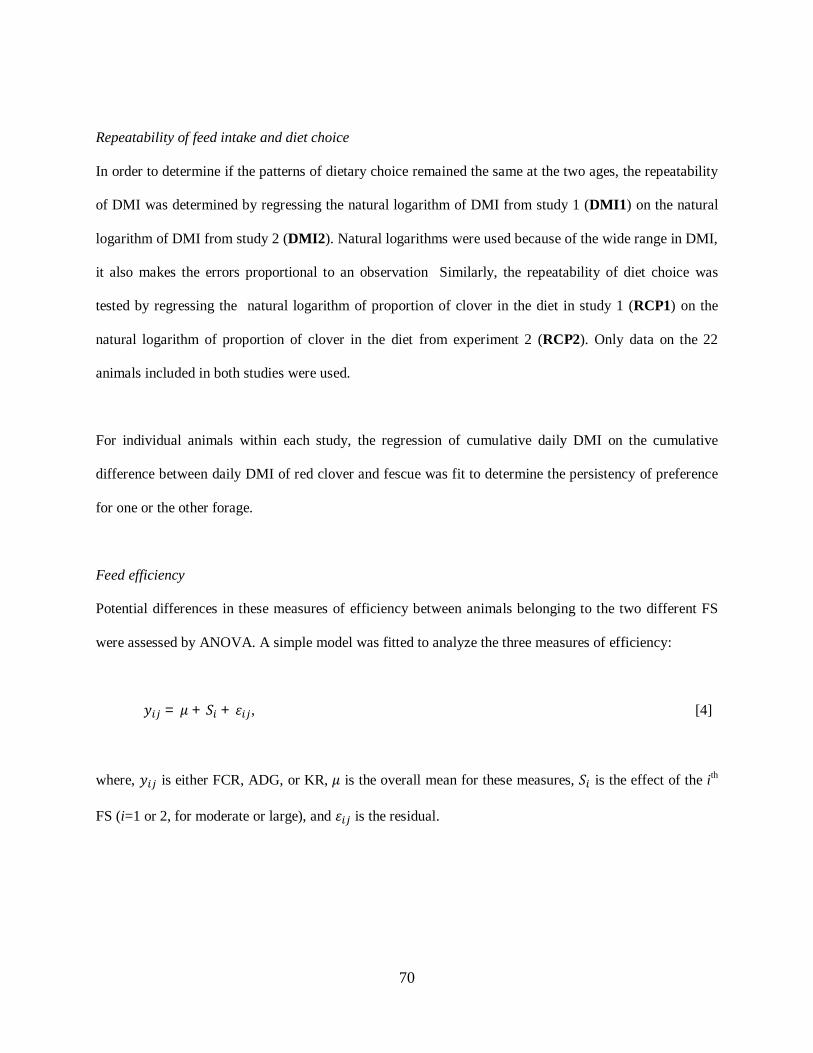
70
Repeatability of feed intake and diet choice
In order to determine if the patterns of dietary choice remained the same at the two ages, the repeatability
of DMI was determined by regressing the natural logarithm of DMI from study 1 (DMI1) on the natural
logarithm of DMI from study 2 (DMI2). Natural logarithms were used because of the wide range in DMI,
it also makes the errors proportional to an observation Similarly, the repeatability of diet choice was
tested by regressing the natural logarithm of proportion of clover in the diet in study 1 (RCP1) on the
natural logarithm of proportion of clover in the diet from experiment 2 (RCP2). Only data on the 22
animals included in both studies were used.
For individual animals within each study, the regression of cumulative daily DMI on the cumulative
difference between daily DMI of red clover and fescue was fit to determine the persistency of preference
for one or the other forage.
Feed efficiency
Potential differences in these measures of efficiency between animals belonging to the two different FS
were assessed by ANOVA. A simple model was fitted to analyze the three measures of efficiency:
푦 = 휇 + 푆 + 휀 , [4]
where, 푦 is either FCR, ADG, or KR, 휇 is the overall mean for these measures, 푆 is the effect of the ith
FS (i=1 or 2, for moderate or large), and 휀 is the residual.
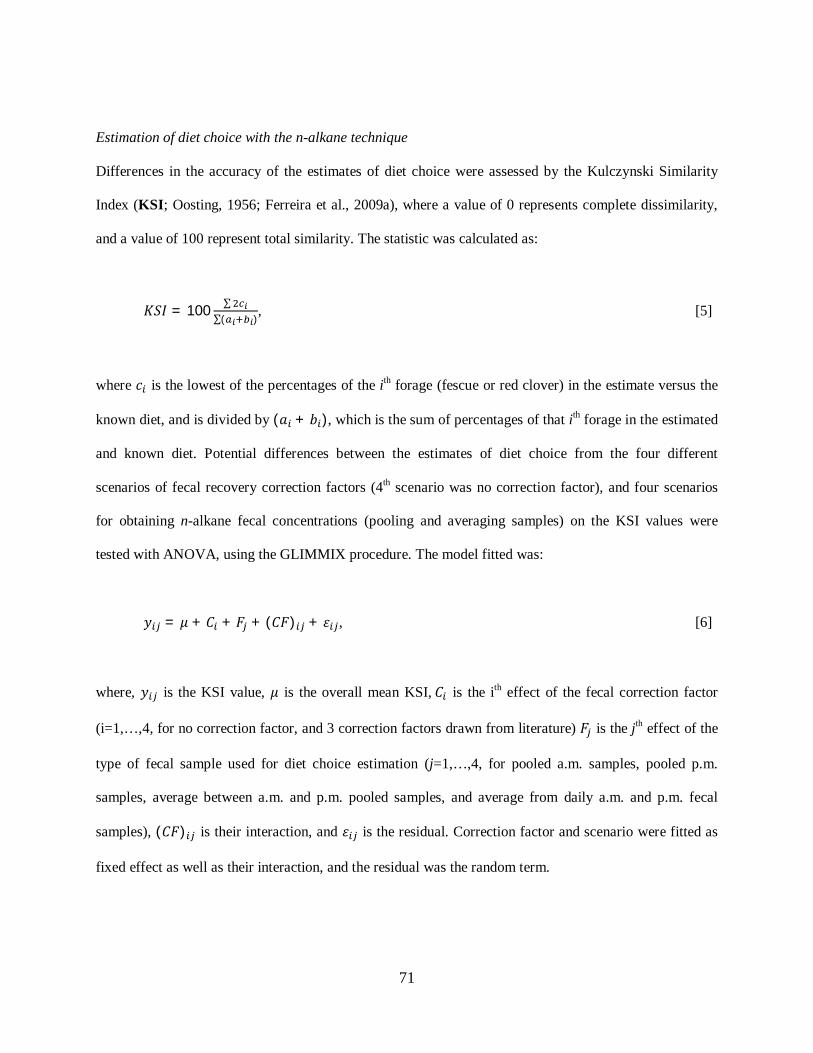
71
Estimation of diet choice with the n-alkane technique
Differences in the accuracy of the estimates of diet choice were assessed by the Kulczynski Similarity
Index (KSI; Oosting, 1956; Ferreira et al., 2009a), where a value of 0 represents complete dissimilarity,
and a value of 100 represent total similarity. The statistic was calculated as:
퐾푆퐼 = 100 ∑∑( )
, [5]
where 푐 is the lowest of the percentages of the ith forage (fescue or red clover) in the estimate versus the
known diet, and is divided by (푎 + 푏 ), which is the sum of percentages of that ith forage in the estimated
and known diet. Potential differences between the estimates of diet choice from the four different
scenarios of fecal recovery correction factors (4th scenario was no correction factor), and four scenarios
for obtaining n-alkane fecal concentrations (pooling and averaging samples) on the KSI values were
tested with ANOVA, using the GLIMMIX procedure. The model fitted was:
푦 = 휇 + 퐶 + 퐹 + (퐶퐹) + 휀 , [6]
where, 푦 is the KSI value, 휇 is the overall mean KSI,퐶 is the ith effect of the fecal correction factor
(i=1,…,4, for no correction factor, and 3 correction factors drawn from literature) 퐹 is the jth effect of the
type of fecal sample used for diet choice estimation (j=1,…,4, for pooled a.m. samples, pooled p.m.
samples, average between a.m. and p.m. pooled samples, and average from daily a.m. and p.m. fecal
samples), (퐶퐹) is their interaction, and 휀 is the residual. Correction factor and scenario were fitted as
fixed effect as well as their interaction, and the residual was the random term.
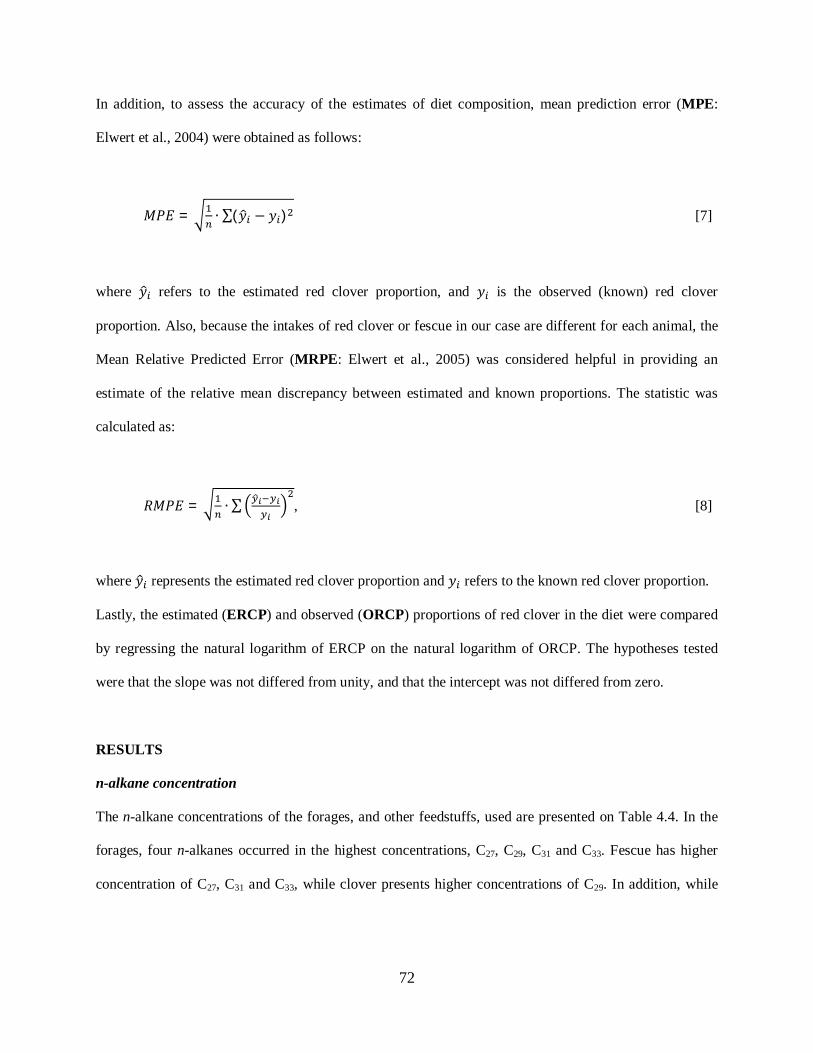
72
In addition, to assess the accuracy of the estimates of diet composition, mean prediction error (MPE:
Elwert et al., 2004) were obtained as follows:
푀푃퐸 = ∙ ∑(푦 − 푦 ) [7]
where 푦 refers to the estimated red clover proportion, and 푦 is the observed (known) red clover
proportion. Also, because the intakes of red clover or fescue in our case are different for each animal, the
Mean Relative Predicted Error (MRPE: Elwert et al., 2005) was considered helpful in providing an
estimate of the relative mean discrepancy between estimated and known proportions. The statistic was
calculated as:
푅푀푃퐸 = ∙ ∑ , [8]
where 푦 represents the estimated red clover proportion and 푦 refers to the known red clover proportion.
Lastly, the estimated (ERCP) and observed (ORCP) proportions of red clover in the diet were compared
by regressing the natural logarithm of ERCP on the natural logarithm of ORCP. The hypotheses tested
were that the slope was not differed from unity, and that the intercept was not differed from zero.
RESULTS
n-alkane concentration
The n-alkane concentrations of the forages, and other feedstuffs, used are presented on Table 4.4. In the
forages, four n-alkanes occurred in the highest concentrations, C27, C29, C31 and C33. Fescue has higher
concentration of C27, C31 and C33, while clover presents higher concentrations of C29. In addition, while
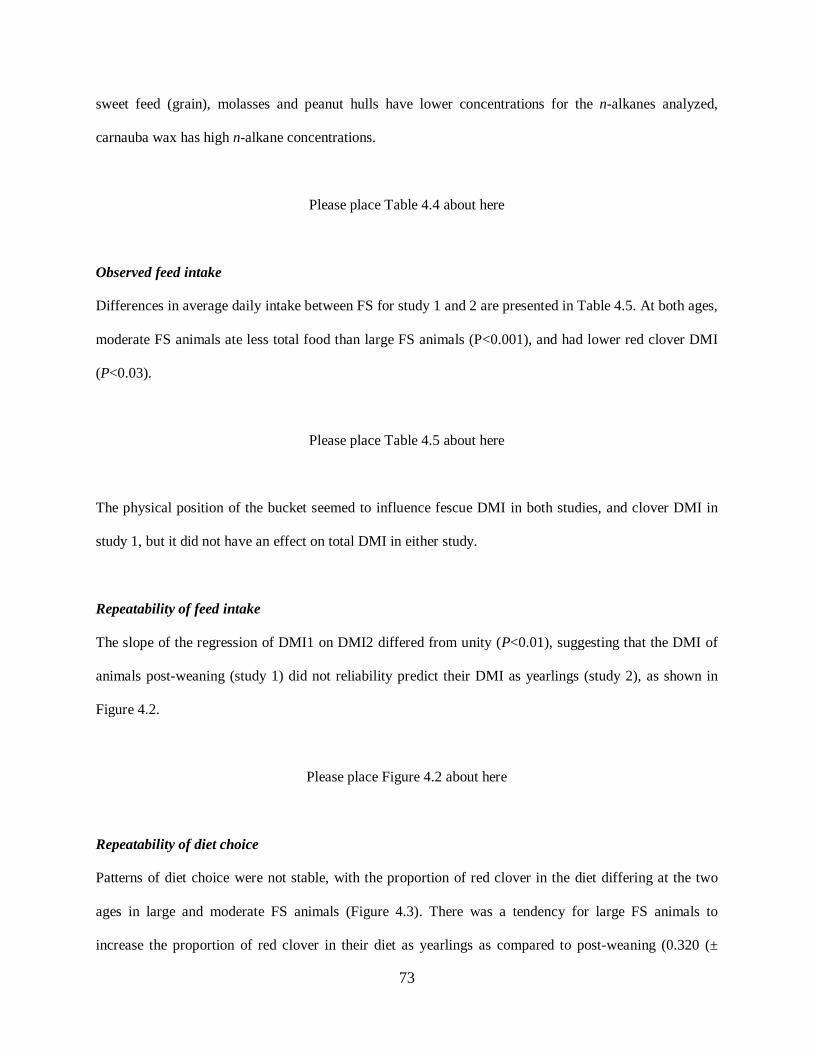
73
sweet feed (grain), molasses and peanut hulls have lower concentrations for the n-alkanes analyzed,
carnauba wax has high n-alkane concentrations.
Please place Table 4.4 about here
Observed feed intake
Differences in average daily intake between FS for study 1 and 2 are presented in Table 4.5. At both ages,
moderate FS animals ate less total food than large FS animals (P<0.001), and had lower red clover DMI
(P<0.03).
Please place Table 4.5 about here
The physical position of the bucket seemed to influence fescue DMI in both studies, and clover DMI in
study 1, but it did not have an effect on total DMI in either study.
Repeatability of feed intake
The slope of the regression of DMI1 on DMI2 differed from unity (P<0.01), suggesting that the DMI of
animals post-weaning (study 1) did not reliability predict their DMI as yearlings (study 2), as shown in
Figure 4.2.
Please place Figure 4.2 about here
Repeatability of diet choice
Patterns of diet choice were not stable, with the proportion of red clover in the diet differing at the two
ages in large and moderate FS animals (Figure 4.3). There was a tendency for large FS animals to
increase the proportion of red clover in their diet as yearlings as compared to post-weaning (0.320 (±
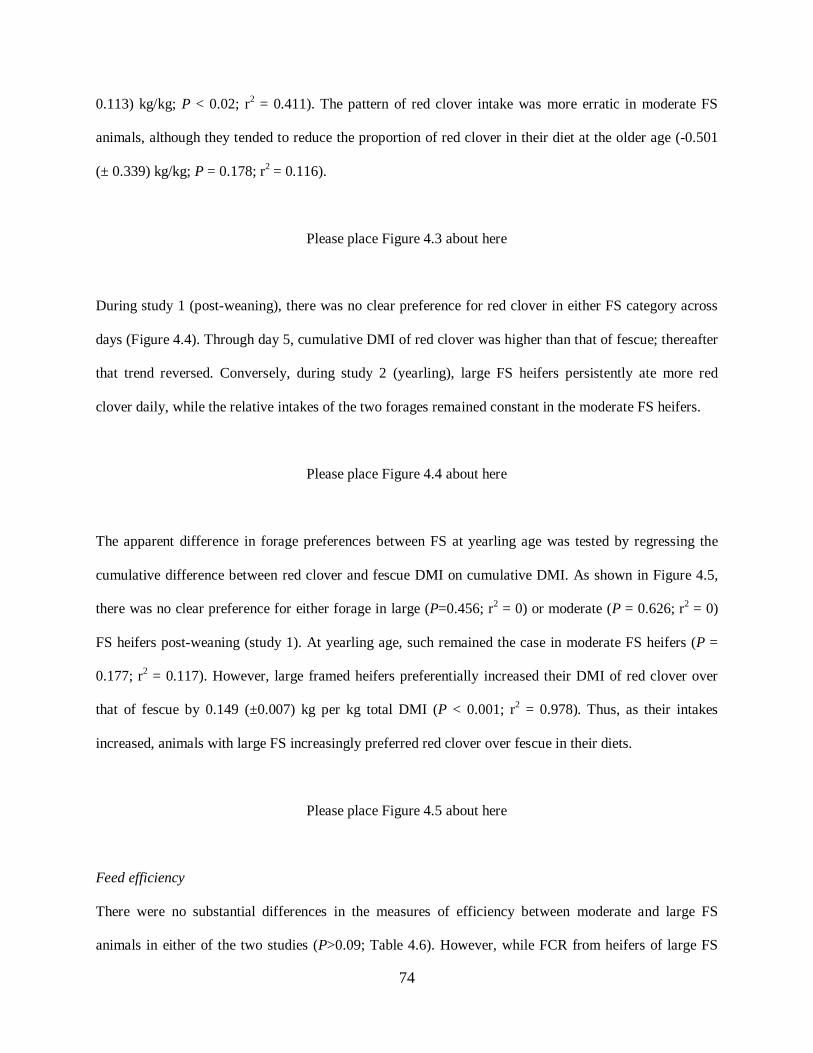
74
0.113) kg/kg; P < 0.02; r2 = 0.411). The pattern of red clover intake was more erratic in moderate FS
animals, although they tended to reduce the proportion of red clover in their diet at the older age (-0.501
(± 0.339) kg/kg; P = 0.178; r2 = 0.116).
Please place Figure 4.3 about here
During study 1 (post-weaning), there was no clear preference for red clover in either FS category across
days (Figure 4.4). Through day 5, cumulative DMI of red clover was higher than that of fescue; thereafter
that trend reversed. Conversely, during study 2 (yearling), large FS heifers persistently ate more red
clover daily, while the relative intakes of the two forages remained constant in the moderate FS heifers.
Please place Figure 4.4 about here
The apparent difference in forage preferences between FS at yearling age was tested by regressing the
cumulative difference between red clover and fescue DMI on cumulative DMI. As shown in Figure 4.5,
there was no clear preference for either forage in large (P=0.456; r2 = 0) or moderate (P = 0.626; r2 = 0)
FS heifers post-weaning (study 1). At yearling age, such remained the case in moderate FS heifers (P =
0.177; r2 = 0.117). However, large framed heifers preferentially increased their DMI of red clover over
that of fescue by 0.149 (±0.007) kg per kg total DMI (P < 0.001; r2 = 0.978). Thus, as their intakes
increased, animals with large FS increasingly preferred red clover over fescue in their diets.
Please place Figure 4.5 about here
Feed efficiency
There were no substantial differences in the measures of efficiency between moderate and large FS
animals in either of the two studies (P>0.09; Table 4.6). However, while FCR from heifers of large FS
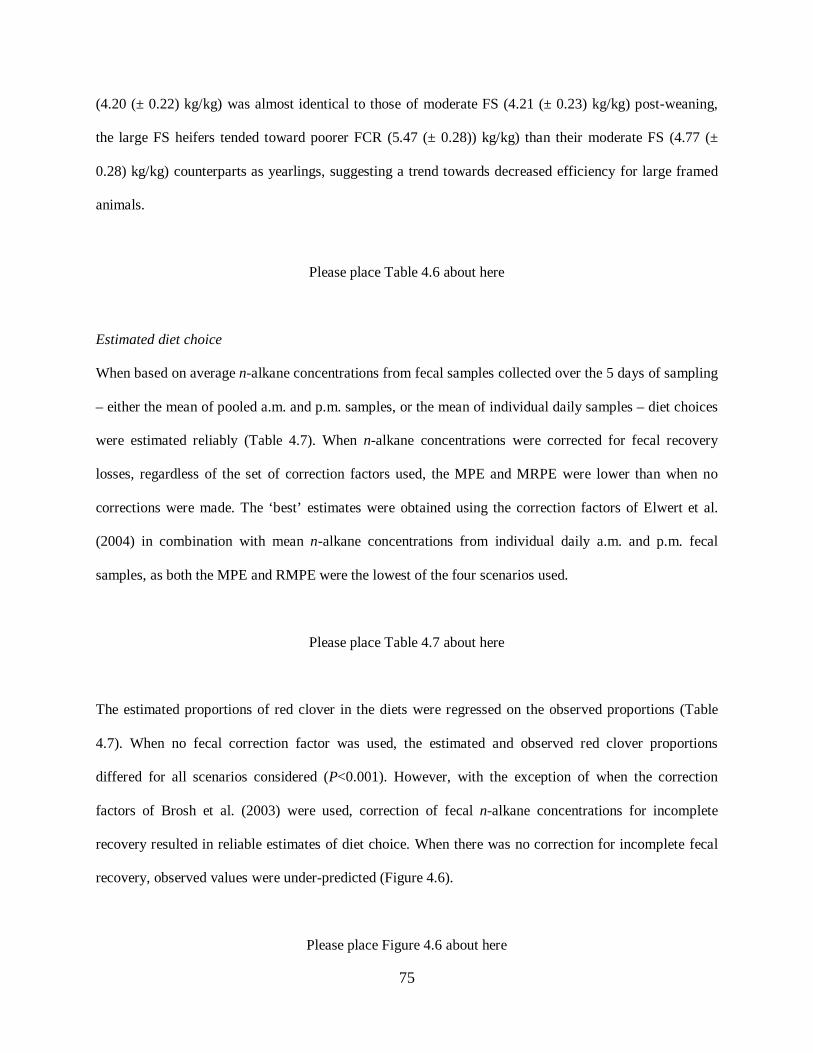
75
(4.20 (± 0.22) kg/kg) was almost identical to those of moderate FS (4.21 (± 0.23) kg/kg) post-weaning,
the large FS heifers tended toward poorer FCR (5.47 (± 0.28)) kg/kg) than their moderate FS (4.77 (±
0.28) kg/kg) counterparts as yearlings, suggesting a trend towards decreased efficiency for large framed
animals.
Please place Table 4.6 about here
Estimated diet choice
When based on average n-alkane concentrations from fecal samples collected over the 5 days of sampling
– either the mean of pooled a.m. and p.m. samples, or the mean of individual daily samples – diet choices
were estimated reliably (Table 4.7). When n-alkane concentrations were corrected for fecal recovery
losses, regardless of the set of correction factors used, the MPE and MRPE were lower than when no
corrections were made. The ‘best’ estimates were obtained using the correction factors of Elwert et al.
(2004) in combination with mean n-alkane concentrations from individual daily a.m. and p.m. fecal
samples, as both the MPE and RMPE were the lowest of the four scenarios used.
Please place Table 4.7 about here
The estimated proportions of red clover in the diets were regressed on the observed proportions (Table
4.7). When no fecal correction factor was used, the estimated and observed red clover proportions
differed for all scenarios considered (P<0.001). However, with the exception of when the correction
factors of Brosh et al. (2003) were used, correction of fecal n-alkane concentrations for incomplete
recovery resulted in reliable estimates of diet choice. When there was no correction for incomplete fecal
recovery, observed values were under-predicted (Figure 4.6).
Please place Figure 4.6 about here
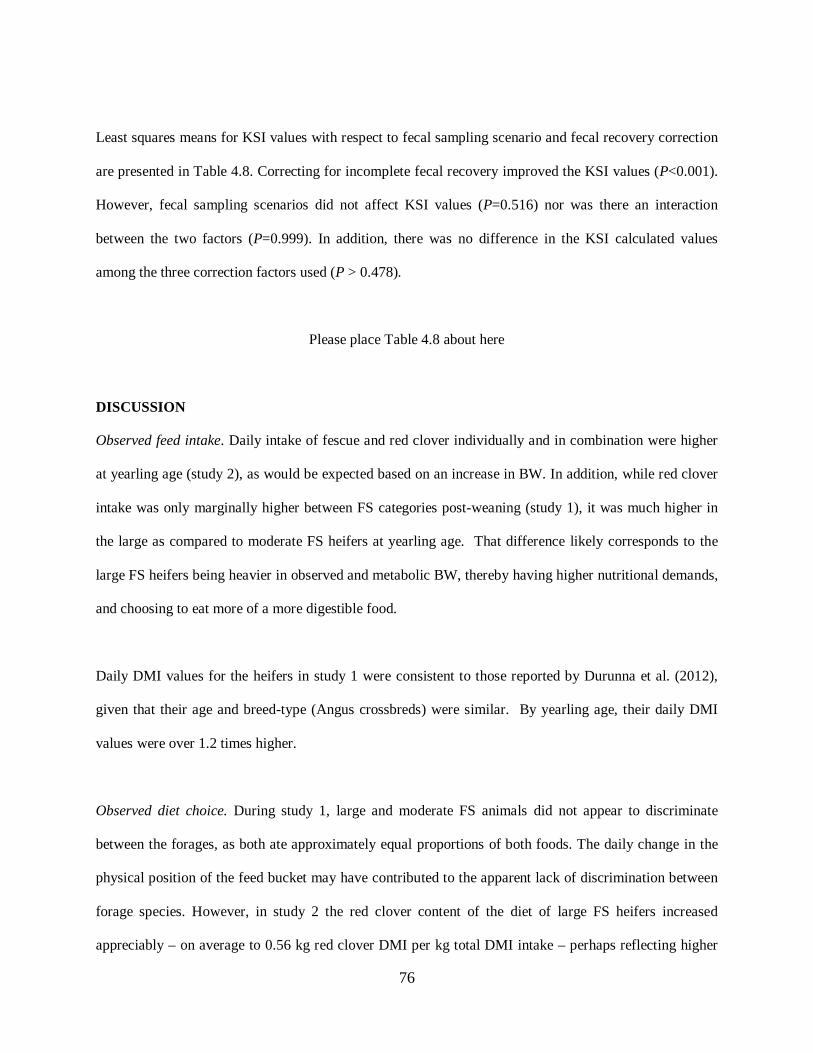
76
Least squares means for KSI values with respect to fecal sampling scenario and fecal recovery correction
are presented in Table 4.8. Correcting for incomplete fecal recovery improved the KSI values (P<0.001).
However, fecal sampling scenarios did not affect KSI values (P=0.516) nor was there an interaction
between the two factors (P=0.999). In addition, there was no difference in the KSI calculated values
among the three correction factors used (P > 0.478).
Please place Table 4.8 about here
DISCUSSION
Observed feed intake. Daily intake of fescue and red clover individually and in combination were higher
at yearling age (study 2), as would be expected based on an increase in BW. In addition, while red clover
intake was only marginally higher between FS categories post-weaning (study 1), it was much higher in
the large as compared to moderate FS heifers at yearling age. That difference likely corresponds to the
large FS heifers being heavier in observed and metabolic BW, thereby having higher nutritional demands,
and choosing to eat more of a more digestible food.
Daily DMI values for the heifers in study 1 were consistent to those reported by Durunna et al. (2012),
given that their age and breed-type (Angus crossbreds) were similar. By yearling age, their daily DMI
values were over 1.2 times higher.
Observed diet choice. During study 1, large and moderate FS animals did not appear to discriminate
between the forages, as both ate approximately equal proportions of both foods. The daily change in the
physical position of the feed bucket may have contributed to the apparent lack of discrimination between
forage species. However, in study 2 the red clover content of the diet of large FS heifers increased
appreciably – on average to 0.56 kg red clover DMI per kg total DMI intake – perhaps reflecting higher
77
maintenance requirements. Still, the proportion of red clover in their diets was lower than that reported by
Rutter (2006), in which beef heifers chose 60% legumes in their diet. Also, although the large FS heifer
expressed a clear tendency to increase their clover intake in study 2, forage choices overall were
somewhat inconsistent. Van Dorland et al. (2007), working with dairy cows, found their preferences for
ryegrass, and white and red clover, were not constant during the timeframe of their experiment. They
suggested this may be due to the relatively small differences in the nutritive value between the forages on
offer, which also is our case (Table 4.2). The main difference between fescue and red clover in our study
is the NDF content, which may not be sufficient to cause substantial differences in their respective
palatability. In many other studies differences in crude protein seemed to be the main driver for diet
selection (Newman, 1992; James et al., 2001).
Feed efficiency. Similar to Corbet et al. (2006), ADG and FCR did not differ between post-weaned
animals from the two different FS; however, our ADG and FCR values were around 30% higher likely
due to breed differences between these experiments. On the other hand, our ADG were very similar to
those of Schutt et al. (2009), although our FCR only half as much. Such difference may be due to their
animals being substantially older (average age of 598 days) than those in our experiment. In addition, KR
values obtained in this study are much higher (more than twice) than those reported by Arthur et al.
(2001), Schutt et al. (2009), and Durunna et al. (2012). While the age of the animals evaluated by Arthur
et al. (2001) and Schutt et al. (2009) may account for the differences among these studies, Durunna et al.
(2012) used animals of similar weight and age as in our experiment.
A possible reason for discrepancies between our and other studies may be their durations. Although the
length of this experiment was sufficient to allow animals to settle and adapt to their feeds and
management conditions, Archer and Berghman (2000) and Castilhos et al. (2011) suggested that the
minimum trial duration for reliable estimate of DMI should be 28 days for DMI, and 70 to 84 days for
ADG and FCR. However, given that the primary intent of our study was to determine if the plant-wax
78
marker component had the ability to accurately reflect the observed intakes and diet choices, an increased
duration of the trial was not necessary.
n-alkane content. The concentration of the major n-alkanes in the forages used appears to be different
enough to allow for the estimation of diet choice. With the exception of carnauba wax, all of the feedstuff
used has low odd-chain n-alkane concentration. Furthermore, since the amounts that these feedstuffs were
included in the diet of the animals were comparatively small, their odd-chain n-alkane contribution were
fairly negligible, thereby not affecting the estimates of diet choice.
Estimated diet choice. Of the four scenarios used for collecting and combining n-alkane concentrations
across fecal samples, diet choices were most reliably estimated by averaging those concentrations across
the 5 days of collection. The KSI values for our study were extremely high (> 90%), indicating accurate
estimates, even when fecal n-alkane concentrations were not corrected for fecal losses. This contrasts with
Lin et al. (2012) where KSI values ranged from 67.8 to 92.3, and were dependent on the maker used (n-
alkanes, long chain alcohols, long chain fatty acids or combinations of the three) and the diet. However,
their diet mixtures were more complicated, with up to 8 components.
Correcting for fecal losses of n-alkanes improved our estimates of diet choice, and reduced MPE and
MRPE. These results are in accordance with Brosh et al. (2003) who reported more accurate estimates of
diet composition once correcting for incomplete fecal recovery. However, Ferreira et al. (2009b) reported
that the fecal recoveries for individual alkanes may not only be specific to an animal species (i.e., sheep,
goats, cattle), but also depends on the diet. The decision, and conditions, to correct for fecal losses
therefore must be considered carefully.
Based on the MPE, without the use of correction factors the difference between observed and estimated
red clover proportion in the diet ranged from 53 to 57 g/kg DMI; once correcting for fecal losses that
79
difference reduced to between 23 and 32 g/kg DMI (Table 6). Those results are similar to those of
Charmley and Dove (2007), who reported that MPE from sheep fed different diets ranged from 0.60 to
106 g/kg DMI. In addition, our MRPE halved once correcting for incomplete fecal recovery of n-alkanes.
Without the use of such correction factors the MRPE ranged from 11 to 12.2%, and were reduced to 5.6
to 7.7% in our best scenario. This is in accordance to Elwert et al. (2005), who reported MRPE of 1.4 to
7.7% for sheep depending on their diet.
CONCLUSION
Although clear differences in intake between animals from the two FS were observed at yearling age,
high FCR but similar ADG suggest lower efficiency in large FS cattle. However, a strong tendency from
large FS animals to increase their red clover intake may suggest that they have higher nutritional
requirements that need to be fulfilled by including more of a nutritious feed in their diets.
The n-alkane technique provided a useful and reliable tool for the estimation of diet choice, at least with a
simple diet. With the application of appropriate correction factors to account for incomplete fecal
recovery of n-alkanes, and with pooling of fecal samples collected over several days, this technique offers
clear opportunity to determine diet choice in wider contexts. Although, prediction errors were relatively
minor when estimating diet choice with our simple diets, it would be useful to expand these investigations
to more complex diets, or even grazing situations.
AKNOWLEDGEMENT
Financial support from USDA-ARS for project 1932-21630-003-06 is greatly appreciated. We are
thankful to Donald Wirth (Saddle Butte Ag Inc., Shedd, OR, USA) for supplying the forages (hays), to
Phillip and Edgar McCracken (McHay Company, Elgin, OK, USA) for feed processing (cubing), and
Ellie Stephens (Virginia Tech, Blacksburg, VA, USA) for technical editing.
80
LITERATURE CITED
Archer, J. A., and L Bergh. 2000. Duration of performance tests for growth rate, feed intake, and feed
efficiency in four biological types of beef cattle. Livest. Prod. Sci. 65:47-55.
Arthur, P. F., G. Renand, and D. Krauss. 2001. Genetic and phenotypic relationships among different
measures of growth and feed efficiency in young Charolais bulls. Livest. Prod. Sci. 68:131-139.
Brosh, A., Z. Henkin, S. J. Rothman, Y. Aharoni, A. Orlov, and A. Arieli. 2003. Effects of faecal n-
alkane recovery in estimates of diet composition. J. Agric. Sci. 140:93-100.
Castilhos, A. M., R. H. Branco, A.G. Razook, S. F. Martins, M. E. Zerlotti, L. A. de Figueiredo. 2011.
Test post-weaning duration for performance, feed intake, and feed efficiency in Nellore cattle. R.
Bras. Zootec. 40:301-307.
Charmley, E., and H. Dove. 2007. Using plant wax markers to estimate diet composition and intakes of
mixed forages in sheep by feeding a known amount of alkane-labelled supplement. Aust. J. Agric.
Res. 58:1215-1225.
Corbet, N. J., R. K. Shepherd, H. M. Burrow, J. van der Westhuizen, P. E. Strydom, and D. J. Bosman.
2006. Evaluation of Bonsmara and Belmont Red cattle breeds in South Africa. 1. Productive
performance. Aust. J. Exp. Agric. 46:199-212.
Dove, H., and R. W. Mayes. 2006. Protocol for the analysis of n-alkanes and other plant-wax compounds
and for their use as markers for quantifying the nutrient supply of large mammalian herbivores. Nat.
Prot. 1:1680-1697.
Dove, H., and R. W. Mayes. 2000. Measurement of dietary nutrient intake in free-ranging mammalian
herbivores. Nutr. Res. Rev. 13:107-138.
Dove, H., and R. W. Mayes. 1991. The use of plant wax alkanes as marker substances in studies of the
nutrition of herbivores: a review. Aust. J. Agric. Res. 42:913-952.
Dove, H., and A. D. Moore. 1995. Using a least-squares optimization procedure to estimate botanical
composition based on the alkanes of plant cuticular wax. Aust. J. Agric. Res. 46:1535-1544.
81
Durunna, O. N., M. G. Colazo, D. J. Ambrose, D. McCartney, V. S. Baron, and J. A. Basarab. 2012.
Evidence of residual feed intake reranking in crossbred replacement heifers. J. Anim. Sci. 90:734-
741.
Elwert, C., H. Kluth, and M. Rodehutscord. 2004. Effect of variable intake of alfalfa and wheat on faecal
alkane recoveries and estimates of roughage intake in sheep. J. Agric. Sci. 142:213-223.
Elwert, C., and H. Dove. 2005. Estimation of roughage intake in sheep using a known daily intake of a
labeled supplement. Anim. Sci. 81:47-56.
Elwert, C., H. Dove, and M. Rodehutscord. 2008. Fecal alkane recoveries from multicomponent diets and
effects on estimates of diet composition in sheep. Animal 2:125-134.
Ferreira, L. M. M., S. Carvalho, V. Falco, R. Celaya, U. Garcia, A. S. Santos, M. A. M. Rodrigues, and K.
Osoro. 2009a. Assessment of very long-chain fatty acids as complementary or alternative natural
fecal markers to n-alkanes for estimating diet composition of goats feeding on mixed diets. J. Anim.
Sci. 87:2732-2745.
Ferreira, L. M. M., R. Celaya, U. Garcia, M. A. M. Rodrigues, and K. Osoro. 2009b. Differences between
domestic herbivores species in alkane faecal recoveries and the accuracy of subsequent estimates of
diet composition. Anim. Feed Sci. Technol. 151:128-142.
Franzluebbers, A. J. 2007. Integrated crop-livestock systems in the Southeastern USA. Agron. J. 99:361-
372.
Lin, J. L., X. Y. Zhu, C. Jiang, H. L. Luo, H. Wang, Y. J. Zhang, and F. Z. Hong. 2012. The potential use
of n-alkanes, long-chain alcohols and long-chain fatty acids as diet composition markers: indoor
validation with sheep and herbage species from the rangeland of Inner Mongolia of China. Animal
6:449-458.
Newman, J. A., W. A. Thompson, P. D. Penning, and R. W. Mayes. 1995. Least-squares estimation of
diet composition from n-alkanes in herbage and feces using matrix mathematics. Aust. J. Agric.
Res. 46:793-805.
82
Olivan M., L. M. M. Ferreira, R. Celaya, and K. Osoro. 2007. Accuracy of the n-alkane technique for
intake estimates in beef cattle using different sampling procedures and feeding levels. Livest. Sci.
106:28-40.
Oosting, J. 1956. The study of plant communities: an introduction to plant ecology. 2nd ed. W. H.
Freeman and Company. San Francisco, CA.
Owens, F. N., and C. F. Hanson. 1992. External and internal markers for appraising site and extent of
digestion in ruminants. J. Dairy Sci. 75:2605-2617.
Prigge, E. C., G. A. Varga, J. L. Vicini, and R. L. Reid. 1981. Comparison of Ytterbium chloride and
chromium sesquioxide as fecal indicators. J. Anim. Sci. 53:1629-1633.
Rutter, S. M. 2010. Review: Grazing preferences in sheep and cattle: implications for production, the
environment and welfare. Can. J. Anim. Sci. 90:-285-293.
Schutt, K. M., P. F. Arthur, and H. M. Burrow. 2009. Brahman and Brahman crossbred cattle grown on
pasture and in feedlots in subtropical and temperate Australia. 3. Feed efficiency and feeding
behavior of feedlot-finished animals. Anim. Prod. Sci. 49:452-460.
Taylor, G. J., F. J. C. Swanepoel, E. C. Webb, and A. Stroebel. 2008. Effect of heifer FS on their
subsequent reproductive performance and preweaning performance on their calves. Aust. J. Exp.
Agric. 48:945-949.
Tracy, B. F., and M. A. Sanderson. 2000. Patterns of plant species richness in pasture lands of the
northeast United States. Plant Ecol. 149:169-180.
Van Dorland, H. A., H. R. Wettstein, G. Aeschlimann, H. Leuenberger, and M. Kreuzer. 2007. Preference
of dairy cows for ryegrass, white clover and red clover, and its effect on nutrient supply and milk
quality. Arch. Anim. Nutr. 61:371-389.
Vargas, C. A., T. A. Olson, C. C. Chase, Jr, A. C. Hammond, and M. A. Elzo. 1999. Influence of frame
size and body condition score on performance of Brahman cattle. J. Anim. Sci. 77:3140-3149.
83
Vargas Junior, F. M., F. S. Wechsler, P. Rossi, M. V. Morais, P. Schmidt. 2011. Voluntary intake of dry
matter and performance of Nellore and their Nellore and crossbreed Simmental x Nellore calves. R.
Bras. Zootec. 40:2574-2581.
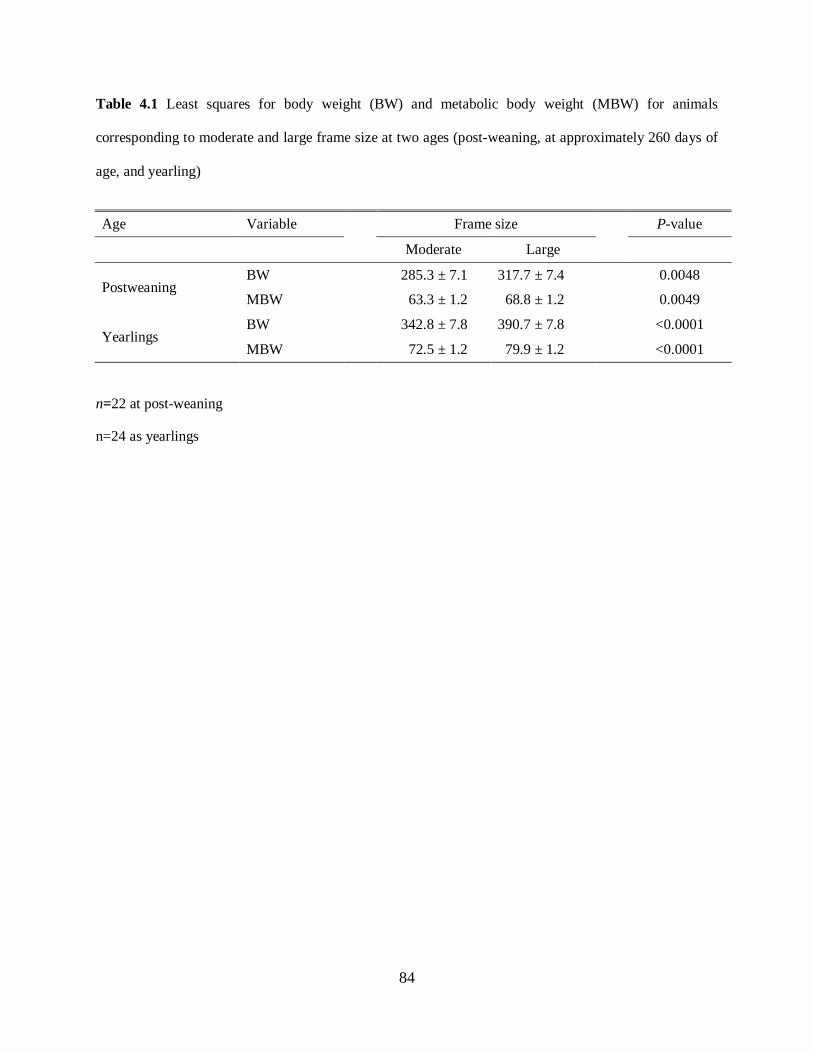
84
Table 4.1 Least squares for body weight (BW) and metabolic body weight (MBW) for animals
corresponding to moderate and large frame size at two ages (post-weaning, at approximately 260 days of
age, and yearling)
Age Variable Frame size P-value
Moderate Large
Postweaning BW 285.3 ± 7.1 317.7 ± 7.4 0.0048
MBW 63.3 ± 1.2 68.8 ± 1.2 0.0049
Yearlings BW 342.8 ± 7.8 390.7 ± 7.8 <0.0001
MBW 72.5 ± 1.2 79.9 ± 1.2 <0.0001
n=22 at post-weaning
n=24 as yearlings
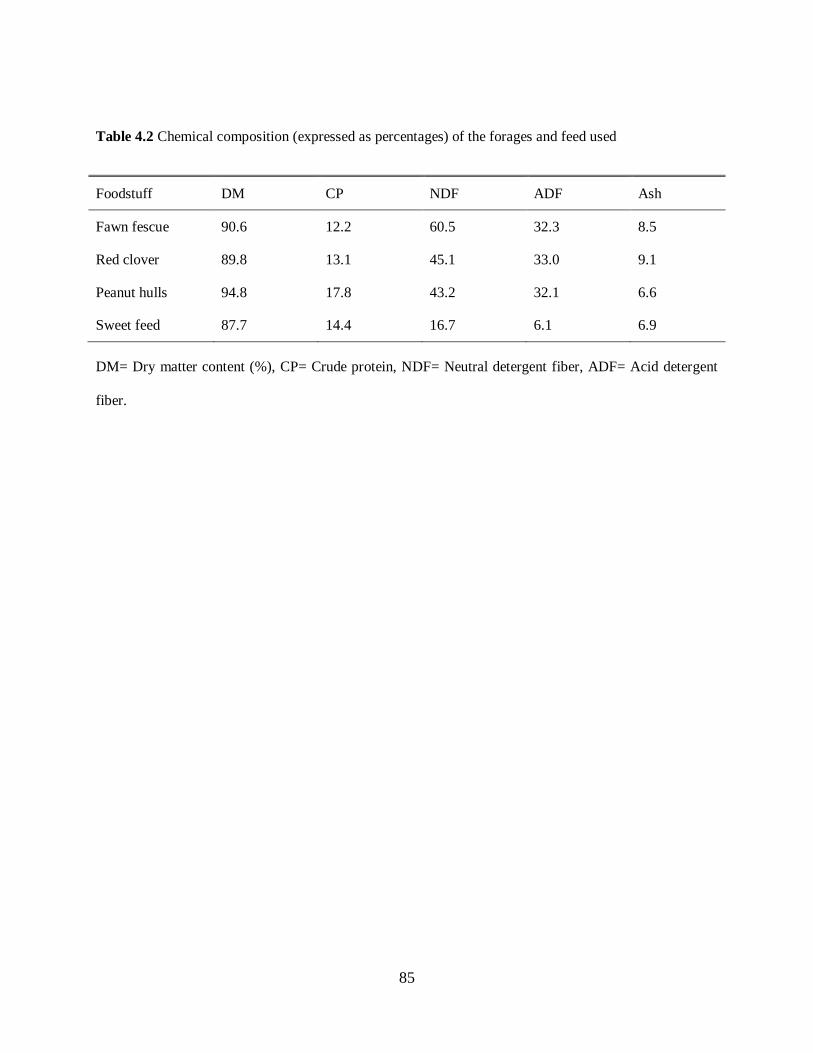
85
Table 4.2 Chemical composition (expressed as percentages) of the forages and feed used
Foodstuff DM CP NDF ADF Ash
Fawn fescue 90.6 12.2 60.5 32.3 8.5
Red clover 89.8 13.1 45.1 33.0 9.1
Peanut hulls 94.8 17.8 43.2 32.1 6.6
Sweet feed 87.7 14.4 16.7 6.1 6.9
DM= Dry matter content (%), CP= Crude protein, NDF= Neutral detergent fiber, ADF= Acid detergent
fiber.
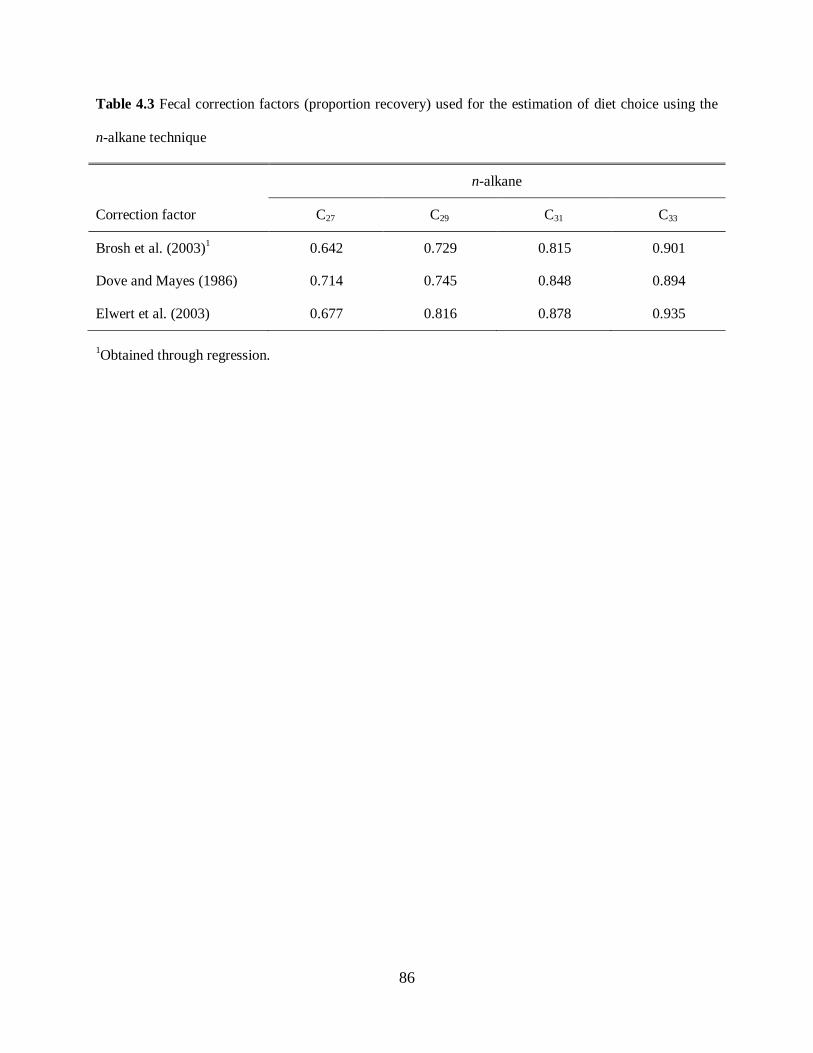
86
Table 4.3 Fecal correction factors (proportion recovery) used for the estimation of diet choice using the
n-alkane technique
n-alkane
Correction factor C27 C29 C31 C33
Brosh et al. (2003)1 0.642 0.729 0.815 0.901
Dove and Mayes (1986) 0.714 0.745 0.848 0.894
Elwert et al. (2003) 0.677 0.816 0.878 0.935
1Obtained through regression.
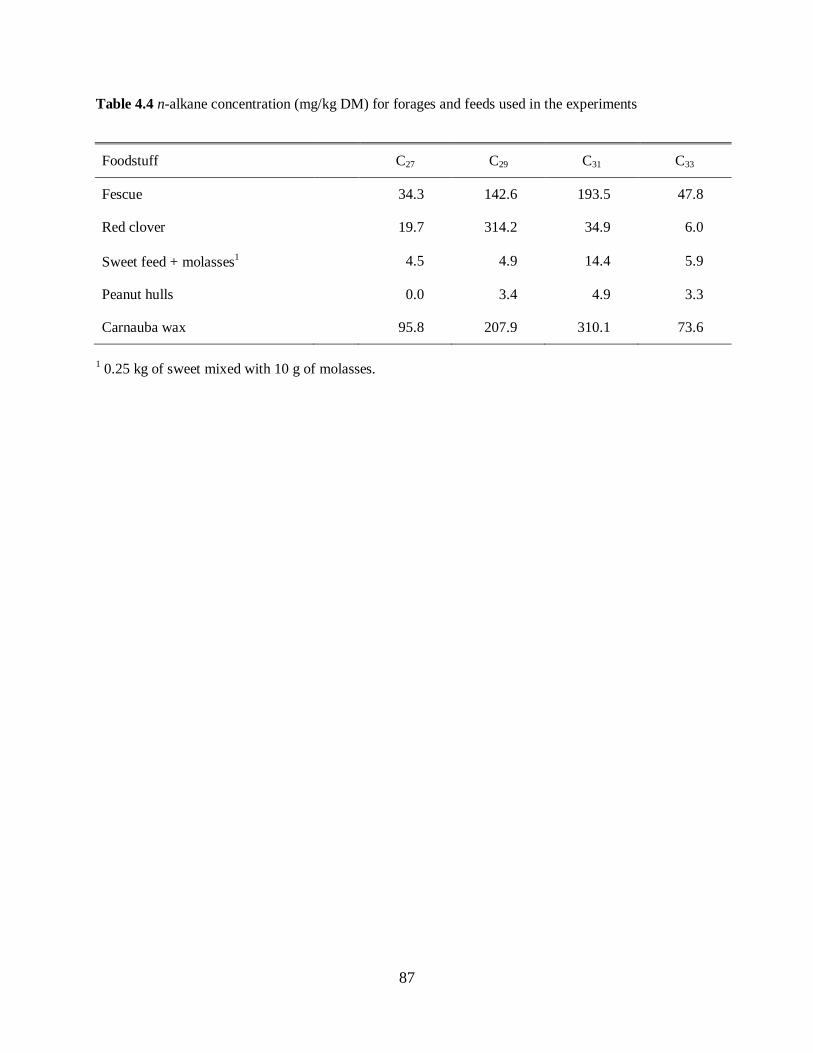
87
Table 4.4 n-alkane concentration (mg/kg DM) for forages and feeds used in the experiments
Foodstuff C27 C29 C31 C33
Fescue 34.3 142.6 193.5 47.8
Red clover 19.7 314.2 34.9 6.0
Sweet feed + molasses1 4.5 4.9 14.4 5.9
Peanut hulls 0.0 3.4 4.9 3.3
Carnauba wax 95.8 207.9 310.1 73.6
1 0.25 kg of sweet mixed with 10 g of molasses.
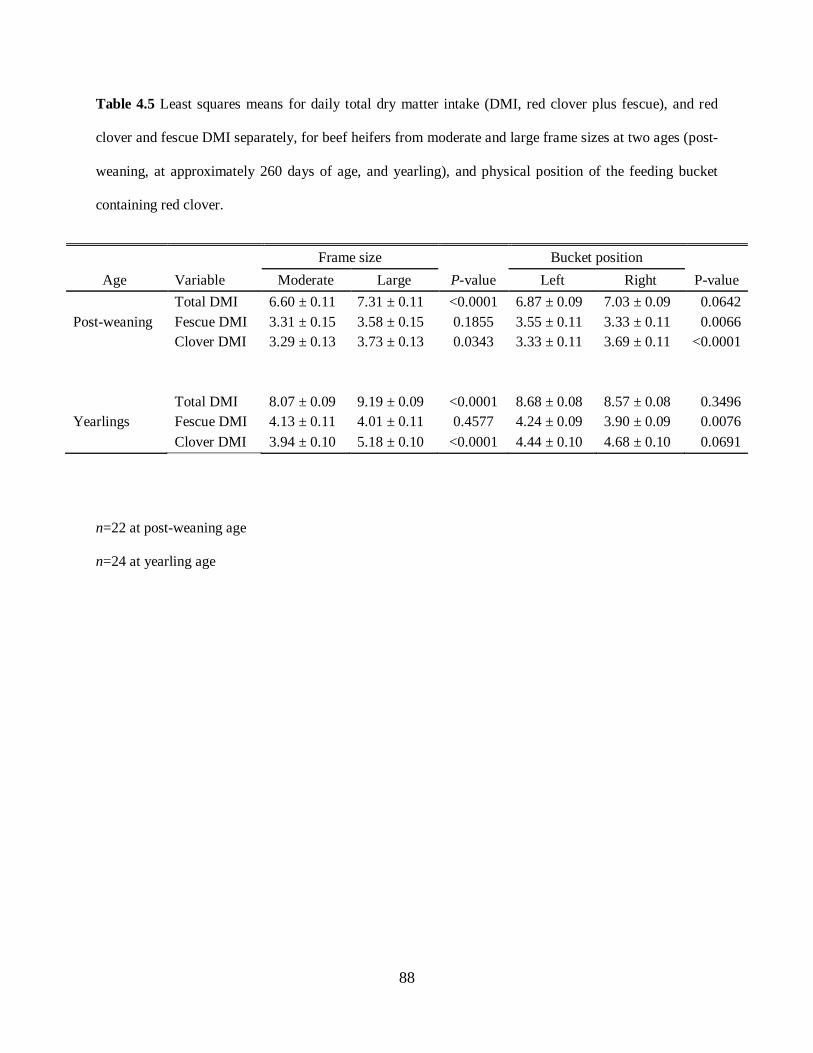
88
Table 4.5 Least squares means for daily total dry matter intake (DMI, red clover plus fescue), and red
clover and fescue DMI separately, for beef heifers from moderate and large frame sizes at two ages (post-
weaning, at approximately 260 days of age, and yearling), and physical position of the feeding bucket
containing red clover.
Frame size Bucket position Age Variable Moderate Large P-value Left Right P-value
Total DMI 6.60 ± 0.11 7.31 ± 0.11 <0.0001 6.87 ± 0.09 7.03 ± 0.09 0.0642 Post-weaning Fescue DMI 3.31 ± 0.15 3.58 ± 0.15 0.1855 3.55 ± 0.11 3.33 ± 0.11 0.0066
Clover DMI 3.29 ± 0.13 3.73 ± 0.13 0.0343 3.33 ± 0.11 3.69 ± 0.11 <0.0001
Total DMI 8.07 ± 0.09 9.19 ± 0.09 <0.0001 8.68 ± 0.08 8.57 ± 0.08 0.3496 Yearlings Fescue DMI 4.13 ± 0.11 4.01 ± 0.11 0.4577 4.24 ± 0.09 3.90 ± 0.09 0.0076 Clover DMI 3.94 ± 0.10 5.18 ± 0.10 <0.0001 4.44 ± 0.10 4.68 ± 0.10 0.0691
n=22 at post-weaning age
n=24 at yearling age
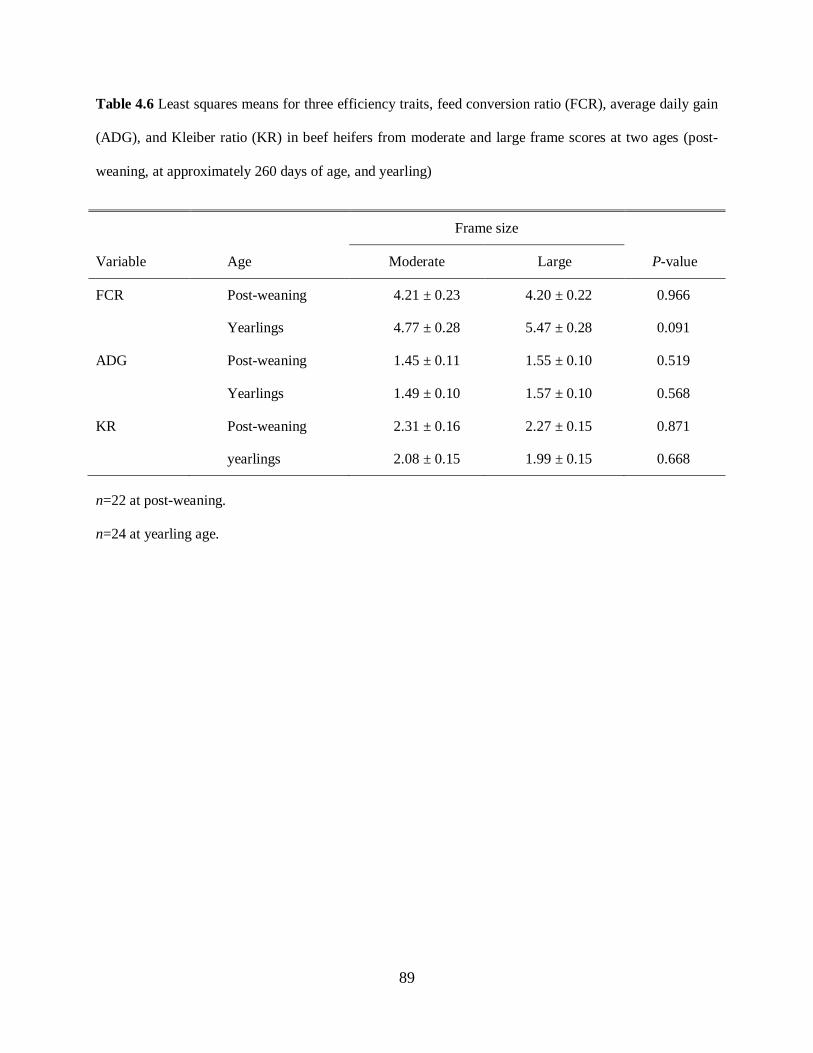
89
Table 4.6 Least squares means for three efficiency traits, feed conversion ratio (FCR), average daily gain
(ADG), and Kleiber ratio (KR) in beef heifers from moderate and large frame scores at two ages (post-
weaning, at approximately 260 days of age, and yearling)
Frame size
Variable Age Moderate Large P-value
FCR Post-weaning 4.21 ± 0.23 4.20 ± 0.22 0.966
Yearlings 4.77 ± 0.28 5.47 ± 0.28 0.091
ADG Post-weaning 1.45 ± 0.11 1.55 ± 0.10 0.519
Yearlings 1.49 ± 0.10 1.57 ± 0.10 0.568
KR Post-weaning 2.31 ± 0.16 2.27 ± 0.15 0.871
yearlings 2.08 ± 0.15 1.99 ± 0.15 0.668
n=22 at post-weaning.
n=24 at yearling age.
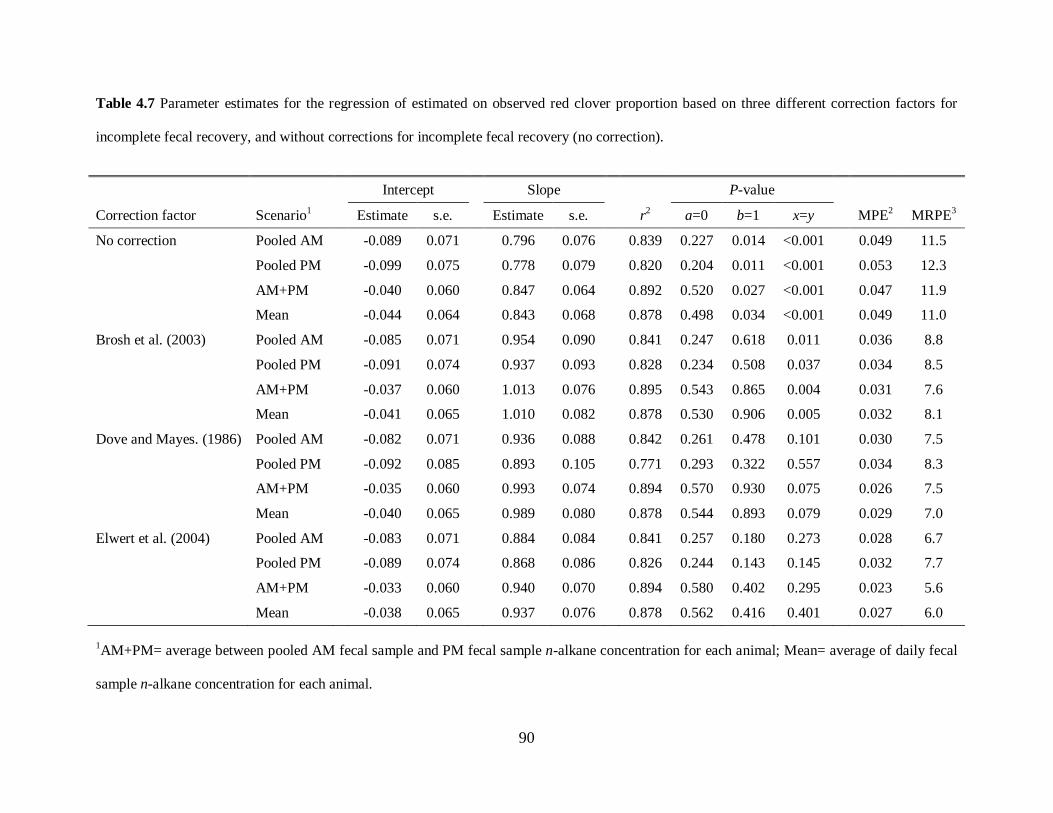
90
Table 4.7 Parameter estimates for the regression of estimated on observed red clover proportion based on three different correction factors for
incomplete fecal recovery, and without corrections for incomplete fecal recovery (no correction).
Intercept Slope P-value
Correction factor Scenario1 Estimate s.e. Estimate s.e. r2 a=0 b=1 x=y
MPE2 MRPE3
No correction Pooled AM
-0.089 0.071 0.796 0.076 0.839 0.227 0.014 <0.001
0.049 11.5
Pooled PM
-0.099 0.075 0.778 0.079 0.820 0.204 0.011 <0.001
0.053 12.3
AM+PM
-0.040 0.060 0.847 0.064 0.892 0.520 0.027 <0.001
0.047 11.9
Mean
-0.044 0.064 0.843 0.068 0.878 0.498 0.034 <0.001
0.049 11.0
Brosh et al. (2003) Pooled AM
-0.085 0.071 0.954 0.090 0.841 0.247 0.618 0.011
0.036 8.8
Pooled PM
-0.091 0.074 0.937 0.093 0.828 0.234 0.508 0.037
0.034 8.5
AM+PM
-0.037 0.060 1.013 0.076 0.895 0.543 0.865 0.004
0.031 7.6
Mean
-0.041 0.065 1.010 0.082 0.878 0.530 0.906 0.005
0.032 8.1
Dove and Mayes. (1986) Pooled AM
-0.082 0.071 0.936 0.088 0.842 0.261 0.478 0.101
0.030 7.5
Pooled PM
-0.092 0.085 0.893 0.105 0.771 0.293 0.322 0.557
0.034 8.3
AM+PM
-0.035 0.060 0.993 0.074 0.894 0.570 0.930 0.075
0.026 7.5
Mean
-0.040 0.065 0.989 0.080 0.878 0.544 0.893 0.079
0.029 7.0
Elwert et al. (2004) Pooled AM
-0.083 0.071 0.884 0.084 0.841 0.257 0.180 0.273
0.028 6.7
Pooled PM
-0.089 0.074 0.868 0.086 0.826 0.244 0.143 0.145
0.032 7.7
AM+PM
-0.033 0.060 0.940 0.070 0.894 0.580 0.402 0.295
0.023 5.6
Mean
-0.038 0.065 0.937 0.076 0.878 0.562 0.416 0.401
0.027 6.0
1AM+PM= average between pooled AM fecal sample and PM fecal sample n-alkane concentration for each animal; Mean= average of daily fecal
sample n-alkane concentration for each animal.
91
2MPE= Mean prediction error (kg/kg).
3MRPE= Mean relative prediction error (%).
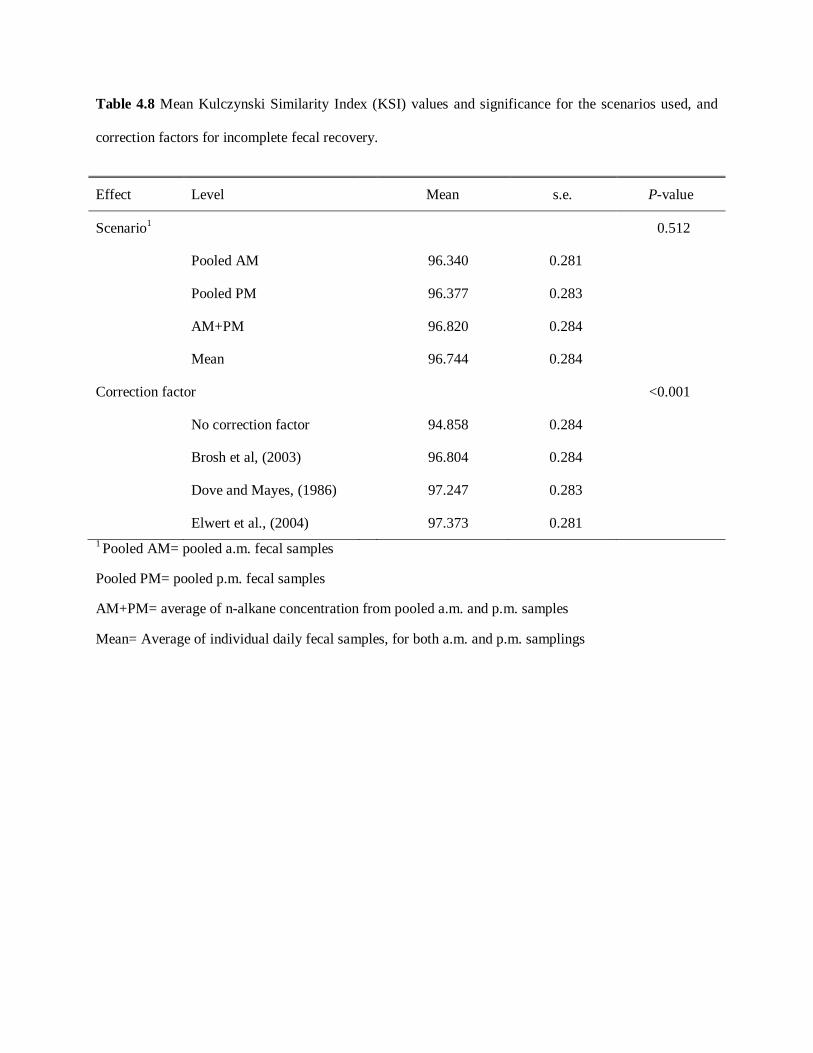
Table 4.8 Mean Kulczynski Similarity Index (KSI) values and significance for the scenarios used, and
correction factors for incomplete fecal recovery.
Effect Level
Mean s.e. P-value
Scenario1
0.512
Pooled AM 96.340 0.281
Pooled PM 96.377 0.283
AM+PM 96.820 0.284
Mean 96.744 0.284
Correction factor
<0.001
No correction factor 94.858 0.284
Brosh et al, (2003) 96.804 0.284
Dove and Mayes, (1986) 97.247 0.283
Elwert et al., (2004) 97.373 0.281 1 Pooled AM= pooled a.m. fecal samples
Pooled PM= pooled p.m. fecal samples
AM+PM= average of n-alkane concentration from pooled a.m. and p.m. samples
Mean= Average of individual daily fecal samples, for both a.m. and p.m. samplings
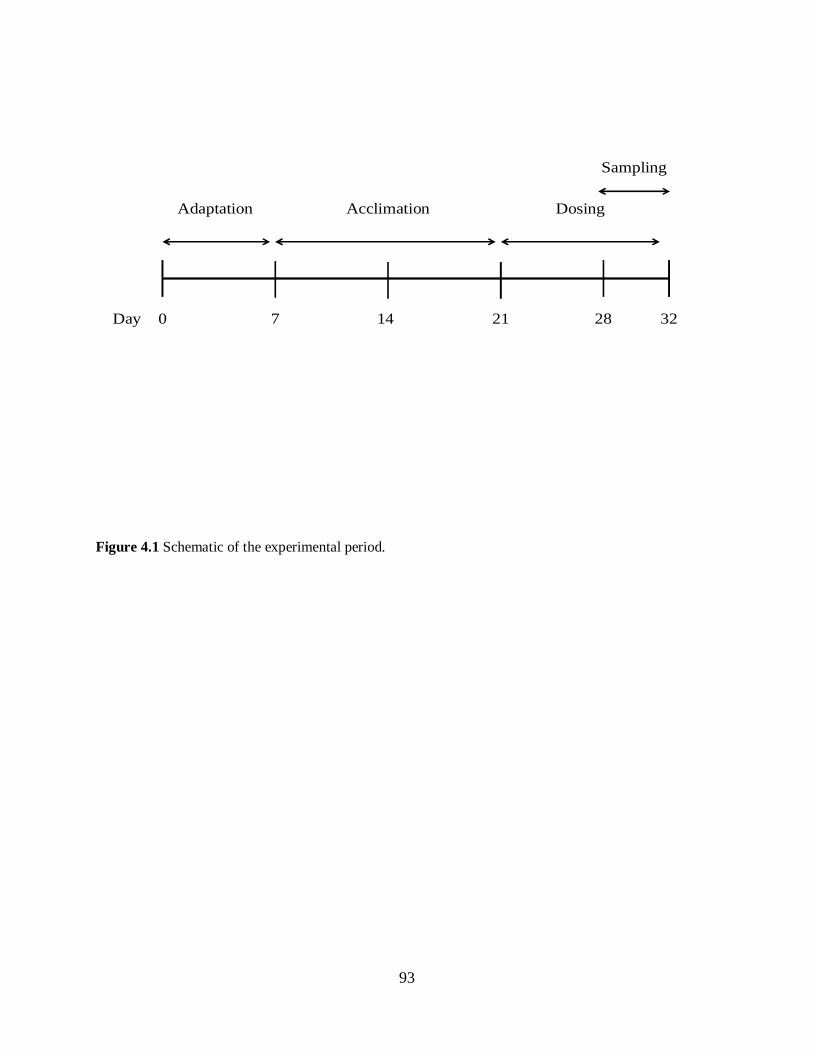
93
Day 0 7 14 21 28 32
Adaptation Acclimation Dosing
Sampling
Figure 4.1 Schematic of the experimental period.
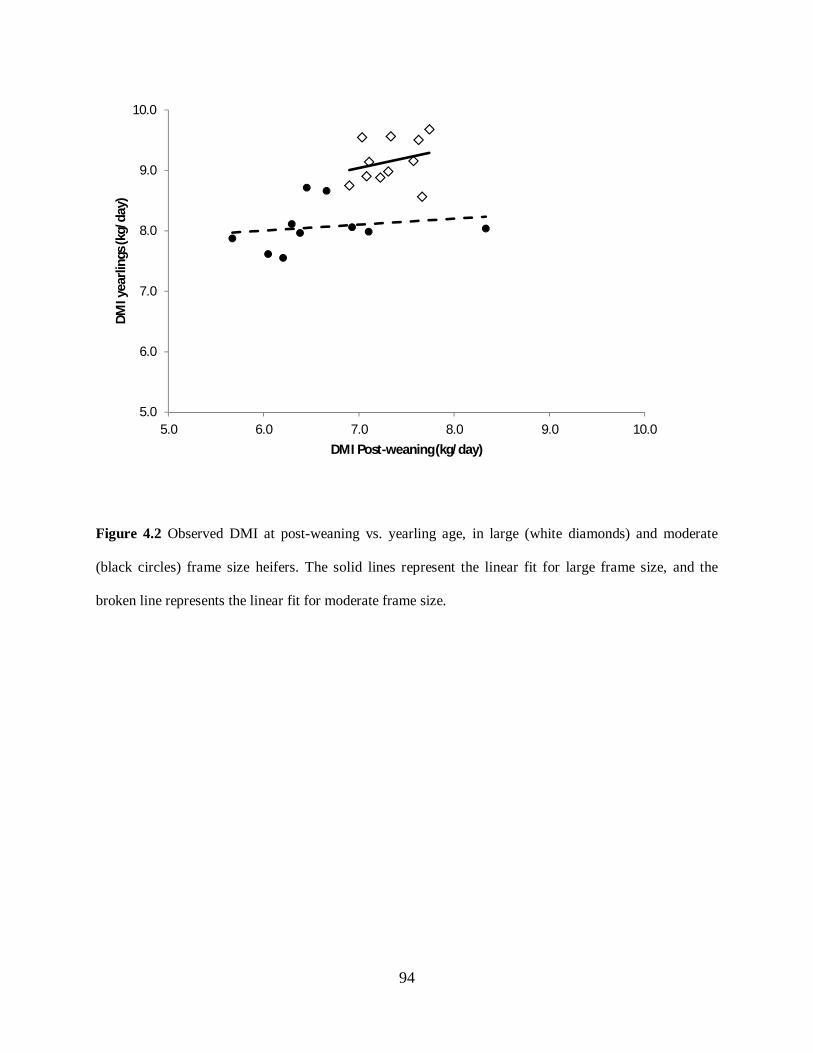
94
Figure 4.2 Observed DMI at post-weaning vs. yearling age, in large (white diamonds) and moderate
(black circles) frame size heifers. The solid lines represent the linear fit for large frame size, and the
broken line represents the linear fit for moderate frame size.
5.0
6.0
7.0
8.0
9.0
10.0
5.0 6.0 7.0 8.0 9.0 10.0
DMI y
earli
ngs (
kg/d
ay)
DMI Post-weaning (kg/day)
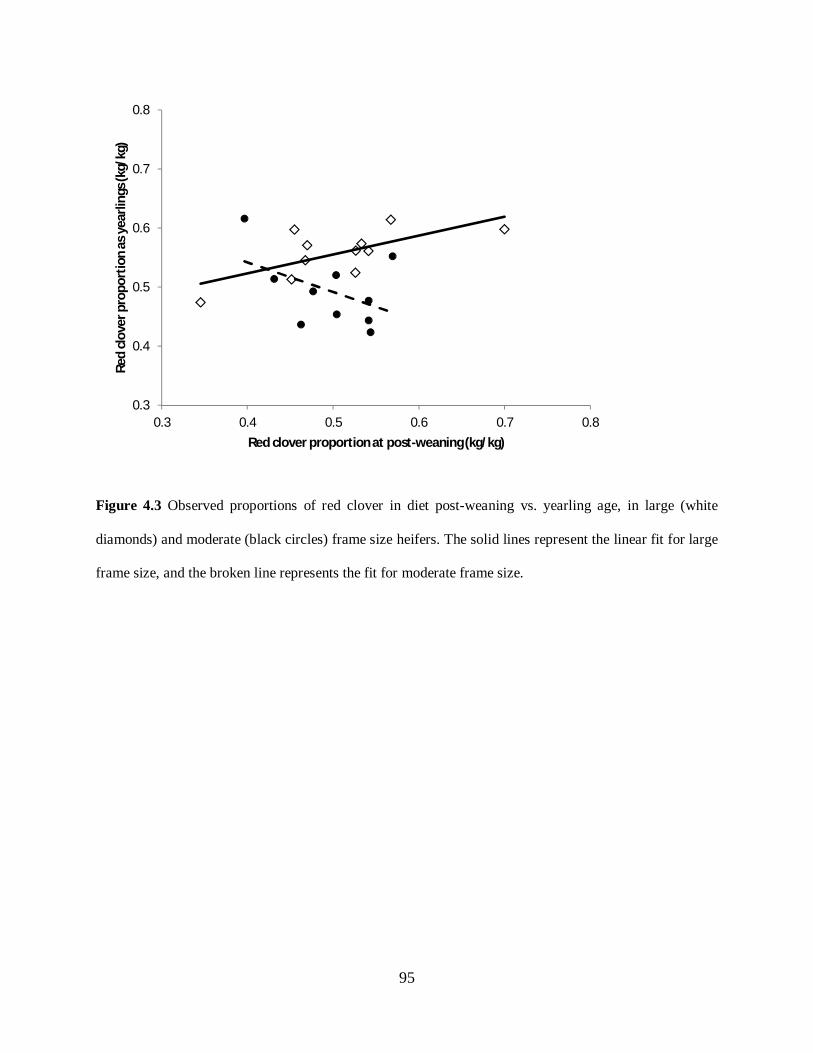
95
Figure 4.3 Observed proportions of red clover in diet post-weaning vs. yearling age, in large (white
diamonds) and moderate (black circles) frame size heifers. The solid lines represent the linear fit for large
frame size, and the broken line represents the fit for moderate frame size.
0.3
0.4
0.5
0.6
0.7
0.8
0.3 0.4 0.5 0.6 0.7 0.8
Red
clov
er p
ropo
rtio
n as
yea
rling
s (kg
/kg)
Red clover proportion at post-weaning (kg/kg)
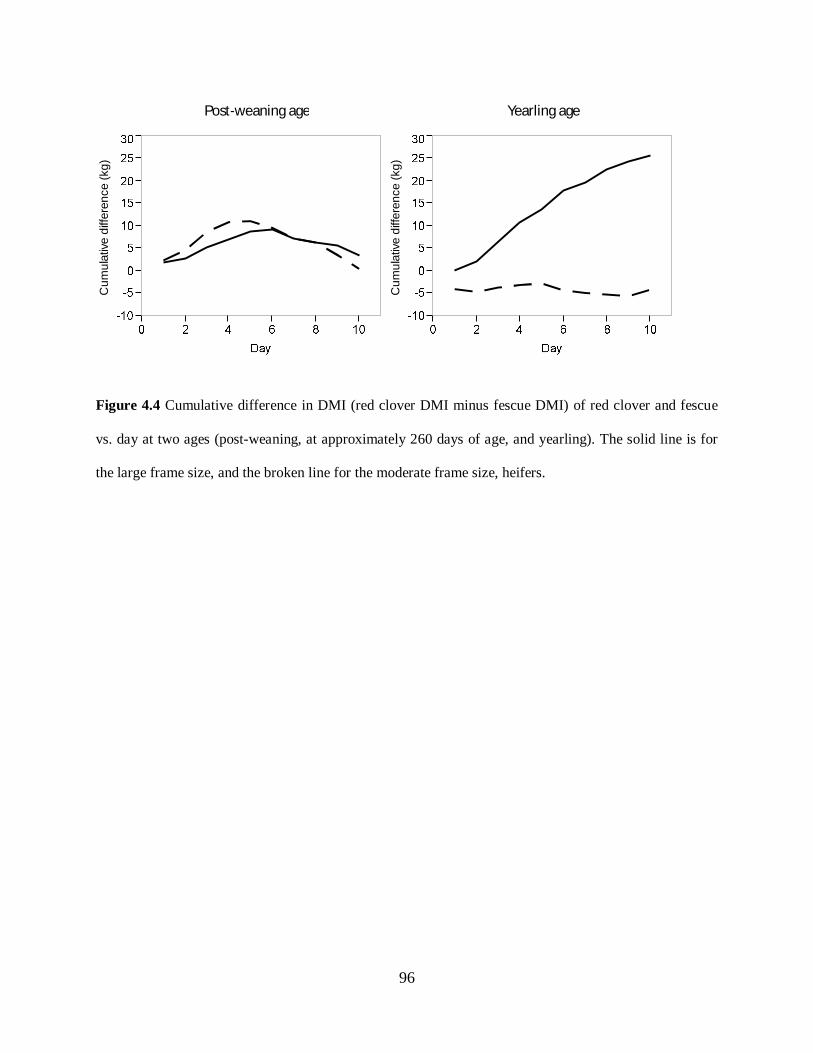
96
Figure 4.4 Cumulative difference in DMI (red clover DMI minus fescue DMI) of red clover and fescue
vs. day at two ages (post-weaning, at approximately 260 days of age, and yearling). The solid line is for
the large frame size, and the broken line for the moderate frame size, heifers.
Cum
ulat
ive d
iffer
ence
(kg)
Cum
ulat
ive d
iffer
ence
(kg)
Post-weaning age Yearling age
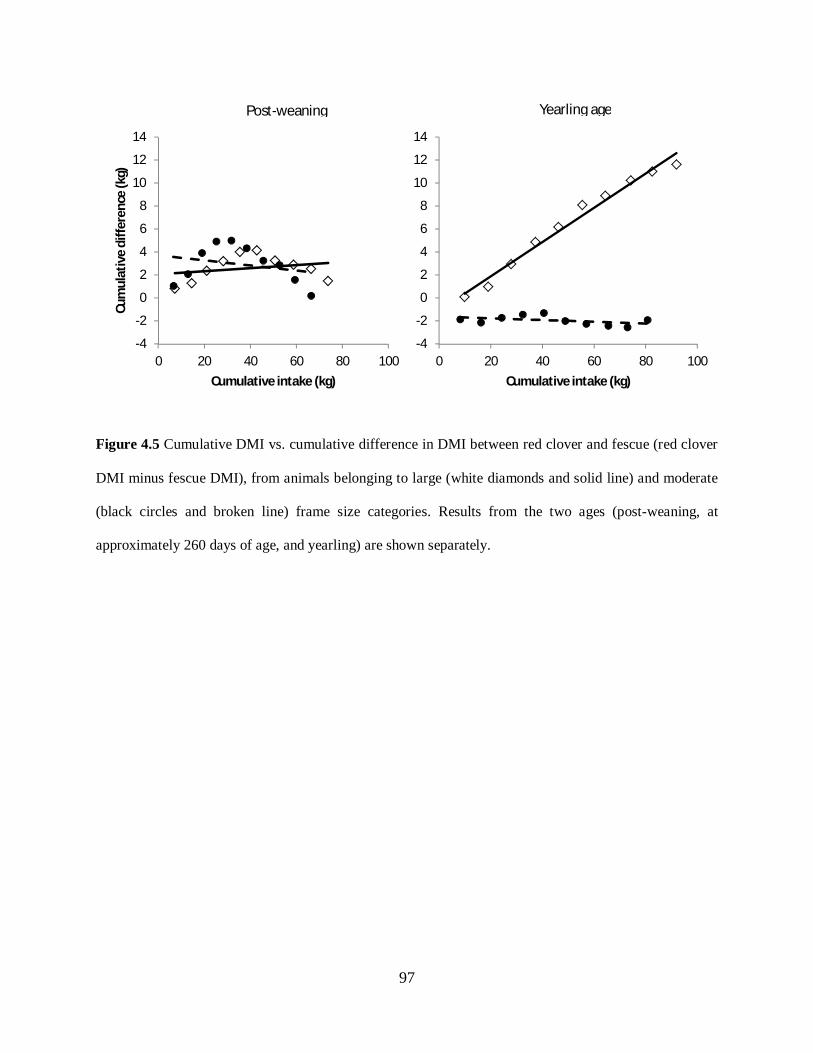
97
Figure 4.5 Cumulative DMI vs. cumulative difference in DMI between red clover and fescue (red clover
DMI minus fescue DMI), from animals belonging to large (white diamonds and solid line) and moderate
(black circles and broken line) frame size categories. Results from the two ages (post-weaning, at
approximately 260 days of age, and yearling) are shown separately.
-4
-2
0
2
4
6
8
10
12
14
0 20 40 60 80 100
Cum
ulat
ive
diffe
renc
e (k
g)
Cumulative intake (kg)
-4
-2
0
2
4
6
8
10
12
14
0 20 40 60 80 100Cumulative intake (kg)
Post-weaning Yearling age
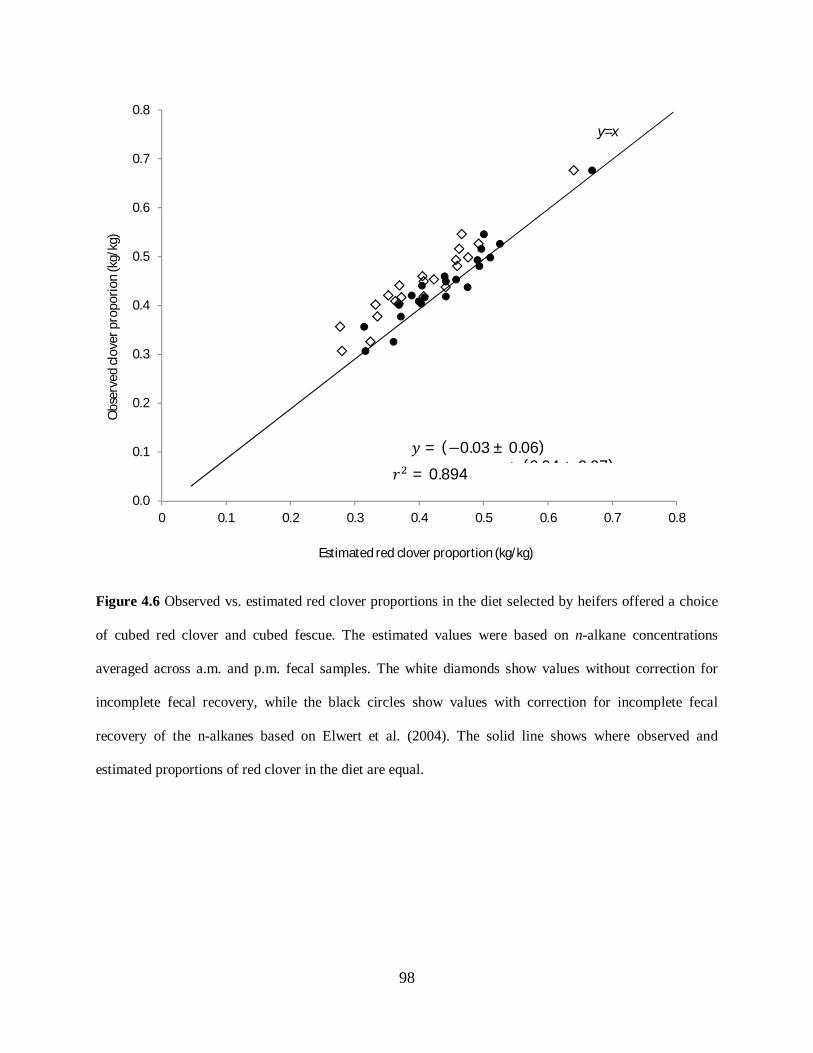
98
Figure 4.6 Observed vs. estimated red clover proportions in the diet selected by heifers offered a choice
of cubed red clover and cubed fescue. The estimated values were based on n-alkane concentrations
averaged across a.m. and p.m. fecal samples. The white diamonds show values without correction for
incomplete fecal recovery, while the black circles show values with correction for incomplete fecal
recovery of the n-alkanes based on Elwert et al. (2004). The solid line shows where observed and
estimated proportions of red clover in the diet are equal.
0.0
0.1
0.2
0.3
0.4
0.5
0.6
0.7
0.8
0 0.1 0.2 0.3 0.4 0.5 0.6 0.7 0.8
Obs
erve
d cl
over
pro
porio
n (k
g/kg
)
Estimated red clover proportion (kg/kg)
y=x
푦 = (−0.03 ± 0.06)+ (0.94 ± 0.07)푥 푟 = 0.894
99
CHAPTER 5
CONCLUSIONS
Summary
The results from the present work confirm that the plant wax marker technique is useful in determining
botanical composition in, at least, simple test diets. The highly consistent estimates obtained by, even, an
operator with limited expertise in preparing samples and in conducting gas chromatography suggest that
the technique is reliable, however due to our limited sample sizes more work is needed to confirm this
holds true. Although variability in measured concentrations of the markers (both n-alkanes and LCOH)
between operators and across duplicate extractions did not appreciably affect the reliability of the
estimates of botanical composition, it may play a role when dealing with more complicated plant
mixtures. Since more complicated swards (higher number of species) will require the addition of other
types of markers, such as long chain fatty acids or include shorter-chained compounds, such as C25, C22-
OH, or C24-OH, sources of error may be introduced. Thus, further work is needed to determine if the
technique remains robust with such modifications.
Similarly, estimates of diet composition from fecal samples using n-alkanes alone appear to be reliable.
Although the KSI values seemed to indicate high reliability of diet choice estimates even when no
correction factors were used, accounting for incomplete fecal recovery of these markers improves the
accuracy of these estimates. In the present study, using corrections factors reported in other studies
increased the accuracy of the estimates; however, improved accuracy may be obtained if correction
factors from our own experiments were used, as these factors seem to be diet and species dependent. In
addition, given that in the present study the reliability of the technique was assessed by comparing
estimates of diet choices (with or without correction for incomplete n-alkane recovery) to known diet
choices, in situations in which the actual diet choice is not known, such as in grazing conditions, such
100
comparisons of reliability are not possible. Therefore, the use of correction factors needs to be carefully
considered.
Differences in measures of efficiency between moderate and large frame size cattle were not clear;
however, daily dry matter intake, as well as red clover intake, was substantially higher for large frame
size animals. The inconsistent patterns of red clover intake for animals from both frame size categories at
post-weaning age suggests that at that age, these animals had similar nutritional requirements. In addition,
the change in the physical position of the feeding buckets may have contributed to these inconsistent
patterns. However, since in the second study the feeding buckets remained in their positions for a longer
time, a definite conclusion is not possible at this time. At yearling age, there was a continuous increase in
the red clover content of the diets of cattle of large frame size. This indicates that as animals of larger
mature size continue to grow their higher nutritional demands need to be fulfilled by increased
consumption of a more nutritious food, apparently even when its nutritive quality is only slightly higher.
Further work is needed to achieve more conclusive results on this matter.
Although the laboratory techniques used were fairly accurate in measuring the concentration of odd-chain
n-alkanes in forages and feces, issues arose in the extraction and measure of the dosed even-chained n-
alkanes used as external markers. Therefore, I was unable to include estimates of feed intake in the
present work. The problem appears to be unanticipated contamination of some of the materials and
equipment used for extracting the n-alkanes despite careful adherence to established protocols. The dosed
n-alkanes were longer-chained than other compounds analyzed and have higher boiling points. It is
suspected that their residues have proven more difficult to remove from the laboratory equipment used.
Addressing this issue is clearly of high priority, since reliably quantifying these compounds is essential
for estimating feed intake with the n-alkane technique. Also, since evaluating feed efficiency in grazing
conditions may well entail the use of fecal markers to estimate feed intake, resolving these laboratory
issues is prerequisite to applying this technique in cattle grazing more complex swards.
101
REFERENCES
Ali, H. A. M., R. W. Mayes, B. L. Hector, and E. R. Ørskov. 2005a. Assessment of n-alkanes,
long-chain fatty alcohols and long-chain fatty acids as diet composition markers: The
concentrations of these compounds in rangeland species from Sudan. J. Agric. Sci.
121:257-271
Ali, H. A. M., R. W. Mayes, B. L. Hector, A. K. Verma and E. R. Ørskov. 2005b. The possible
use of n-alkanes, long-chain fatty alcohols and long-chain fatty acids as markers in
studies of the botanical composition of the diet of free-ranging herbivores. J. Agric.
Sci.143:85-95.
Allison, C. D. 1985. Factors affecting forage intake by range ruminants: a review. J. Range.
Manag. 38:305-311.
Archer, J.A., P. F. Arthur, D. J. Johnston, R. M. Herd. 1999. Potential for selection to improve
efficiency of feed use in beef cattle: a review. Aust. J. Agric. Res. 50:147-151
Arelovich, H. M., C. S. Abney, J. A. Vizcarra, and M. L. Galyean. 2008. Effects of dietary
neutral detergent fiber on intakes of dry matter and net energy by dairy and beef cattle:
analysis of published data. Prof. Anim. Sci. 24:375:383.
Arthur, P. F., J. A. Archer, and R. M. Herd. 2004. Feed intake and efficiency in beef cattle:
overview of recent Australian research and challenges for the future. Aust. J Exp. Agric.
44:361-369.
Arthur, P. F., J. A. Archer, D. J. Johnston, R. M. Herd, E. C. Richardson and P. F. Parnell. 2001.
Genetic and phenotypic variance and covariance components for feed intake, feed
efficiency, and other postweaning traits in Angus cattle. J Anim. Sci. 79:2805-2811.
Beauchemin, K. A. 1996. Using ADF and NDF in dairy cattle diet formulation – a western
Canadian perspective. Anim. Feed Sci. Technol. 58:101-111
102
Blaxter, K. L., and F. H. Wainman. 1966. The fasting metabolism of cattle. Br. J. Nutr. 20:103-
111.
Bond, J., D. O. Everson, J. Gutierrez and E. J. Warwick. Feed Intake and Gains of Beef Cattle as
Affected by Source and Level of Nitrogen in High-Energy Rations. J. Anim. Sci. 21:728-
733.
Bovolenta, S., E. Piasentier, and F. Malossini. 1991. N-alkanes as markers in feeding trials.
Pages 29-38 in Proc. EEC Workshop on Grazing Behaviour of Goats and Sheep, Cahiers
Options Méditerranéennes, Bella (PZ), Italy, Vol. 5, CIHEAM, Zaragoza
Brody, S., and R. C. Procter. 1932. Relation between basal metabolism and mature body weight
in different species of mammals and birds. Res. Bull. No. 166. University of Missouri.
Columbia, Missouri.
Bugalho, M. N., H. Dove, W. Kelman, J. T. Wood, and R. W. Mayes. 2004. Plant wax alkanes
and alcohols as herbivore diet composition markers. J. Range. Manag. 57:259-268.
Castilhos, A. M., R. H. Branco, A. G. Razook, S. F. M. Bonilha, M. E. Z. Mercadante, and L. A.
de Figueiredo. 2011. Test post-weaning duration for performance, feed intake and feed
efficiency in Nellore cattle. R. Bras. Zootec. 40:301-307.
Cortes, C., J. C. Damasceno, N. M. Fukumoto, E. S. Sakaguti, G. T. dos Santos, and C. R.
Alcalde. 2005. Discriminatory potential of the n-alkanes in tropical forages by
multivariate analysis. R. Bras. Zootec. 34:1079-1087.
Crews, D. H. 2005. Genetics of feed utilization and national cattle evaluation: a review. Genet.
Mol. Res. 4:152-165.
103
Cross, D. L., J. A. Boling, and N. W. Bradley. 1973. Chromic oxide and crude protein excretion
in the bovine as influenced by water restriction. J. Anim. Sci. 36:982-985.
Decruyenaere, V., A. Buldgen, and D. Stilmant. 2009. Factors affecting intake by grazing
ruminants and related quantification methods: a review. Biotechnol. Agron. Soc. Environ.
13:559-573.
Delagarde, R., E. Pérez-Ramírez, and J.L. Peyraud. 2010. Ytterbium oxide has the same
accuracy as chromic oxide for estimating variations of faecal dry matter output in dairy
cows fed a total mixed ration at two feeding levels. Anim. Feed Sci. Technol. 161:121-
131.
Dove, H., and E. Charmley. 2008. Using the n-alkanes and long-chain alcohols of plant cuticular
wax to estimate diet composition and the intakes of mixed forages in sheep consuming a
known amount of alkane-labelled supplement. Animal. 2:1474-1485.
Dove, H., and Moore. 1995. Using a least squares optimization procedure to estimate botanical
composition based on the alkanes of plant cuticular wax. Aust. J. Agric. 46:1535-1544.
Dove, H., and R. W. Mayes. 1991. The use of plant wax alkanes as marker substances in studies
of the nutrition of herbivores: a review. Aust. J. Agric. Res. 42:913-952.
Dove, H., and R. W. Mayes. 2005. Using n-alkanes and other plant wax components to estimate
intake, digestibility and diet composition of grazing/browsing sheep and goats. Small
Rum. Res. 59:123-139.
Dove, H., and R. W. Mayes. 2006. Protocol for the analysis of n-alkanes and other plant-wax
compounds and for their use as markers for quantifying the nutrient supply of large
mammalian herbivores. Nat. Prot. 4:1680-1697.
104
Dulphy, J. P., and C. Demarquilly. 1994. The regulation and prediction of feed intake in
ruminants in relation to feed characteristics. Livest. Prod. Sci. 39:1-12.
Elwert, C., H. Kluth, and M. Rodehutscord. 2004. Effect of variable intake of alfalfa and wheat
on faecal alkane recoveries and estimates of roughage intake in sheep. 142: 213-223.
Emmans, G. C, and I. Kyriazakis. 1995. The idea of optimization in animals: uses and dangers.
Livest. Prod. Sci. 44:189-197.
Ferreira, L. M. M., M. Olivan, M. A. M. Rodrigues, K. Osoro, H. Dove, and A. Dias-da-Silva.
2004. Estimation of feed intake by cattle using controlled-release capsules containing n-
alkanes or chromium sesquioxide. J. Agric. Sci. 142:225-234.
Forbes, J. M. 2007. Voluntary food intake and diet selection in farm animals. CABI book.
Oxfordshire, UK. 462pp.
Fraser, M.D., V. J. Theobald, and J. M. Moorby. 2006. Determining diet composition on
complex swards using n-alkanes and long-chain fatty alcohols. Ecol. Appl. 16:1901-
1910.
Fries, G. F., G. S. Marrow, and P. A. Snow. 1982. Soil ingestion by cattle. J. Dairy Sci. 65:611-
618.
Gudmundsson, O., and K. Halldorsdottir. 1993. The use of n-alkanes as markers for
determination of intake and digestibility of fish feed. Worksh. Method. Det. Nutr. Req.
Fish. Eichenau Germany.
Hameleers, A., and R. W. Mayes. 1998. The use of n-alkanes to estimate supplementary grass
silage intake in grazing dairy cows. J. Agric. Sci. 131:205-209.
Hodgson, J. 1979. Nomenclature and definitions in grazing studies. Grass Forage Sci. 34:11-18.
105
Horadagoda, A., W. J. Fulkerson, K. S. Nandra, and I. M. Barchia. 2009. Grazing preferences by
dairy cows for 14 forage species. Anim. Prod. Sci. 49:586-594.
Illius, A. W., and N. S. Jessop. 1996. Metabolic constraints on voluntary intake in ruminants. J.
Anim. Sci. 74:3052-3062.
James, S. M., I. Kyriazakis and G. C. Emmans. 2001. Diet selection of sheep: effects of adding
urea to foods with different protein contents. Anim. Sci. 73:183-195.
Keli, A., D. Andueza , A. de Vega, and J.A. Guada. 2008. Validation of the n-alkane and NIRS
techniques to estimate intake, digestibility and diet composition in sheep fed mixed
lucerne:ryegrass diets. Livest. Sci. 119:42-54.
Kelman, W., M. Bugalho, and H. Dove. 2005. Cuticular wax alkanes and alcohols used as
markers to estimate diet composition of sheep (Ovis aries). Bioch. Syst. Ecol. 31:919-
927.
Kleiber, M. 1947. Body size and metabolic rate. Physiol. Rev. 27:511-541.
Koknaroglu, H., and M. P. Hoffman. 2010. Effect of fram score and carcass characteristics of
steers finished on the feedlot or backgrounded for various time on pasture and finished in
the feedlot. Archiv. Tierzucht. 53:426-435.
Koots, K. R.; J. P. Gibson, C. Smith, and J. W. Wilton. 1994. Analyses of published genetic
parameter estimates for beef production traits. 2. Phenotypic and genetic correlations.
Anim. Breed. Abstr. 62:825-853.
Lewis, R. M. A. M. Magadlela, N. S. Jessop, and G. C. Emmans. 2003. The ability of the n-
alkane technique to estimate intake and diet choice of sheep. Anim. Sci. 77:319-327.
Lin, L. J., X. Y. Zhu, C. Jiang, H. L. Luo, H. Wang, Y. J. Zhang, and F. Z. Hong. The potential
use of n-alkanes, long-chain alcohols, and long-chain fatty acids as diet composition
106
markers: indoor validation with sheep and herbage species from the rangeland of Inner
Mongolia of China. 2012. Animal. 6:449-458.
Lobato, J. F. P., G. R. Pearce, and D. E. Tribe. 1980. Measurement of the variability in intake by
sheep of oat grain, hay and molasses-urea blocks using chromic oxide as a marker. J.
Aust. Exp. Agric. Anim. Husb. 20:413-416.
Malossini F., S. Bovolenta, E. Piasentier, and M. Valentinotti. 1994. Variability of n-alkane
content in a natural pasture and in faeces of grazing dairy cows. Anim. Feed. Sci.
Technol. 50:113-122.
Malossini F., S. Bovolenta, E. Piasentier, C. Piras, and F. Martolloti. 1996. Comparison of n-
alkanes and chromium oxide methods for estimating herbage intake by grazing dairy
cows. Anim. Feed Sci. Technol. 61:155-165.
Mendonza, G. D., R. Ricalde, and T. Arroyo. 1995. Prediction of dry matter intake based on
rumen evacuation. Small Rum. Res. 18:133-136.
Morais, J. A. S., T.T. Berchielli, A. de Vega, M.F.S. Queiroz, A. Keli, R.A. Reis, L.M.A.
Bertipaglia, and S.F. Souza. 2010. The validity of n-alkanes to estimate intake and
digestibility in Nellore beef cattle fed a tropical grass (Brachiaria brizantha cv.
Marandu). Livest. Sci. 135:184-192.
Nikkhah, A. 2011. Bioscience of ruminant intake evolution. Adv. Biosc. Biotech. 2:271-274.
NRC. 1987. Predicting feed intake of food-producing animals. National academy press.
Washington, D.C. USA. 85pp.
Obeid, J.A., O. G. Pereira, D. H. Pereira, S. C. Valadares, I. P. Carvalho, J. M. Martins. 2006.
Crude protein levels in beef cattle diets: intake, digestibility and performance. R. Bras.
Zootec. 35:2434-2442.
107
Owens, F. N., and C. F. Hanson. 1992. External and Internal Markers for Appraising Site and
Extent of Digestion In Rumlnants. J. Dairy Sci. 75:2605-2617.
Parsons, A. J., J. A. Newman, P. D. Penning, A. Harvey, and R. J. Orr. 1994. Diet Preference of
Sheep: Effects of Recent Diet, Physiological State and Species Abundance. J. Anim.
Ecol. 63:465-478.
Pereira, D. H., G. O. Pereira, B. C. Silva, M. I. Leão, S. C. Valadares, R. Garcia. 2008. Nutrient
intake and digestibility and ruminal parameters in beef cattle fed diets containing
Brachiaria brizantha silage and concentrate at different ratios. Anim. Feed. Sci Technol.
140:52-66
Pietrogrande, M. C., M. Mercurialli, L. Pasti, and F. Dondi. 2009. Data handling of complex
GC–MS chromatograms: characterization of n-alkane distribution as chemical marker in
organic input source identification. Analyst. 134:671-680.
Pittroff, W., and M. M. Kothmann. 2001a. Quantitative prediction of feed intake in ruminants II.
Conceptual and mathematical analysis of models for cattle. Livest. Prod. Sci. 71:151-169.
Pittroff, W., and M. M. Kothmann. 2001b. Quantitative prediction of feed intake in ruminants
III. Comparative example calculations and discussion. Livest. Prod. Sci. 71:171-181.
Prigge, E. C., G. A, Varga, J. L. Vicini, and R. L. Reid. 1981. Comparison of ytterbium chloride
and chromium sesquioxide as fecal indicators. J. Anim. Sci. 53:1629-1633.
Rao, S. J., G. R. Iason, I. A. R. Hulbert, R. W. Mayes, and P. A. Racey. 2003. Estimating diet
composition for mountain hares in newly established native woodland: development and
application of plant-wax faecal markers. Can. J. Zool. 81:1047-1056.
Regert, M., J. Langlois, and S. Colinart. 2005. Characterisation of wax works of art by gas
chromatographic procedures. J. Chromatogr. A. 1091:124-136.
108
Rosiere, R.E., J. D. Wallace, and R. F. Beck. 1975. Cattle diets on semidesert grassland: nutritive
content. J. Range Manag. 28:94-96.
Rutter, S. M., 2006. Diet preference for grass and legumes in free-ranging domestic sheep and
cattle: Current theory and future application. Appl. Anim. Behav. Sci. 97:17-35.
Stevens, D.M., J. B. J. van Ryssen, and J. P. Marais. 2003. The use of n-alkane markers to
estimate the intake and apparent digestibility of ryegrass and Kikuyu by horses. S. Afr. J.
Anim. Sci. 32:50-56.
Stilmant, D., P. Limbourg, and P. Lecomte. 2005. Assessment of cattle preference for perennial
ryegrass varieties in association with white clover. Does white clover content interfere? J.
Agron. Crop. Sci. 191:233-240.
Stuth, J. W., and R. K. Lyons. 1999. Grazing steer fecal output dynamics on south Texas
shrubland. J. Range Manag. 52:275-282.
Trenkle, A., and R. L. Willham. 1977. Beef production efficiency. Science. 198:1009-1015.
Tulloch, A. P. 1981. Composition of epicuticular waxes from 28 genera of Gramineae:
differences between subfamilies. Can. J. Bot. 59:1213-1221.
Vallentine, J. F. 2001. Grazing management. Academic Press. San Diego, CA. USA 673pp.
Van Soest, P. J., J. B. Robertson, and B. A. Lewis. Methods for dietary fiber, neutral detergent
fiber, and nonstarch polysaccharides in relation to animal nutrition. J. Dairy Sci. 74:3583-
3597.
Vargas, C. A., T. A. Olson, C. C. Chase Jr., A. C. Hammond, and M. A. Elzo. 1999. Influence of
frame size and body condition score on performance of Brahman cattle. J. Anim. Sci.
77:3140-3149.
109
Vargas Junior, F. M., F. S. Wechsler, P. Rossi, M. V. Morais de Oliveira, and P. Schmidt. 2011.
Voluntary intake of dry matter and performance of Nellore cows and their Nellore and
crossbred Simental × Nellore calves. R. Bras. Zootec. 40:2574-2581
Williams, Y. J., J. E. Pryce, C. Grainger, W. J. Wales, N. Linden, M. Porker, and B. J. Hayes.
Variation in residual feed intake in Holstein-Friesian dairy heifers in southern Australia.
J. Dairy. Sci. 94 :4715–4725