Embed Size (px)
Citation preview
Assessing the Poverty Impact of Small Enterprise Initiatives
Prepared for:
Working Group for Impact Measurement and Performance Committee of Donor Agencies for Small Enterprise Development
Nexus Associates, Inc. 8 September 2003
1 Introduction
Donor agencies have undertaken a broad range of initiatives to promote the development of small enterprises in developing countries.1 These programs have been designed to help companies gain access to financing and business development services as well as to strengthen the overall business enabling environment.
To a great extent, small enterprise initiatives have been undertaken to help achieve the Millennium Development Goals. In 2000, the UN Millennium Declaration called for a shared agenda for sustainable development and the elimination of poverty. It included eight goals that all 191 Member States pledged to reach by 2015:
Eradicate extreme poverty and hunger;
Achieve universal primary education;
Promote gender equality and empower women;
Reduce child mortality;
Improve maternal health;
Combat HIV/AIDS, malaria and other diseases;
Ensure environmental sustainability; and
Develop a global partnership for development.
With reference to the first goal, members of the United Nations expressed their commitment to halving the proportion of people living in households with income per person of less than US$1 per day by 2015. Member states recognized that a strong and vibrant private sector is critical to the achievement of goal. Private businesses, particularly small enterprises (SEs), account for a significant share of the overall economy in developing countries. Further development of small enterprises is seen as an important vehicle for providing opportunities for gainful employment for the world’s poor.
Significantly, the UN Millennium Declaration highlighted the importance of measurable results. In this vein, donor agencies are now being asked by governments and other stakeholders to demonstrate whether SE initiatives have actually achieved intended outcomes, particularly with respect to the eradication of extreme poverty. Given the obligation to show results, the Committee of Donor Agencies for Small Enterprise Development (Donor Committee) would like to develop a better understanding of how to conceptualize and measure the impact of small enterprise initiatives in terms of poverty reduction.2
1 “Small enterprises” are defined to include both micro enterprises and small- and medium-scale enterprises. Definitions are usually based on the number of employees, annual turnover, or assets. While cut-off levels vary, micro enterprises are defined typically as firms with up to 10 employees, small enterprises have from 10 to 50-100 employees, and medium enterprises have from 50 to 100-250 employees. 2 The Committee of Donor Agencies for Small Enterprise Development was founded in 1979 to share knowledge and best practices among donors that support small enterprise programs. Participants include 20 bilateral agencies from 16 countries, 16 multilateral agencies, and three international development organizations. This paper was commissioned by the Working Group for Impact Measurement and Performance, a subcommittee of the Donor Committee. The views expressed here are those of the authors and do not necessarily represent the policies of the World Bank Group or members of the Donor Committee.
Nexus Associates, Inc. Page 2
This paper is intended to help meet this need. It provides a conceptual framework for measuring the poverty impacts of small enterprise programs, particularly those that focus on business development services (BDS), and presents specific methods that can be used in such evaluations.3, 4
Following this introduction, Section 2 discusses the logic underlying BDS programs, including the causal mechanisms that link program activities to poverty reduction. Section 3 focuses on specific methods that organizations can use to assess the poverty impacts of BDS programs. After presenting specific indicators of poverty, the section outlines the steps required to use five different methods to assess poverty impacts using a hypothetical BDS program as an example. This section also includes a discussion of potential sources of household income and consumption data. The paper concludes with recommendations that donors should consider in conducting impact studies in the future.
3 This paper builds on an earlier paper. See Oldsman, Eric and Kris Hallberg, "Framework for Evaluating the Impact of Small Enterprise Initiatives," Committee of Donor Agencies for Small Enterprise Development, April 2002. 4 Nexus Associates was asked to focus on BDS programs by members of the Working Group. However, it should be noted that the principles and methods discussed in the paper can be applied to all types of small enterprise initiatives.
Nexus Associates, Inc. Page 3
2 Moving the poor out of poverty
Donor agencies have invested in a number of initiatives that promote the development of small enterprises in developing countries. As shown in Table 1 and summarized below, these initiatives can be grouped into three categories according to the focus of the intervention: business environment, financial services, and business development services (BDS).
Business environment. Small enterprises operate within a policy, legal and regulatory environment established by government (i.e., executive, legislative and judicial branches). In many developing countries, this environment is not conducive to the formation and growth of small firms. As a result, donors have taken steps to work with government and other stakeholders to formulate new policies, reduce tax and regulatory burdens, and streamline various procedures in order to provide greater resources and reduce the burdens on small enterprises. Small enterprises are expected to benefit from these reforms as a result of lower costs (i.e., factor input costs, regulatory compliance costs, and taxes) and an expansion in markets for their goods and services
Financial services. Small enterprises may need access to financing at various stages of their development, including seasonal or revolving lines of credit to meet short-term financing requirements, or intermediate or long-term debt for land, buildings, equipment, and permanent increases in inventory. In response to these needs, donors have invested in efforts to establish and strengthen financial institutions that provide financing to small enterprises. In these cases, the financial institutions are the direct target of donor-supported initiatives. The specific aim of these initiatives is help financial institutions expand available credit, establish new services, improve lending practices, and enhance their overall performance. These efforts are intended, in turn, to result in a greater availability of capital under suitable terms and conditions to small enterprises.
Business development services (BDS). Small enterprises may require various forms of outside assistance to address specific needs related to planning, production, operations and other business processes. The range of services that companies may call on is quite broad, including legal, accounting, auditing, bookkeeping, administrative, data processing, information system design and installation, management consulting, business brokering, market research, marketing, advertising, engineering, and training. These services fall under the general rubric of “business development services.” Donors have taken steps to enhance the supply of business development services available to small enterprises as well as spur greater demand for such services among targeted small enterprises. Companies that receive services are expected to improve their performance.
These initiatives are not mutually exclusive. Certain initiatives may combine different elements. For example, donors may support efforts of organizations to reform laws and regulations concerning the establishment of business associations. Backed by donor funding, organizations may also work directly with business associations to strengthen their capacity to provide various services to members and to advocate for needed policy reforms.
Nexus Associates, Inc. Page 4
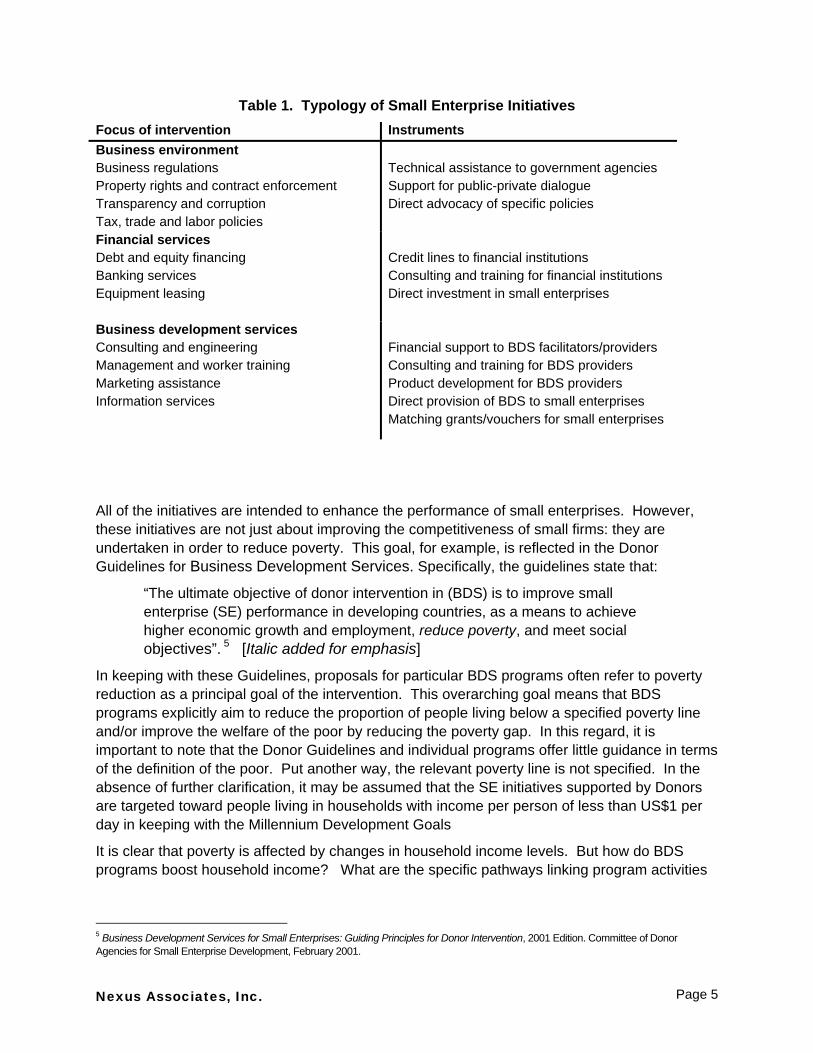
Table 1. Typology of Small Enterprise Initiatives Focus of intervention Instruments Business environment Business regulations Property rights and contract enforcement Transparency and corruption Tax, trade and labor policies
Technical assistance to government agencies Support for public-private dialogue Direct advocacy of specific policies
Financial services Debt and equity financing Banking services Equipment leasing
Credit lines to financial institutions Consulting and training for financial institutions Direct investment in small enterprises
Business development services Consulting and engineering Management and worker training Marketing assistance Information services
Financial support to BDS facilitators/providers Consulting and training for BDS providers Product development for BDS providers Direct provision of BDS to small enterprises Matching grants/vouchers for small enterprises
All of the initiatives are intended to enhance the performance of small enterprises. However, these initiatives are not just about improving the competitiveness of small firms: they are undertaken in order to reduce poverty. This goal, for example, is reflected in the Donor Guidelines for Business Development Services. Specifically, the guidelines state that:
“The ultimate objective of donor intervention in (BDS) is to improve small enterprise (SE) performance in developing countries, as a means to achieve higher economic growth and employment, reduce poverty, and meet social objectives”. 5 [Italic added for emphasis]
In keeping with these Guidelines, proposals for particular BDS programs often refer to poverty reduction as a principal goal of the intervention. This overarching goal means that BDS programs explicitly aim to reduce the proportion of people living below a specified poverty line and/or improve the welfare of the poor by reducing the poverty gap. In this regard, it is important to note that the Donor Guidelines and individual programs offer little guidance in terms of the definition of the poor. Put another way, the relevant poverty line is not specified. In the absence of further clarification, it may be assumed that the SE initiatives supported by Donors are targeted toward people living in households with income per person of less than US$1 per day in keeping with the Millennium Development Goals
It is clear that poverty is affected by changes in household income levels. But how do BDS programs boost household income? What are the specific pathways linking program activities
5 Business Development Services for Small Enterprises: Guiding Principles for Donor Intervention, 2001 Edition. Committee of Donor Agencies for Small Enterprise Development, February 2001.
Nexus Associates, Inc. Page 5
to poverty reduction? The following discussion aims to shed light on the causal mechanisms that may come into play.
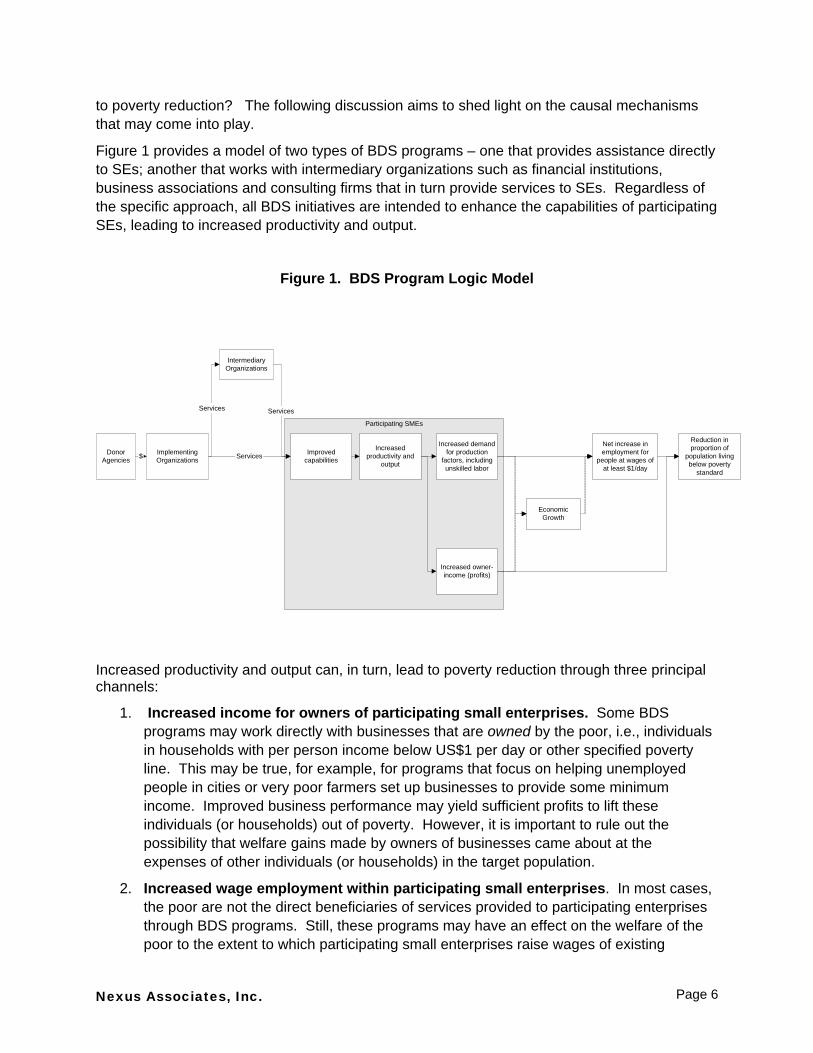
Figure 1 provides a model of two types of BDS programs – one that provides assistance directly to SEs; another that works with intermediary organizations such as financial institutions, business associations and consulting firms that in turn provide services to SEs. Regardless of the specific approach, all BDS initiatives are intended to enhance the capabilities of participating SEs, leading to increased productivity and output.
Figure 1. BDS Program Logic Model
DonorAgencies
ImplementingOrganizations
IntermediaryOrganizations
Participating SMEs
Improvedcapabilities
Increased owner-income (profits)
Net increase inemployment for
people at wages ofat least $1/day
Increasedproductivity and
output
Increased demandfor production
factors, includingunskilled labor
Reduction inproportion of
population livingbelow poverty
standard
$ Services
Services Services
EconomicGrowth
Increased productivity and output can, in turn, lead to poverty reduction through three principal channels:
1. Increased income for owners of participating small enterprises. Some BDS programs may work directly with businesses that are owned by the poor, i.e., individuals in households with per person income below US$1 per day or other specified poverty line. This may be true, for example, for programs that focus on helping unemployed people in cities or very poor farmers set up businesses to provide some minimum income. Improved business performance may yield sufficient profits to lift these individuals (or households) out of poverty. However, it is important to rule out the possibility that welfare gains made by owners of businesses came about at the expenses of other individuals (or households) in the target population.
2. Increased wage employment within participating small enterprises. In most cases, the poor are not the direct beneficiaries of services provided to participating enterprises through BDS programs. Still, these programs may have an effect on the welfare of the poor to the extent to which participating small enterprises raise wages of existing
Nexus Associates, Inc. Page 6
employees to levels above the poverty rate and/or increase their overall demand for labor at wages above the poverty rate. An expansion in output among enterprises that receive services would give rise to greater demand for labor, provided that output grows faster than labor productivity. However, higher labor demand is necessary, but not sufficient for poverty reduction. The incidence of poverty in a region would drop to the extent that jobs are filled by people in the target population who otherwise would have been unemployed or would have earned wages falling below the poverty line.
3. Additional economic growth, leading to a net increase in wage employment in the target population as a whole. More generally, the improved performance of participating small enterprises may yield better economic conditions within a region leading to higher real household income within the targeted population.6 This may result from indirect and induced employment effects as the impact of improved enterprise performance ripples throughout the economy and/or through reductions in the price of goods and services consumed by the poor. Put another way, SE initiatives benefit the poor to the extent that they result in pro-poor economic growth, i.e., growth that provides greater opportunities for the poor to generate higher real income.7 In this regard, numerous empirical studies have found that economic growth is associated with poverty reduction.8
Given the above discussion, the impact of BDS programs on poverty is best understood in terms of the overall incidence and/or depth of poverty in a region resulting from improved SE performance and general economic growth. To this end, the next section of the paper discusses how organizations can measure the impact of specific BDS programs, focusing on household income and consumption effects within regions in which these programs operate.
6 Effects of programs may also spillover into regions not directly targeted by the intervention. This extent of the spillover is a function of labor mobility and the propensity to purchase goods and services locally. 7 It should be noted that the incidence of poverty (based on a fixed poverty line) can fall even with rising income inequality. 8 See, for example, Dollar (2000).
Nexus Associates, Inc. Page 7
3 Measuring poverty impacts
3.1 Additionality
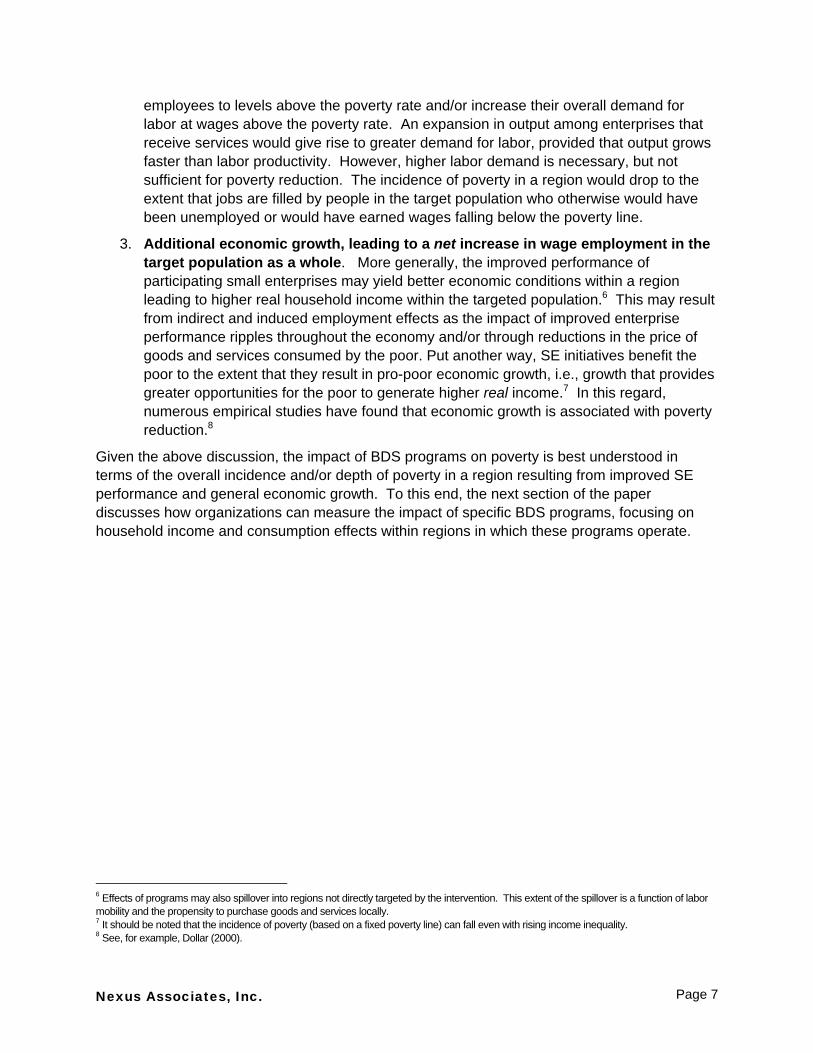
The fundamental tenet of impact assessment is the need to compare the observed situation with the intervention to what would have been had there been no intervention at all, i.e., the counterfactual. The difference in resulting outcomes between these two states constitutes the impact of the intervention as illustrated in Figure 2. While the counterfactual cannot be observed or known with complete certainty, the concept of comparing observed outcomes to this hypothetical state underlies all valid approaches to assessing impacts. Valid comparisons imply that the net effect of interventions is isolated from all other extraneous or confounding factors that influence defined outcomes.
Figure 2. The Impact of an Intervention
Thus, the major challenge in impact assessments is to estimate the effect of programs after netting out extraneous factors that affect outcomes. These factors may include specific events or long-term trends in industries, regions or countries. They may also include ongoing developments within participating small enterprises and/or households.9 Similarly, impact assessments need to account for the voluntary nature of programs. While households, per se, do not choose to participate in BDS programs, small enterprises do take part in programs of their own volition. Some companies may be more inclined to participate due to greater interest, motivation or other conditions within the firm. This self-selection process can bias results if the factors that lead companies to participate are related to the specific outcomes under study.10
Time
Outcome
Observed outcomewith intervention
What would have happenedwithout intervention
Impact}
9 Threats to internal validity are generally grouped under several broad categories such as external events, secular drift, maturation, regression and attrition. Readers interested in exploring these concepts in more detail are referred to Cook and Campbell (1979). 10 A similar sort of selection bias can occur when organizations select participants based on certain characteristics – this is referred to in the literature as administrative selection.
Nexus Associates, Inc. Page 8
3.2 Poverty Indicators
Efforts to reduce poverty revolve around the idea that people should have a standard of living that is no less than what society deems to be minimally acceptable. While there are multiple dimensions of poverty, the most common definitions center on the level of income or consumption enjoyed by individuals. By definition, measuring poverty implies establishing a threshold level of income or consumption below which people are considered poor. The poverty line is generally defined according to the minimum level required to satisfy a person’s basic needs based on the cost of a basket of everyday goods and services.11 The notion of what constitutes “basic needs” is a political question and varies across societies. As such, the poverty line is a reflection of the social norms at a particular place and moment in history.
That said, a common reference point needs to be established to allow international comparisons. The Millennium Development Goals establish the poverty line at the equivalent of US$1 per day in 1993 Purchasing Power Parity (PPP) terms.12 Using this standard, people in “extreme poverty” are those that live in households with income per person of less than one dollar per day. In 1999, some 1.2 billion people, or 24 percent of the total population in developing countries, lived below this poverty line.13 The incidence of poverty depends on where the threshold is set as well as the assumptions used in calculating particular measures.14
In practice, there are various monetary measures of poverty.15 Some focus on income as a measure of well-being; others center on consumption. Most experts argue that the level of consumption is a more valid and reliable measure of poverty than income since consumption reflects the actual ability of individuals to meet basic needs. Moreover, significant income, particularly in rural areas, may not be monetized to the extent that households consume their own production and/or exchange it for other goods and services. Finally, consumption may be easier to estimate (and, therefore, more accurate) than income which tends to be subject to greater volatility over the course of the year.
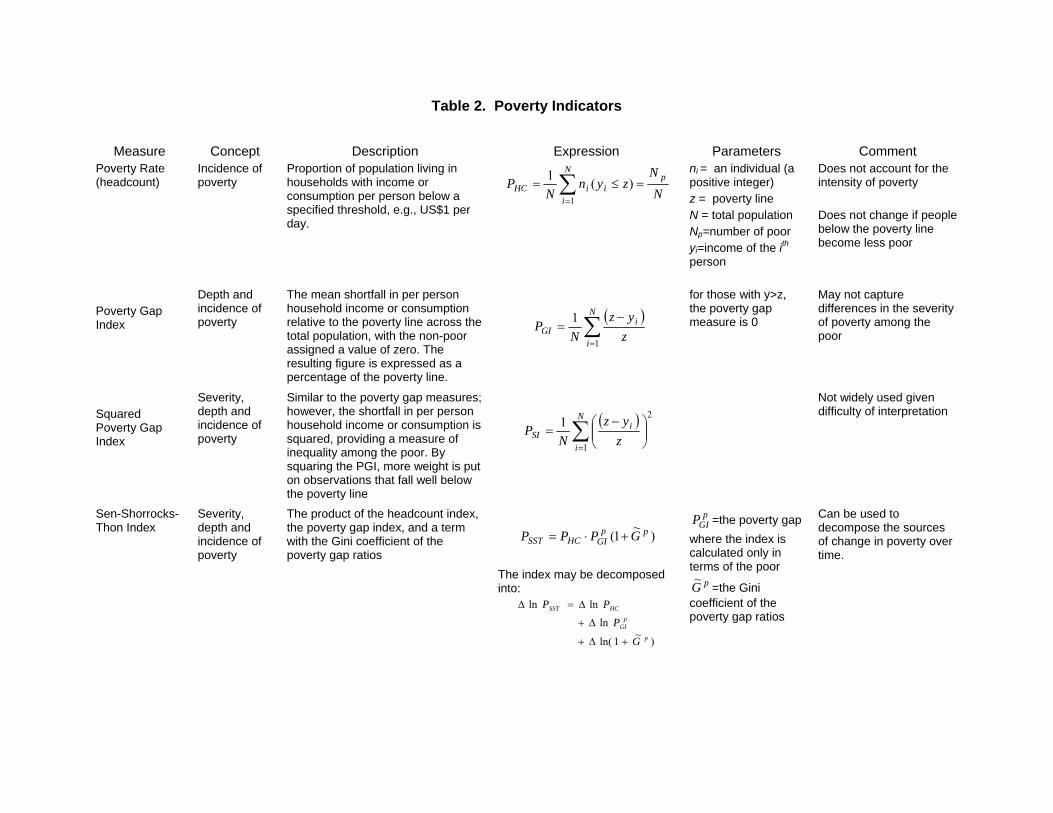
Evaluators need to select one or more indicators that will be used in determining whether an initiative reduced poverty among a particular population. While there are numerous variations, some of the indicators used to measure poverty are discussed below and described in Table 2
Poverty Rate (Headcount). As a measure of the incidence of poverty in a population, the poverty rate is relatively straightforward. It is simply the proportion of the population living in households with income per person below a specified poverty line. The poverty line can be adjusted to provide an estimate of the incidence of poverty at different threshold levels. However, this measure cannot account for whether the poor are losing ground or improving their conditions over time unless households cross the poverty line altogether. For example, the poor can increase their income and subsequently improve their welfare, yet still remain below the poverty line.
11 Another approach to defining poverty centers on relative income levels in particular countries. The most common approach is to draw the poverty line at 50 per cent of the median income level; however, the threshold level varies across countries. 12 The PPP is defined as the exchange rate between two countries that makes a similar basket of goods cost the same in both countries. 13 These estimates are based on household surveys where residents are asked to answer questions concerning their sources of income and spending habits. Such surveys are conducted more or less regularly in most countries. 14 For example, if the poverty line is raised to $2 per day (PPP), the number of people considered to be poor more than doubles to 2.8 billion. 15 Attention has also been placed on establishing non-monetary measures of poverty. These tend to focus on health, education and access to resources.
Nexus Associates, Inc. Page 9
Nexus Associates, Inc. Page 10
Poverty Gap Index. The index provides a measure of the depth of poverty within a population in terms of the gap between income or consumption levels and the specified poverty line. The poverty gap can also be used as an estimate of the minimum amount of additional income needed to eradicate poverty. The measure does not, however, account for the extent of inequality among the poor.
Squared Poverty Gap Index. This measure takes the severity of poverty into account by placing a higher weight on individuals living in households that are furthest from the poverty line.
Sen-Shorrocks-Thon Index. The final measure attempts to combine the incidence, depth and severity of poverty into one indicator. One benefit of this particular measure is that is can be broken down into three components, enabling the evaluator to determine the extent to which the poor are fewer in number, are less poor and/or subject to less inequality.
All of the poverty indicators hinge on the precise definition of the poverty line. Again, the poverty line is the threshold below which people are considered poor. It can be defined in absolute terms as the amount of income needed to satisfy basic needs (food and other essentials). Alternatively, the poverty line can be expressed relative to the overall income distribution in a country or region. Regardless of the approach, the choice of which poverty line(s) to use in an evaluation of a particular BDS program should reflect the objectives of the program as well as social norms as to what constitutes minimum living conditions. In the absence of a good alternative, donor agencies may want to use $1 per day as the relevant poverty line for evaluations of SE initiatives since this would be consistent with the Millennium Development Goals.
As can be seen, a variety of indicators can be used to measure the incidence, depth and severity of poverty among different populations. The evaluator can choose more than one measure in seeking to determine the impact of a particular BDS program. Multiple measures would provide more insight into the nature of impacts, providing information on whether programs reduced the proportion of the population living in poverty, reduced the overall poverty gap, and/or reduced inequality among the poor.
Measure Concept Description Expression Parameters CommentPoverty Rate (headcount)
Incidence of poverty
Proportion of population living in households with income or consumption per person below a specified threshold, e.g., US$1 per day.
∑=
=≤=N
i
piiHC N
Nzyn
NP
1
)(1
ni = an individual (a positive integer) z = poverty line N = total population Np=number of poor yi=income of the ith person
Does not account for the intensity of poverty Does not change if people below the poverty line become less poor
Poverty Gap Index
Depth and incidence of poverty
The mean shortfall in per person household income or consumption relative to the poverty line across the total population, with the non-poor assigned a value of zero. The resulting figure is expressed as a percentage of the poverty line.
( )∑=
−=
N
i
iGI z
yzN
P1
1
for those with y>z, the poverty gap measure is 0
May not capture differences in the severity of poverty among the poor
Squared Poverty Gap Index
Severity, depth and incidence of poverty
Similar to the poverty gap measures; however, the shortfall in per person household income or consumption is squared, providing a measure of inequality among the poor. By squaring the PGI, more weight is put on observations that fall well below the poverty line
( )∑=
⎟⎟⎠
⎞⎜⎜⎝
⎛ −=
N
i
iSI z
yzN
P1
21
Not widely used given difficulty of interpretation
Sen-Shorrocks-Thon Index
Severity, depth and incidence of poverty
The product of the headcount index, the poverty gap index, and a term with the Gini coefficient of the poverty gap ratios
)~1( ppGIHCSST GPPP +⋅=
The index may be decomposed into:
)~1ln(
ln
lnln
p
pGI
HCSST
G
P
PP
+∆+
∆+
∆=∆
pGIP =the poverty gap
where the index is calculated only in terms of the poor
pG~ =the Gini coefficient of the poverty gap ratios
Can be used to decompose the sources of change in poverty over time.
Table 2. Poverty Indicators
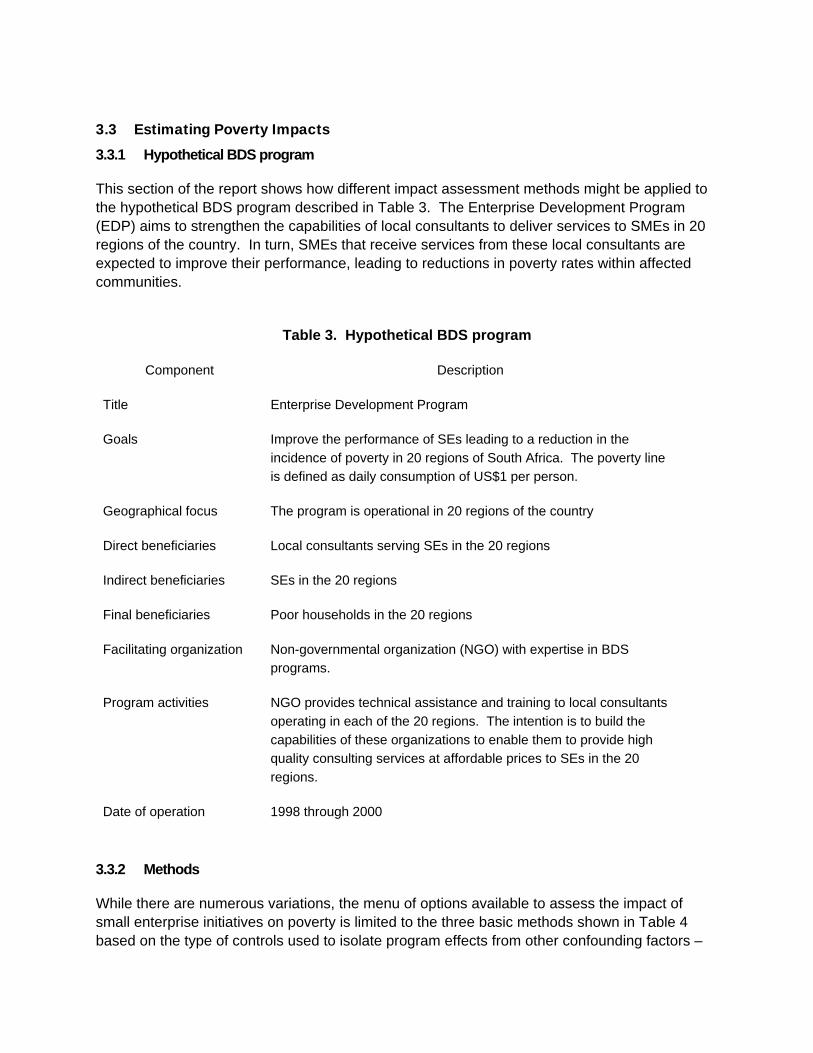
3.3 Estimating Poverty Impacts 3.3.1 Hypothetical BDS program
This section of the report shows how different impact assessment methods might be applied to the hypothetical BDS program described in Table 3. The Enterprise Development Program (EDP) aims to strengthen the capabilities of local consultants to deliver services to SMEs in 20 regions of the country. In turn, SMEs that receive services from these local consultants are expected to improve their performance, leading to reductions in poverty rates within affected communities.
Table 3. Hypothetical BDS program
Component Description
Title Enterprise Development Program
Goals Improve the performance of SEs leading to a reduction in the incidence of poverty in 20 regions of South Africa. The poverty line is defined as daily consumption of US$1 per person.
Geographical focus The program is operational in 20 regions of the country
Direct beneficiaries Local consultants serving SEs in the 20 regions
Indirect beneficiaries SEs in the 20 regions
Final beneficiaries Poor households in the 20 regions
Facilitating organization Non-governmental organization (NGO) with expertise in BDS programs.
Program activities NGO provides technical assistance and training to local consultants operating in each of the 20 regions. The intention is to build the capabilities of these organizations to enable them to provide high quality consulting services at affordable prices to SEs in the 20 regions.
Date of operation 1998 through 2000
3.3.2 Methods
While there are numerous variations, the menu of options available to assess the impact of small enterprise initiatives on poverty is limited to the three basic methods shown in Table 4 based on the type of controls used to isolate program effects from other confounding factors –
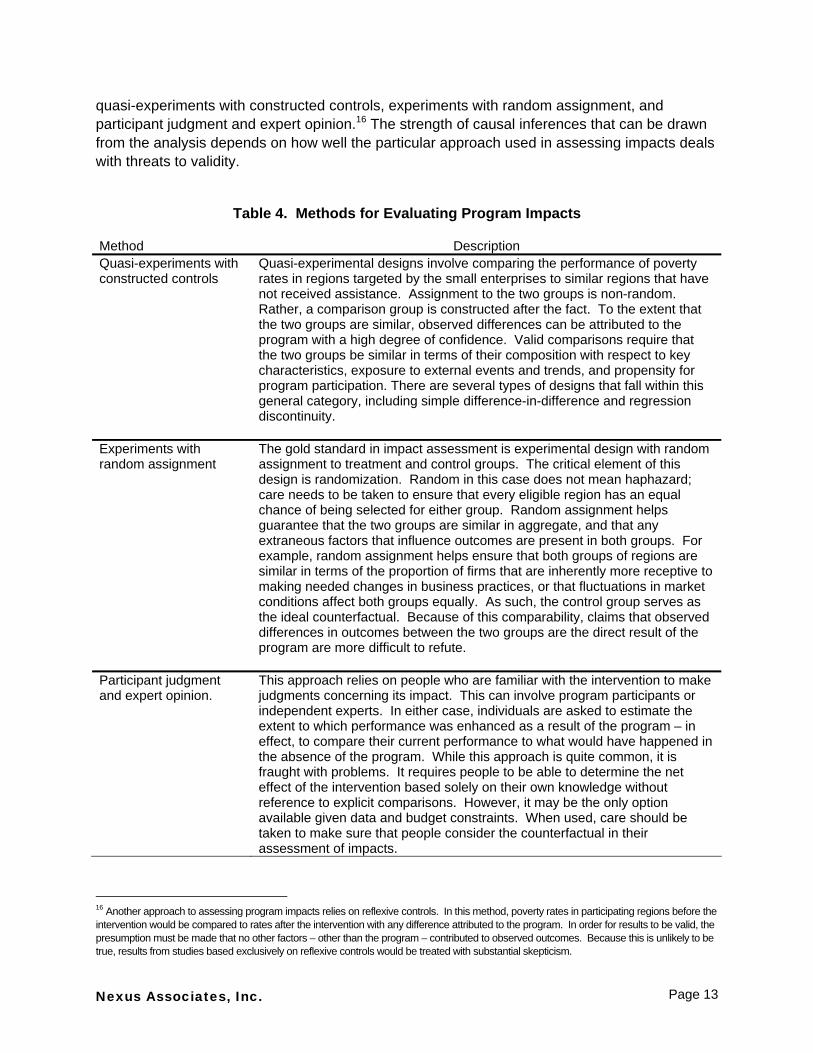
quasi-experiments with constructed controls, experiments with random assignment, and participant judgment and expert opinion.16 The strength of causal inferences that can be drawn from the analysis depends on how well the particular approach used in assessing impacts deals with threats to validity.
Table 4. Methods for Evaluating Program Impacts Method Description Quasi-experiments with constructed controls
Quasi-experimental designs involve comparing the performance of poverty rates in regions targeted by the small enterprises to similar regions that have not received assistance. Assignment to the two groups is non-random. Rather, a comparison group is constructed after the fact. To the extent that the two groups are similar, observed differences can be attributed to the program with a high degree of confidence. Valid comparisons require that the two groups be similar in terms of their composition with respect to key characteristics, exposure to external events and trends, and propensity for program participation. There are several types of designs that fall within this general category, including simple difference-in-difference and regression discontinuity.
Experiments with random assignment
The gold standard in impact assessment is experimental design with random assignment to treatment and control groups. The critical element of this design is randomization. Random in this case does not mean haphazard; care needs to be taken to ensure that every eligible region has an equal chance of being selected for either group. Random assignment helps guarantee that the two groups are similar in aggregate, and that any extraneous factors that influence outcomes are present in both groups. For example, random assignment helps ensure that both groups of regions are similar in terms of the proportion of firms that are inherently more receptive to making needed changes in business practices, or that fluctuations in market conditions affect both groups equally. As such, the control group serves as the ideal counterfactual. Because of this comparability, claims that observed differences in outcomes between the two groups are the direct result of the program are more difficult to refute.
Participant judgment and expert opinion.
This approach relies on people who are familiar with the intervention to make judgments concerning its impact. This can involve program participants or independent experts. In either case, individuals are asked to estimate the extent to which performance was enhanced as a result of the program – in effect, to compare their current performance to what would have happened in the absence of the program. While this approach is quite common, it is fraught with problems. It requires people to be able to determine the net effect of the intervention based solely on their own knowledge without reference to explicit comparisons. However, it may be the only option available given data and budget constraints. When used, care should be taken to make sure that people consider the counterfactual in their assessment of impacts.
16 Another approach to assessing program impacts relies on reflexive controls. In this method, poverty rates in participating regions before the intervention would be compared to rates after the intervention with any difference attributed to the program. In order for results to be valid, the presumption must be made that no other factors – other than the program – contributed to observed outcomes. Because this is unlikely to be true, results from studies based exclusively on reflexive controls would be treated with substantial skepticism.
Nexus Associates, Inc. Page 13
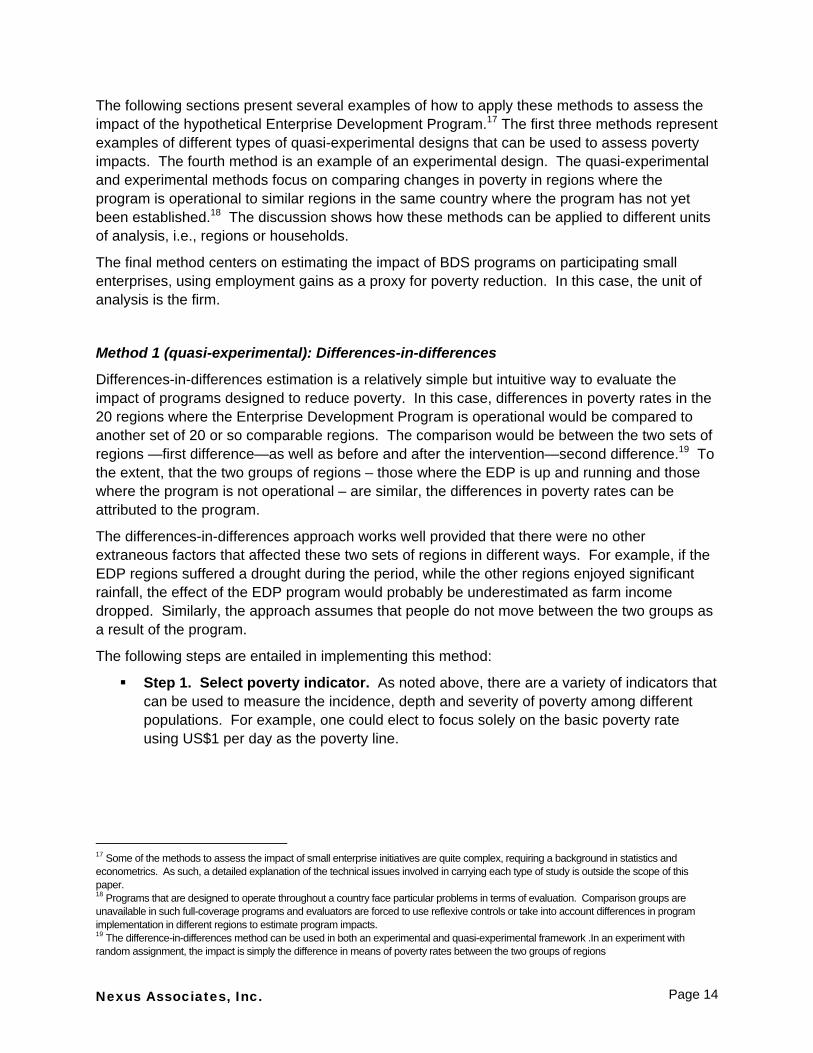
The following sections present several examples of how to apply these methods to assess the impact of the hypothetical Enterprise Development Program.17 The first three methods represent examples of different types of quasi-experimental designs that can be used to assess poverty impacts. The fourth method is an example of an experimental design. The quasi-experimental and experimental methods focus on comparing changes in poverty in regions where the program is operational to similar regions in the same country where the program has not yet been established.18 The discussion shows how these methods can be applied to different units of analysis, i.e., regions or households.
The final method centers on estimating the impact of BDS programs on participating small enterprises, using employment gains as a proxy for poverty reduction. In this case, the unit of analysis is the firm.
Method 1 (quasi-experimental): Differences-in-differences
Differences-in-differences estimation is a relatively simple but intuitive way to evaluate the impact of programs designed to reduce poverty. In this case, differences in poverty rates in the 20 regions where the Enterprise Development Program is operational would be compared to another set of 20 or so comparable regions. The comparison would be between the two sets of regions —first difference—as well as before and after the intervention—second difference.19 To the extent, that the two groups of regions – those where the EDP is up and running and those where the program is not operational – are similar, the differences in poverty rates can be attributed to the program.
The differences-in-differences approach works well provided that there were no other extraneous factors that affected these two sets of regions in different ways. For example, if the EDP regions suffered a drought during the period, while the other regions enjoyed significant rainfall, the effect of the EDP program would probably be underestimated as farm income dropped. Similarly, the approach assumes that people do not move between the two groups as a result of the program.
The following steps are entailed in implementing this method:
Step 1. Select poverty indicator. As noted above, there are a variety of indicators that can be used to measure the incidence, depth and severity of poverty among different populations. For example, one could elect to focus solely on the basic poverty rate using US$1 per day as the poverty line.
17 Some of the methods to assess the impact of small enterprise initiatives are quite complex, requiring a background in statistics and econometrics. As such, a detailed explanation of the technical issues involved in carrying each type of study is outside the scope of this paper. 18 Programs that are designed to operate throughout a country face particular problems in terms of evaluation. Comparison groups are unavailable in such full-coverage programs and evaluators are forced to use reflexive controls or take into account differences in program implementation in different regions to estimate program impacts. 19 The difference-in-differences method can be used in both an experimental and quasi-experimental framework .In an experiment with random assignment, the impact is simply the difference in means of poverty rates between the two groups of regions
Nexus Associates, Inc. Page 14
Step 2. Select time period. In the current example, the evaluation would focus on the impact of the program between 1997 (the year before the EDP was initiated) and 2001 (the year after the program was completed).20
Step 3. Obtain data. Data pertaining to poverty rates and other characteristics are needed for the analysis. In many instances, these data can be drawn from official government surveys, including household surveys.
Step 4. Construct comparison group. The next step is to identify and select as many regions as possible that are comparable to those in which the EDP has been operational. The selection should take factors into account that are believed to have a bearing on poverty. This could include such variables as population size, age distribution, gender distribution, educational attainment, industrial composition, physical infrastructure, etc.
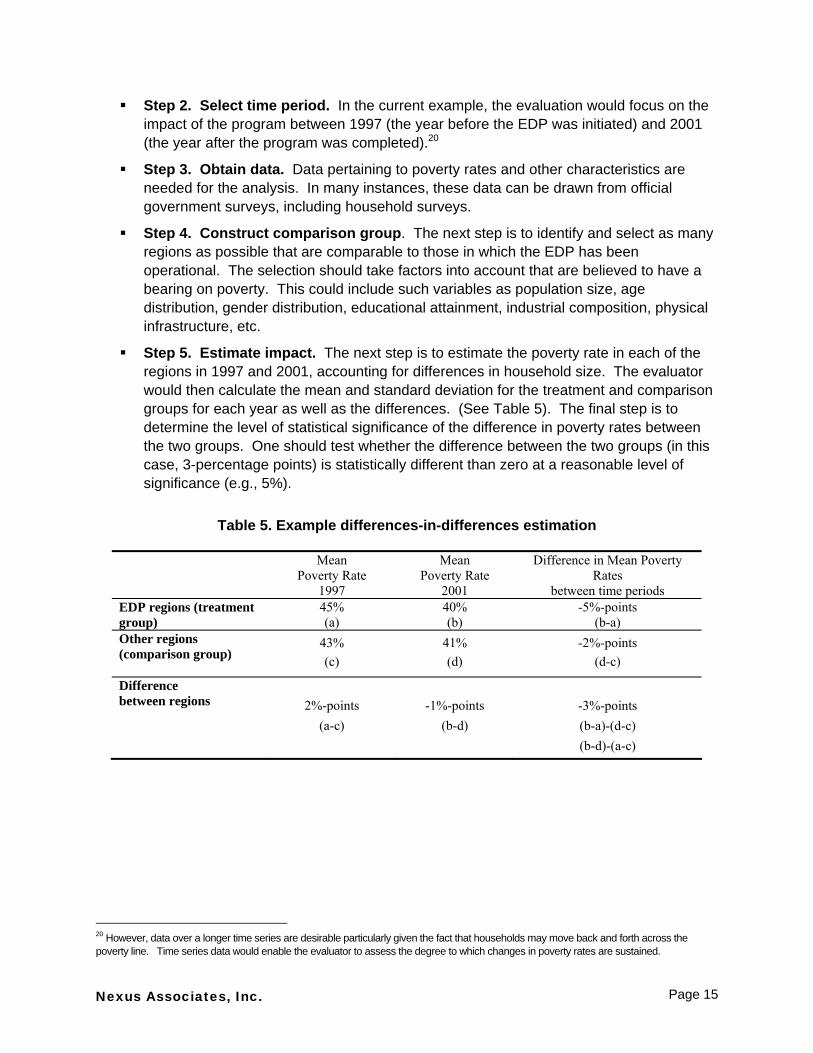
Step 5. Estimate impact. The next step is to estimate the poverty rate in each of the regions in 1997 and 2001, accounting for differences in household size. The evaluator would then calculate the mean and standard deviation for the treatment and comparison groups for each year as well as the differences. (See Table 5). The final step is to determine the level of statistical significance of the difference in poverty rates between the two groups. One should test whether the difference between the two groups (in this case, 3-percentage points) is statistically different than zero at a reasonable level of significance (e.g., 5%).
Table 5. Example differences-in-differences estimation
Mean Poverty Rate
1997
Mean Poverty Rate
2001
Difference in Mean Poverty Rates
between time periods EDP regions (treatment group)
45% (a)
40% (b)
-5%-points (b-a)
Other regions (comparison group)
43% (c)
41% (d)
-2%-points (d-c)
Difference between regions 2%-points
(a-c) -1%-points
(b-d)
-3%-points (b-a)-(d-c) (b-d)-(a-c)
20 However, data over a longer time series are desirable particularly given the fact that households may move back and forth across the poverty line. Time series data would enable the evaluator to assess the degree to which changes in poverty rates are sustained.
Nexus Associates, Inc. Page 15
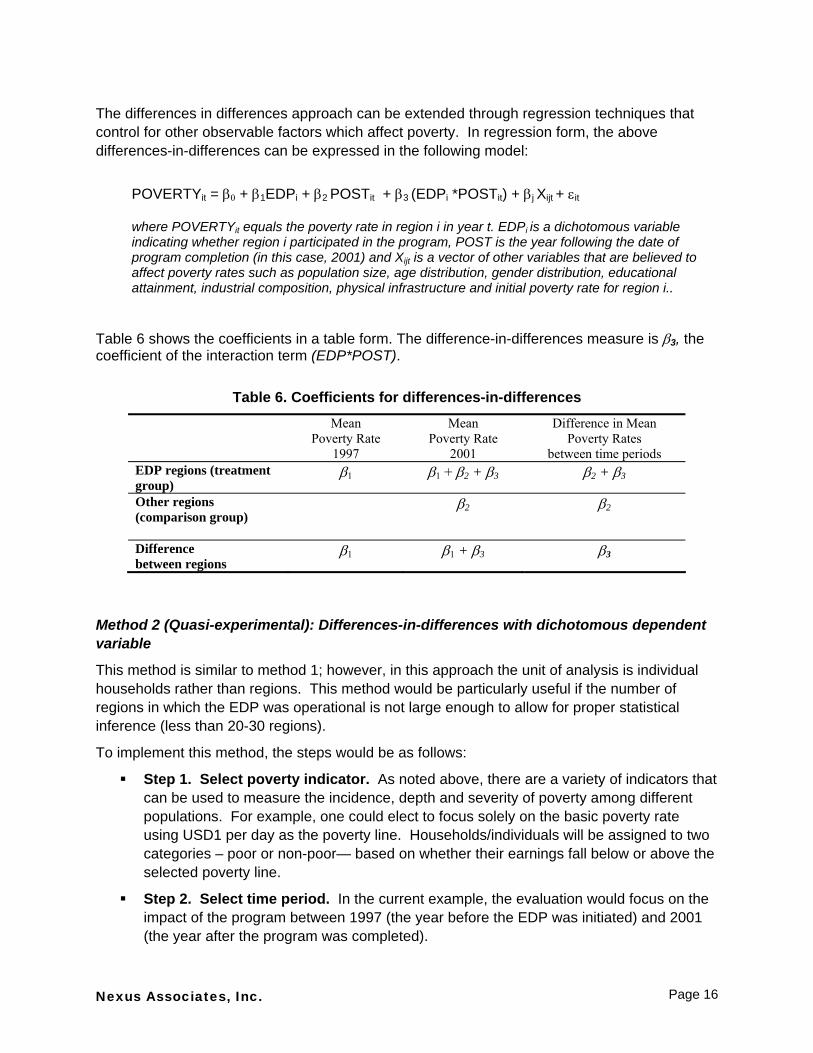
The differences in differences approach can be extended through regression techniques that control for other observable factors which affect poverty. In regression form, the above differences-in-differences can be expressed in the following model:
POVERTYit = β0 + β1EDPi + β2 POSTit + β3 (EDPi *POSTit) + βj Xijt + εit
where POVERTYit equals the poverty rate in region i in year t. EDPi is a dichotomous variable indicating whether region i participated in the program, POST is the year following the date of program completion (in this case, 2001) and Xijt is a vector of other variables that are believed to affect poverty rates such as population size, age distribution, gender distribution, educational attainment, industrial composition, physical infrastructure and initial poverty rate for region i..
Table 6 shows the coefficients in a table form. The difference-in-differences measure is β3, the coefficient of the interaction term (EDP*POST).
Table 6. Coefficients for differences-in-differences
Mean Poverty Rate
1997
Mean Poverty Rate
2001
Difference in Mean Poverty Rates
between time periods EDP regions (treatment group)
β1 β1 + β2 + β3 β2 + β3
Other regions (comparison group)
β2 β2
Difference between regions
β1 β1 + β3 β3
Method 2 (Quasi-experimental): Differences-in-differences with dichotomous dependent variable
This method is similar to method 1; however, in this approach the unit of analysis is individual households rather than regions. This method would be particularly useful if the number of regions in which the EDP was operational is not large enough to allow for proper statistical inference (less than 20-30 regions).
To implement this method, the steps would be as follows:
Step 1. Select poverty indicator. As noted above, there are a variety of indicators that can be used to measure the incidence, depth and severity of poverty among different populations. For example, one could elect to focus solely on the basic poverty rate using USD1 per day as the poverty line. Households/individuals will be assigned to two categories – poor or non-poor— based on whether their earnings fall below or above the selected poverty line.
Step 2. Select time period. In the current example, the evaluation would focus on the impact of the program between 1997 (the year before the EDP was initiated) and 2001 (the year after the program was completed).
Nexus Associates, Inc. Page 16
Step 3. Obtain data. Data pertaining to household earnings and other characteristics as well as regional variables are needed for the analysis. In many instances, these data can be drawn from official government surveys, including household surveys.
Step 4. Construct control group. The next step is to identify and select as many regions as possible that are comparable to those in which the EDP has been operational. The selection should take factors into account that are believed to have a bearing on poverty. This could include such variables as population size, age, gender distribution, educational attainment, industrial composition, physical infrastructure, etc.
Step 5. Estimate impact. The next step is to estimate whether households in a region where the EDP has been operational were more likely to escape poverty than households in the control regions over the course of the EDP.
The model can be presented as follows:
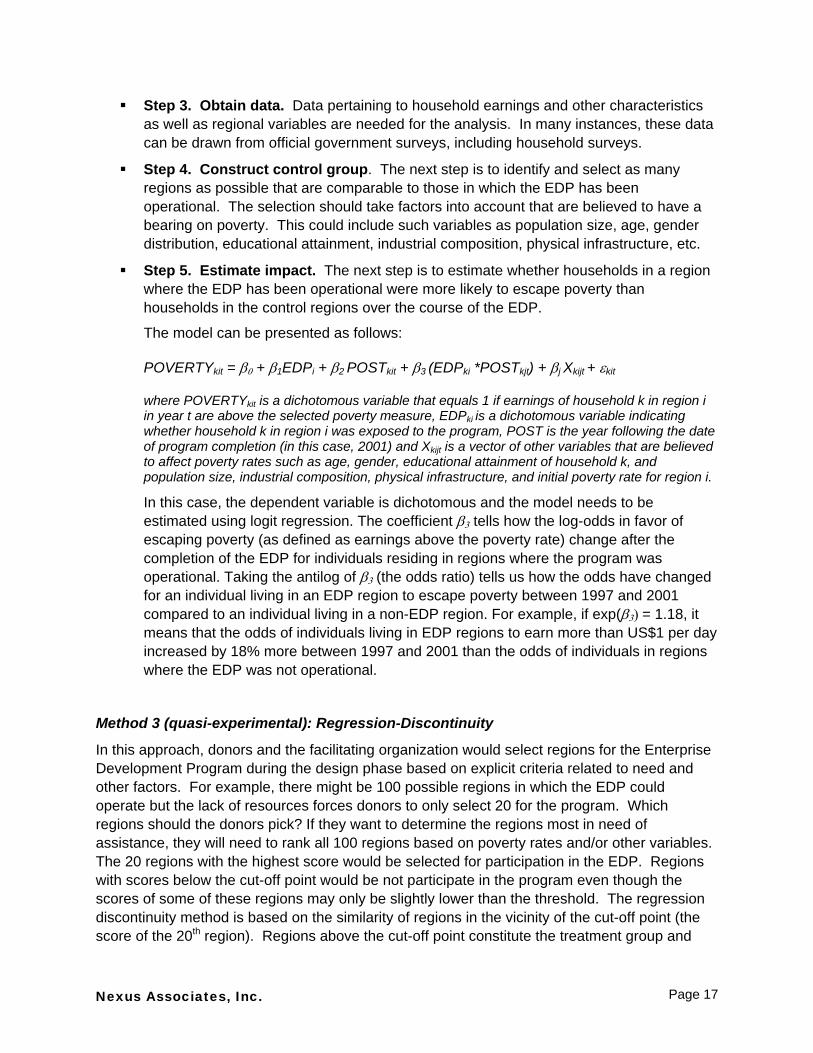
POVERTYkit = β0 + β1EDPi + β2 POSTkit + β3 (EDPki *POSTkjt) + βj Xkijt + εkit where POVERTYkit is a dichotomous variable that equals 1 if earnings of household k in region i in year t are above the selected poverty measure, EDPki is a dichotomous variable indicating whether household k in region i was exposed to the program, POST is the year following the date of program completion (in this case, 2001) and Xkijt is a vector of other variables that are believed to affect poverty rates such as age, gender, educational attainment of household k, and population size, industrial composition, physical infrastructure, and initial poverty rate for region i.
In this case, the dependent variable is dichotomous and the model needs to be estimated using logit regression. The coefficient β3 tells how the log-odds in favor of escaping poverty (as defined as earnings above the poverty rate) change after the completion of the EDP for individuals residing in regions where the program was operational. Taking the antilog of β3 (the odds ratio) tells us how the odds have changed for an individual living in an EDP region to escape poverty between 1997 and 2001 compared to an individual living in a non-EDP region. For example, if exp(β3) = 1.18, it means that the odds of individuals living in EDP regions to earn more than US$1 per day increased by 18% more between 1997 and 2001 than the odds of individuals in regions where the EDP was not operational.
Method 3 (quasi-experimental): Regression-Discontinuity
In this approach, donors and the facilitating organization would select regions for the Enterprise Development Program during the design phase based on explicit criteria related to need and other factors. For example, there might be 100 possible regions in which the EDP could operate but the lack of resources forces donors to only select 20 for the program. Which regions should the donors pick? If they want to determine the regions most in need of assistance, they will need to rank all 100 regions based on poverty rates and/or other variables. The 20 regions with the highest score would be selected for participation in the EDP. Regions with scores below the cut-off point would be not participate in the program even though the scores of some of these regions may only be slightly lower than the threshold. The regression discontinuity method is based on the similarity of regions in the vicinity of the cut-off point (the score of the 20th region). Regions above the cut-off point constitute the treatment group and
Nexus Associates, Inc. Page 17
regions below it form the comparison group. Critically, the score used to rank the regions for participation in the EDP can be used to control for selection.
Implementation of this method involves the following steps:
Step 1. Select poverty indicator. As noted above, there are a variety of indicators that can be used to measure the incidence, depth and severity of poverty among different populations. For example, one could elect to focus solely on the basic poverty rate using US$1 per day as the poverty line.
Step 2. Select time period. In the current example, the evaluation would focus on the impact of the program between 1997 (the year before the EDP was initiated) and 2001 (the year after the program was completed).21
Step 3. Obtain data. Data pertaining to ranking score, poverty rates and other characteristics are needed for the analysis. The ranking score should be available from program managers. Other required data can be drawn from official government surveys, including household surveys.
Step 4. Construct comparison group. The comparison group consists of those regions that were ranked, but not selected during the design phase.
Step 5. Estimate impact. The final step is to estimate the impact of the program based on the following model specification:
POVERTYit = β0 + β1SCOREi + β2EDPi + βj Xijt + εit where POVERTYit equals the change in the poverty rate in region i in year t. SCOREi is the score used to rank region i during the design phase; EDPi is a dichotomous variable indicating whether region i participated in the program, and Xijt is a vector of other variables that are believed to affect poverty rates such as population size, age distribution, gender distribution, educational attainment, industrial composition, physical infrastructure and initial poverty rate for region i..
The coefficient ( 2β ) of the treatment variable (EDP) is interpreted as the average impact on poverty for regions close to the threshold. One should then test whether the impact coefficient is statistically different than zero at a reasonable level of significance (e.g., 5%)
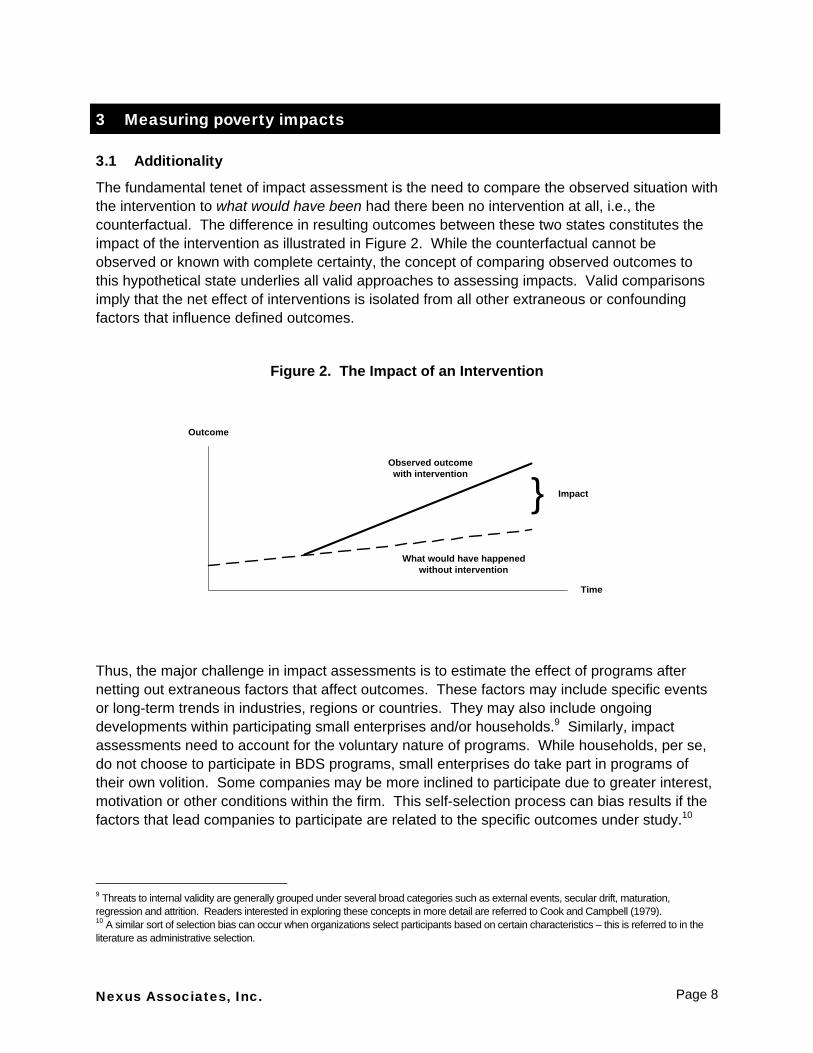
The concept underlying regression discontinuity is illustrated in Figure 3. It shows the impact of the EDP – β2 (mean poverty impact) – after controlling for the selection process. The difference between the dashed line and the solid line represents the impact of the EDP on poverty rates in participating regions.22
21 Longer time series, e.g., 1990-2003, are desirable but if they are not available, one data point both before and after would be sufficient. 22 It is worth mentioning that this example assumes a constant (linear) relationship between the index-ranking and the post-program level of poverty. However, in practice, the relationship between the ranking and the poverty indicator may not be linear. As such, it is important to note that the RD design yields the average impact of the program for those regions “around” the cut-off point. In other words, it may not be valid to extrapolate results far from the threshold used for selection.
Nexus Associates, Inc. Page 18
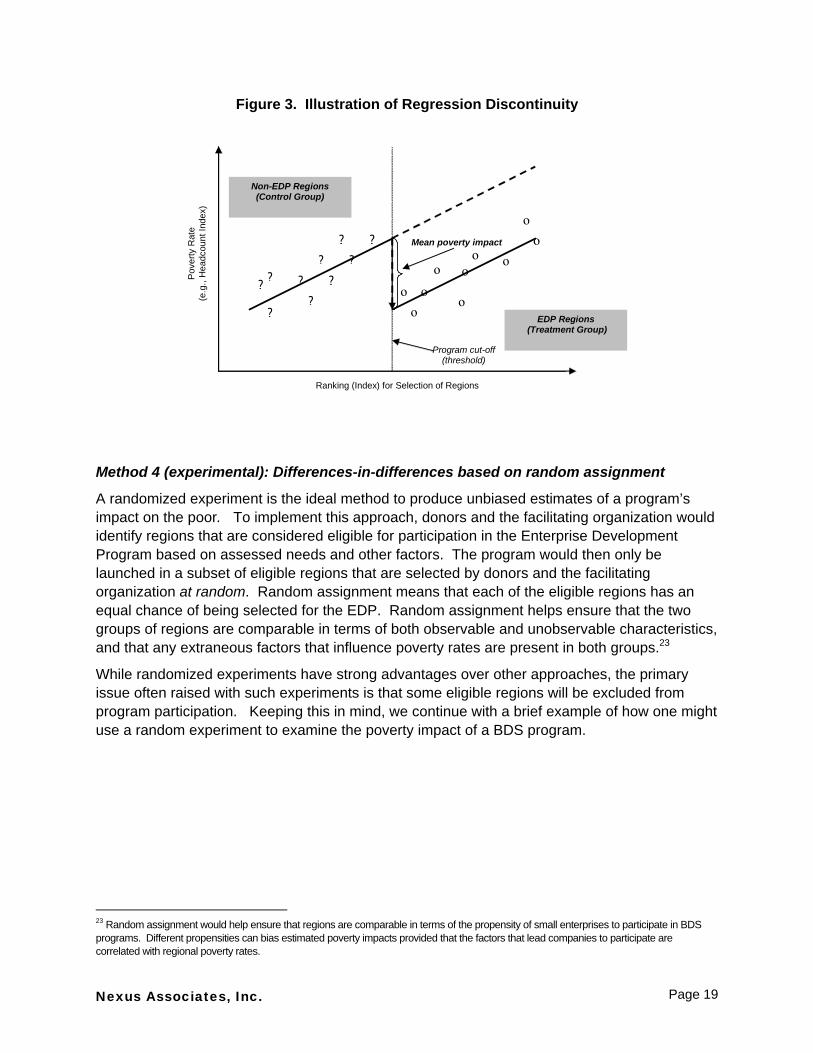
Figure 3. Illustration of Regression Discontinuity
Method 4 (experimental): Differences-in-differences based on random assignment
A randomized experiment is the ideal method to produce unbiased estimates of a program’s impact on the poor. To implement this approach, donors and the facilitating organization would identify regions that are considered eligible for participation in the Enterprise Development Program based on assessed needs and other factors. The program would then only be launched in a subset of eligible regions that are selected by donors and the facilitating organization at random. Random assignment means that each of the eligible regions has an equal chance of being selected for the EDP. Random assignment helps ensure that the two groups of regions are comparable in terms of both observable and unobservable characteristics, and that any extraneous factors that influence poverty rates are present in both groups.23
While randomized experiments have strong advantages over other approaches, the primary issue often raised with such experiments is that some eligible regions will be excluded from program participation. Keeping this in mind, we continue with a brief example of how one might use a random experiment to examine the poverty impact of a BDS program.
Ranking (Index) for Selection of Regions
Pov
erty
Rat
e
(e.g
., H
eadc
ount
Inde
x)
?
??
?
?
??
?
?
ο ο
ο
ο ο
ο
ο
ο
Program cut-off(threshold)
?
ο
Mean poverty impact
ο
Non-EDP Regions(Control Group)
EDP Regions (Treatment Group)
23 Random assignment would help ensure that regions are comparable in terms of the propensity of small enterprises to participate in BDS programs. Different propensities can bias estimated poverty impacts provided that the factors that lead companies to participate are correlated with regional poverty rates.
Nexus Associates, Inc. Page 19
The following steps are entailed in implementing this method:
Step 1. Select poverty indicator. One or more of the indicators could be used in the analysis.
Step 2. Select time period. In the current example, the evaluation would focus on the impact of the program between 1997 (the year before the EDP was initiated) and 2001 (the year after the program was completed).24
Step 3. Obtain data. Data pertaining to poverty rates and other characteristics are needed for the analysis. Data can be drawn from official government surveys, including household surveys.
Step 4. Construct comparison group. The comparison group consists of eligible regions that were not selected during the design phase for the experiment
Step 5. Estimate impact. The final step is to estimate the impact of the program based on a simple differences-in-differences approach or using regression techniques as described above. Because of random assignment, there is no need to control for selection bias.
Method 5: Participant judgment and expert opinion
This approach relies on people who are familiar with the intervention to make judgments concerning its impact. This can involve program participants or independent experts. In either case, individuals are asked to estimate the extent to which performance was enhanced as a result of the program – in effect, to compare their current performance to what would have happened in the absence of the program.
In this case, it would be inappropriate to survey poor households in the 20 regions to determine the impact of consultant capacity building efforts on their own income or consumption. Individuals in poor households are too far removed from the direct intervention to gauge the impact of the BDS program on their own well-being.
However, it may be possible to conduct a survey of SEs that received services from participating consultants to elicit their opinions on the extent to which services resulted in higher employment in their firms. This presume that participating consulting firms maintain exhaustive clients lists and are willing to make these lists available to evaluators.
It is essential that respondents consider the counterfactual, i.e. they should be asked to estimate the difference between the current number of employees and the number that they would have had in the absence of receiving consultant services. As a proxy for welfare gains, any reported net increase in employment, particularly with respect to unskilled jobs, among SE clients could be taken as an indication of poverty reduction.
There are three important caveats in using this method to assess impacts. First, the method assumes that the SEs would not have received services from the consultants in the absence of the Enterprise Development Program. Second, the approach requires SEs to be able to determine the net effect of the intervention based solely on their own knowledge without
24 Longer time series, e.g., 1990-2003, are desirable but if they are not available, one data point both before and after would be sufficient.
Nexus Associates, Inc. Page 20
reference to explicit comparisons. Finally, the method does not account for potential displacement, i.e., employment in one enterprise may have resulted at the expense of another firm located in the same region resulting in no net gain in employment.
3.3.3 Data sources
Impact assessments require accurate and reliable data. At a minimum, it is necessary to obtain data on income and consumption for households before and after the SE intervention. Data for other control variables will also be needed depending on the precise model specification.
In planning evaluations of particular programs, evaluators will need to identify potential data sources. It may be possible to use existing household surveys to evaluate the poverty impact of specific programs. More and more countries have undertaken household surveys, often in conjunction with the World Bank.25 While various household surveys have been conducted over the years, the most comprehensive group of surveys have been conducted in the last 20 years as part of the World Bank Living Standards Measurement Study (LSMS).26
However, while the LSMS and other existing surveys represent a significant source of household information, they may not be sufficient for the evaluation of particular programs given their coverage, timing and content. First, the sampling strategies employed in particular survey may preclude regional studies. Moreover, surveys are not always conducted on a regular schedule. As a result, household survey data may not be available for the regions in question for the year(s) needed for the analysis. In addition, the content of surveys may vary from year to year, which may rule out longitudinal analysis. Finally, evaluators may find it difficult to access data given government policies and costs.
Given these issues, it may be necessary to conduct an independent household survey to obtain data needed for the evaluation (for example, for a more recent year than otherwise available). If this is the case, it is important that the evaluator use the same sampling method, same protocol for survey administration, and the same questions for the areas in which comparison data are needed. The same would be true if an evaluator were to conduct a first survey in a country – questionnaires and sampling strategies used in similar areas would be useful to follow. In this regard, obtaining the survey questionnaires used in prior household surveys, as well as details about the survey sampling and administration should not be difficult – basic information documents, including sampling strategies, questionnaires, and coding procedures, in addition to the actual survey data, are available for most surveys conducted as part of or in accordance with the LSMS, as are instructions for how to use the data.27 Therefore, an evaluator could potentially conduct a follow-up household survey according to the same procedures to obtain a recent dataset for comparison, or conduct an entirely new survey in the same manner. Of course, issues of time and cost would need to be considered.
25 A list of household surveys that have been conducted in developing countries has been compiled by the World Bank. It is available at the following website: http://wbln0018.worldbank.org/dg/povertys.nsf. 26 The LSMS was established by the World Bank in 1980 with the aim of improving the quality and quantity of household survey data collected in developing countries. Surveys conducted under the Living Standards Measurement Study (LSMS) constitute a significant source of household survey data, providing data on multiple aspects of household welfare and behavior, including consumption, income, savings, employment, health, education, fertility, nutrition, housing, and migration. 27 See Grosh (1996 and 2000).
Nexus Associates, Inc. Page 21
4 Recommendations
4.1 Specify the target population with explicit reference to the poor.
Before launching an evaluation of the impact of SE initiatives on the poor, it is imperative that donors define the target population as precisely as possible. This should include the relevant poverty line as well as any other salient characteristics of intended beneficiaries such as geographic location, ethnicity, and gender. Donor should also note whether programs are intended to lift individuals out of poverty entirely or reduce the depth of poverty experienced by the poor in the target population.
4.2 Specify how the poor will be affected, particularly in cases where the poor are not direct program beneficiaries
The specific mechanism for raising household income among the targeted population should be made clear. This should begin with an explicit statement about whether the poor are intended as direct beneficiaries of the SE initiatives or are expected to benefit through various indirect channels. In the latter case, donor agencies should ensure that the causal mechanisms are explained in project documents.
4.3 Select regions for programs in an explicit manner.
It would be preferable for donors to begin new initiatives in selected regions of countries, rather than launch full-coverage programs right from the outset. On the one hand, this would enable programs to gain useful experience before committing resources to any expansion. In addition, this would provide opportunities for more rigorous evaluation by enabling comparisons in poverty rates between participating regions and those regions of the country where the program is not yet operational. The selection of eligible regions in which to focus initial efforts should be based on explicit scores or done through a random process. The latter would be preferable, providing the best opportunity for unbiased estimates of program impacts.
4.4 Undertake evaluations of poverty impacts only if the scale of programs warrants it.
It does not make sense to attempt to assess the impact of SE initiatives on the poor in particular regions unless the program is of sufficient scale to lead donors to believe that there may be an effect size that has both policy and statistical significance. On the one hand, donors need to think about whether programs are likely to generate impacts of sufficient magnitude to be considered a success, i.e., results in an acceptable level of poverty reduction among the target population. The effect of programs on the poor, particularly when they are not direct beneficiaries of program, may be relatively small compared to the forces affecting growth and income distribution in particular economies. A secondary question is whether this effect can be detected given the size and variance of the sample used in household surveys.
Nexus Associates, Inc. Page 22
4.5 Focus on assessing the impact of programs on participating small enterprises.
Claims that BDS programs have an impact on poverty would be rendered more credible if the impact of the programs on participating small enterprises were demonstrated clearly. With this in mind, greater attention should be placed on conducting rigorous evaluations of programs in terms of their impact on firm-level performance using quasi-experimental designs. This would require the development of good data based on longitudinal surveys.
Nexus Associates, Inc. Page 23
5 Bibliography
Aghion, Philippe & Beatriz Armendáriz de Aghion, “Poverty and Development: A New Growth
Perspective,” August 20, 2002. Angrist, J.D., "Grouped-data estimation and testing in simple labor-supply models," Journal of
Econometrics, 1991, volume 47, pp. 243-266. Baker, Judy L., Evaluating the Impact of Development Projects on Poverty: A Handbook for
Practitioners, The World Bank, Washington, D.C., 2000. Berk, Richard A., and David Rauma, “Capitalizing on Nonrandom Assignment to Treatments: A
Regression-Discontinuity Evaluation of a Crime-Control Program,” Journal of the American Statistical Association, March 1983, volume 78, number 381, Applications Section, pp. 21-27.
Bryson, Alex, Richard Dorsett and Susan Purdon, “The Use of Propensity Score Matching in the
Evaluation of Active Labour Market Policies,” Policy Studies Institute and National Centre for Social Research, London, 2002.
Committee of Donor Agencies for Small Enterprise Development, Business Development
Services for Small Enterprises: Guiding Principles for Donor Intervention (2001 Edition), February 2001.
Cook, Thomas D., and Donald T. Campbell, Quasi-Experimentation: Design & Analysis Issues
for Field Settings. Boston: Houghton Mifflin Company, 1979 Coudouel, Aline, Jesko S. Hentschel, and Quentin T. Wodon, “Chapter 1. Poverty Measurement
and Analysis,” in The World Bank Group (eds.) Poverty Reduction Strategy Sourcebook: Volume 1 – Core Techniques and Cross-Cutting Issues, http://www.worldbank.org/poverty/strategies/sourctoc.htm.
Creevey, Lucy, “Draft Research Design: Uganda,” Weidemann Associates, Inc., Arlington
(Submitted to USAID Office of Microenterprise Development). Dollar, David, and Art Kraay, “Growth Is Good for the Poor,” The World Bank: Development
Research Group, Washington, D.C., March 2000. Grosh, M. & Glewwe, P. A Guide to Living Standards Surveys and Their Data Sets. Living Standards Measurement Study Working Paper #120, The World Bank, 1996 Grosh, M. & Glewwe, P. Designing Household Survey Questionnaires for Developing Countries: Lessons from 15 Years of the Living Standards Measurement Study. The World Bank, 2000
Nexus Associates, Inc. Page 24
Gruber, J., "The Efficiency of a Group-Specific Mandated Benefit: Evidence from Health
Insurance Benefits for Maternity," Working Paper no. 4157, National Bureau of Economic Research, Cambridge, 1992.
International Finance Corporation, Paths Out of Poverty: The Role of Private Enterprise in
Developing Countries, Washington, D.C., 2000. Jaffe, Adam B., “Building Programme Evaluation into the Design of Public Research-Support
Programmes,” Oxford Review of Economic Policy, 2000, volume 18, number 1, pp. 22-34.
Lustig, Nora, Omar Arias, and Jamele Rigolini, “Poverty Reduction and Economic Growth: A
Two-Way Causality,” Inter-American Development Bank (Sustainable Development Department Technical Papers Series), Washington, D.C., March 2002.
Oldsman, Eric, and Kris Hallberg, “Framework for Evaluating the Impact of Small Enterprise
Initiatives,” Committee of Donor Agencies for Small Enterprise Development, April 2002.
Roemer, Michael and Mary Kay Gugerty, “Does Economic Growth Reduce Poverty?” Harvard
Institute for International Development: Consulting Assistance on Economic Reform II, Cambridge, June 1997.
Snodgrass, Don and Jennefer Sebstad, “Recommendations for Performance Monitoring and
Impact Assessment for USAID/Kenya Sub-Sector Development Programs,” Action for Enterprise, Arlington, April 2003 (Submitted to USAID/Kenya).
United Nations, United Nations Millennium Declaration, Resolution adopted by the General
Assembly, Fifty-fifth session, Agenda item 60 (b), New York, September 18, 2000 (A/RES/55/2).
------, “United Nations Development Goals (MDG), http://www.un.org/milleniumgoals/. United States Agency for International Development, A Qualitative Review of Poverty Reduction
and Alleviation Program Funded by The U.S. Agency for International Development in Peru, January 2003.
The World Bank, A User’s Guide to Poverty and Social Impact Analysis, Poverty Reduction
Group (PRMPR) and Social Development Department (SDV), Washington, D.C., 2003.
Nexus Associates, Inc. Page 25