Embed Size (px)
Citation preview
1
Assessing the Impact of Removing Regulatory Barriers on Next Generation Wireless and Wireline Broadband Infrastructure Investment
June 2017
Hal Singer, Economists Incorporated
Ed Naef, CMA Strategy Consulting
Alex King, CMA Strategy Consulting
FINAL REPORT
Dr. Singer is a Principal at Economists Incorporated, an Adjunct Professor at Georgetown’s
McDonough School of Business, and a Senior Fellow at George Washington’s Institute for Public
Policy. Ed Naef is a Partner at CMA Strategy Consulting, and has worked extensively evaluating
broadband and fiber network deployment economics. Alex King is a Manager at CMA Strategy
Consulting. The views expressed here are those of the authors and not those of their affiliated
academic institutions. The authors would like to thank Corning Inc. for the funding to support
this study.
2
Executive Summary
This study evaluates the estimated impact of the FCC’s recent efforts to remove barriers to
investment into next-generation wireless and wireline broadband networks, and thereby to
accelerate the transition from legacy copper networks to next-generation services.
We estimate that these proposed changes could have a significant impact not only on new
wireless and wireline broadband infrastructure investment, but could also positively impact job
creation, economic output and consumer welfare. Our models forecast that with these new
rules in place, up to an incremental 26.7 million premises would become economical to serve
with next generation networks, driving up to $45.3 billion in capital investment. This investment
would be made by incumbent service providers across the country and is expected to take
place over at least five years. These incremental homes and small businesses that become
economically viable for network deployment exist primarily in suburban and rural areas and
include areas in all 50 states. The incremental investment unlocked by the proposed measures
could generate up to about 358,000 jobs, support up to $28.4 billion per year in incremental
economic output over the deployment period and drive consumer welfare improvements of up
to $2.7 billion. We detail the assumptions, methodology and calculations used to derive these
figures in this document. As we will discuss, there are a number of reasons why these estimates
may be conservative.
The communications industry is entering its next phase of growth, and all communications
service providers are currently assessing investment decisions for the deployment of the next
generation of networks. Increasingly, these investments will take the form of new fiber-to-the-
premises (“FTTP”) and fifth-generation (“5G”) wireless network investments. In this paper, we
evaluate the impact of the FCC’s proposed rule changes on the investment decisions of
Incumbent Local Exchange Companies (“ILECs”) regarding both next-generation wireless and
wireline facilities. We evaluate in detail the business case for deploying these network facilities
by modeling all of the financial inputs and costs in the same way that a service provider would
when making these business decisions. We evaluate this business case for a specific set of
geographic areas in the country that are representative of the country as a whole, by
performing actual GIS analysis to estimate the costs to deploy both 5G and FTTP network
facilities in those areas based on street miles and the distribution of households and businesses
in those areas. We also assess only the incremental revenue potential of the new networks
deployed in these specific areas and any associated changes to operating costs. This allows us
to estimate the business case for deploying new networks in neighborhoods around the
country for ILECs as a group within their own service territory.
3
In two recent Notices of Proposed Rulemakings (“NPRMs”), the FCC has outlined a range of
potential actions to make it faster and less costly to deploy next-generation networks.1 It is
expected that these proposals will lower pole-attachment costs, reduce the time and cost of
make-ready, reduce barriers to copper retirement, accelerate legacy time-division multiplexing
(“TDM”) product discontinuance, and reduce barriers to locating and deploying wireless
infrastructure.
The reduction in costs anticipated in these NPRMs will help these network deployment business
cases by reducing the cost of deployment and lowering operating costs for ILECs relative to
keeping copper networks in place. This allows many marginal areas that could not previously
pass the business case for next-generation wireless and wireline broadband deployment to
become economically viable. The impact of this can be measured as the difference between
how many households and small-to-medium businesses (“SMBs”) would be economically
profitable to serve under the current rules and how many additional customers could be
profitably served with the lower costs and faster deployment times enabled by some of the
proposals in these two NPRMs. Because we also estimate in these business cases the
differences in investment by ILECs into capital expenditures, operating expenses and revenues,
we can also assess how much additional capital will be invested given the proposed rule
changes. Using broadband-specific multipliers, we then determine the impact of this increased
investment on jobs and, ultimately, economic output. Finally, we estimate the associated
consumer benefits flowing from enhanced broadband competition in areas that are currently
have more limited competition.
It should be noted, that where the NPRM makes explicit allowances for certain modeling
options, we have chosen the figures that we estimate have the most significant positive impact
on the business case. However, in many ways, we feel that our analysis is conservative in its
assessment of the impact. For instance, we did not model the potential impacts of a lower
WACC that maybe derived from decreased risk in deployment models. We also did not model
any potential cost savings from removing entire duplicative OSS/BSS systems that are used to
support the legacy copper infrastructure. In the 5G scenarios, we only modeled the fixed
wireless and M2M benefits, but did not model the benefits for non-M2M mobile applications.
Lastly, we also did not model multiple competitors each deploying FTTP or 5G in a given area –
we only modeled the ILECs deploying facilities collectively in their own service territories
The key findings of this study are as follows:
1 “Accelerating Wireline Broadband Deployment by removing Barriers to Infrastructure Investment”, WC Docket No. 17-84 and “Wireless Infrastructure NPRM”, WC Dockets 17-79 and 15-180.
4
• Consumer fixed-internet usage is forecasted to grow dramatically at a rate of 23% per
year for the next five years. At this time, the average household will consume nearly
400 gigabytes of data per month over their fixed connection.
• Broadband adoption has slowed in recent years; however, it is estimated to have
grown to around 73% of the population today from 68% five years ago. Currently,
there are approximately 19M homes with only one provider of wireline broadband at
speeds greater than 3 Mbps, and 46M homes with only one provider greater than 25
Mbps.
• While 5G is still being standardized and deployment models are still taking shape, we
estimate that these networks will be much denser, with wireless sites much closer to
homes and SMBs than the networks of today. This will unlock new broadband, M2M
and smart city use cases and new incremental revenues streams
• The NPRM may improve network deployment economics in four ways: (1) speeding
the time to deploy both wireless and wireline next generation broadband networks;
(2) lowering the costs of make-ready substantially; (3) reducing the operating costs of
pole attachments; and lastly (4) removing many additional costs of operating a
duplicative copper networks
• We ran four scenarios to capture the before and after effects of the proposed
rulemaking: “FTTP Base”, “FTTP NPRM”, “5G Base”, and “5G NRPM”. The FTTP Base
scenario uses the current regulatory regime to estimate the likely capital costs and
potential revenue that could be derived from an FTTP rollout. The FTTP NPRM
scenario then tests the impact to the FTTP Base scenario using new assumptions that
would be enacted by the FCC’s proposed rules. Understanding that 5G has not been
yet completely defined, the 5G Base scenario uses the current regulatory rules to
determine what a reasonable 5G deployment might look like given current industry
consensus, and lastly, the 5G NPRM scenario compares the business case with the rule
changes to the 5G Base scenario. The FTTP and 5G scenarios should be treated as
alternatives scenarios, despite the fact that many areas may receive investment in
both technologies, and our results across these two scenarios should be treated as a
range of estimated outcomes depending on industry evolution
o Under the FTTP Base Scenario, 74.3M premises or roughly 53% of the housing
units and small-to-medium businesses (SMBs) are economically profitable to
serve with fiber. These include a wide variety of areas, but are predominantly
found in metro areas.
5
o Under the FTTP NPRM Scenario, an incremental 26.7M premises become
profitable to serve with fiber. The incremental capex required to reach these
26.7M premises would be $45.3B, both in terms of build capex and
connection costs. This amount would, in practice, be invested over time and
would represent the collective impact of investment by ILECs within their own
service territory
o A significant amount of the incremental benefit in the FTTP NPRM scenario
would be in less dense areas under the NPRM rules. The morphology
distribution of premises in these incremental regions, which become
profitable to serve once barriers are removed, are 52% rural and 43%
suburban.
o New passings under the FTTP NPRM scenario are also geographically diverse,
representing all 50 states. A number of cities such as Birmingham (AL), Dover
(NH), and Santa Clara Valley (CA) all experience a significant increase in the
percentage of economically viable areas under the rule changes
o 5G is estimated to economically serve 65% of premises, or 91.5M housing
units and SMBs under current rules. The NPRM would create incentives for an
incremental 14.9M premises to be covered, generating nearly $23.9B of
incremental capital to do so.
o These incremental premises covered under the 5G NPRM scenario are in
significantly less dense areas – roughly two thirds of them are in rural areas,
and all 50 states would have areas that are positively impacted.
• The incremental capex from the FTTP NPRM scenario would drive 178.9K directly
related jobs, another 178.9K “spillover” jobs, and would drive incremental economic
output of nearly $28.4B per year over a five-year period.
• The incremental capex from the alternative 5G NPRM scenario would drive an
incremental 70.1k directly related jobs, another 70.1k of “spillover” jobs, and would
drive an incremental economic output of $13.7B per year over a five-year period.
• The incremental FTTP passings will also drive a significant amount of consumer
welfare from the increase in broadband competition. We estimate that the annual
total welfare gains generated by this incremental investment will range from $150.8M
to $2.7B per year, depending on the magnitude of the price effect.
6
Table of Contents Introduction and Key Assumptions .......................................................................................................... 7
Current State of Broadband Access, Competition & FTTP......................................................................... 9
Broadband Access & Usage .................................................................................................................. 9
Competition ...................................................................................................................................... 10
FTTP Access ....................................................................................................................................... 11
Economics of FTTP Deployments ....................................................................................................... 14
The Future of 5G and Potential Impacts ................................................................................................. 14
Model Methodology & Sample Selection ............................................................................................... 16
Network Operator Perspective ...................................................................................................... 16
Business Model Creation ............................................................................................................... 16
Scenario Selection ......................................................................................................................... 17
Sample Selection ........................................................................................................................... 17
Network Build Out ......................................................................................................................... 20
Model Assumptions ............................................................................................................................... 21
Base Model – Capex Assumptions .................................................................................................. 21
Base Model – Revenue Assumptions .............................................................................................. 25
NPRM Assumptions ....................................................................................................................... 27
Model Results ....................................................................................................................................... 32
FTTP – Model Results ..................................................................................................................... 32
5G – Model Results ........................................................................................................................ 34
Economic Impact & Analysis: Translating the Investment Gain into Employment and Output Effects ..... 35
Job Impact ......................................................................................................................................... 36
Total Multiplier Effects................................................................................................................... 36
Spillover Effects ............................................................................................................................. 38
Economic Output ............................................................................................................................... 41
Consumer Welfare Effect ................................................................................................................... 42
Conclusion ............................................................................................................................................. 45
7
Introduction and Key Assumptions The Federal Communications Commission (FCC) is exploring a multi-pronged regulatory agenda
that seeks to accelerate wireline broadband deployment by removing barriers to infrastructure
investment. The agency seeks to do this by: (1) improving the speed at which infrastructure can
be permitted, engineered, and deployed; (2) lowering the costs of deployment through
lowering make ready and infrastructure placement; (3) lowering the operating costs for
network deployment; and lastly, (4) accelerating the benefits from the removal of operating a
legacy full-copper network and legacy TDM services alongside a next-generation fiber network.
The construct of our analysis is to develop a detailed business case from the point of view of an
ILEC evaluating the viability of an FTTP network expansion and 5G deployment in its traditional
wireline service territory. Our business case considers the incremental benefits of network
deployment, meaning that we only consider the additional revenues and cost savings accruing
to the new network facilities, excluding revenues from customers that are already using legacy
services (or that would be served in the absence of the proposed rule changes).
By modeling the behavior of ILECs within their individual service territories and looking at the
collective impact of their investments, we are able to capture a picture of national investment
not specific to the operations of any one company; instead, we capture the effects on the
operations of a generic nationwide ILEC.
While ILECs, wireless service providers, cable companies, municipal-fiber companies, and metro
fiber providers will all benefit from reducing barriers to fiber deployment, it would be very
complex to model the behavior of multiple providers simultaneously. By modeling the behavior
of ILECs alone and not the investments of all other service providers, we are capturing only a
fraction of the investment that will likely be unlocked by these rule changes. It is reasonable to
assume that multiple providers will deploy new facilities in each area, and that therefore the
investment impact that we forecast may in fact be augmented by the activities of multiple
companies and not just the collective actions of the ILECs. The number of companies that
deploy next-generation facilities depends on the eventual structure of the U.S. communications
industry several years out, and is therefore difficult to model.
In this paper, we assess the business case and deployment costs for both 5G and FTTP. While
FTTP economics and the various business cases are well understood from a number of
deployments around the country, 5G standards and business cases are still being defined. Thus,
our analysis of 5G depends on more assumptions than our assessment of FTTP. However, there
is consensus that these next-generation 5G networks will require much denser deployment of
next-generation wireless nodes, and that they will unlock new revenues from machine-to-
machine (“M2M”) use cases as well as address traditional fixed broadband customers. To

8
account for the time required to finalize standards and trial deployments, we choose 2020 as
the first year of our model for both FTTP and 5G. The benefits accruing to fiber deployment will
begin sooner than 2020, but we choose a single deployment year to be consistent across the
two cases.
In practice, 5G deployments will be an evolution, and some service providers may choose to
focus on enabling M2M and mobility use-cases rather than home and SMB fixed broadband
use-cases. We assume that in their legacy wireline regions, ILECs will build relatively dense 5G
networks capable of enabling the bandwidth required for full-home broadband usage, including
voice, video, and broadband services. We include revenues for these services in both the FTTP
and 5G business case analyses. 5G and FTTP may in many cases be deployed in parallel, with
FTTP as an extension to the dense wireless networks for customers requiring the fastest
connections. Because both our 5G and FTTP models assume building substantial new fiber in
the same geographic areas, it would be inappropriate to count the results of both cases
together as new investment enabled by rule changes. Instead, we treat the two cases as
alternative scenarios that represent a range of outcomes in terms of overall investment impact.
In considering the impact of potential rule changes, we developed our cost assumptions based
on potential options included in recent FCC proposals. We have based our assumptions
wherever possible on estimates of costs available in the public domain so they can be
independently verified. The actual cost savings accrued will vary from company to company,
and would be different for other types of service providers. There are a number of proposed
rule changes that accelerate the deployment of facilities and remove potential delays. We
generally aggregate the multiple beneficial impacts of these accelerating factors into a smaller
set of assumptions for the purposes of this analysis.
We run our business case analysis for a subset of geographic areas (called Census Block Groups)
that are representative of the country as a whole, including both rural and urban areas. We
then scale this analysis up to a national estimate by identifying similar areas across the country
and applying our results to those areas. This is less precise than performing a full national
estimate, but is still a quite granular analysis as we use several thousand of these block groups
in our analysis.
We develop our assumptions (both cost and demand) so that they vary according to different
geographic morphologies. Costs of deployment vary substantially across the country depending
on whether the areas are rural or urban, as well as the local mix of aerial, conduit, and
underground facilities. We capture differences in these assumptions across five unique
household density segments and apply those assumptions to each our areas individually. The
result is a granular analysis with both varying density and customer data across areas but also
different business-case assumptions.
9
To calculate the net effects of these rule changes, we assess which areas in the country did not
economically justify network deployment under the current set of regulations, and track which
become economically justified after lowering costs of deployment and accelerating the
business case. The investment associated with these marginal areas that “flip” from negative to
positive economic value drives our estimates of job creation, economic impact, and consumer
benefits. We assume these areas all represent net new investment, as they are marginal areas
that previously did not have a positive business case. While it is possible that ILECs will not
collectively invest where there is a now a positive business case, they should have an economic
incentive to do so, and therefore we capture that behavior in our estimates.
In the following sections we review our analysis, assumptions, and results in detail.
Current State of Broadband Access, Competition & FTTP Broadband access is a vital component of the modern economy both in terms of continued
productivity gains, but also in terms of the democratization of access to information and
education. To measure the health of this ecosystem, we can look at three components: (1) the
number and types of homes with access to broadband and their usage; (2) the number of
competitors providing service to those homes; and (3) the number of networks that are
providing a true broadband choice at reasonable bandwidths, such as FTTP.
Broadband Access & Usage
Data consumption has been growing at a historic rate over the past 10 years, and consumption
is only set to increase further with the proliferation of internet-enabled devices, new “over-the-
top” content consumption behaviors, and the need for employees to work anywhere, be it from
home or on the road.
Cisco estimates that in the United States, Consumer Fixed Internet Traffic will grow at an annual
rate of 23% until 2021, reaching over 48.7 exabytes of data per month, a 3x increase from 2016.
They further estimate that these residential customers will become an even more important
part of the mix of IP traffic, growing from 55% to 61% of all IP traffic by 2020.2 If these figures
are correct, the average broadband home will consume nearly 400 Gigabytes per month, a
remarkable amount of traffic.
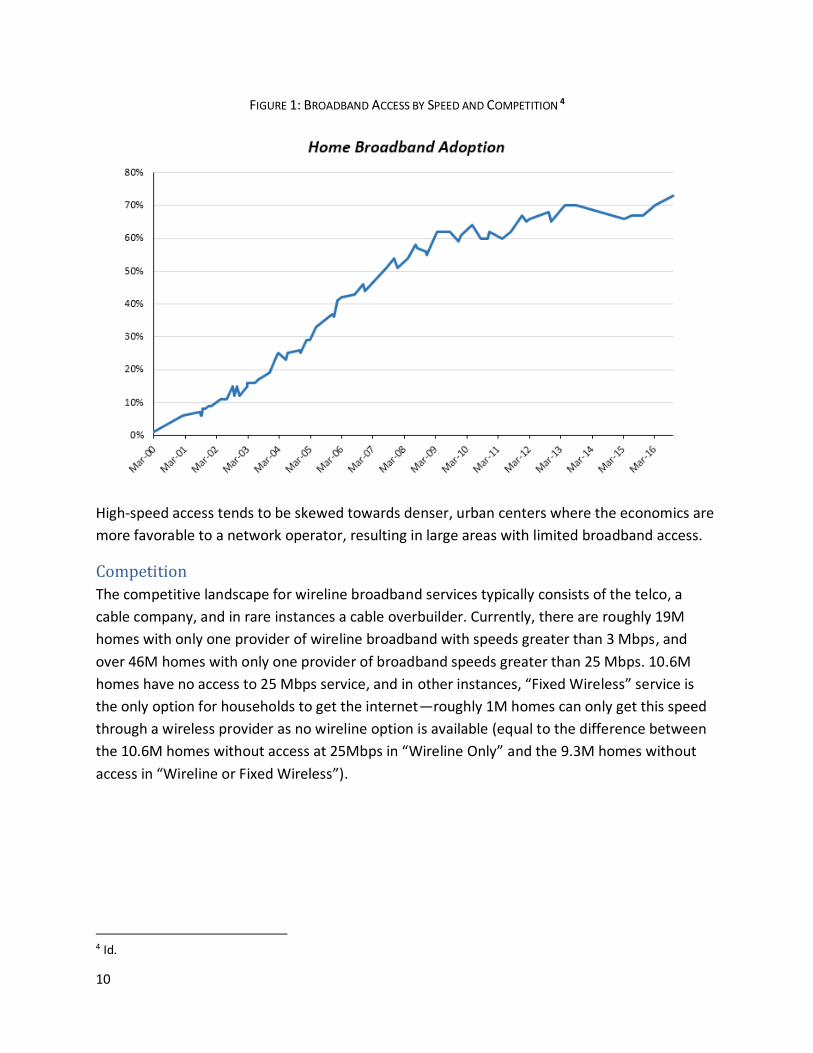
Yet broadband adoption has slowed slightly over the past several years, growing to around 73%
today from 68% in 2012.3
2 Report published by Cisco, “VNI Forecast Highlights Tool”, pulled as of June 13, 2017, available at: http://www.cisco.com/c/m/en_us/solutions/service-provider/vni-forecast-highlights.html. 3 Pew Internet, 2017, available at: http://www.pewinternet.org/fact-sheet/internet-broadband/
10
FIGURE 1: BROADBAND ACCESS BY SPEED AND COMPETITION 4
High-speed access tends to be skewed towards denser, urban centers where the economics are
more favorable to a network operator, resulting in large areas with limited broadband access.
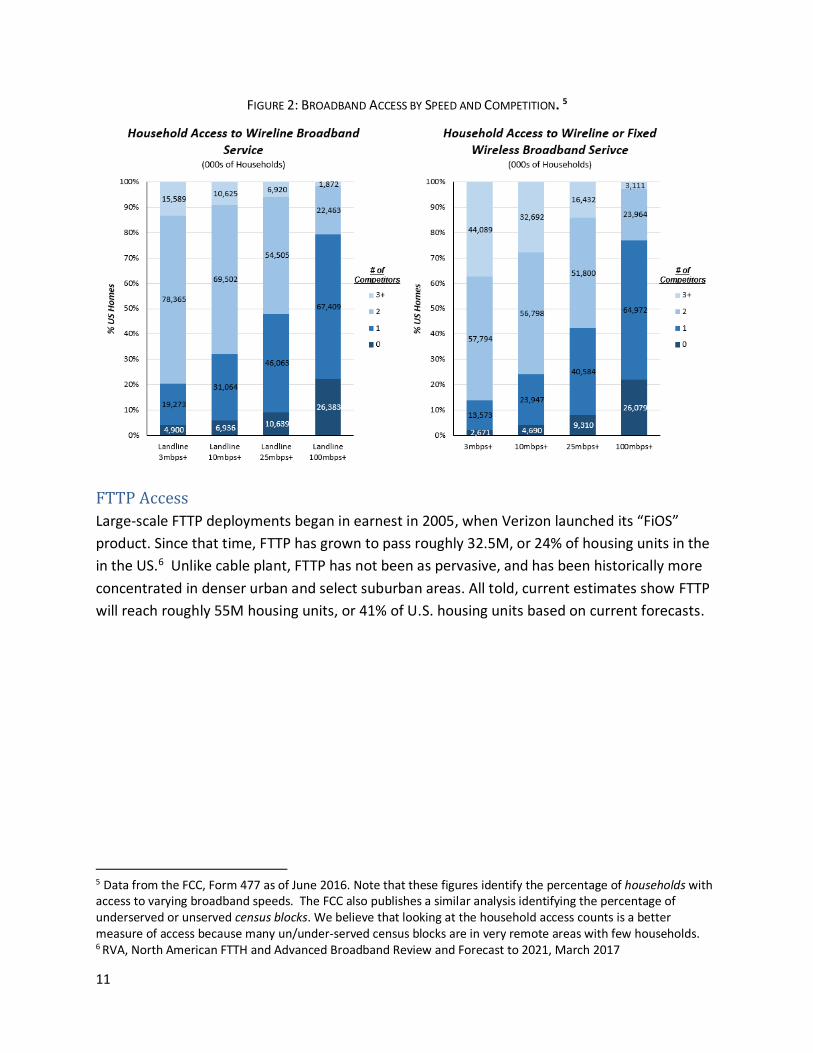
Competition
The competitive landscape for wireline broadband services typically consists of the telco, a
cable company, and in rare instances a cable overbuilder. Currently, there are roughly 19M
homes with only one provider of wireline broadband with speeds greater than 3 Mbps, and
over 46M homes with only one provider of broadband speeds greater than 25 Mbps. 10.6M
homes have no access to 25 Mbps service, and in other instances, “Fixed Wireless” service is
the only option for households to get the internet—roughly 1M homes can only get this speed
through a wireless provider as no wireline option is available (equal to the difference between
the 10.6M homes without access at 25Mbps in “Wireline Only” and the 9.3M homes without
access in “Wireline or Fixed Wireless”).
4 Id.
11
FIGURE 2: BROADBAND ACCESS BY SPEED AND COMPETITION. 5
FTTP Access
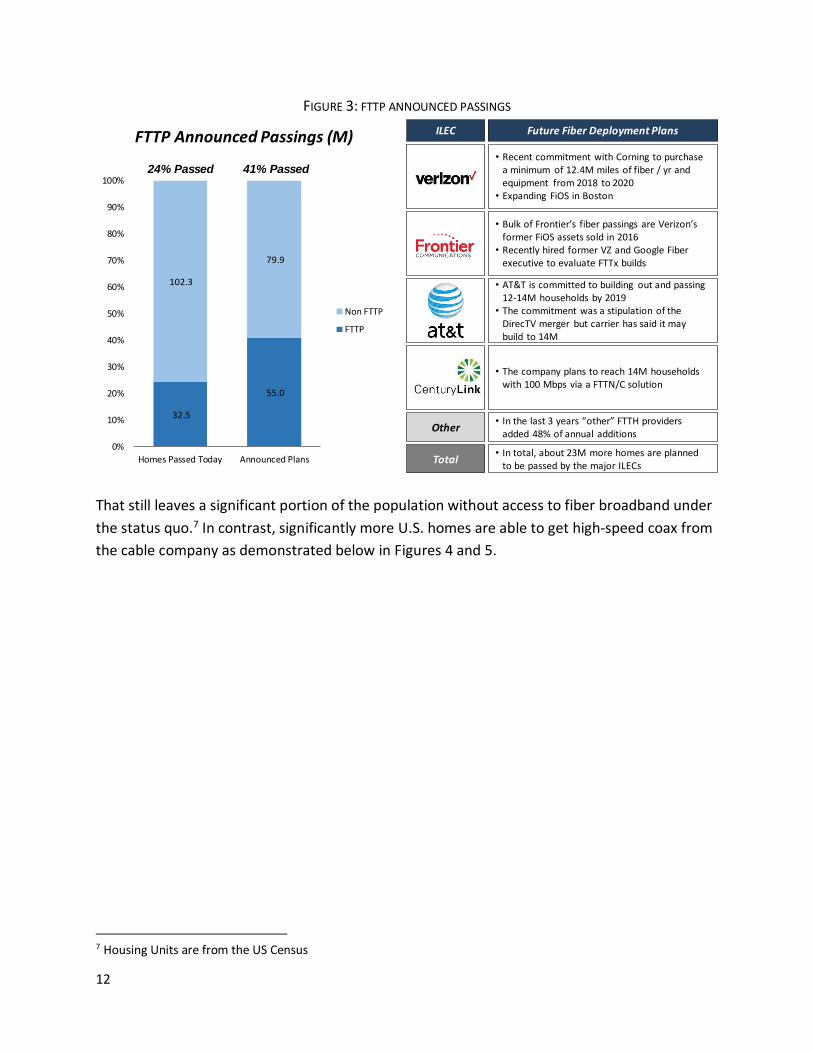
Large-scale FTTP deployments began in earnest in 2005, when Verizon launched its “FiOS”
product. Since that time, FTTP has grown to pass roughly 32.5M, or 24% of housing units in the
in the US.6 Unlike cable plant, FTTP has not been as pervasive, and has been historically more
concentrated in denser urban and select suburban areas. All told, current estimates show FTTP
will reach roughly 55M housing units, or 41% of U.S. housing units based on current forecasts.
5 Data from the FCC, Form 477 as of June 2016. Note that these figures identify the percentage of households with access to varying broadband speeds. The FCC also publishes a similar analysis identifying the percentage of underserved or unserved census blocks. We believe that looking at the household access counts is a better measure of access because many un/under-served census blocks are in very remote areas with few households. 6 RVA, North American FTTH and Advanced Broadband Review and Forecast to 2021, March 2017
12
FIGURE 3: FTTP ANNOUNCED PASSINGS
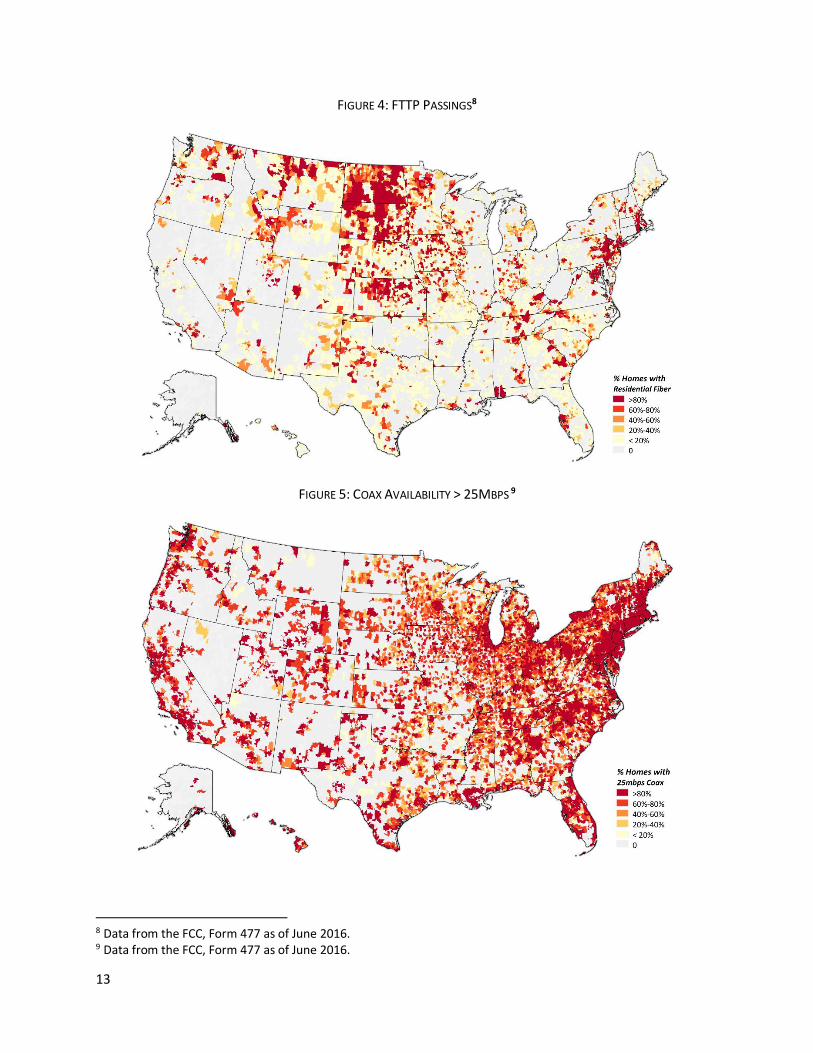
That still leaves a significant portion of the population without access to fiber broadband under
the status quo.7 In contrast, significantly more U.S. homes are able to get high-speed coax from
the cable company as demonstrated below in Figures 4 and 5.
7 Housing Units are from the US Census
32.5
55.0
102.3
79.9
0%
10%
20%
30%
40%
50%
60%
70%
80%
90%
100%
Homes Passed Today Announced Plans
FTTP Announced Passings (M)
Non FTTP
FTTP
ILEC
Other
Total
• Recent commitment with Corning to purchase a minimum of 12.4M miles of fiber / yr and equipment from 2018 to 2020
• Expanding FiOS in Boston
• Bulk of Frontier’s fiber passings are Verizon’s former FiOS assets sold in 2016
• Recently hired former VZ and Google Fiber executive to evaluate FTTx builds
• AT&T is committed to building out and passing 12-14M households by 2019
• The commitment was a stipulation of the DirecTV merger but carrier has said it may build to 14M
• The company plans to reach 14M households with 100 Mbps via a FTTN/C solution
• In the last 3 years “other” FTTH providers added 48% of annual additions
Future Fiber Deployment Plans
24% Passed 41% Passed
• In total, about 23M more homes are planned to be passed by the major ILECs
13
FIGURE 4: FTTP PASSINGS8
FIGURE 5: COAX AVAILABILITY > 25MBPS 9
8 Data from the FCC, Form 477 as of June 2016. 9 Data from the FCC, Form 477 as of June 2016.
14
Economics of FTTP Deployments Much of the reason why telcos have not deployed FTTP nationwide is due to the substantially higher
expense required to deploy fiber networks in more rural areas when compared with denser locales.
Homes are spaced at a significantly further distance from one another, such that the same materials,
labor cost, network-equipment costs, and central office costs are amortized across a much smaller base
of homes. To illustrate, consider a neighborhood of 100 homes requiring a network of 1,000 feet. If the
average cost of labor and materials for the neighborhood was $20/foot, then this network would cost
$20,000 to build, or $200 per home passed. Now, consider the same neighborhood with 10 homes, but
still has the same network requirements to reach them all—the cost per home passed increases to
$2,000, a decidedly less profitable and economically feasible arrangement. Unless the cost structure or
the revenue potential of an area changes, then all else equal, a more rural area will not be built with
fiber.
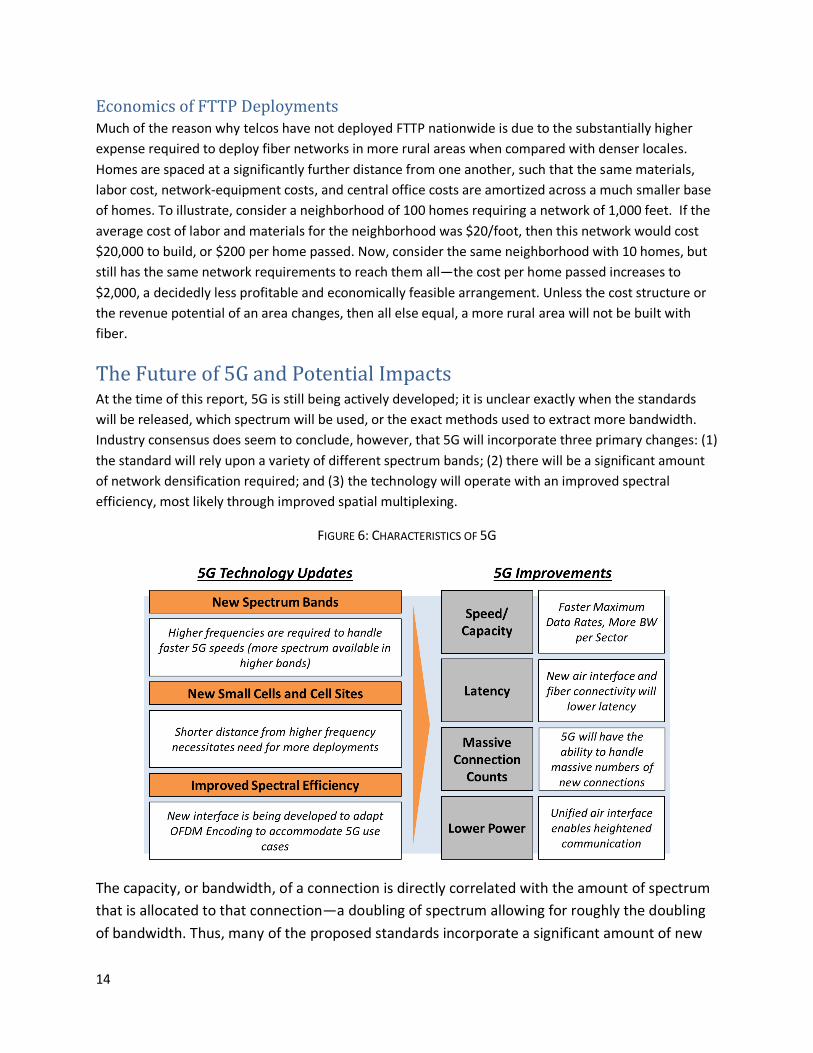
The Future of 5G and Potential Impacts At the time of this report, 5G is still being actively developed; it is unclear exactly when the standards
will be released, which spectrum will be used, or the exact methods used to extract more bandwidth.
Industry consensus does seem to conclude, however, that 5G will incorporate three primary changes: (1)
the standard will rely upon a variety of different spectrum bands; (2) there will be a significant amount
of network densification required; and (3) the technology will operate with an improved spectral
efficiency, most likely through improved spatial multiplexing.
FIGURE 6: CHARACTERISTICS OF 5G
The capacity, or bandwidth, of a connection is directly correlated with the amount of spectrum
that is allocated to that connection—a doubling of spectrum allowing for roughly the doubling
of bandwidth. Thus, many of the proposed standards incorporate a significant amount of new

15
mobile spectrum for 5G, both in the more limited 3Ghz range as well as the high-frequency
bands from 6Ghz and above.10 This high frequency spectrum, while particularly useful for
serving capacity, is not as well suited for providing consistent and durable coverage. As such, 5G
will likely also include a base overlay of lower band spectrum to provide the necessary
coverage, while the higher band spectrum will provide capacity fill-in.
The use of higher frequency spectrum will also require significant densification of cell sites
given the range-limited propagation characteristics of that spectrum in typical environments
when compared with lower-frequency spectrum.11 While we are still very early in the process,
this densification will likely take the form of small cells, or smaller radio nodes, which are
designed to be strategically placed in areas that the traditional macro network is unable to
serve adequately.
Lastly, 5G will likely undergo a significant improvement in spectral efficiency over today’s 4G
technology. Many speculate that this may be achieved through a new form of Spatial
Multiplexing known as Massive MIMO, a technological continuation of what is currently
enabled by 4G.
When finally implemented and deployed, 5G will drive a significant amount of bandwidth
capacity growth, not only as a fixed-broadband replacement, but also from lower-latency
applications and low-powered sensors to be deployed everywhere, enabling a large number of
“Internet of Things” devices. 5G may very well be the backbone of autonomous vehicles, smart
grids, smart homes, augmented reality, industrial monitoring, telematics, and smart cities.
The advent of smart cities, for instance, has the potential to dramatically change the way
governments operate. Law enforcement and security, for instance, may be enhanced by
enabling police use of automated video surveillance, which monitors various areas on-demand
and records activity back to the cloud. It would enable intelligent lighting to deploy only at
certain times and in certain locations, promoting not only public safety, but also energy savings.
Cities could more intelligently route and monitor traffic, monitor waste management and sewer
systems, and measure water supplies. There are any number of potential uses, including many
that have yet to even be thought of, let alone considered.
As of now, this 5G evolution, which has the potential to enable millions of new connected
devices across a wide variety of use cases, is expected by many to see initial commercial
deployments beginning in 2020 followed by relatively rapid adoption. For instance, Cisco has
10 Technological Advisory Council (TAC) Future Game Changing Technologies (FGCT) Working Group Report on 5G Adoption, 2016, available at: https://www.fcc.gov/oet/tac/2016 11 Technological Advisory Council (TAC) Future Game Changing Technologies (FGCT) Working Group Report on 5G Adoption, 2016, available at: https://www.fcc.gov/oet/tac/2016
16
forecasted an initial 2.3M 5G devices globally in 2020, growing to 25M in 2021, about 2% of
which will be M2M devices. The United States is expected to be a leader in this area,
accounting for over 40% of 2021 global 5G devices.12 13
Model Methodology & Sample Selection To test the impact of potential rule changes, we first built models for FTTP and 5G, reflecting
the current regulatory regime.
Network Operator Perspective
We begin by establishing the construct of a single, uniform “generic ILEC,” which assists in
excluding the effects of any possible idiosyncratic behaviors of one particular ILEC from
entering our analysis (for example, Verizon, AT&T, or CenturyLink). For simplicity, we assume
that our “generic ILEC” deploys FTTP in its own legacy service area. While other competitors
may offer a similar service via DOCSIS, for the purpose of our analysis we assume there is no
competitive overbuilding of FTTP. Conversely, this means that our analysis ignores the potential
additional benefits that may come from the increased capex spend of these other market
entrants. As a real-world example, we have modeled a player like Verizon deploying FTTP in
Boston (where it is the ILEC), but have assumed that AT&T does not overbuild. In San Francisco,
our model assumes that a player like AT&T would deploy FTTP, but CenturyLink would not
overbuild. Particularly when viewed through the lens of a 5G world, where carriers operate
nationwide, this is likely a very conservative view.
Business Model Creation
The model operates as a straightforward localized business case, whereby a network operator,
in our case the “generic ILEC,” expends capital to deploy FTTP or 5G and then attempts to
monetize that asset by convincing its current customers to switch from a legacy service, or by
winning customers from other competitors in the area, whether they be churners or new
entrants. To prevent existing ILEC revenue streams from being attributed to the new
infrastructure build, we consider only incremental revenues gained by the fiber in comparison
to a “but-for” scenario, using the expected revenues the existing copper plant could generate in
the absence of any fiber. These new FTTP or 5G services also have incremental costs associated
with them beyond what is required to run the copper network. These too are “net-out,” leaving
us with a stream of net cash flows, which are discounted to present value to assess whether
incremental new earnings inflows can justify the upfront capex outflows of deploying fiber.
12 Cisco Visual Networking Index; Global Mobile Data Traffic Forecast Update, 2016-2021 Whitepaper, 2017, available at: http://www.cisco.com/c/en/us/solutions/collateral/service-provider/visual-networking-index-vni/mobile-white-paper-c11-520862.html#DefiningCellNetworkAdvances 13 Cisco VNI Mobile Forecast Highlights 2016-2021, 2017, available at: http://www.cisco.com/assets/sol/sp/vni/forecast_highlights_mobile/
17
Scenario Selection
Employing varying assumptions, this business model is utilized to calculate discounted cash
flows under four scenarios, each constructed around different sets of FCC rules and the
technology deployed: first considering today’s prevailing FCC rules and regulations versus
potential NPRM changes and again considering the use of either FTTP or 5G. Thus, we examine
(1) the FTTP Base Case Scenario assuming prevailing FCC rules, (2) the FTTP NPRM Case
Scenario assuming that new FCC regulations proposed in the NPRM are enacted, (3) the 5G
Base Case Scenario assuming prevailing FCC rules, and lastly (4) the 5G NPRM Scenario
assuming new FCC regulations from the NRPM are enacted.
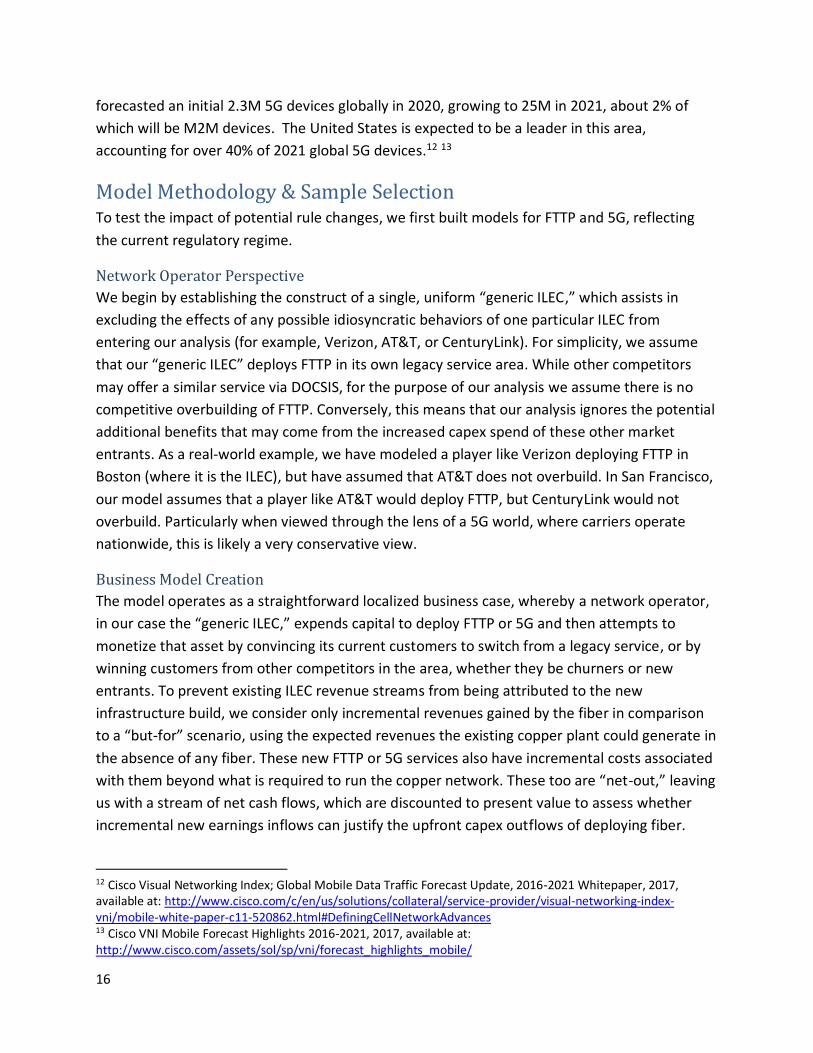
Sample Selection
To calculate the incremental cash flows for the nation as a whole, we modeled a set of sample
geographies that represent a reasonable proxy for the United States, then extrapolated the
sample results to the country as a whole. We chose 20 counties around the United States,
comprised of 5,158 Census Block Groups (CBGs). These census block groups have an average of
roughly 624 Housing Units and 38 small-to-medium businesses (SMBs) per geographic unit, and
as such, are roughly 2.4% of the total United States.
FIGURE 7: COUNTIES IN SAMPLE SELECTION
18
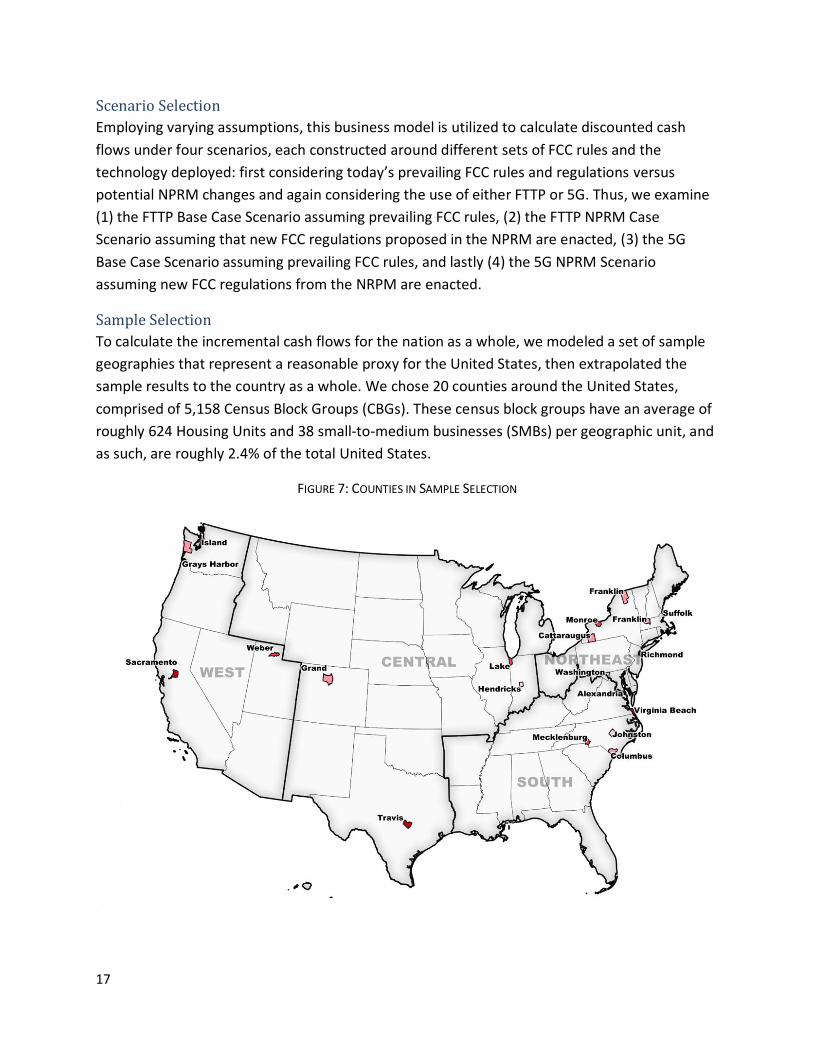
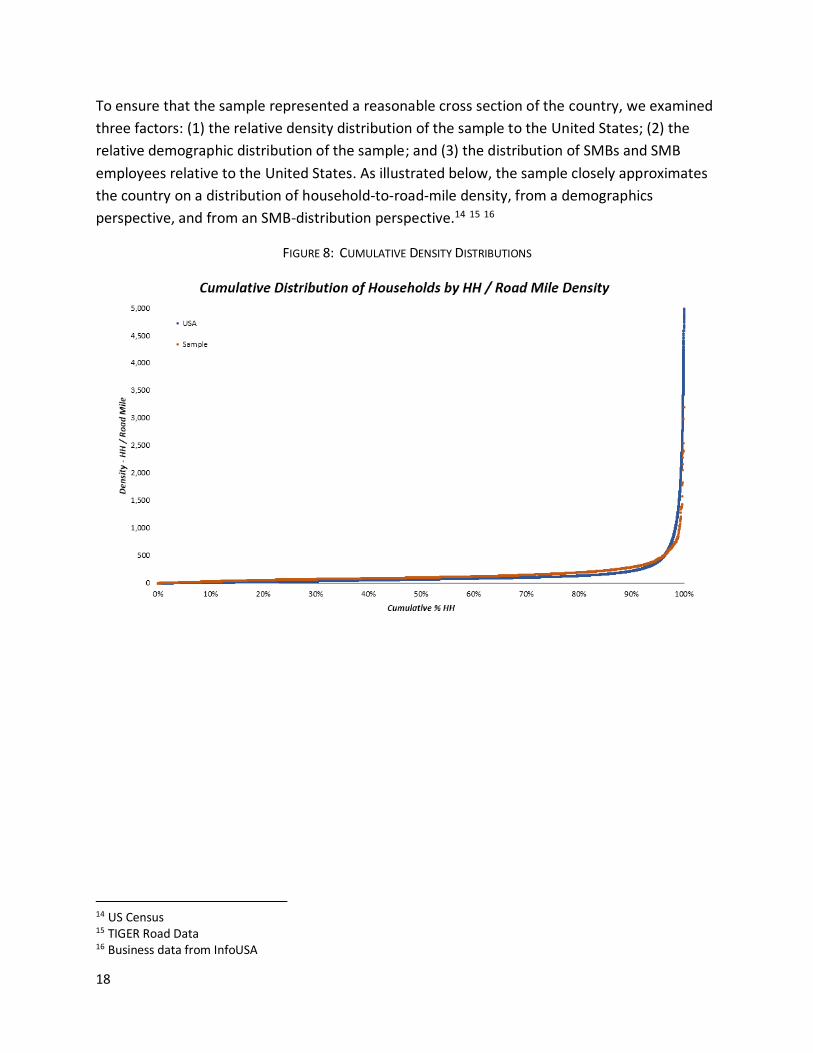
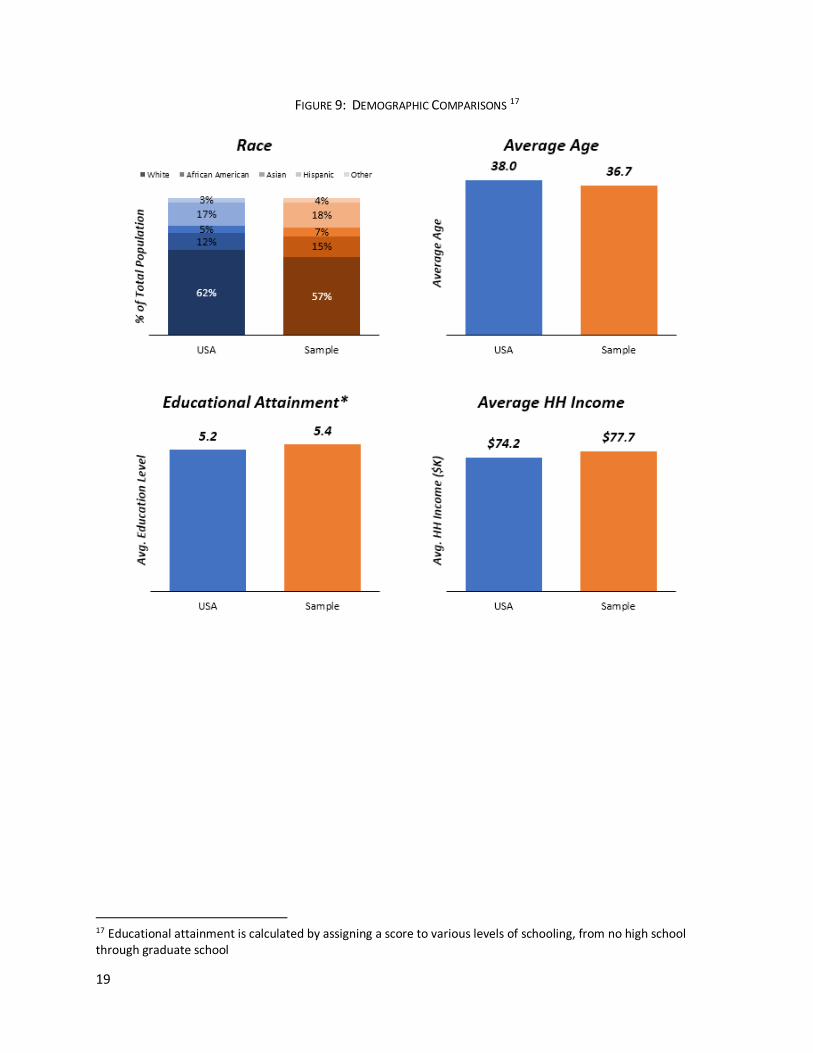
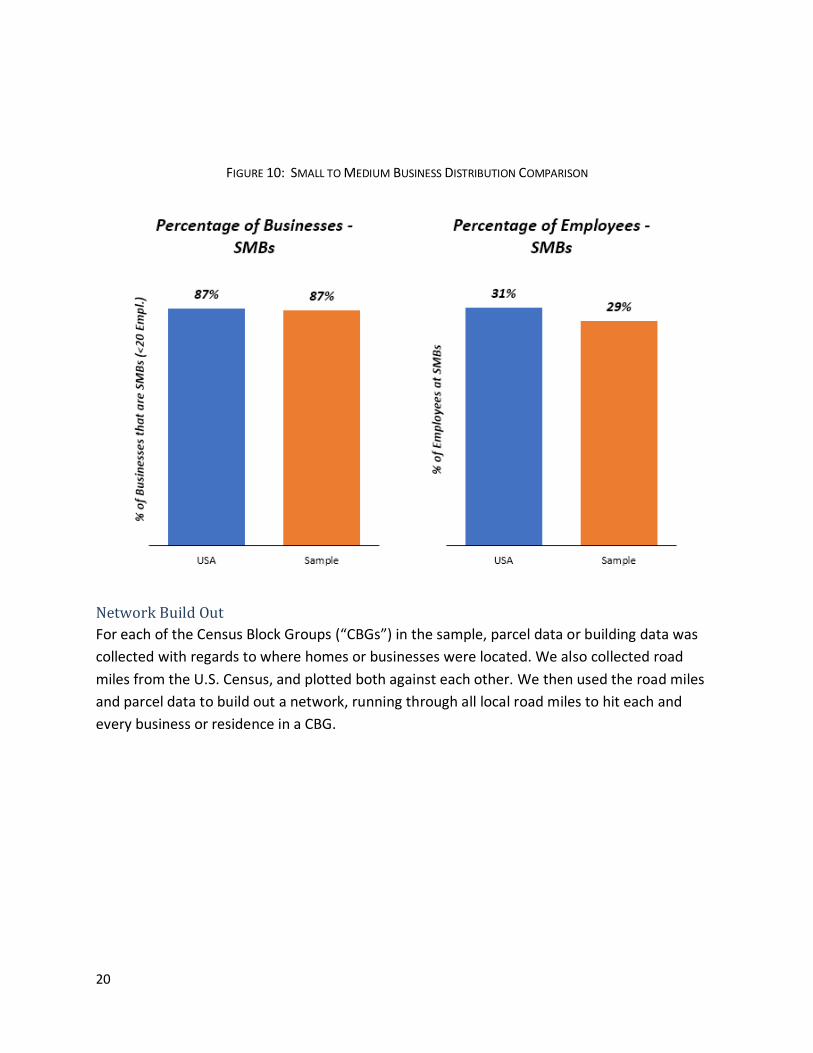
To ensure that the sample represented a reasonable cross section of the country, we examined
three factors: (1) the relative density distribution of the sample to the United States; (2) the
relative demographic distribution of the sample; and (3) the distribution of SMBs and SMB
employees relative to the United States. As illustrated below, the sample closely approximates
the country on a distribution of household-to-road-mile density, from a demographics
perspective, and from an SMB-distribution perspective.14 15 16
FIGURE 8: CUMULATIVE DENSITY DISTRIBUTIONS
14 US Census 15 TIGER Road Data 16 Business data from InfoUSA
19
FIGURE 9: DEMOGRAPHIC COMPARISONS 17
17 Educational attainment is calculated by assigning a score to various levels of schooling, from no high school through graduate school
20
FIGURE 10: SMALL TO MEDIUM BUSINESS DISTRIBUTION COMPARISON
Network Build Out
For each of the Census Block Groups (“CBGs”) in the sample, parcel data or building data was
collected with regards to where homes or businesses were located. We also collected road
miles from the U.S. Census, and plotted both against each other. We then used the road miles
and parcel data to build out a network, running through all local road miles to hit each and
every business or residence in a CBG.
21
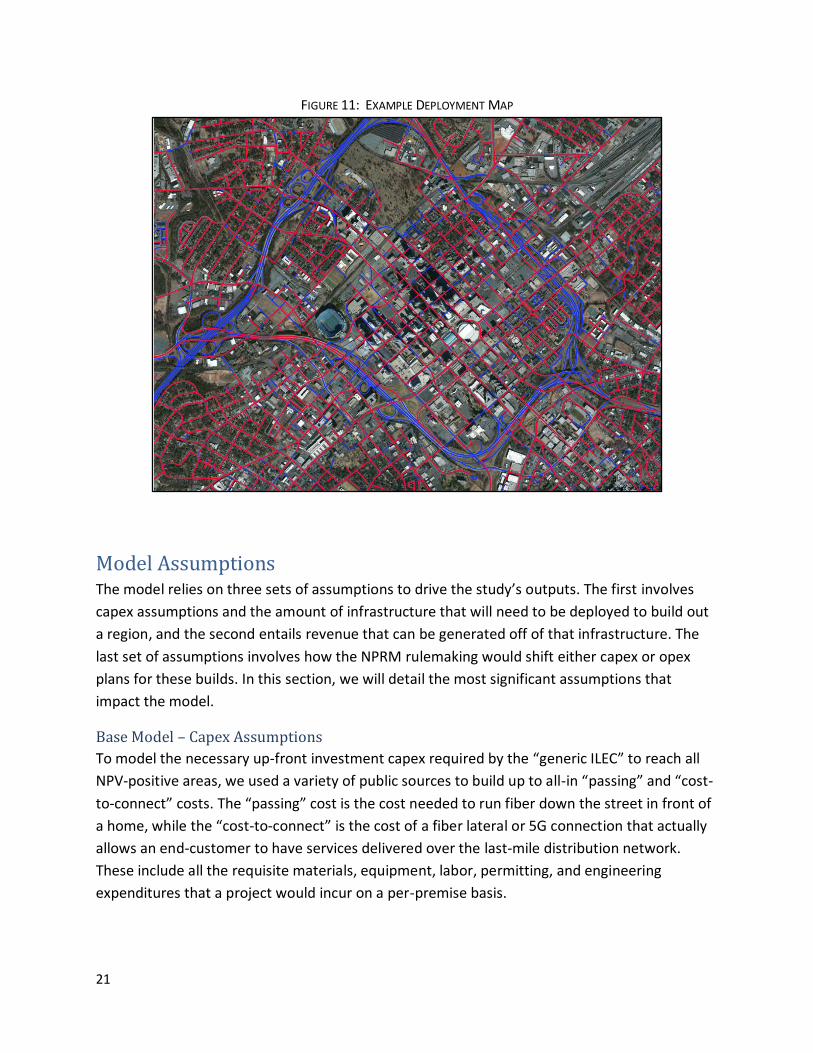
FIGURE 11: EXAMPLE DEPLOYMENT MAP
Model Assumptions The model relies on three sets of assumptions to drive the study’s outputs. The first involves
capex assumptions and the amount of infrastructure that will need to be deployed to build out
a region, and the second entails revenue that can be generated off of that infrastructure. The
last set of assumptions involves how the NPRM rulemaking would shift either capex or opex
plans for these builds. In this section, we will detail the most significant assumptions that
impact the model.
Base Model – Capex Assumptions
To model the necessary up-front investment capex required by the “generic ILEC” to reach all
NPV-positive areas, we used a variety of public sources to build up to all-in “passing” and “cost-
to-connect” costs. The “passing” cost is the cost needed to run fiber down the street in front of
a home, while the “cost-to-connect” is the cost of a fiber lateral or 5G connection that actually
allows an end-customer to have services delivered over the last-mile distribution network.
These include all the requisite materials, equipment, labor, permitting, and engineering
expenditures that a project would incur on a per-premise basis.
22
To build up to these costs, we looked to public benchmarks and validated against internal
benchmarks. While we recognize that these costs can vary significantly by where and how the
fiber network is built, we relied upon averages to the best extent possible to try to approximate
a true national representation. Because we model a large set of sample regions, which are then
extrapolated to the nation, our total figures will necessarily include areas that are less attractive
than those that have already been built out. This will manifest in somewhat higher capex per
passing figures than recent benchmarks for past deployments might otherwise suggest.
For example, a dense urban build will have a higher proportion of buried fiber, which may
require difficult and expensive directional boring work while a suburban build will often have a
higher percentage of aerial construction. An ILEC may not have built out the complicated dense
urban network, instead choosing to focus on low-hanging fruit where they can economically
and easily deploy fiber.
The headline materials cost includes all of the materials required for an outside plant network
to pass a premise. This includes all fiber, messenger strands, snowshoes, strand and lash
materials, splice cases, fiber trays, MSTs, and splitters. Additional to the OSP material cost is the
non-premise networking equipment costs associated with the passing build, which include
distribution chassis, SCP cards, GPON line cards, multimode SFP transceivers, optical-interface
modules, and associated install costs.
We have split overall aerial costs into (1) general aerial costs associated with the actual
installation labor of fiber such as splicing, lashing, strand placing, and MST installation, as well
as (2) the make-ready costs associated with preparing a pole for fiber installation. The make-
ready cost varies by morphology, as pole density increases in urban areas and there are an
increased number of “attachers” per pole that may need to be moved in these morphologies. 18
Underground labor cost also varies by morphology as it often becomes more difficult to bury
fiber as population density increases. Underground labor alone can cost from $48,000 per mile
for relatively simple soil trenching to $150,000 per mile for directional boring through rock or in
a downtown central business district. However, it is important to note that while the per mile
cost for both aerial and underground construction increases as density increase, the per-
premise passed cost decreases due to the higher density of building units.
In addition to the cost of extending the network to pass a building, there are assumptions for
the cost to connect a building (including entry material, labor, and electronics). The largest
components of this cost-to-connect are the drop labor and materials, which increase as the
18 An “attacher” is an organization who rents space on a pole: for instance, the utility itself, the cable company, the municipality and the telco.

23
average distance from the curb to the home, or the curb set-back, increases.19 This average set-
back is larger in more rural communities, where land is more readily available and homes are
further from the road, driving drop labor and materials costs higher in rural areas. The on-
premise electronics required to connect include the ONT, the ONT shell and the unit’s UPS.
These costs are kept uniform for all single tenant buildings but for MDUs and larger business-
focused buildings there is often a more costly build required to connect/deploy. For ease of
comparison, we do not include CPE costs in these costs-to-connect for the numbers shown
below, however they are included in the business case calculations.
The key capex assumptions within the model are presented below, and the ranges reflect
varying costs by morphology:
19 We conducted an analysis of buildings in the greater Boston area to determine how curb-set back varies by morphology.

24
TABLE 1: KEY CAPEX ASSUMPTIONS USED IN BUSINESS CASE MODEL
Metric Value Description Source
Per Mile Materials Cost
$14k/mi All fiber, messenger strands, strand and lash materials and other associated materials costs for the OSP
Tilson
Per Prem Materials Cost
$25/prem Includes the MST Tilson
Non-Premise Network Equipment
Costs
$99/premise passed
All CO and distribution cabinet costs, including labor Tilson
Aerial Labor Cost $39k/mi Labor cost to deploy aerial fiber. Includes: splicing, lashing, anchoring / guying, MST and strand placing
Tilson
Underground Labor Cost
$48k-$150k/mi Cost for deploying underground fiber across different morphologies including soil trenching, directional boring and rod and rope
Telmarc, CMA, Tilson
Percentage Aerial Construction
35%-75% Split of aerial fiber construction for deployments across morphologies. Denser areas tend to have more underground fiber
CTC, CMA
Make Ready Cost - Current
$4k-$35k/mi Cost to move other pole attachers, replace poles, etc. across morphologies - current rules
FCC, CTC, Florida Public Services Commission
Building Connect Costs - Small Residential
$832-$1,871/per premise connected
Cost-to-connect a customer premise to distribution network. Includes drop labor, materials and ONT, but excludes CPE
CTC, Tilson, CMA
Building Connect Costs - Large MDU /
Building
$5k/per premise connected
Cost-to-connect a customer premise (MDU) to distribution network
CTC, Tilson, CMA
Engineering and Permitting Cost
$2k/mi Required permitting and engineering costs per mile CTC, McLean Engineering
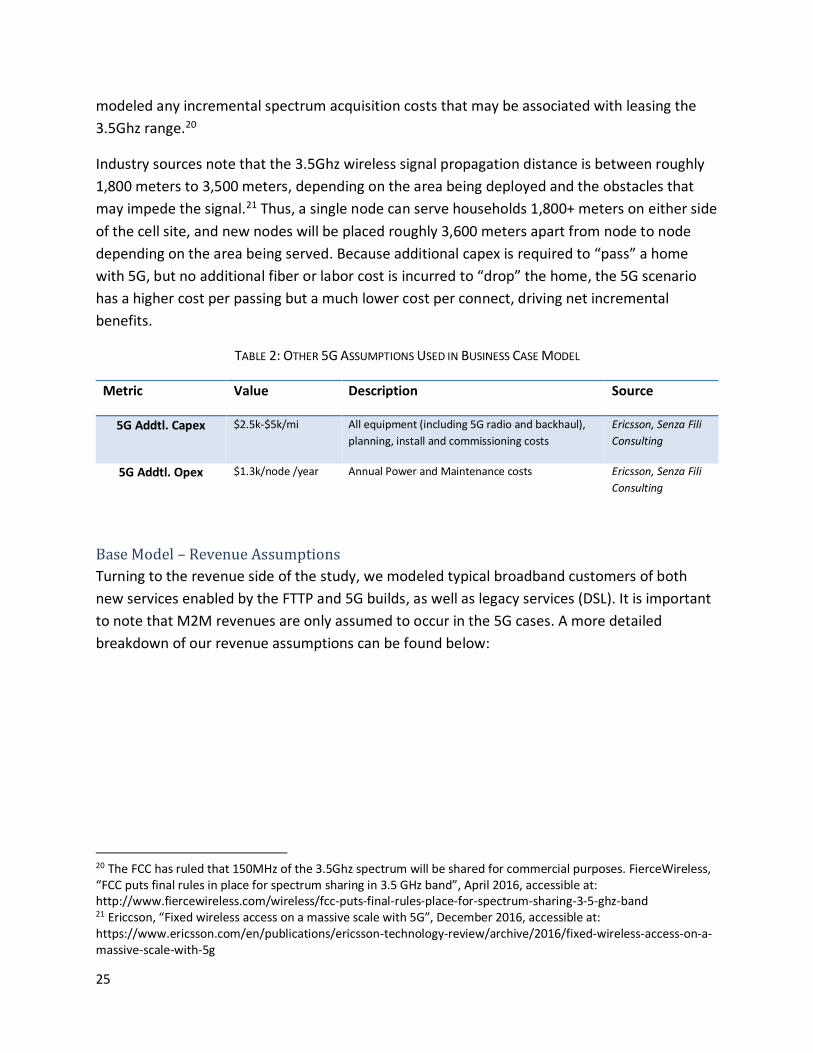
In the 5G case, we assumed that operators must deploy fiber to reach close enough to the curb
of every home, similar to “passing” the home with fiber in the FTTP scenario. However, instead
of providing a fiber drop to each home, we assumed that 5G radios are placed at varying
increments along the network to provide wireless service. Because the spectrum to be used for
5G is not yet defined, we used the 3.5Ghz spectrum as a point of reference and we have not
25
modeled any incremental spectrum acquisition costs that may be associated with leasing the
3.5Ghz range.20
Industry sources note that the 3.5Ghz wireless signal propagation distance is between roughly
1,800 meters to 3,500 meters, depending on the area being deployed and the obstacles that
may impede the signal.21 Thus, a single node can serve households 1,800+ meters on either side
of the cell site, and new nodes will be placed roughly 3,600 meters apart from node to node
depending on the area being served. Because additional capex is required to “pass” a home
with 5G, but no additional fiber or labor cost is incurred to “drop” the home, the 5G scenario
has a higher cost per passing but a much lower cost per connect, driving net incremental
benefits.
TABLE 2: OTHER 5G ASSUMPTIONS USED IN BUSINESS CASE MODEL
Metric Value Description Source
5G Addtl. Capex $2.5k-$5k/mi All equipment (including 5G radio and backhaul),
planning, install and commissioning costs
Ericsson, Senza Fili
Consulting
5G Addtl. Opex $1.3k/node /year Annual Power and Maintenance costs Ericsson, Senza Fili
Consulting
Base Model – Revenue Assumptions
Turning to the revenue side of the study, we modeled typical broadband customers of both
new services enabled by the FTTP and 5G builds, as well as legacy services (DSL). It is important
to note that M2M revenues are only assumed to occur in the 5G cases. A more detailed
breakdown of our revenue assumptions can be found below:
20 The FCC has ruled that 150MHz of the 3.5Ghz spectrum will be shared for commercial purposes. FierceWireless, “FCC puts final rules in place for spectrum sharing in 3.5 GHz band”, April 2016, accessible at: http://www.fiercewireless.com/wireless/fcc-puts-final-rules-place-for-spectrum-sharing-3-5-ghz-band 21 Ericcson, “Fixed wireless access on a massive scale with 5G”, December 2016, accessible at: https://www.ericsson.com/en/publications/ericsson-technology-review/archive/2016/fixed-wireless-access-on-a-massive-scale-with-5g

26
TABLE 3: KEY REVENUE ASSUMPTIONS USED IN BUSINESS CASE MODEL
Metric Value Description Source
Revenue per Broadband Sub -
New Service
$169/mo Blended ARPU of a broadband subscriber purchasing the FTTP or 5G solution (includes implied take rates of voice, broadband and video)
Verizon, CMA
New Service ARPU Growth
0% Assumption of no ARPU growth due to increasing mix-shift away from linear video toward OTT that requires higher bandwidth
CMA
Revenue per Broadband Sub - DSL
$82/mo Blended ARPU of a broadband subscriber who is purchasing voice and broadband
Verizon, CMA
DSL ARPU Growth -8% Historical pricing degradation Y-o-Y Verizon, CMA
DSL ARPU Floor $50/mo Breakeven ARPU minimum to cover costs of providing legacy copper services
Frontier, Verizon
M2M MB Consumed Per Month
357 MB/mo Data consumption of non-LPWA M2M devices per month
Cisco VNI
M2M MB Consumed Growth
37% Annual data consumption growth per device Cisco VNI
$ / MB $0.01 Current price per MB of data Cisco VNI, GSMA Wireless Intelligence
$ / MB Growth -27% Price per MB of data decline Cisco VNI, GSMA Wireless Intelligence
M2M ARPU $4 Transport revenue per M2M device / month Cisco VNI, GSMA Wireless Intelligence, CMA
The model uses a blended revenue per broadband subscriber, which includes implied take rates
of various services (sometimes referred to as RGUs). This calculation has been completed for
both FTTP as well as legacy copper services. New service ARPU growth is flat due to an
increasing mix-shift away from linear video, but a corresponding increase in bandwidth revenue
as Over-the-Top (OTT) adoption becomes stronger. In the “But-For” legacy revenue modeling,
DSL services are assumed to continue their historical decline to a price floor at a point of $50.
For customers who switch to the new FTTP service from DSL, a revenue-growth assumption is
applied as customers increase spend over time for services now enabled by the new broadband
technology such as linear video or increased bandwidth. In the 5G case, M2M ARPU is relatively
flat over time, with declining per MB pricing offset by increased data consumption. In all
scenarios, we assume varying gross service margins to account for additional costs like content,
backhaul and other operating concerns.

27
NPRM Assumptions
While all of the above assumptions are reflective of the current regulatory paradigm, the
deregulated case modeled here also incorporates assumptions around capex and opex savings.
Because the NRPM allows for a wide range of potential outcomes, when possible, we tried to
root the modeled values as closely as possible to what is stated in the NPRM. For instance, the
NRPM allows for a standard make-ready fee of $300-500 per pole; thus, we chose $300 instead
of trying to estimate how much a third-party independent contractor might charge in each
situation.
Broadly the NRPM benefits that we model in this study can be divided into four categories: (1)
speeding the time to deploy fiber in a particular community by upwards of 90 days; (2) lowering
the costs associated with a fiber deployment, primarily via the reduction of make-ready costs;
(3) reducing the operating costs of pole attachment rates; and lastly (4) removing the costs of
operating a duplicative copper network.
Timing Based Assumptions
The NPRM lays out a number of timing-based reductions that would speed up the deployment
process of an FTTP or 5G build. In some cases, the NPRM notes where there is a range of
potentially acceptable solutions. In these instances, we model the lower bound of the range.
The FCC has floated the possibility of adopting a “One-Touch Make-Ready” approach that
would effectively lower the time for new attachers to access a pole by consolidating make-
ready work. To model the potential time reductions of a one-touch make-ready approach, we
used the most aggressive proposals in the NPRM without evaluating whether those proposals
are feasible: (1) lowering the application review period from 45 days to 15 days; (2) lowering
the survey period, cost estimate and acceptance period from 28 days to less than 2 weeks; and
(3) lowering make-ready timing from roughly 60-75 days to less than 30 days. The FCC does
make exceptions for “large orders” and does potentially allow for 30 days of post make-ready
review for existing attachers on a pole. All told, we modeled timing reductions of around 90
days to account for the NRPM timing around deployment, which results in revenue accruing to
the new network roughly one fiscal quarter earlier than in the Base scenario. We also note that
these timing assumptions will likely have a small, but meaningful, impact on engineering and
permitting costs, as the general process will likely run much smoother and less engineering time
will be wasted. As such, we have estimated that these timing changes will result in a 10%
improvement to engineering and permitting costs.
Further, the FCC has spelled out a number of potential timing reductions around the 214
Discontinuance and Copper Retirement Process. In instances of a Discontinuance, the NPRM
would (1) reduce the public comment period to less than 10 days for grandfathered data and
28
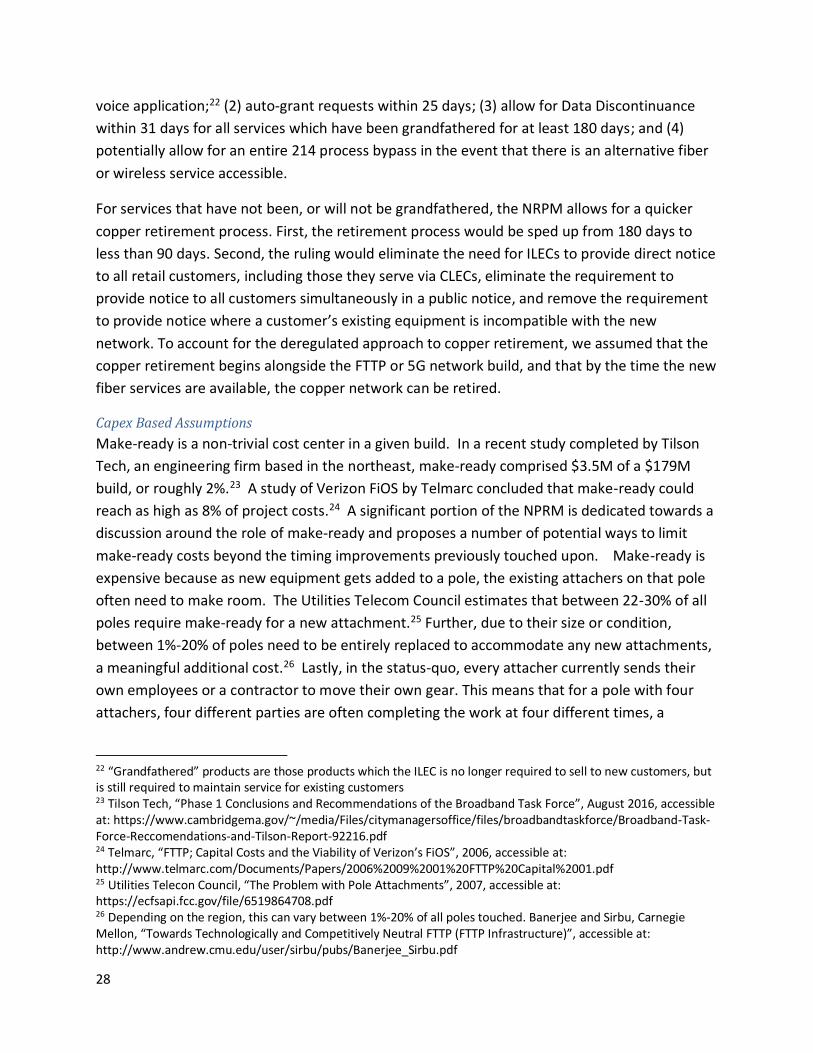
voice application;22 (2) auto-grant requests within 25 days; (3) allow for Data Discontinuance
within 31 days for all services which have been grandfathered for at least 180 days; and (4)
potentially allow for an entire 214 process bypass in the event that there is an alternative fiber
or wireless service accessible.
For services that have not been, or will not be grandfathered, the NRPM allows for a quicker
copper retirement process. First, the retirement process would be sped up from 180 days to
less than 90 days. Second, the ruling would eliminate the need for ILECs to provide direct notice
to all retail customers, including those they serve via CLECs, eliminate the requirement to
provide notice to all customers simultaneously in a public notice, and remove the requirement
to provide notice where a customer’s existing equipment is incompatible with the new
network. To account for the deregulated approach to copper retirement, we assumed that the
copper retirement begins alongside the FTTP or 5G network build, and that by the time the new
fiber services are available, the copper network can be retired.
Capex Based Assumptions
Make-ready is a non-trivial cost center in a given build. In a recent study completed by Tilson
Tech, an engineering firm based in the northeast, make-ready comprised $3.5M of a $179M
build, or roughly 2%.23 A study of Verizon FiOS by Telmarc concluded that make-ready could
reach as high as 8% of project costs.24 A significant portion of the NPRM is dedicated towards a
discussion around the role of make-ready and proposes a number of potential ways to limit
make-ready costs beyond the timing improvements previously touched upon. Make-ready is
expensive because as new equipment gets added to a pole, the existing attachers on that pole
often need to make room. The Utilities Telecom Council estimates that between 22-30% of all
poles require make-ready for a new attachment.25 Further, due to their size or condition,
between 1%-20% of poles need to be entirely replaced to accommodate any new attachments,
a meaningful additional cost.26 Lastly, in the status-quo, every attacher currently sends their
own employees or a contractor to move their own gear. This means that for a pole with four
attachers, four different parties are often completing the work at four different times, a
22 “Grandfathered” products are those products which the ILEC is no longer required to sell to new customers, but is still required to maintain service for existing customers 23 Tilson Tech, “Phase 1 Conclusions and Recommendations of the Broadband Task Force”, August 2016, accessible at: https://www.cambridgema.gov/~/media/Files/citymanagersoffice/files/broadbandtaskforce/Broadband-Task-Force-Reccomendations-and-Tilson-Report-92216.pdf 24 Telmarc, “FTTP; Capital Costs and the Viability of Verizon’s FiOS”, 2006, accessible at: http://www.telmarc.com/Documents/Papers/2006%2009%2001%20FTTP%20Capital%2001.pdf 25 Utilities Telecon Council, “The Problem with Pole Attachments”, 2007, accessible at: https://ecfsapi.fcc.gov/file/6519864708.pdf 26 Depending on the region, this can vary between 1%-20% of all poles touched. Banerjee and Sirbu, Carnegie Mellon, “Towards Technologically and Competitively Neutral FTTP (FTTP Infrastructure)”, accessible at: http://www.andrew.cmu.edu/user/sirbu/pubs/Banerjee_Sirbu.pdf
29
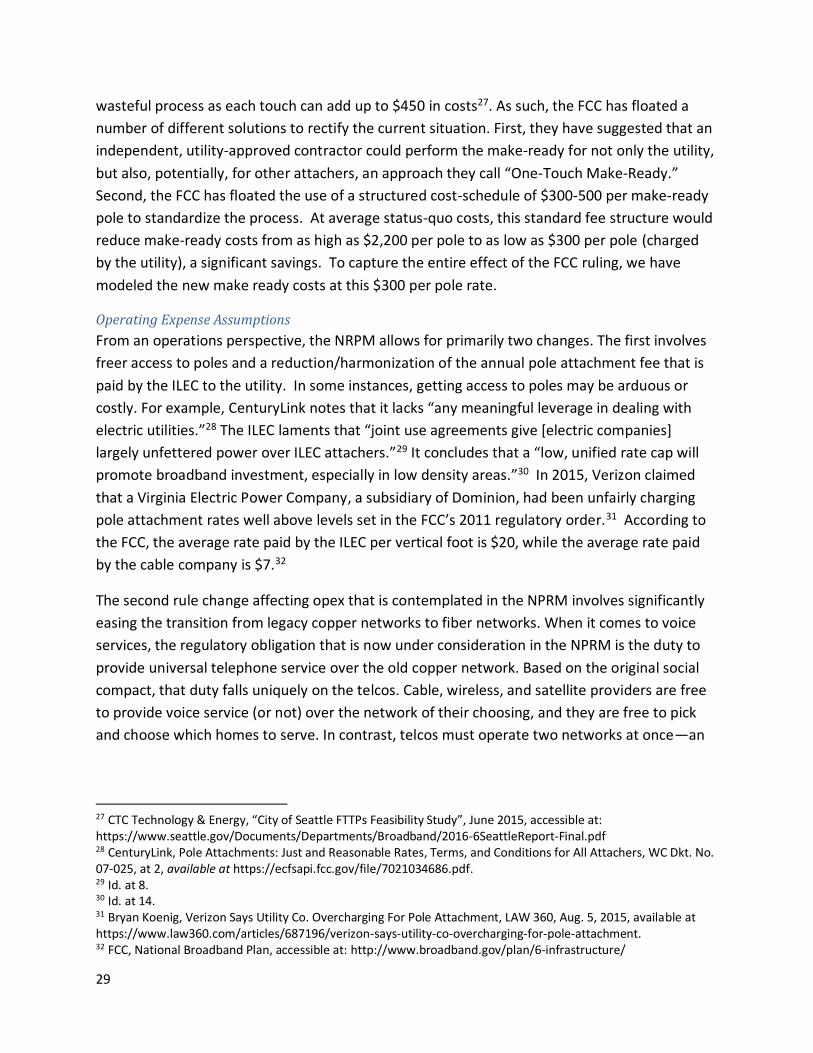
wasteful process as each touch can add up to $450 in costs27. As such, the FCC has floated a
number of different solutions to rectify the current situation. First, they have suggested that an
independent, utility-approved contractor could perform the make-ready for not only the utility,
but also, potentially, for other attachers, an approach they call “One-Touch Make-Ready.”
Second, the FCC has floated the use of a structured cost-schedule of $300-500 per make-ready
pole to standardize the process. At average status-quo costs, this standard fee structure would
reduce make-ready costs from as high as $2,200 per pole to as low as $300 per pole (charged
by the utility), a significant savings. To capture the entire effect of the FCC ruling, we have
modeled the new make ready costs at this $300 per pole rate.
Operating Expense Assumptions
From an operations perspective, the NRPM allows for primarily two changes. The first involves
freer access to poles and a reduction/harmonization of the annual pole attachment fee that is
paid by the ILEC to the utility. In some instances, getting access to poles may be arduous or
costly. For example, CenturyLink notes that it lacks “any meaningful leverage in dealing with
electric utilities.”28 The ILEC laments that “joint use agreements give [electric companies]
largely unfettered power over ILEC attachers.”29 It concludes that a “low, unified rate cap will
promote broadband investment, especially in low density areas.”30 In 2015, Verizon claimed
that a Virginia Electric Power Company, a subsidiary of Dominion, had been unfairly charging
pole attachment rates well above levels set in the FCC’s 2011 regulatory order.31 According to
the FCC, the average rate paid by the ILEC per vertical foot is $20, while the average rate paid
by the cable company is $7.32
The second rule change affecting opex that is contemplated in the NPRM involves significantly
easing the transition from legacy copper networks to fiber networks. When it comes to voice
services, the regulatory obligation that is now under consideration in the NPRM is the duty to
provide universal telephone service over the old copper network. Based on the original social
compact, that duty falls uniquely on the telcos. Cable, wireless, and satellite providers are free
to provide voice service (or not) over the network of their choosing, and they are free to pick
and choose which homes to serve. In contrast, telcos must operate two networks at once—an
27 CTC Technology & Energy, “City of Seattle FTTPs Feasibility Study”, June 2015, accessible at: https://www.seattle.gov/Documents/Departments/Broadband/2016-6SeattleReport-Final.pdf 28 CenturyLink, Pole Attachments: Just and Reasonable Rates, Terms, and Conditions for All Attachers, WC Dkt. No. 07-025, at 2, available at https://ecfsapi.fcc.gov/file/7021034686.pdf. 29 Id. at 8. 30 Id. at 14. 31 Bryan Koenig, Verizon Says Utility Co. Overcharging For Pole Attachment, LAW 360, Aug. 5, 2015, available at https://www.law360.com/articles/687196/verizon-says-utility-co-overcharging-for-pole-attachment. 32 FCC, National Broadband Plan, accessible at: http://www.broadband.gov/plan/6-infrastructure/

30
outdated, copper-based legacy network that provides service to a shrinking customer base and
a modern, IP-based network that supports data, video, and voice applications
If supporting two separate networks imposed trivial costs on the telcos, then consumers would
not be impacted. However, telcos invest a significant amount of resources to maintain the
legacy network. One study by the Columbia Institute for Tele-Informations estimated that
nearly half of telcos’ capital expenditures are tied up in this area.33 Freed from these
obligations, telcos could deploy these resources to higher value services, including expanding
the reach of their IP-based networks. Broadband consumers, particularly those living in areas
served by a single wireline provider of broadband services, would benefit from the enhanced
competition with cable operators.
To demonstrate these costs, we can isolate three areas where running two networks leads to a
significant resource redundancy.
First, an ILEC must maintain a significant amount of space dedicated towards legacy switching
gear and peripheral equipment. Reducing the copper footprint can save upwards of 80% of
central office space as a carrier can remove the gear and consolidate into a much smaller
footprint.34 Assuming commercial real estate prices of around $25/foot per year across an
ILEC’s CO footprint of 50 million square feet and roughly 25 million homes in footprint, that
equates to a savings of roughly $35 per home passed per year of real estate expense.
Second, electrifying the copper network and equipment takes a significant amount of electricity
to operate, estimated at $1.49 per home passed per year of electricity expense. 35
Lastly, there is a large amount of incremental maintenance for the copper network. These
include replacing drops, repairing wiring, resolving customer complaint tickets, and rolling
trucks to resolve any issues. In 2013, Verizon estimated that in areas where both FiOS and
copper existed, they were spending more than $200 million annually on the copper network, or
roughly $10 per home passed with both fiber and copper per year of maintenance expense.36
33 Robert Atkinson & Ivy Schultz, Broadband in America: Where It Is and Where Is It Going?, Nov. 11, 2009, available at http://www.broadband.gov/docs/Broadband_in_America.pdf 34 Verizon claims they could save 60-80% across 50 million square feet of CO space, by retiring copper. LightReading, “Verizon Saves 60% Swapping Copper for Fiber”, May 2015, accessible at: http://www.lightreading.com/ethernet-ip/new-ip/verizon-saves-60--swapping-copper-for-fiber/d/d-id/715826 35 Verizon notes that in six wirecenters where copper was entirely retired in favor of fiber, 1 million kilowatt hours of energy were saved per year. We estimate that there are roughly 70,440 homes in the affected wirecenters. Verizon Ex Parte, May 2015, “Technology Transitions, GN Docket No. 13-5; Ensuring Customer Premises Equipment Backup Power for Continuity of Communications, PS Docket No. 14-174; Policies for Rules Governing the Retirement of Copper Loops by Incumbent Local Exchange Carriers, RM-11358; Special Access for Price Cap Local Exchange Carriers, WC Docket No. 05-25” 36 FCC WC DOCKET NO. 12-353, Comments of Verizon and Verizon Wireless, “Technological Transition of the Nation’s Communications Infrastructure”
31
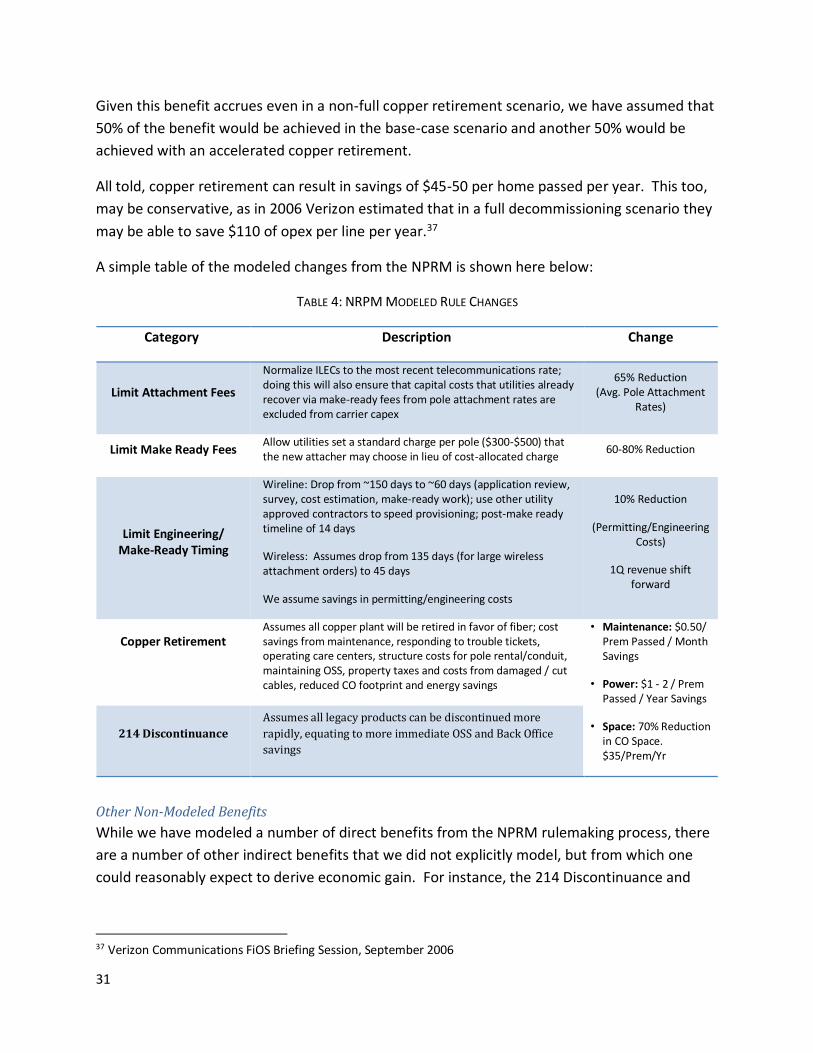
Given this benefit accrues even in a non-full copper retirement scenario, we have assumed that
50% of the benefit would be achieved in the base-case scenario and another 50% would be
achieved with an accelerated copper retirement.
All told, copper retirement can result in savings of $45-50 per home passed per year. This too,
may be conservative, as in 2006 Verizon estimated that in a full decommissioning scenario they
may be able to save $110 of opex per line per year.37
A simple table of the modeled changes from the NPRM is shown here below:
TABLE 4: NRPM MODELED RULE CHANGES
Category Description Change
Limit Attachment Fees
Normalize ILECs to the most recent telecommunications rate; doing this will also ensure that capital costs that utilities already recover via make-ready fees from pole attachment rates are excluded from carrier capex
65% Reduction (Avg. Pole Attachment
Rates)
Limit Make Ready Fees Allow utilities set a standard charge per pole ($300-$500) that the new attacher may choose in lieu of cost-allocated charge
60-80% Reduction
Limit Engineering/ Make-Ready Timing
Wireline: Drop from ~150 days to ~60 days (application review, survey, cost estimation, make-ready work); use other utility approved contractors to speed provisioning; post-make ready timeline of 14 days
Wireless: Assumes drop from 135 days (for large wireless attachment orders) to 45 days
We assume savings in permitting/engineering costs
10% Reduction
(Permitting/Engineering Costs)
1Q revenue shift forward
Copper Retirement
Assumes all copper plant will be retired in favor of fiber; cost savings from maintenance, responding to trouble tickets, operating care centers, structure costs for pole rental/conduit, maintaining OSS, property taxes and costs from damaged / cut cables, reduced CO footprint and energy savings
• Maintenance: $0.50/ Prem Passed / Month Savings
• Power: $1 - 2 / Prem Passed / Year Savings
• Space: 70% Reduction in CO Space. $35/Prem/Yr
214 Discontinuance
Assumes all legacy products can be discontinued more
rapidly, equating to more immediate OSS and Back Office
savings
Other Non-Modeled Benefits
While we have modeled a number of direct benefits from the NPRM rulemaking process, there
are a number of other indirect benefits that we did not explicitly model, but from which one
could reasonably expect to derive economic gain. For instance, the 214 Discontinuance and
37 Verizon Communications FiOS Briefing Session, September 2006

32
Copper Retirement process will remove the need to maintain entire billing systems, IT
resources, trouble ticketing systems, and other dedicated on-staff engineering resources.
An argument could also be made that deregulating a fiber deployment and lowering barriers to
deployment would also result in a lower risk profile for investors in these companies. A lower
risk profile could result in an ILEC being rewarded with cheaper access to debt via a higher
credit rating, or access to equity via a lower cost of capital. This lower cost of capital would
actually push more modeled areas to a positive economic return, and more capital would be
deployed to serve these regions.38
Additionally, there are a number of potential cost savings from a streamlined screening process
for wireless deployments – particularly on tribal lands or areas with historical significance. The
NPRM language sets the stage for removing “local barriers” to deployments by: 1) establishing
a 60 day shot clock for local governments 2) reducing the survey, cost estimate and acceptance
period from 28 days to less than two weeks 3) potentially reducing or standardizing tribal fees
and shortening the SHPO/NEP compliance review by setting a 30 day timeline for an initial
response 4) excluding small cells from historical or tribal review for replacement poles if the
pole is not substantially larger than what existed before and the construction is minimal 5)
excluding review of collocations within 50-250 feet of historic districts, structures within
industrial zones or within 50 feet of a utility ROW 6) excluding towers built between 2001 and
2005 from review unless the new antenna would result in a substantial size increase or the
tower has an adverse effect on the historic property 7) Reducing fees which are “prohibitive” by
tying fees to costs and lastly 8) removing barriers to deploying on lamp posts, water towers,
utility conduit and other rights of way. Again, we have not modeled any of these potential
benefits, but note that they could allow for a lower burden to deployment for a wireless carrier.
Model Results
FTTP – Model Results
When run for the FTTP Base scenario (FTTP deployment under prevailing FCC rules), our model
estimates a total of 74.3M, or 53% of housing units and SMBs nationwide are in areas with an
NPV positive business case. As these areas are profitable for a fiber deployment, the associated
premises could be viably served under the current rules. Enacting the proposed changes in the
FTTP NPRM Scenario, our model estimates an incremental 26.7M premises become profitable
to pass with fiber, resulting in a total of 100.9M, or 71% of premises in the US being potentially
economically viable for fiber deployment. To reach these 26.7M premises, an associated
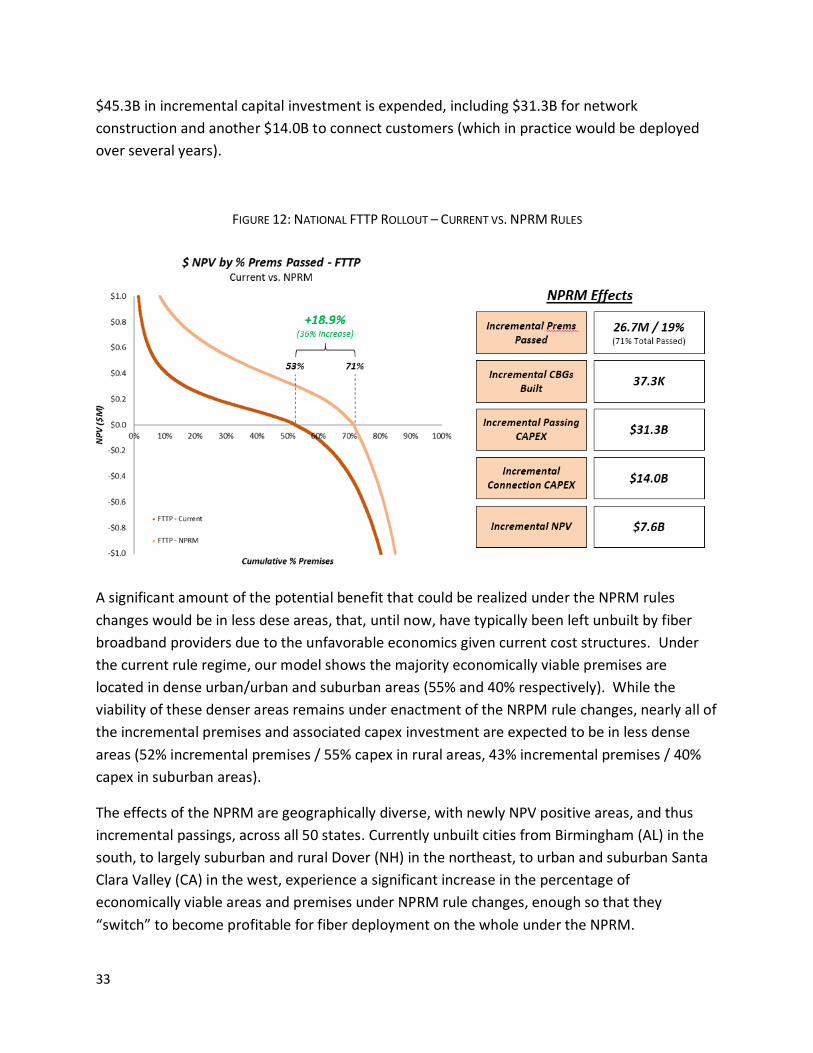
38 FCC WC DOCKET NO. 10-90, “Prescribing the Authorized Rate of Return”, May 16, 2013. The FCC ruling notes that the WACC is a function of risk, and that businesses of similar risk should receive a similar “risk premium”. Increasing the risk of an investment serves to increase the required return and will lower the discounted value of future returns.
33
$45.3B in incremental capital investment is expended, including $31.3B for network
construction and another $14.0B to connect customers (which in practice would be deployed
over several years).
FIGURE 12: NATIONAL FTTP ROLLOUT – CURRENT VS. NPRM RULES
A significant amount of the potential benefit that could be realized under the NPRM rules
changes would be in less dese areas, that, until now, have typically been left unbuilt by fiber
broadband providers due to the unfavorable economics given current cost structures. Under
the current rule regime, our model shows the majority economically viable premises are
located in dense urban/urban and suburban areas (55% and 40% respectively). While the
viability of these denser areas remains under enactment of the NRPM rule changes, nearly all of
the incremental premises and associated capex investment are expected to be in less dense
areas (52% incremental premises / 55% capex in rural areas, 43% incremental premises / 40%
capex in suburban areas).
The effects of the NPRM are geographically diverse, with newly NPV positive areas, and thus
incremental passings, across all 50 states. Currently unbuilt cities from Birmingham (AL) in the
south, to largely suburban and rural Dover (NH) in the northeast, to urban and suburban Santa
Clara Valley (CA) in the west, experience a significant increase in the percentage of
economically viable areas and premises under NPRM rule changes, enough so that they
“switch” to become profitable for fiber deployment on the whole under the NPRM.
34
Additionally, there may be other non-modeled benefits that result from areas which are
considered economically attractive by our model today, but have not been built because of
otherwise prohibitive local government or otherwise idiosyncratic issues (such as an
uncooperative local utility). Alternatively, the area may be on the margin of economic viability,
but for one reason or another, does not pass various investment requirements of the local
provider (for instance, higher labor costs in a particular area). In either of these situations,
enactment of the NPRM would lower costs and improve the business case in the area,
potentially allowing an ILEC or other fiber provider the ability to overcome the current barriers
to entry.
5G – Model Results
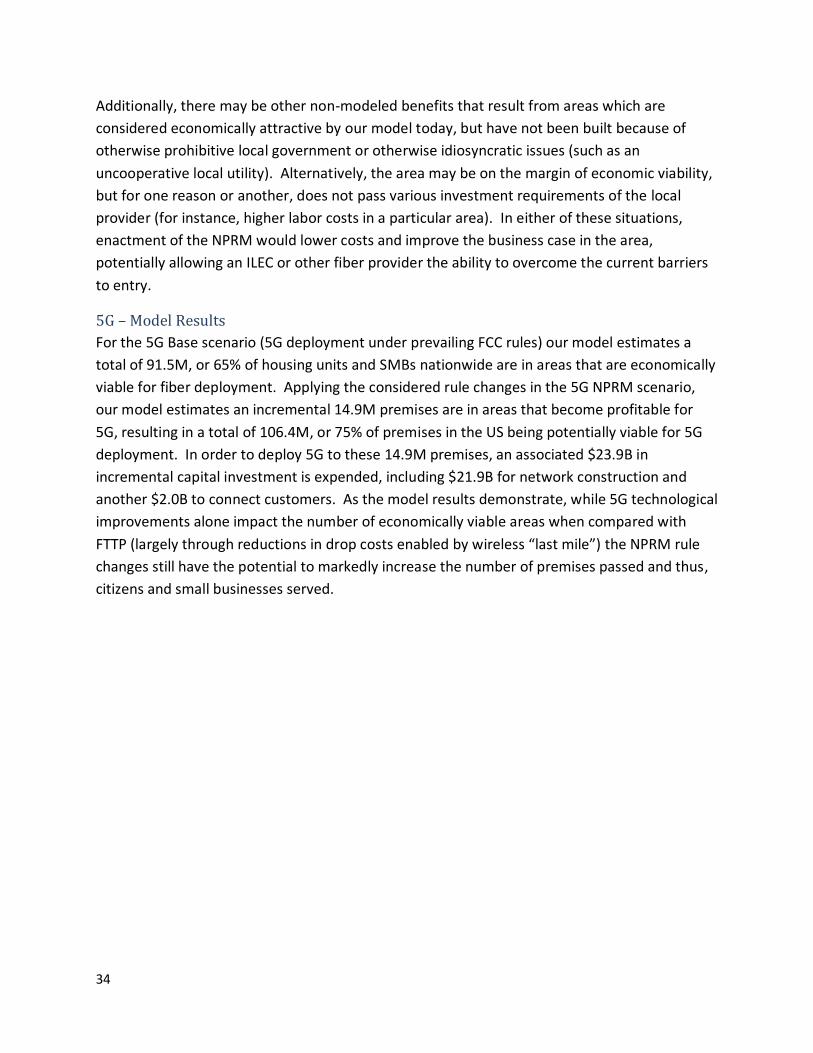
For the 5G Base scenario (5G deployment under prevailing FCC rules) our model estimates a
total of 91.5M, or 65% of housing units and SMBs nationwide are in areas that are economically
viable for fiber deployment. Applying the considered rule changes in the 5G NPRM scenario,
our model estimates an incremental 14.9M premises are in areas that become profitable for
5G, resulting in a total of 106.4M, or 75% of premises in the US being potentially viable for 5G
deployment. In order to deploy 5G to these 14.9M premises, an associated $23.9B in
incremental capital investment is expended, including $21.9B for network construction and
another $2.0B to connect customers. As the model results demonstrate, while 5G technological
improvements alone impact the number of economically viable areas when compared with
FTTP (largely through reductions in drop costs enabled by wireless “last mile”) the NPRM rule
changes still have the potential to markedly increase the number of premises passed and thus,
citizens and small businesses served.
35
FIGURE 13: NATIONAL 5G ROLLOUT – CURRENT VS. NPRM RULES
A large proportion of the incremental benefits gained through enactment of the NPRM rule
changes in a 5G world would be realized in less dense areas. Much like FTTP, under the current
rule regime, the majority of viable areas for 5G are dense urban/urban, with an additional
portion of suburban areas also making the cut. Under the NPRM rule changes, nearly two
thirds of the incremental passings and incremental capex investment are expected to be in rural
areas. Benefits of the NPRM are also expected to be spread geographically, with net premises
added in newly viable areas across all 50 states.
Similar to the FTTP scenarios, there may also be additional potential benefits of the NPRM
beyond what our analysis captures. Those areas that our model estimates as being NPV
positive for an FTTP deployment under the prevailing rules and regulations, but remain unbuilt
due to un-modeled costs or hindrances, may gain enough uplift in the business case from a 5G
deployment and/or the NPRM to enable entry by a fiber service provider or other entity.
Economic Impact & Analysis: Translating the Investment Gain into
Employment and Output Effects So what happens to the U.S. economy when this much capex is added to the system? As in
other industries, broadband capital expenditures have a multiplicative effect on job creation
and economic output if the economy is at less than full employment.39 In this section, we trace
39 The multiplier is a standard principle in the macroeconomics literature. See, e.g., RUDIGER DORNBUSCH & STANLEY
FISCHER, MACROECONOMICS 66 (McGraw Hill 6th ed. 1994). Richard Kahn first introduced the multiplier concept as an “employment multiplier.” See Richard F. Kahn, The Relation of Home Investment To Employment, 41 ECON. J. 173,

36
the impact of the increase of broadband capex on jobs and output using traditional multipliers
as well as estimates of spillover effects. This section does not attempt to incorporate the
potential increases in CLEC or cable investment caused by the increase in ILEC investment.
Job Impact
Our analysis of employment effects from the FCC’s proposed rules is divided into two parts: (1)
“total multiplier effects,” which estimates the number of jobs directly and indirectly created by
spending activities in upstream (input) industries, plus induced jobs from greater household
income; and (2) “spillover effects,” which accounts for additional spending by related and new
downstream industries that benefit indirectly from additional broadband investment and
penetration.
Total Multiplier Effects
The employment effects of capital expenditures in the telecom industry extend beyond the
company’s direct employees. “Direct effects” are jobs generated from activities such as
installing fiber, while “indirect effects” are job gains associated with communication equipment
suppliers. “Induced effects” are the jobs created when the employees of an input provider use
their additional income to purchase more goods and services in the local economy. These three
effects (direct, indirect, and induced)—collectively referred to as the “total multiplier”—are
considered to be the key elements of a traditional analysis of economic impact. Four papers in
the literature inform my estimate of the total multiplier for fiber-based broadband investment.
Using the Bureau of Economic Analysis job and output multipliers, along with slated broadband
investment schedules from the Columbia Institute for Tele-Information, Crandall and Singer
(2010) projected an average of 509,546 jobs in the United States would be sustained from 2010
to 2015 as a result of approximately $30.4 billion of annual broadband investments relative to a
world without such investments,40 implying a weighted-average multiplier (across all
broadband technologies) of 16.8 jobs for every million dollars of broadband investment.
Katz and Callorda (2014) studied the effects of repealing a sales tax exemption in Minnesota on
the telecommunications industry.41 Based on an input-output analysis, they estimate that a
$154 million reduction in broadband investment would destroy 3,323 jobs in the state, implying
173-98 (1931). John Maynard Keynes expanded upon this concept by introducing the “investment multiplier.” See JOHN MAYNARD KEYES, A GENERAL THEORY OF EMPLOYMENT, INTEREST, AND MONEY 115 (Harcourt Brace & Co. 1964) (1936).
40 Robert W. Crandall & Hal J. Singer, The Economic Impact of Broadband Investment, Prepared for Broadband for America, Feb. 2010, available at http://internetinnovation.org/files/special-reports/Economic_Impact_of_Broadband_Investment_Broadband_for_America_.pdf.
41 Raul Katz & Fernando Callorda, Assessment of the Economic Ompact of the Repeal of the Tax Exemption on Telecommunication Investment in Minnesota (Feb. 2014), available at http://www.mncca.com/doc/minnesota-study-final-version.pdf.
37
a total job multiplier of 21.6 jobs per million dollars of broadband investment.42 Indirect and
induced effects contribute a substantial proportion of that total multiplier.43
Sosa and Audenrode (2012) estimated that the effects of reassigning 300 MHz of additional
spectrum to mobile broadband would trigger $15.075 billion in new capital spending per year
(although the study pertains to mobile broadband, the authors rely on job multipliers derived
from wireline services.) 44 The authors apply BEA Type II RIMS multipliers to calculate a
weighted average of Construction (56%) and Broadcast and Communications Equipment (44%),
implying 20.4 jobs for every $1 million invested.45
Finally, using the latest multipliers for telephone apparatus manufacturing (11.8), broadcast
and wireless communications equipment (13.8), fiber-optic cable manufacturing (14.4), and
construction (26.7),46 Eisenach, Singer and West (2009) estimated separate multipliers for
different types of broadband spending by applying weights to each of the industry multipliers
based on the allocation of broadband capital spending to each industry.47 They estimated the
weighted average employment multipliers for fiber-based technologies of 19.7 jobs per million
dollars of FTTP investment and 14.7 jobs per million dollars of wireless investment.48
We adopt the fiber- and wireless-specific investment multipliers from Eisenach, Singer and
West here. Because the multipliers are stated in terms of annual effects, we spread the
predicted investment gain equally across five years. Recall from above that the FCC’s proposed
rules are predicted to increase annual ILEC investment by between $4.78 (equal to $23.9 billion
from the National 5G rollout spread over five years) and $9.06 billion (equal to $45.3 billion
from the National FTTP rollout spread over five years). Table 5 shows that before considering
42 Id. at 24. 43 Id. 44 David Sosa and Marc Van Audenrode, Private Sector Investment and Employment Impacts of Reassigning
Spectrum to Mobile Broadband in the United States, Analysis Group (August 2011), available at http://www.analysisgroup.com/uploadedFiles/News_and_Events/News/Sosa_Audenrode_SpectrumImpactStudy_Aug2011.pdf.
45 Id. at 5. 46 U.S. DEPARTMENT OF COMMERCE, BUREAU OF ECONOMIC ANALYSIS, Regional Input-Output Modeling System (RIMS
II), Table 1.5 (2008). Multipliers are based on the 1997 Benchmark Input-Output Table for the Nation and 2006
regional data.
47 Jeffrey A. Eisenach, Hal J. Singer & Jeffrey D. West, Economic Effects of Tax Incentives for Broadband Infrastructure Deployment, FTTP Council (2008) at 8.
48 Id. Table 2 at 8. FTTP weights are 30 percent for telephone apparatus manufacturing, 20 percent for fiber optic cable manufacturing, and 50 percent for construction.

38
spillover effects, the FCC’s regulations could generate between 70,083 and 178,878 jobs
annually over a five-year period for the National 5G and FTTP rollouts, respectively
TABLE 5: DIRECT, INDIRECT, INDUCED JOB GAIN FROM FCC’S PROPOSED RULE CHANGES
National
FTTP Rollout
National 5G
Rollout
[A] Total Capex Incremental ($B) $45.30 $23.90
[B] Annual Investment Change ($B)
= [A]/5 $9.06 $4.78
[C] Total Job Multiplier ($B)
= [B]*Employment Multiplier 178,878 70,083
Spillover Effects
The total-multiplier-based jobs estimate provided above does not account for additional
spending in related downstream industries except for those industries that directly benefit from
increased spending by broadband input providers. Yet broadband investment and higher
broadband penetration have been shown to create additional, or “spillover” effects in myriad
downstream industries, including in healthcare,49 education,50 and energy,51 whose ability to
enrich and enhance their service offerings is increased by greater availability of broadband
49 M. Meyer, R. Kobb, & R. Ryan, Virtually healthy: Chronic disease management in the home, 5 DISEASE
MANAGEMENT 87-94 (2002). 50 Working Party on Communication Infrastructures and Services Policy, Network Developments in Support of
Innovation and User Needs, Organization for Economic Cooperation and Development Dec. 2009 at 5 (Broadband is having a significant impact on education and e-learning by improving access to digital learning resources; encouraging communication among schools, teachers and pupils; promoting professional education for teachers; and linking local, regional, and national databases for administrative purposes or supervision.") available at http://www.olis.oecd.org/olis/2009doc.nsf/LinkTo/NT0000889E/$FILE/JT03275973.PDF.
51 See, e.g., Justin Horner, Telework: Saving Gas and Reducing Traffic from the Comfort of your Home, Mobility Choice, available at http://www.mobilitychoice.org/MCtelecommuting.pdf (“By taking more than 4.7 million cars off the road every day, telecommuting already has a positive effect on congestion.”); Ted Balaker, The Quiet Success: Telecommuting’s Impact on Transportation and Beyond, Reason, Nov. 2005, available at http://reason.org/files/853263d6e320c39bfcedde642d1e16fe.pdf (“In fact, an analysis of Washington D.C. commuting by George Mason University’s Laurie Schintler found that traffic delays would drop by 10 percent for every 3 percent of commuters who work at home.”); Joseph Fuhr and Stephen Pociask, Broadband and Telecommuting: Helping the U.S. Environment and the Economy, Low Carbon Economy, 2011, 41-47, available at http://file.scirp.org/Html/4227.html (“Studies show that telecommuters reduce daily trips on days that they telecommute by up to 51% and automobile travel by up to 77%. ”).
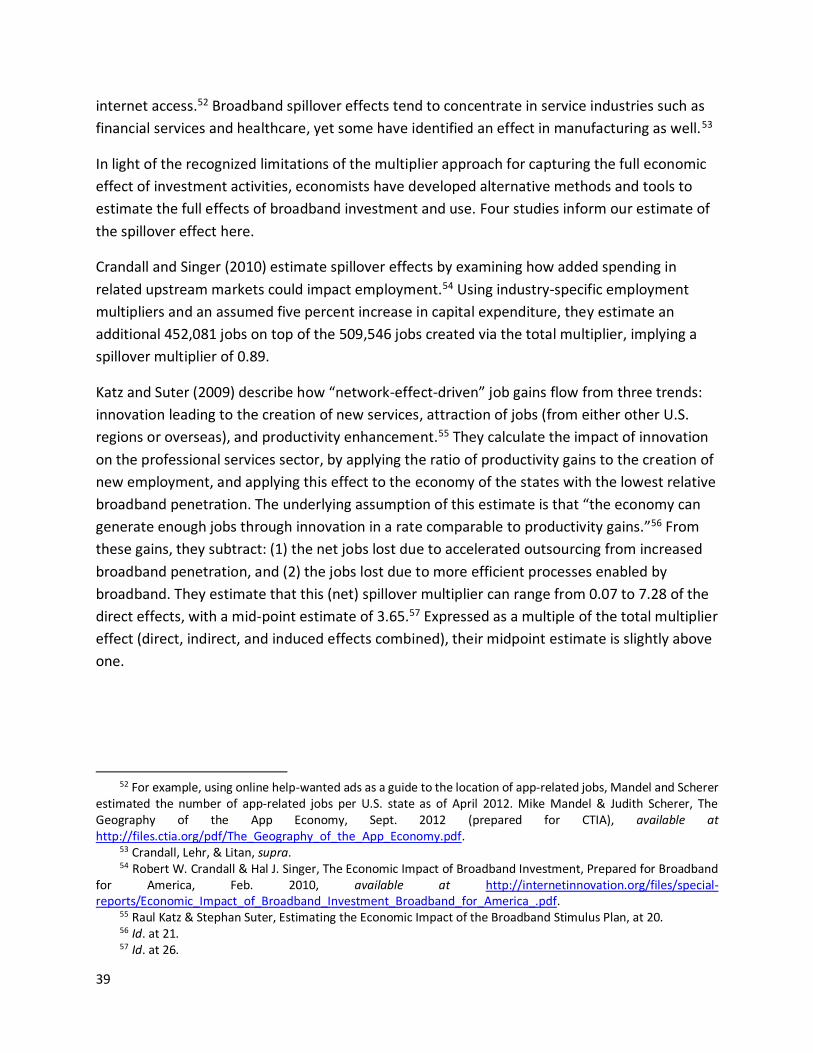
39
internet access.52 Broadband spillover effects tend to concentrate in service industries such as
financial services and healthcare, yet some have identified an effect in manufacturing as well.53
In light of the recognized limitations of the multiplier approach for capturing the full economic
effect of investment activities, economists have developed alternative methods and tools to
estimate the full effects of broadband investment and use. Four studies inform our estimate of
the spillover effect here.
Crandall and Singer (2010) estimate spillover effects by examining how added spending in
related upstream markets could impact employment.54 Using industry-specific employment
multipliers and an assumed five percent increase in capital expenditure, they estimate an
additional 452,081 jobs on top of the 509,546 jobs created via the total multiplier, implying a
spillover multiplier of 0.89.
Katz and Suter (2009) describe how “network-effect-driven” job gains flow from three trends:
innovation leading to the creation of new services, attraction of jobs (from either other U.S.
regions or overseas), and productivity enhancement.55 They calculate the impact of innovation
on the professional services sector, by applying the ratio of productivity gains to the creation of
new employment, and applying this effect to the economy of the states with the lowest relative
broadband penetration. The underlying assumption of this estimate is that “the economy can
generate enough jobs through innovation in a rate comparable to productivity gains.”56 From
these gains, they subtract: (1) the net jobs lost due to accelerated outsourcing from increased
broadband penetration, and (2) the jobs lost due to more efficient processes enabled by
broadband. They estimate that this (net) spillover multiplier can range from 0.07 to 7.28 of the
direct effects, with a mid-point estimate of 3.65.57 Expressed as a multiple of the total multiplier
effect (direct, indirect, and induced effects combined), their midpoint estimate is slightly above
one.
52 For example, using online help-wanted ads as a guide to the location of app-related jobs, Mandel and Scherer
estimated the number of app-related jobs per U.S. state as of April 2012. Mike Mandel & Judith Scherer, The Geography of the App Economy, Sept. 2012 (prepared for CTIA), available at http://files.ctia.org/pdf/The_Geography_of_the_App_Economy.pdf.
53 Crandall, Lehr, & Litan, supra. 54 Robert W. Crandall & Hal J. Singer, The Economic Impact of Broadband Investment, Prepared for Broadband
for America, Feb. 2010, available at http://internetinnovation.org/files/special-reports/Economic_Impact_of_Broadband_Investment_Broadband_for_America_.pdf.
55 Raul Katz & Stephan Suter, Estimating the Economic Impact of the Broadband Stimulus Plan, at 20. 56 Id. at 21. 57 Id. at 26.
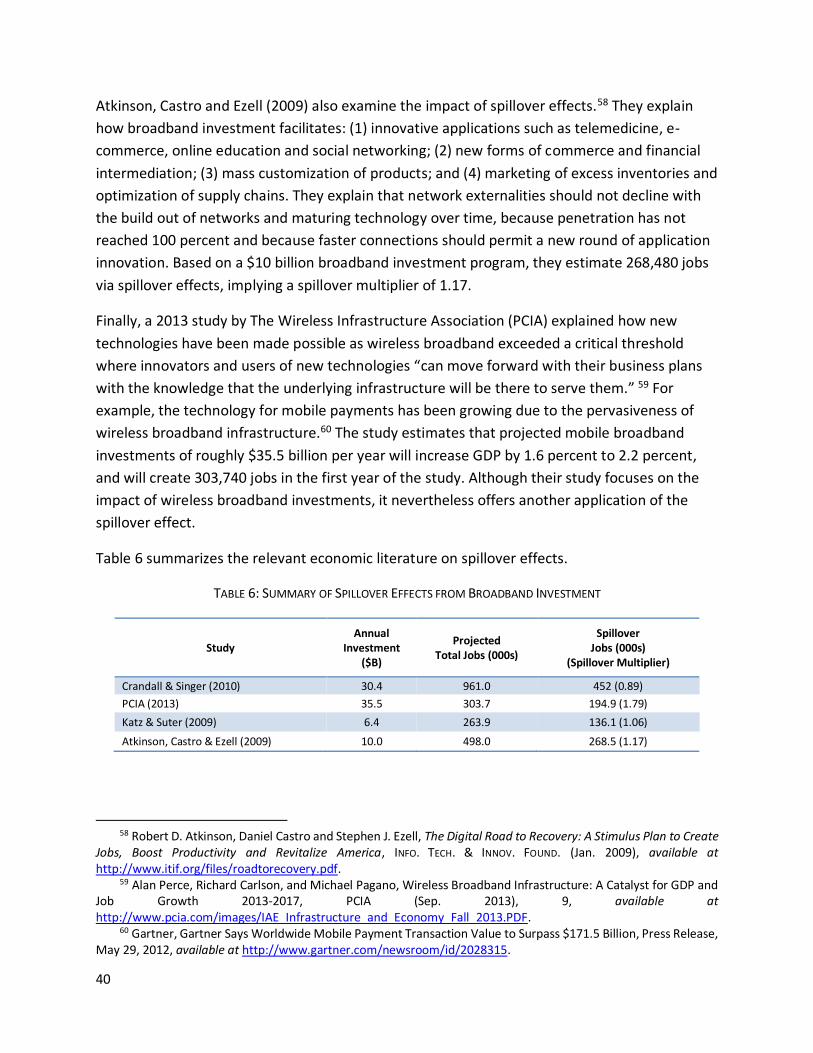
40
Atkinson, Castro and Ezell (2009) also examine the impact of spillover effects.58 They explain
how broadband investment facilitates: (1) innovative applications such as telemedicine, e-
commerce, online education and social networking; (2) new forms of commerce and financial
intermediation; (3) mass customization of products; and (4) marketing of excess inventories and
optimization of supply chains. They explain that network externalities should not decline with
the build out of networks and maturing technology over time, because penetration has not
reached 100 percent and because faster connections should permit a new round of application
innovation. Based on a $10 billion broadband investment program, they estimate 268,480 jobs
via spillover effects, implying a spillover multiplier of 1.17.
Finally, a 2013 study by The Wireless Infrastructure Association (PCIA) explained how new
technologies have been made possible as wireless broadband exceeded a critical threshold
where innovators and users of new technologies “can move forward with their business plans
with the knowledge that the underlying infrastructure will be there to serve them.” 59 For
example, the technology for mobile payments has been growing due to the pervasiveness of
wireless broadband infrastructure.60 The study estimates that projected mobile broadband
investments of roughly $35.5 billion per year will increase GDP by 1.6 percent to 2.2 percent,
and will create 303,740 jobs in the first year of the study. Although their study focuses on the
impact of wireless broadband investments, it nevertheless offers another application of the
spillover effect.
Table 6 summarizes the relevant economic literature on spillover effects.
TABLE 6: SUMMARY OF SPILLOVER EFFECTS FROM BROADBAND INVESTMENT
Study Annual
Investment ($B)
Projected Total Jobs (000s)
Spillover Jobs (000s)
(Spillover Multiplier)
Crandall & Singer (2010) 30.4 961.0 452 (0.89)
PCIA (2013) 35.5 303.7 194.9 (1.79)
Katz & Suter (2009) 6.4 263.9 136.1 (1.06)
Atkinson, Castro & Ezell (2009) 10.0 498.0 268.5 (1.17)
58 Robert D. Atkinson, Daniel Castro and Stephen J. Ezell, The Digital Road to Recovery: A Stimulus Plan to Create
Jobs, Boost Productivity and Revitalize America, INFO. TECH. & INNOV. FOUND. (Jan. 2009), available at http://www.itif.org/files/roadtorecovery.pdf.
59 Alan Perce, Richard Carlson, and Michael Pagano, Wireless Broadband Infrastructure: A Catalyst for GDP and Job Growth 2013-2017, PCIA (Sep. 2013), 9, available at http://www.pcia.com/images/IAE_Infrastructure_and_Economy_Fall_2013.PDF.
60 Gartner, Gartner Says Worldwide Mobile Payment Transaction Value to Surpass $171.5 Billion, Press Release, May 29, 2012, available at http://www.gartner.com/newsroom/id/2028315.

41
Given the consistency with which various researchers have used a spillover multiplier of slightly
over one additional network-induced job per every job created via the total multiplier, we
adopt the spillover estimate of one. Table 7 shows the results from combining the job gains
from total multiplier and spillover effects.
TABLE 7: TOTAL JOB CHANGE FROM FCC’S PROPOSED RULE CHANGES
National FTTP
Rollout
National 5G
Rollout
[A] Total CAPEX Incremental ($B) $45.30 $23.90
[B] Annual Investment Change ($B)
= [A]/5 $9.06 $4.78
[C] Total Job Multiplier
= [B]*Employment Multiplier 178,878 70,083
[D] Spillover Jobs
= [C] 178,878 70,083
[E] Total Jobs
= [C] + [D] 357,756 140,167
For example, under National 5G rollout scenario, the annual number of jobs gained through the
total multiplier is 70,083. Including spillover effects brings the total annual number of jobs
gained to 140,167.
Economic Output
Finally, one can measure the multiplicative effect of broadband investment on economic
output. This occurs because higher expenditures on broadband equipment—equivalent to
higher demand for the products of equipment manufacturers—cause equipment
manufacturers to hire more employees to meet the increased demand. The equipment
manufacturers’ incomes increase as well due to the increased expenditures, which, according
to the consumption function, will increase their consumption as well. The increased
consumption of equipment manufacturers will in turn increase the income and employment of
their suppliers. The income and employment of those suppliers will then increase, triggering
another round of spending.
Eisenach, Singer, and West estimate the weighted average output multipliers for FTTP
investment (3.1293),61 and for wireless investment (2.8739).
61 Eisenach, Singer, West, supra, at 8.
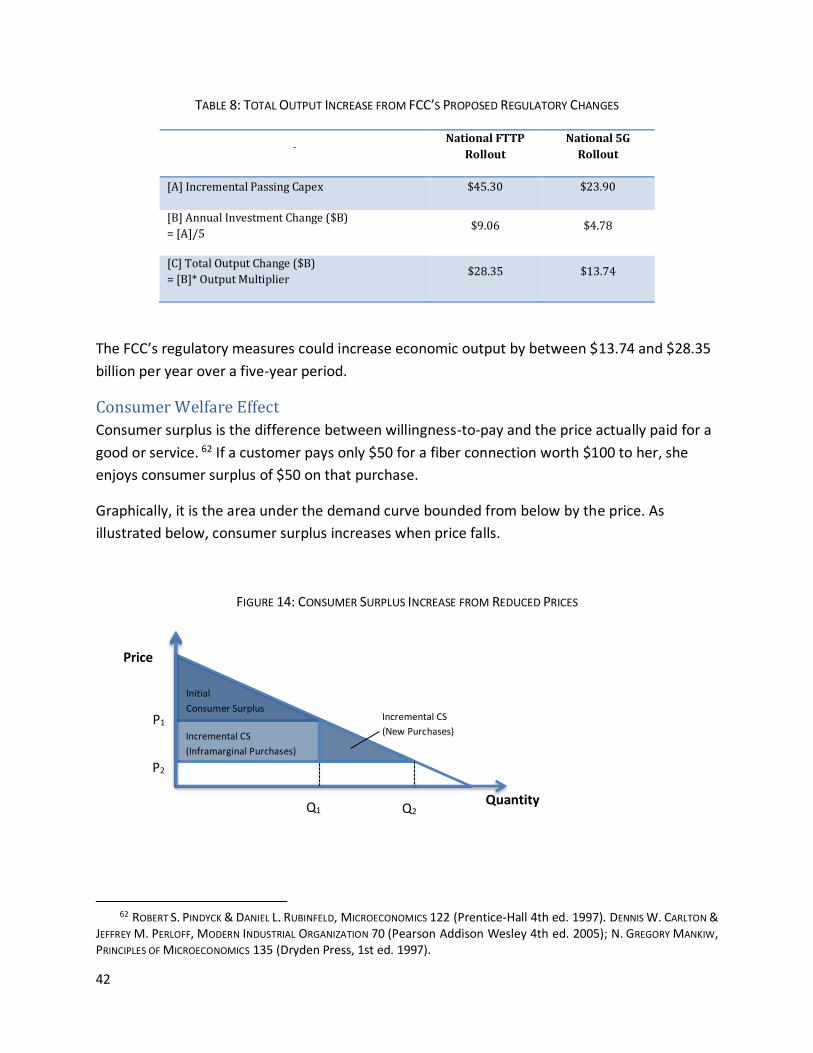
42
TABLE 8: TOTAL OUTPUT INCREASE FROM FCC’S PROPOSED REGULATORY CHANGES
National FTTP
Rollout
National 5G
Rollout
[A] Incremental Passing Capex $45.30 $23.90
[B] Annual Investment Change ($B)
= [A]/5 $9.06 $4.78
[C] Total Output Change ($B)
= [B]* Output Multiplier $28.35 $13.74
The FCC’s regulatory measures could increase economic output by between $13.74 and $28.35
billion per year over a five-year period.
Consumer Welfare Effect
Consumer surplus is the difference between willingness-to-pay and the price actually paid for a
good or service. 62 If a customer pays only $50 for a fiber connection worth $100 to her, she
enjoys consumer surplus of $50 on that purchase.
Graphically, it is the area under the demand curve bounded from below by the price. As
illustrated below, consumer surplus increases when price falls.
FIGURE 14: CONSUMER SURPLUS INCREASE FROM REDUCED PRICES
62 ROBERT S. PINDYCK & DANIEL L. RUBINFELD, MICROECONOMICS 122 (Prentice-Hall 4th ed. 1997). DENNIS W. CARLTON &
JEFFREY M. PERLOFF, MODERN INDUSTRIAL ORGANIZATION 70 (Pearson Addison Wesley 4th ed. 2005); N. GREGORY MANKIW, PRINCIPLES OF MICROECONOMICS 135 (Dryden Press, 1st ed. 1997).
Price
Quantity
Initial
Consumer Surplus P1
Q1
Incremental CS
(Inframarginal Purchases)
Incremental CS
(New Purchases)
Q2
P2
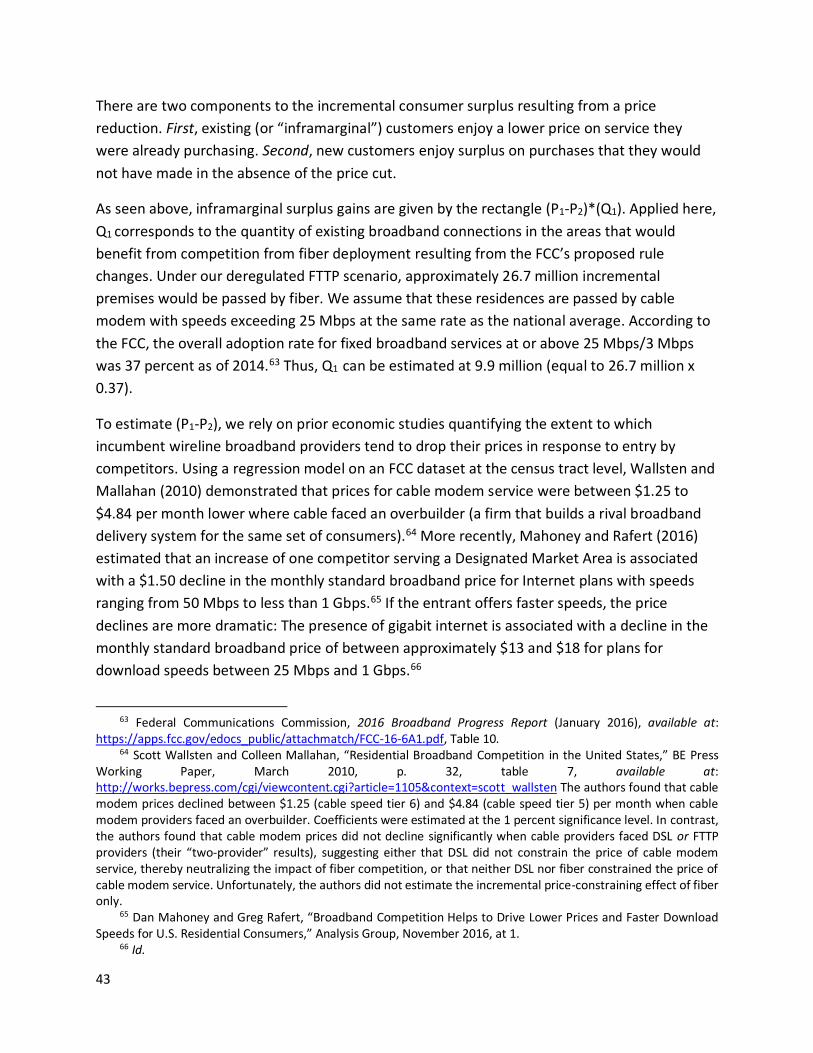
43
There are two components to the incremental consumer surplus resulting from a price
reduction. First, existing (or “inframarginal”) customers enjoy a lower price on service they
were already purchasing. Second, new customers enjoy surplus on purchases that they would
not have made in the absence of the price cut.
As seen above, inframarginal surplus gains are given by the rectangle (P1-P2)*(Q1). Applied here,
Q1 corresponds to the quantity of existing broadband connections in the areas that would
benefit from competition from fiber deployment resulting from the FCC’s proposed rule
changes. Under our deregulated FTTP scenario, approximately 26.7 million incremental
premises would be passed by fiber. We assume that these residences are passed by cable
modem with speeds exceeding 25 Mbps at the same rate as the national average. According to
the FCC, the overall adoption rate for fixed broadband services at or above 25 Mbps/3 Mbps
was 37 percent as of 2014.63 Thus, Q1 can be estimated at 9.9 million (equal to 26.7 million x
0.37).
To estimate (P1-P2), we rely on prior economic studies quantifying the extent to which
incumbent wireline broadband providers tend to drop their prices in response to entry by
competitors. Using a regression model on an FCC dataset at the census tract level, Wallsten and
Mallahan (2010) demonstrated that prices for cable modem service were between $1.25 to
$4.84 per month lower where cable faced an overbuilder (a firm that builds a rival broadband
delivery system for the same set of consumers).64 More recently, Mahoney and Rafert (2016)
estimated that an increase of one competitor serving a Designated Market Area is associated
with a $1.50 decline in the monthly standard broadband price for Internet plans with speeds
ranging from 50 Mbps to less than 1 Gbps.65 If the entrant offers faster speeds, the price
declines are more dramatic: The presence of gigabit internet is associated with a decline in the
monthly standard broadband price of between approximately $13 and $18 for plans for
download speeds between 25 Mbps and 1 Gbps.66
63 Federal Communications Commission, 2016 Broadband Progress Report (January 2016), available at:
https://apps.fcc.gov/edocs_public/attachmatch/FCC-16-6A1.pdf, Table 10. 64 Scott Wallsten and Colleen Mallahan, “Residential Broadband Competition in the United States,” BE Press
Working Paper, March 2010, p. 32, table 7, available at: http://works.bepress.com/cgi/viewcontent.cgi?article=1105&context=scott_wallsten The authors found that cable modem prices declined between $1.25 (cable speed tier 6) and $4.84 (cable speed tier 5) per month when cable modem providers faced an overbuilder. Coefficients were estimated at the 1 percent significance level. In contrast, the authors found that cable modem prices did not decline significantly when cable providers faced DSL or FTTP providers (their “two-provider” results), suggesting either that DSL did not constrain the price of cable modem service, thereby neutralizing the impact of fiber competition, or that neither DSL nor fiber constrained the price of cable modem service. Unfortunately, the authors did not estimate the incremental price-constraining effect of fiber only.
65 Dan Mahoney and Greg Rafert, “Broadband Competition Helps to Drive Lower Prices and Faster Download Speeds for U.S. Residential Consumers,” Analysis Group, November 2016, at 1.
66 Id.
44
Accordingly, (P1-P2) is estimated to range from $1.25 to $18 per month. Applying this range, the
incremental consumer welfare gains to inframarginal broadband customers can be estimated at
between $12.3 million per month (equal to $1.25 x 9.9 million) to $177.8 million per month
(equal to $18 x 9.9 million).
As seen above, the incremental consumer welfare gains to marginal broadband customers
depends on Q2, the quantity of new broadband connections resulting from deregulation. In
particular, they are given by the triangle ½*(P1-P2)*( Q2-Q1). This depends on the elasticity of
demand for broadband service, which has been estimated at between -1.46 and -2.75.67 For
purposes of these calculations, we use a midpoint value of -2.1.
Assuming an average monthly broadband price of approximately $74,68 the price effects noted
above can be expressed (in percentage terms) between 1.7 percent (equal to $1.25/$74) and
24.3 percent (equal to $18/$74). The percentage change in quantity resulting from these price
effects can be estimated at between 3.5 percent (equal to 1.7 x 2.1) and 51.0 percent (equal to
24.3 x 2.1). Thus, the incremental welfare gains from new customers can be estimated at
between $0.2 million per month (equal to 0.5 x $1.25 x 9.9 million x 0.035) and $45.4 million
per month (equal to 0.5 x $18 x 9.9 million x 0.51).
Table 9 summarizes these calculations and presents the figures in annual terms.
67 See Austan Goolsbee, The Value of Broadband and the Deadweight Loss of Taxing New Technology, 5(1)
CONTRIBUTIONS TO ECONOMIC ANALYSIS & POLICY (2006); see also Paul Rappoport et. al., Residential Demand for Access to the Internet in INTERNATIONAL HANDBOOK OF TELECOMMUNICATIONS ECONOMICS 55-72 (Edward Elgar 2002).
68 Mahoney and Rafert, supra, Table 2.
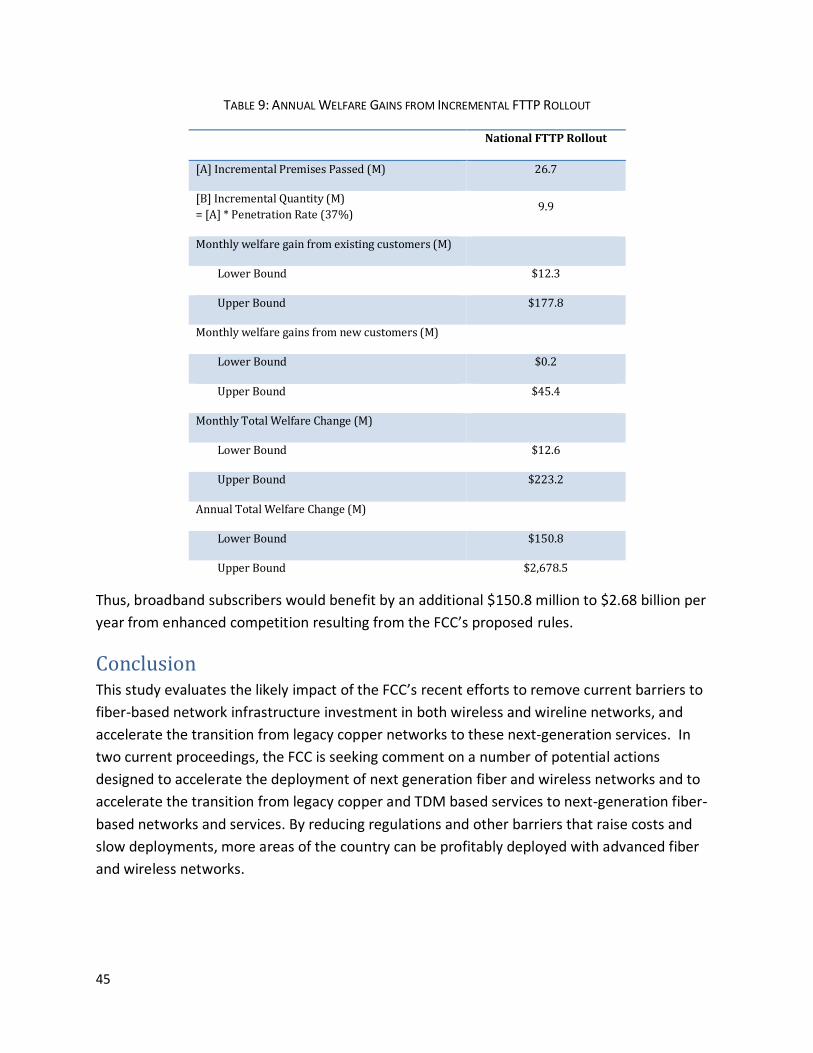
45
TABLE 9: ANNUAL WELFARE GAINS FROM INCREMENTAL FTTP ROLLOUT
National FTTP Rollout
[A] Incremental Premises Passed (M) 26.7
[B] Incremental Quantity (M)
= [A] * Penetration Rate (37%) 9.9
Monthly welfare gain from existing customers (M)
Lower Bound $12.3
Upper Bound $177.8
Monthly welfare gains from new customers (M)
Lower Bound $0.2
Upper Bound $45.4
Monthly Total Welfare Change (M)
Lower Bound $12.6
Upper Bound $223.2
Annual Total Welfare Change (M)
Lower Bound $150.8
Upper Bound $2,678.5
Thus, broadband subscribers would benefit by an additional $150.8 million to $2.68 billion per
year from enhanced competition resulting from the FCC’s proposed rules.
Conclusion This study evaluates the likely impact of the FCC’s recent efforts to remove current barriers to
fiber-based network infrastructure investment in both wireless and wireline networks, and
accelerate the transition from legacy copper networks to these next-generation services. In
two current proceedings, the FCC is seeking comment on a number of potential actions
designed to accelerate the deployment of next generation fiber and wireless networks and to
accelerate the transition from legacy copper and TDM based services to next-generation fiber-
based networks and services. By reducing regulations and other barriers that raise costs and
slow deployments, more areas of the country can be profitably deployed with advanced fiber
and wireless networks.