Embed Size (px)
Citation preview
© Vattenfall AB
Assessing the impact of releases of radionuclides into sewage systems in urban environment – simulation, modelling and experimental studies
Synnöve Sundell-BergmanVattenfall AB
© Vattenfall AB 2
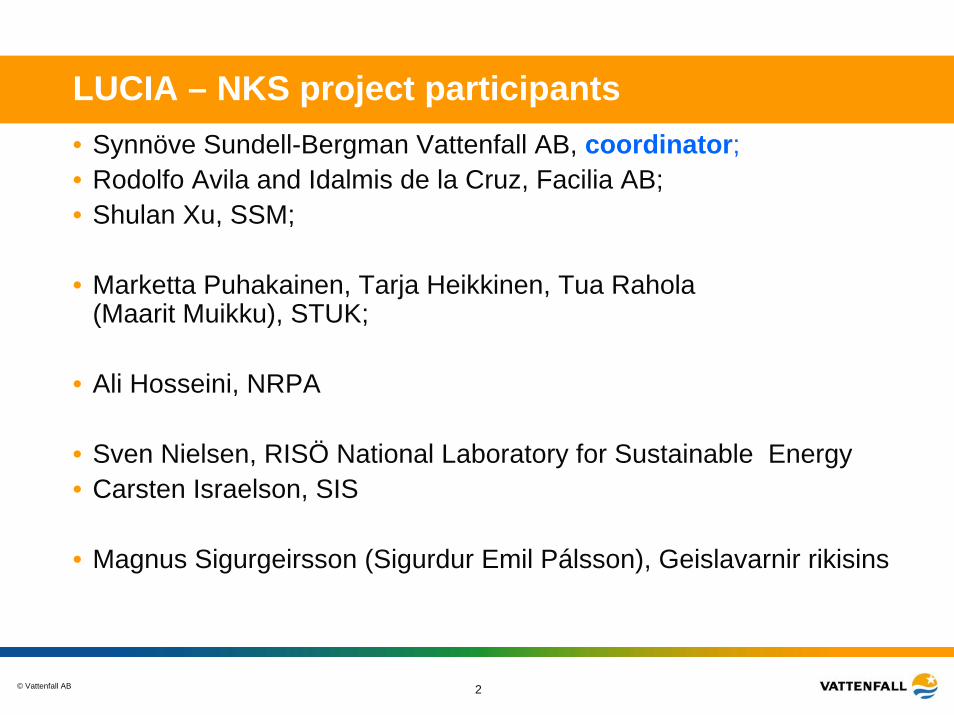
LUCIA – NKS project participants• Synnöve Sundell-Bergman Vattenfall AB, coordinator;• Rodolfo Avila and Idalmis de la Cruz, Facilia AB;• Shulan Xu, SSM;
• Marketta Puhakainen, Tarja Heikkinen, Tua Rahola (Maarit Muikku), STUK;
• Ali Hosseini, NRPA
• Sven Nielsen, RISÖ National Laboratory for Sustainable Energy• Carsten Israelson, SIS
• Magnus Sigurgeirsson (Sigurdur Emil Pálsson), Geislavarnir rikisins
© Vattenfall AB 3
LUCIA – the aim
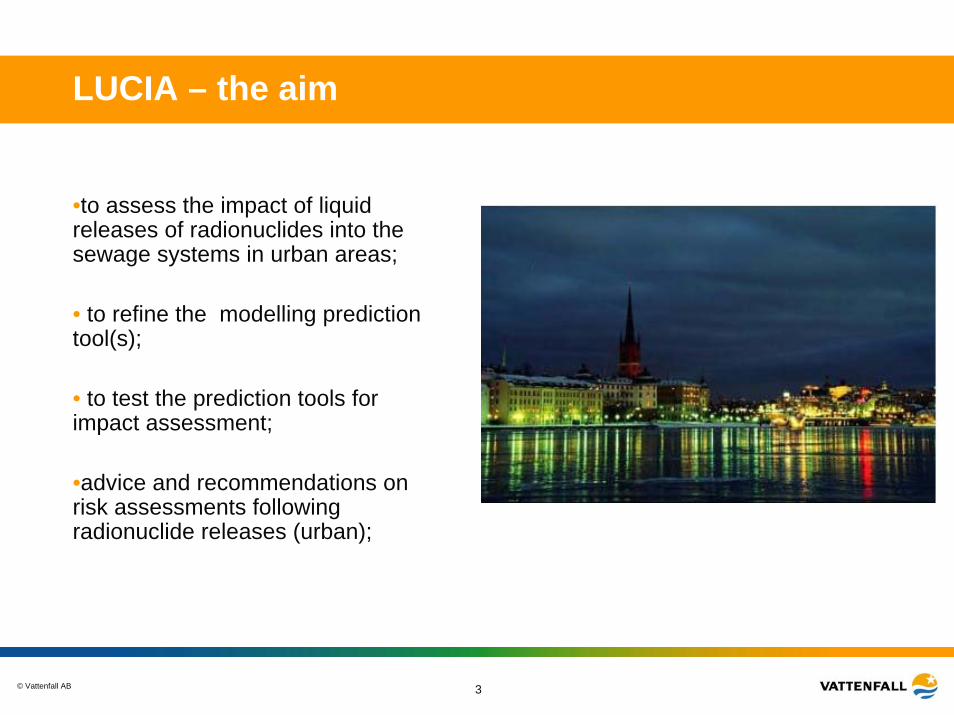
•to assess the impact of liquid releases of radionuclides into the sewage systems in urban areas;
• to refine the modelling prediction tool(s);
• to test the prediction tools for impact assessment;
•advice and recommendations on risk assessments following radionuclide releases (urban);

© Vattenfall AB 4
LUCIA - performance
•Predictions based on the model LUCIA
•Focus on the releases from hospitals
•Experimental studies conducted
•Dosimetric studies

© Vattenfall AB 5
Why focussing on the sewer system?
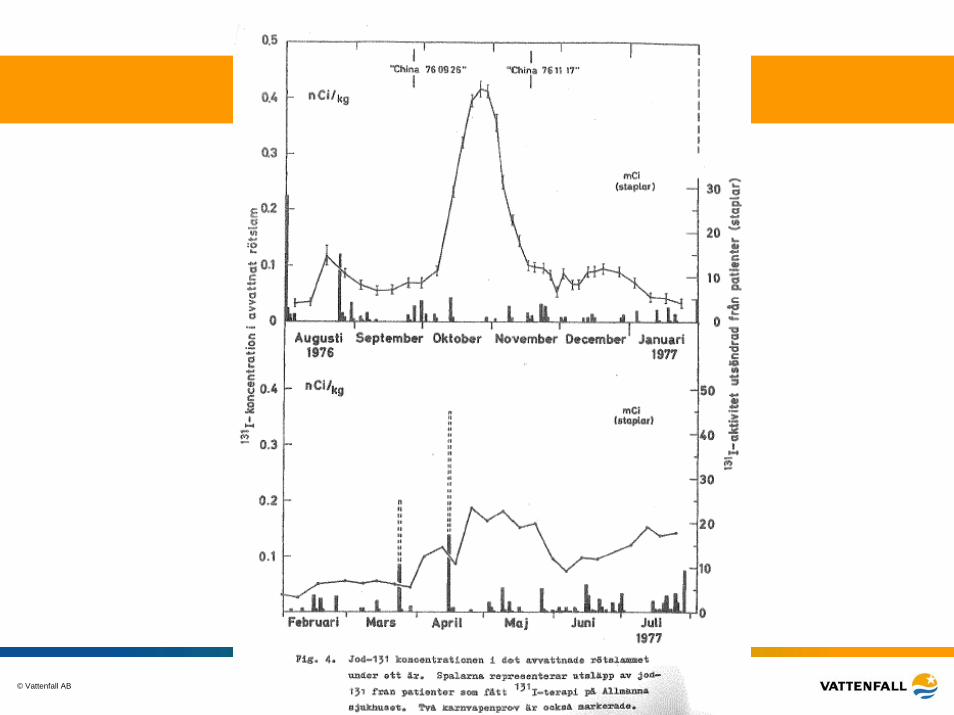
• Sewage sludge is a sensitive indicator of contaminants entering the environment (Erlandsson et al 1978 in Water Air and Soil Pollut.9.,);
• In urban areas wastewater transported to the sewage plant;
• Sewage system acts like a ”kidney” in urban areas;
• Patients treated in hospitals with radiopharmaceuticals;
• Contaminated excreta fed directly into the sewage systems;
© Vattenfall AB 6

© Vattenfall AB 7
60Co from the nuclear power station at Ringhals
Ingemansson, Mattsson and Erlandsson, 1981
© Vattenfall AB 8
LUCIA – presumptions
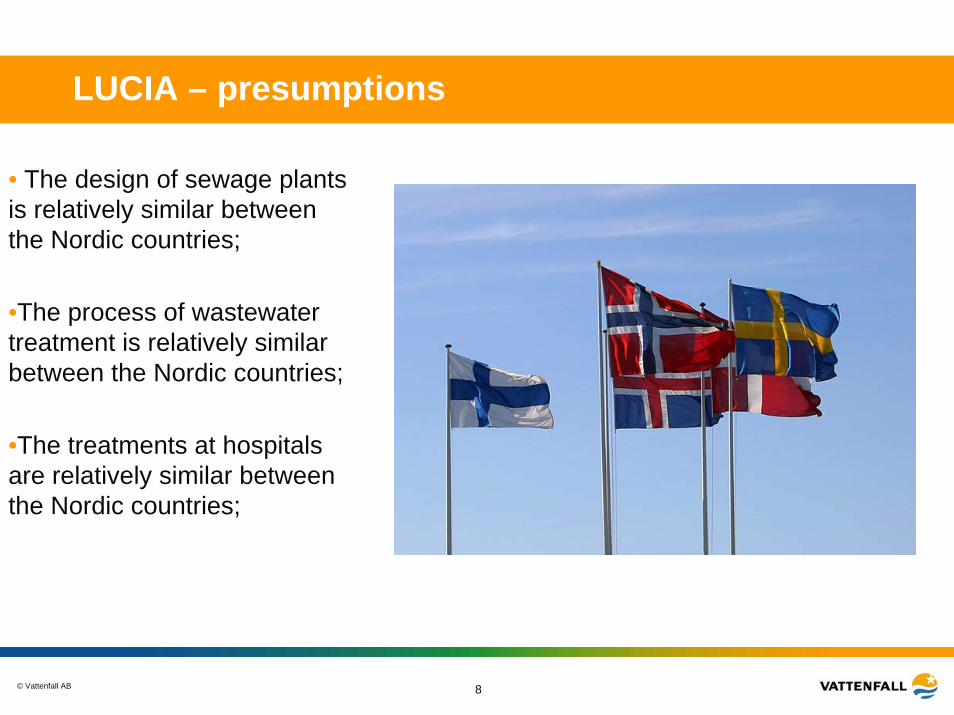
• The design of sewage plants is relatively similar between the Nordic countries;
•The process of wastewater treatment is relatively similar between the Nordic countries;
•The treatments at hospitals are relatively similar between the Nordic countries;
© Vattenfall AB 9
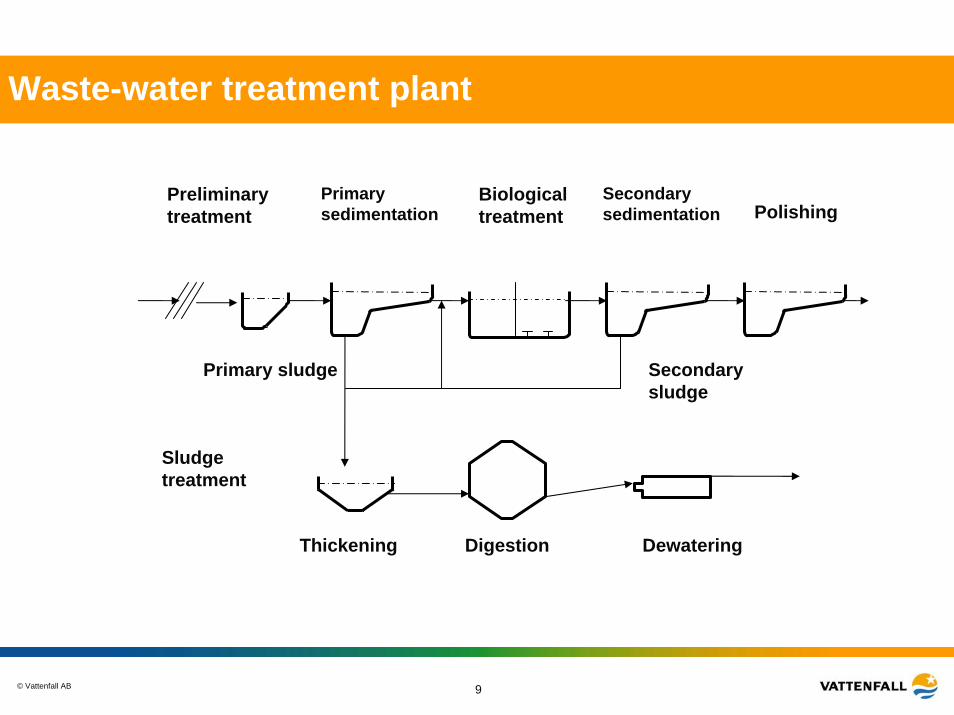
Waste-water treatment plant
Sludgetreatment
Thickening Digestion Dewatering
Preliminarytreatment
Primarysedimentation
Biologicaltreatment
Secondarysedimentation Polishing
Secondarysludge
Primary sludge
© Vattenfall AB 10
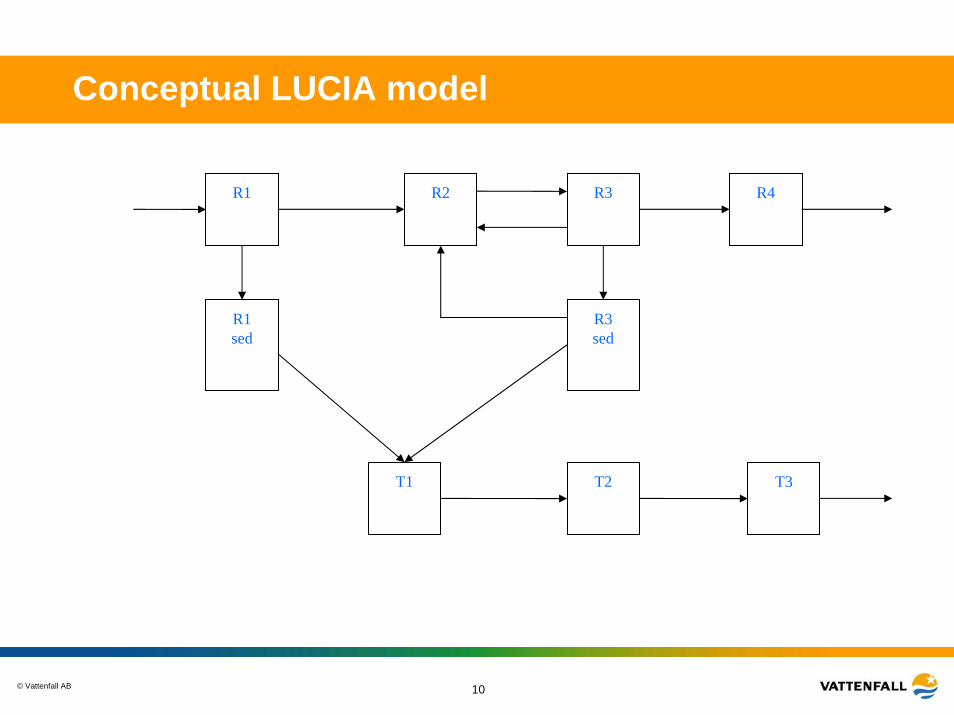
Conceptual LUCIA model
R1 R2 R3 R4
R3sed
R1sed
T1 T2 T3
© Vattenfall AB 11
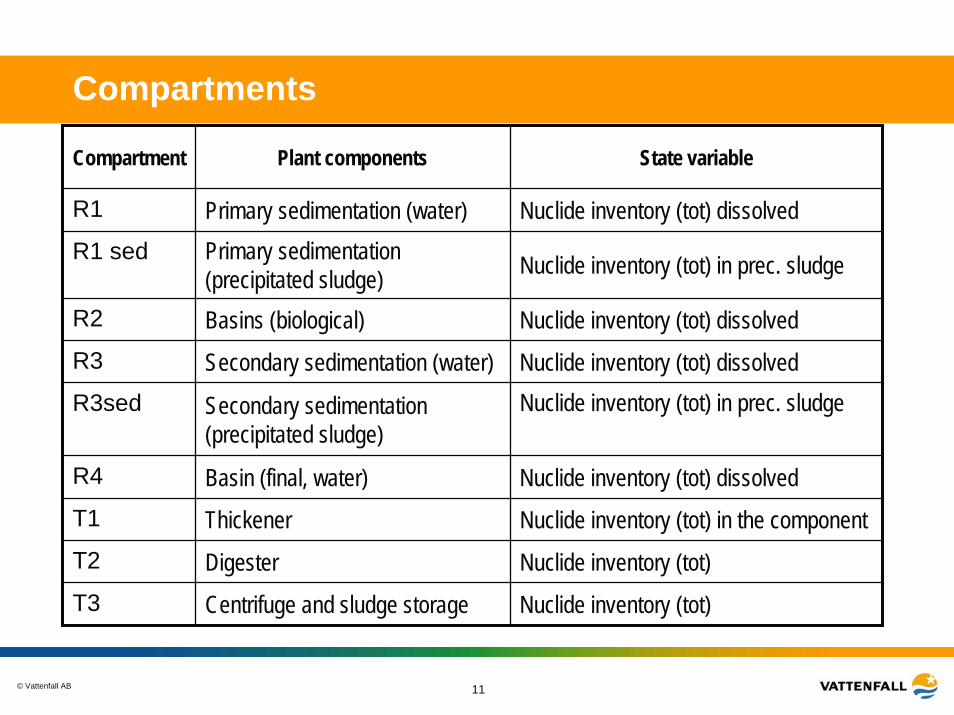
Compartments
Compartment Plant components State variable
R1 Primary sedimentation (water) Nuclide inventory (tot) dissolvedR1 sed Primary sedimentation
(precipitated sludge) Nuclide inventory (tot) in prec. sludge
R2 Basins (biological) Nuclide inventory (tot) dissolvedR3 Secondary sedimentation (water) Nuclide inventory (tot) dissolvedR3sed Secondary sedimentation
(precipitated sludge)Nuclide inventory (tot) in prec. sludge
R4 Basin (final, water) Nuclide inventory (tot) dissolvedT1 Thickener Nuclide inventory (tot) in the componentT2 Digester Nuclide inventory (tot)T3 Centrifuge and sludge storage Nuclide inventory (tot)

© Vattenfall AB 12
Model assumptions
• Compartment model -> instantaneously homogeneous mixing in compartments of matter entering
• Transfer from donor to acceptor compartment proportional to inventory in donor compartment
• The model assumes steady state conditions for the wastewater, solids and organic material in the system.
• Kd values for organic soil were used because of lack of literature values
• Distributions were assigned to model parameters
© Vattenfall AB 13
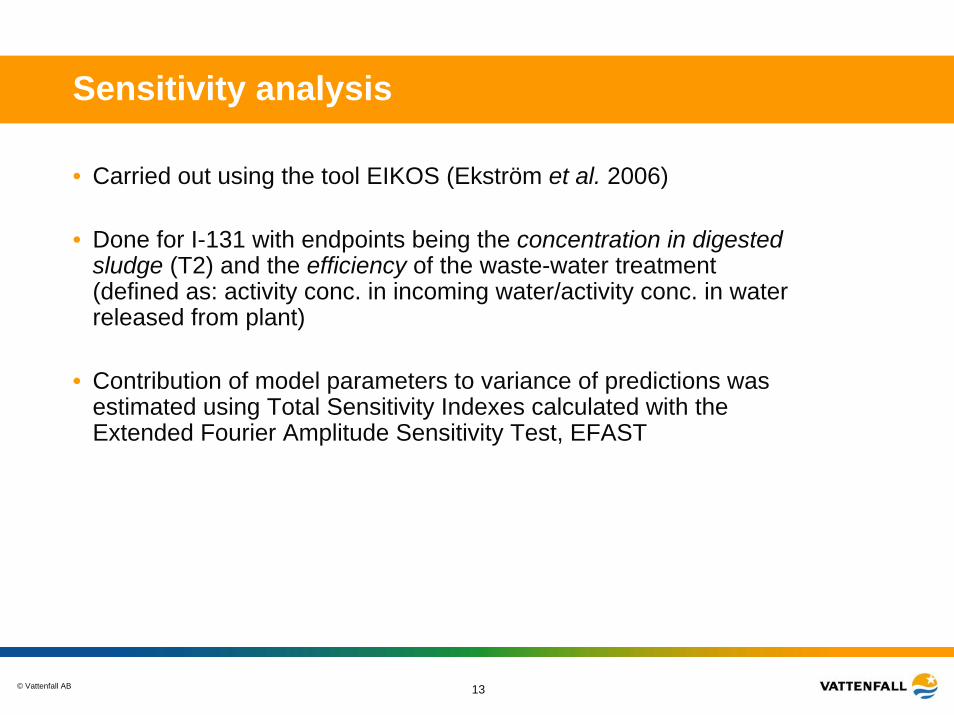
Sensitivity analysis
• Carried out using the tool EIKOS (Ekström et al. 2006)
• Done for I-131 with endpoints being the concentration in digestedsludge (T2) and the efficiency of the waste-water treatment(defined as: activity conc. in incoming water/activity conc. in water released from plant)
• Contribution of model parameters to variance of predictions wasestimated using Total Sensitivity Indexes calculated with the Extended Fourier Amplitude Sensitivity Test, EFAST

© Vattenfall AB 14
Kd-sensitivity
Spearman Rank correlation coefficient
© Vattenfall AB 15
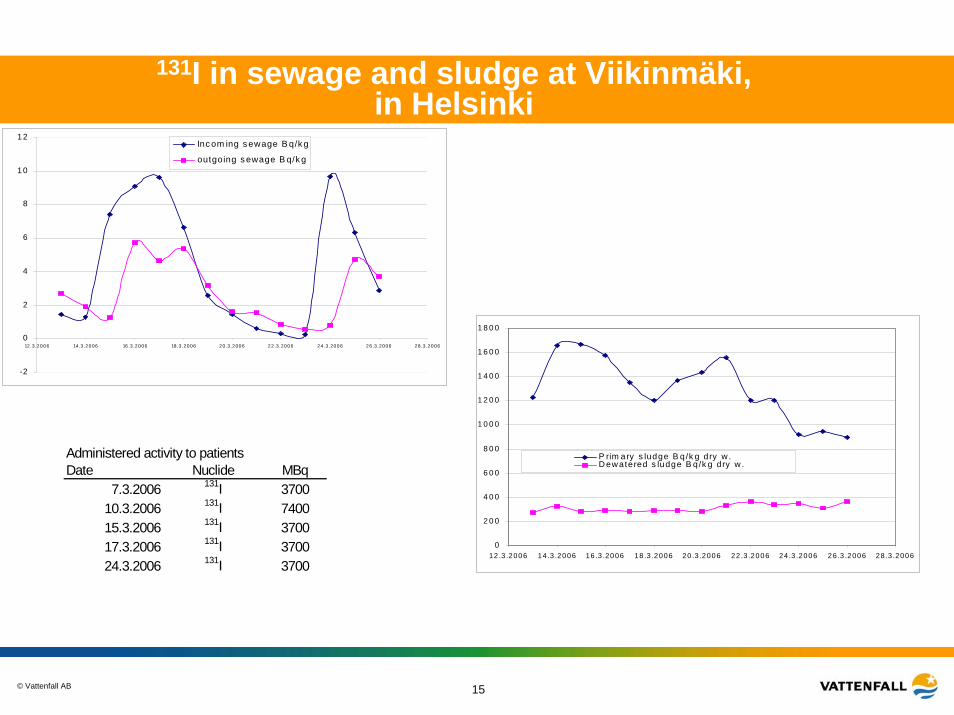
131I in sewage and sludge at Viikinmäki, in Helsinki
-2
0
2
4
6
8
1 0
1 2
12.3 .2006 14.3 .2006 16 .3 .2006 18 .3 .2006 20 .3 .2006 22.3 .2006 24.3 .2006 26.3 .2006 28 .3 .2006
Inc om ing s ewage B q/k g
outgoing s ewage B q/k g
0
2 0 0
4 0 0
6 0 0
8 0 0
1 0 0 0
1 2 0 0
1 4 0 0
1 6 0 0
1 8 0 0
12.3 .2006 14.3 .2006 16 .3 .2006 18.3 .2006 20.3 .2006 22.3 .2006 24.3 .2006 26.3 .2006 28.3 .2006
P rim ary s ludge B q/k g dry w .D ew atered s ludge B q/k g dry w .
Administered activity to patients Date Nuclide MBq
7.3.2006 131I 370010.3.2006 131I 740015.3.2006 131I 370017.3.2006 131I 370024.3.2006 131I 3700

© Vattenfall AB 16
Dose assessments
•Releases of Tc-99m and I-131
•Hypothetical individuals
•Sewage worker
•Member of the public exposed to water
•Member of the public exposed to contaminated sludge
•LUCIA model
•Parameter values from questionnaire and IAEA 2001.
© Vattenfall AB 17
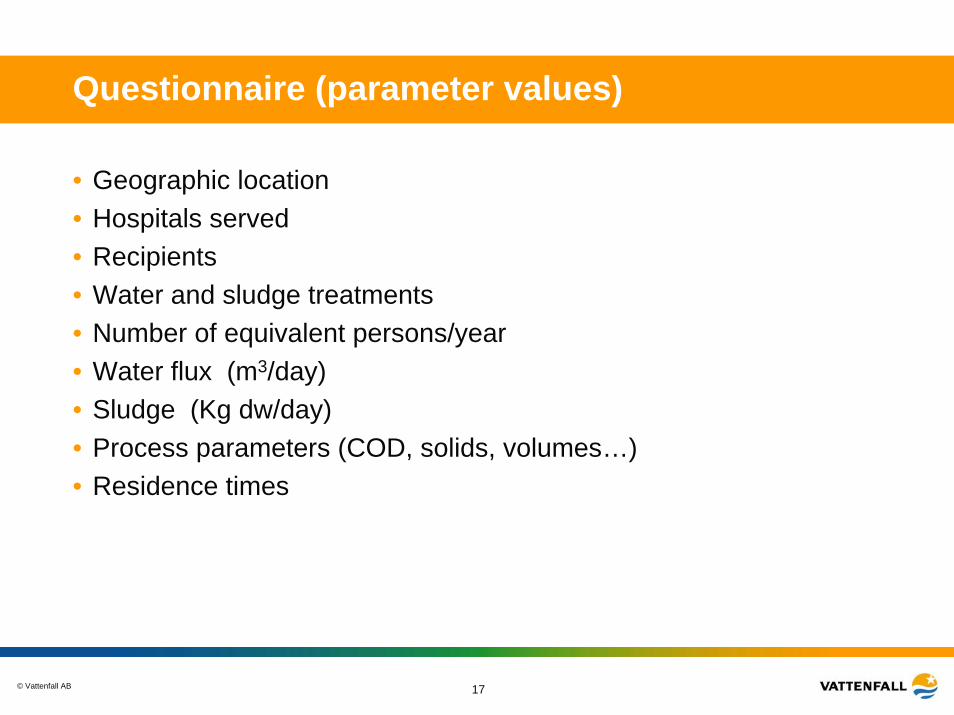
Questionnaire (parameter values)
• Geographic location• Hospitals served• Recipients• Water and sludge treatments• Number of equivalent persons/year• Water flux (m3/day)• Sludge (Kg dw/day)• Process parameters (COD, solids, volumes…)• Residence times

© Vattenfall AB 18
Annual release rates to the plants
Country Sweden Finland Norway Denmark Iceland Sewage plant
Kungsängverket Viikinmäki VEAS Vestfjorden avlöpsselskap
Renseanlaeg Vest
Skólpa Klettagardar
I-131 1.3E+111 7.3E+112 9.0E+113 2.2E+114 1.9E+115 Release rate, Bq/y Tc-99m 1.4E+121 2.4E+122 7.5E+123 - -

© Vattenfall AB 19
Concentrations in water and sludge (LUCIA)
Sewage plant Nuclide Cwater, Bq/m3 Csludge, Bq/kg dw
Tc-99m 5E+03 2,9E-01
I-131 6,6E+03 9,4E+01
Tc-99m 4,2E+03 3,7E-01
I-131 7E+03 9,4E+01
Tc-99m 5,9E+04 2,4E-01
I-131 8,1E+03 7,2E+01
Renseanlaeg Vest I-131 7,3E+03 8,8E+01
SkólpaKlettagardar I-131 6,1E+03 1,7E+02
VEAS Vestfjorden
Viikinmäki
Kungsängsverket
© Vattenfall AB 20
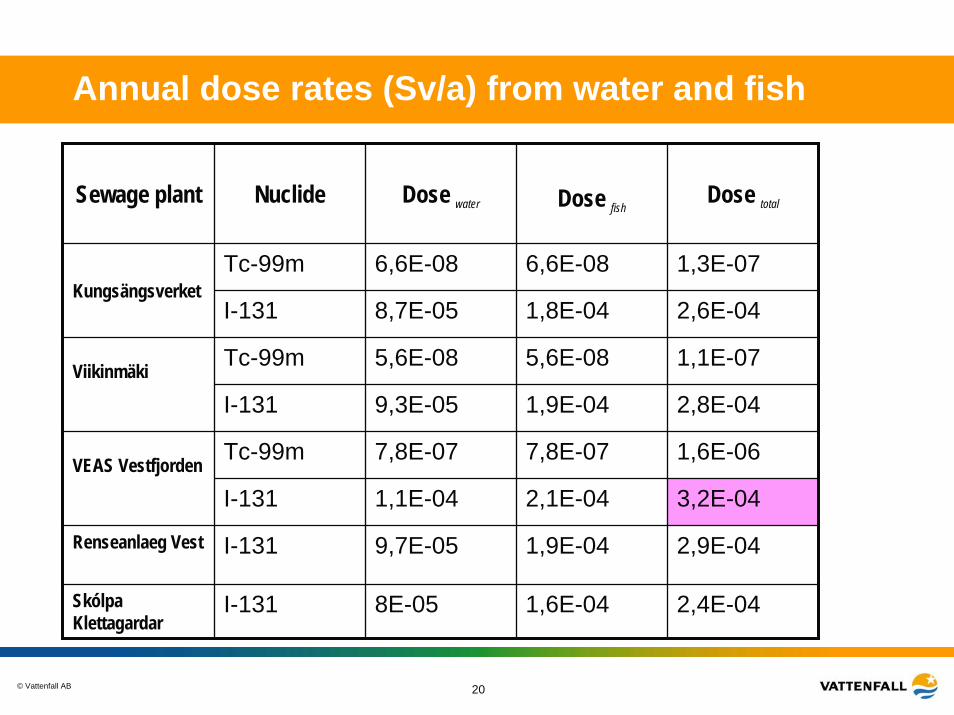
Annual dose rates (Sv/a) from water and fish
Sewage plant Nuclide Dose water Dose fishDose total
Tc-99m 6,6E-08 6,6E-08 1,3E-07
I-131 8,7E-05 1,8E-04 2,6E-04
Tc-99m 5,6E-08 5,6E-08 1,1E-07
I-131 9,3E-05 1,9E-04 2,8E-04
Tc-99m 7,8E-07 7,8E-07 1,6E-06
I-131 1,1E-04 2,1E-04 3,2E-04
Renseanlaeg Vest I-131 9,7E-05 1,9E-04 2,9E-04
SkólpaKlettagardar
I-131 8E-05 1,6E-04 2,4E-04
VEAS Vestfjorden
Viikinmäki
Kungsängsverket

© Vattenfall AB 21
Annual doserates (Sv/a) for sewage workers
Sewage plant Nuclide Dose ext Dose inhDose total
Tc-99m 4,3E-09 1,7E-16 4,3E-09
I-131 3,8E-06 3,3E-11 3,8E-06
Tc-99m 5,6E-09 2,2E-16 5,6E-09
I-131 3,8E-06 3,3E-11 3,8E-06
Tc-99m 3,6E-09 1,4E-16 3,6E-09
I-131 2,9E-06 2,6E-11 2,9E-06
Renseanlaeg Vest I-131 4,2E-06 3,6E-11 4,2E-06
SkólpaKlettagardar
I-131 7E-06 6E-11 7E-06
VEAS Vestfjorden
Viikinmäki
Kungsängsverket

© Vattenfall AB 22
Annual dose rates (Sv/a) related to farming
Sewage plant Nuclide Dosetotal, Sv/a
Tc-99m 1,3E-13
Kungsängverket, Sweden
I-131 2,0E-08
Tc-99m 1,7E-13
Viikinmäki, Finland
I-131 3,0E-08
Tc-99m 1,1E-13 VEAS Vestfjorden avlöpsselskap, Norway
I-131 2,3E-08
Renseanlaeg Vest, Denmark I-131 2,9E-08
Skólpa Klettagardar, Iceland I-131 6,4E-9
© Vattenfall AB 23
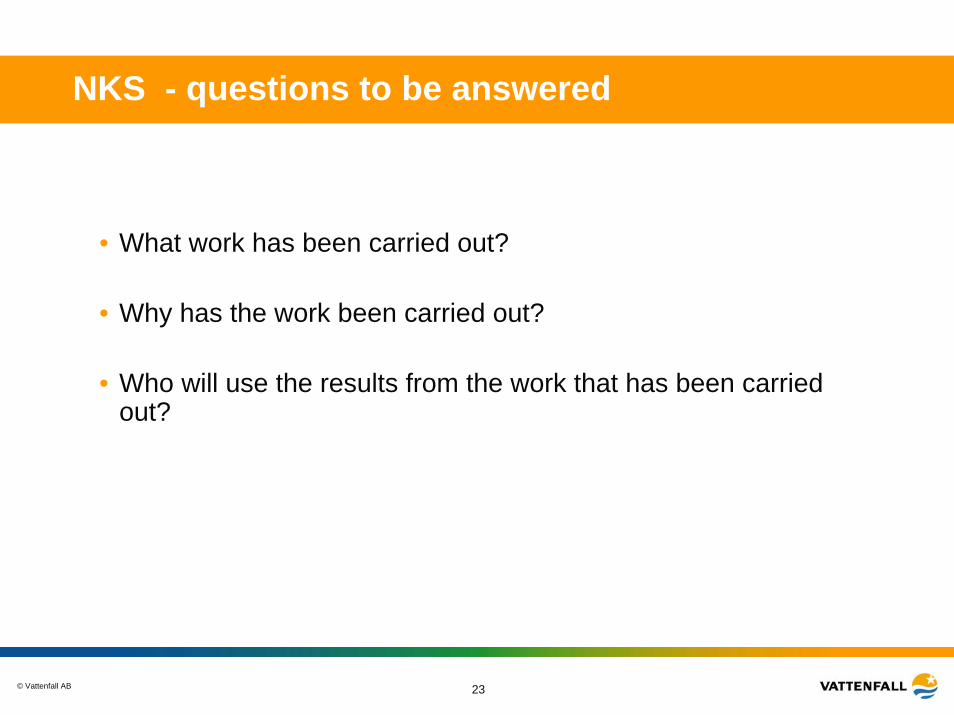
NKS - questions to be answered
• What work has been carried out?
• Why has the work been carried out?
• Who will use the results from the work that has been carried out?

© Vattenfall AB 24
Conclusion (model)
• Screening methodology not applicable (IAEA 2001)
• ”Realistic” assessments needed
• Requires many data, not always available
• A process orientated model was proposed
• Combine the Activated Sludge Model No.1 with LUCIA (Kd)
• Able to estimate concentrations and retention time of the sludge
© Vattenfall AB 25
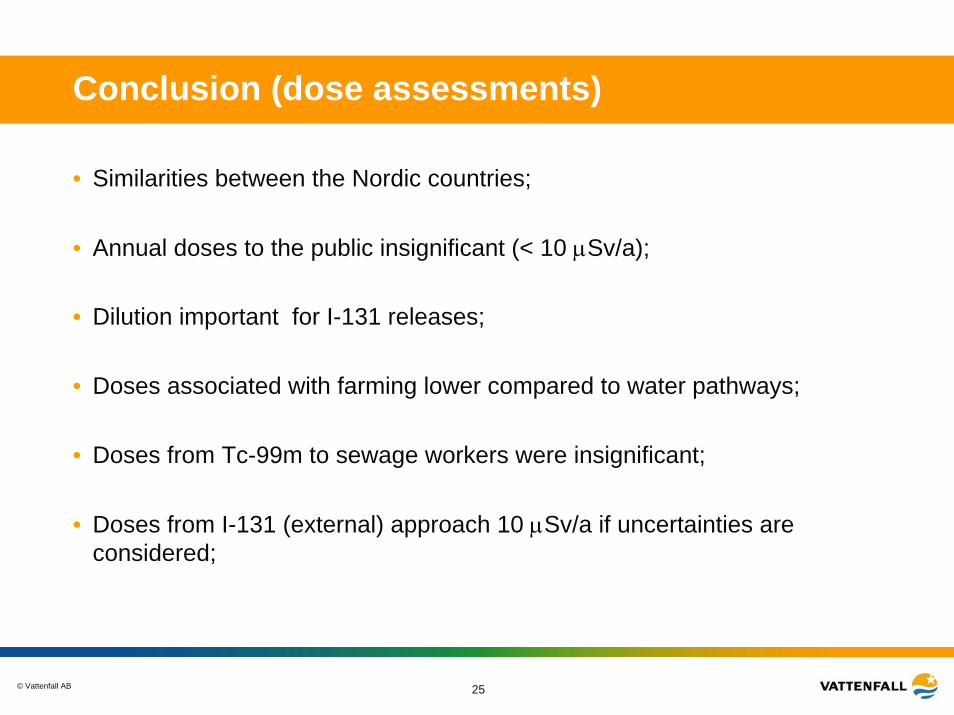
Conclusion (dose assessments)
• Similarities between the Nordic countries;
• Annual doses to the public insignificant (< 10 µSv/a);
• Dilution important for I-131 releases;
• Doses associated with farming lower compared to water pathways;
• Doses from Tc-99m to sewage workers were insignificant;
• Doses from I-131 (external) approach 10 µSv/a if uncertainties are considered;
© Vattenfall AB 26
Conclusions and current status• Many regulated discharges to sewer, and there are no limits
or the limits can be relatively high (> 1 TBq for radioiodine);
• Regulators have used very simple dose assessments tools in the past (MS Excel);
• The dose implications are generally very low (short lived);
• Further work to assess the partitioning of radionuclidesbetween sludge and effluent and to improve understanding of exposure of sewage workers;
• Require to demonstrate BAT for uses;
© Vattenfall AB 27
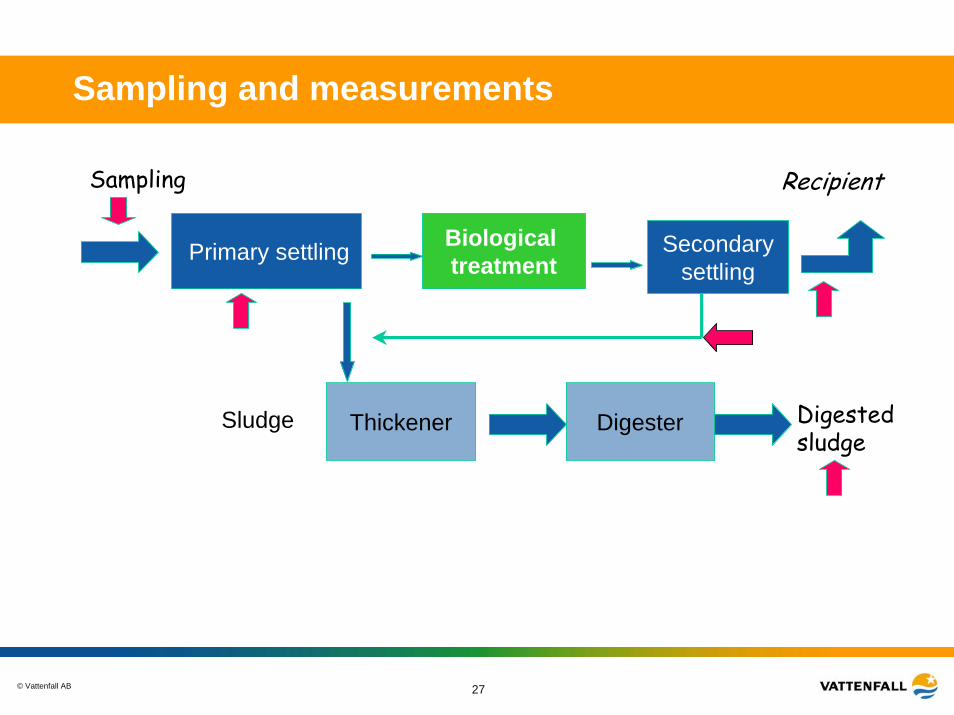
Sampling and measurements
Primary settling Secondarysettling
Biological treatment
Thickener DigesterSludge Digested sludge
RecipientSampling

© Vattenfall AB 28
Activities of 131I in sewage and sludge compares to the administered activities
Date Incoming Outgoing Primary Dewateredsewage sewage sludge sludge
MBq Form MBq d-1 MBq d-1 MBq d-1 MBq d-1
7.3.2006 3700 MIBG10.3.2006 7400 Iodide13.3.2006 287 533 73.8 16.614.3.2006 278 402 99.7 19.815.3.2006 3700 Iodide 1539 259 100.3 17.016.3.2006 1920 1210 94.9 17.617.3.2006 3700 Iodide 2097 1013 81.1 17.218.3.2006 1385 1118 72.3 17.319.3.2006 542 671 82.1 17.320.3.2006 305 341 86.2 17.021.3.2006 127 329 93.3 20.122.3.2006 61.6 180 72.4 22.123.3.2006 57.2 128 72.5 20.224.3.2006 3700 Iodide 2037 172 55.2 20.925.3.2006 1306 970 56.8 18.826.3.2006 597 769 54.1 21.9
Administered activity
© Vattenfall AB 29
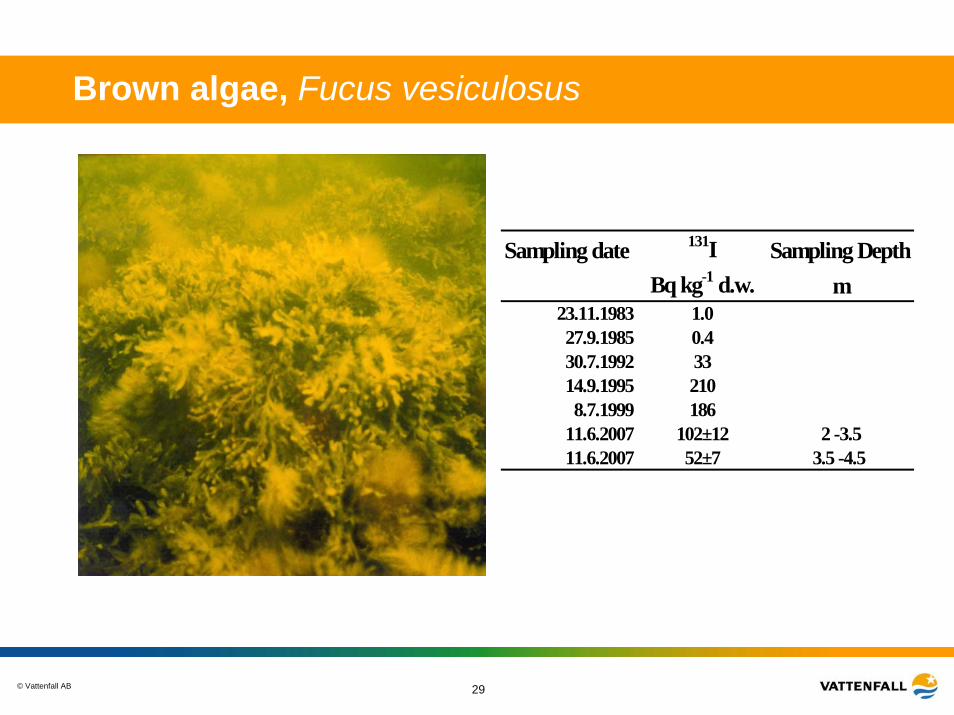
Brown algae, Fucus vesiculosus
Sampling date 131I Sampling DepthBq kg-1 d.w. m
23.11.1983 1.027.9.1985 0.430.7.1992 3314.9.1995 2108.7.1999 186
11.6.2007 102±12 2 -3.511.6.2007 52±7 3.5 -4.5
© Vattenfall AB 30
Thank you!
…and to NKS for financial and intellectual support
© Vattenfall AB 31
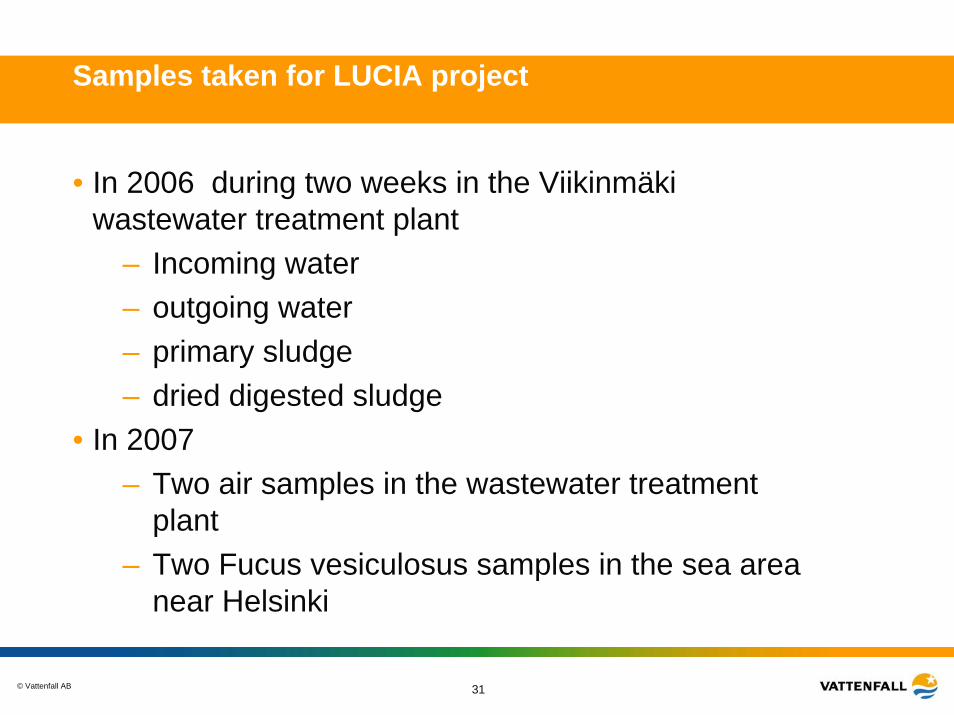
Samples taken for LUCIA project
• In 2006 during two weeks in the Viikinmäkiwastewater treatment plant
– Incoming water– outgoing water– primary sludge– dried digested sludge
• In 2007– Two air samples in the wastewater treatment
plant– Two Fucus vesiculosus samples in the sea area
near Helsinki
© Vattenfall AB 32
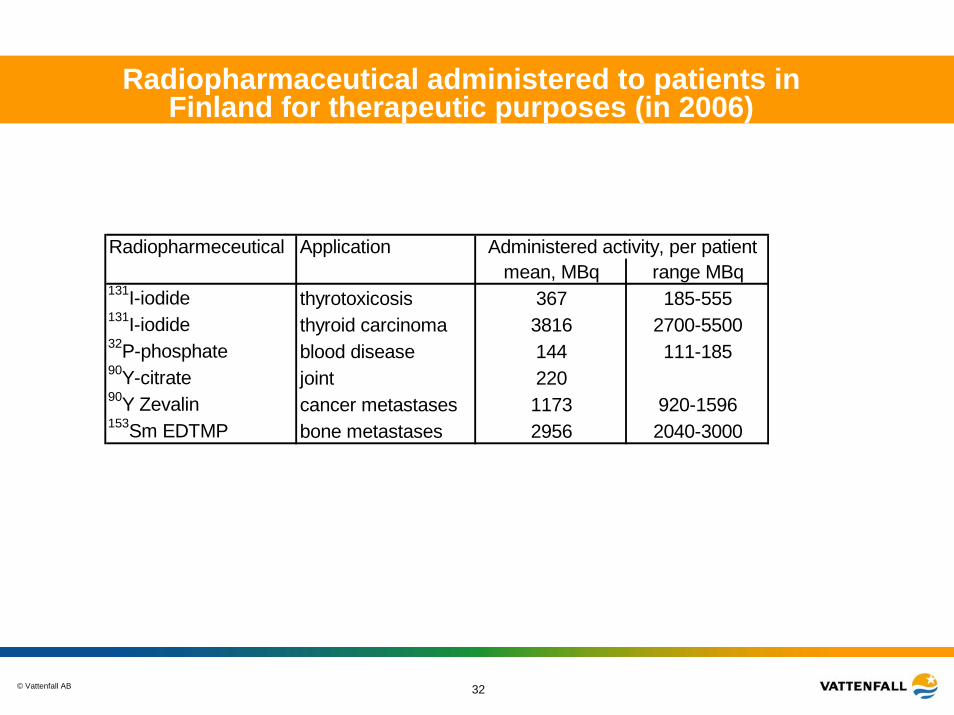
Radiopharmaceutical administered to patients in Finland for therapeutic purposes (in 2006)
Radiopharmeceutical Applicationmean, MBq range MBq
131I-iodide thyrotoxicosis 367 185-555131I-iodide thyroid carcinoma 3816 2700-550032P-phosphate blood disease 144 111-18590Y-citrate joint 22090Y Zevalin cancer metastases 1173 920-1596153Sm EDTMP bone metastases 2956 2040-3000
Administered activity, per patient
© Vattenfall AB 33
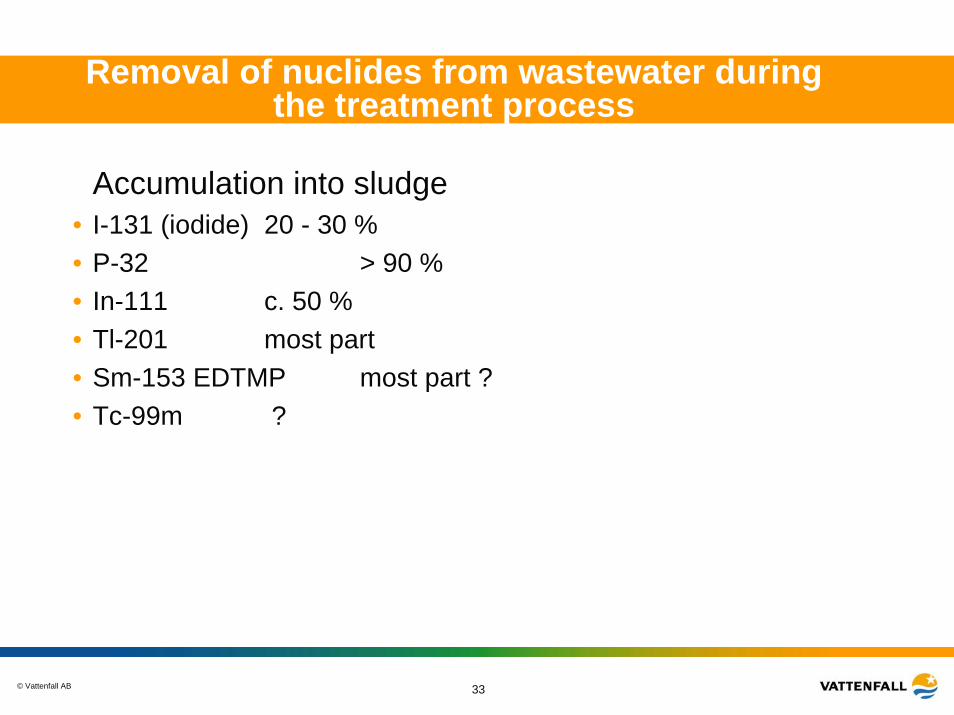
Removal of nuclides from wastewater during the treatment process
Accumulation into sludge• I-131 (iodide) 20 - 30 %• P-32 > 90 %• In-111 c. 50 %• Tl-201 most part• Sm-153 EDTMP most part ?• Tc-99m ?
© Vattenfall AB 34
Air samples
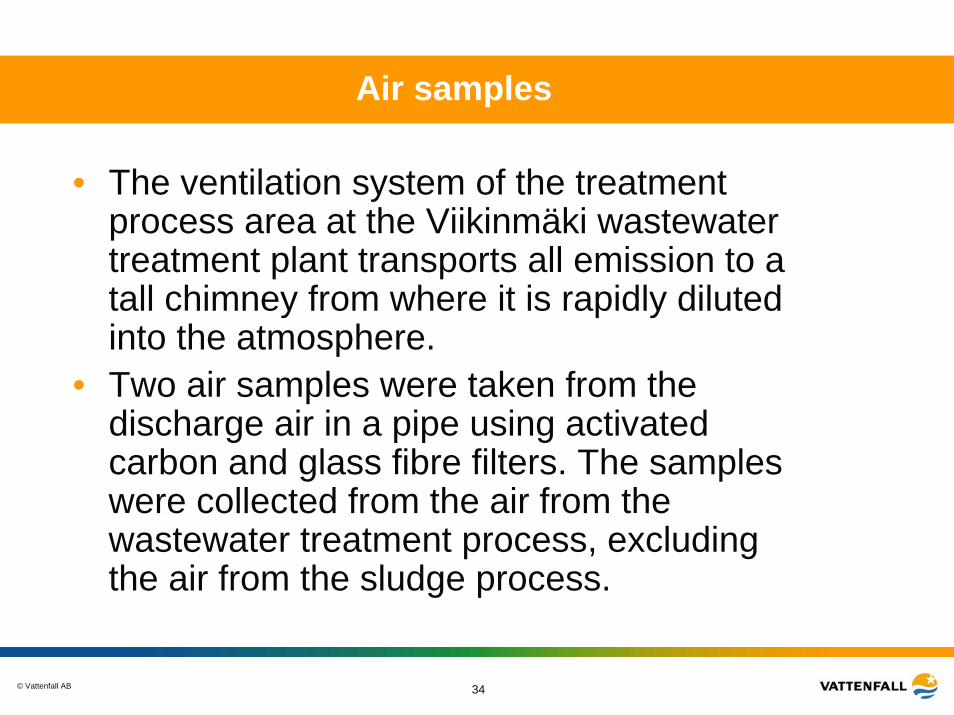
• The ventilation system of the treatment process area at the Viikinmäki wastewater treatment plant transports all emission to a tall chimney from where it is rapidly diluted into the atmosphere.
• Two air samples were taken from the discharge air in a pipe using activated carbon and glass fibre filters. The samples were collected from the air from the wastewater treatment process, excluding the air from the sludge process.
© Vattenfall AB 35
• The activated carbon and the filter were measured gammaspectrometrically in a plastic vial.
• A small amount of 131I was detected in the activated carbon filters.
• In the glass fibre filters the activity concentration of 131I was below the detection limit (MDA 53 - 116 µBq m-3).
© Vattenfall AB 36
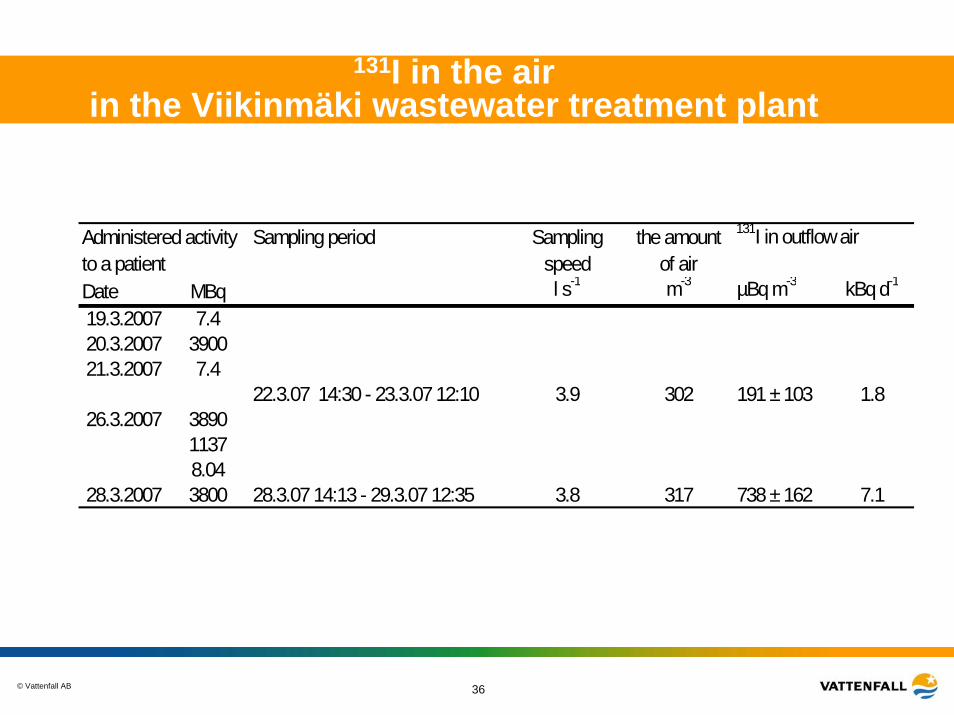
131I in the air in the Viikinmäki wastewater treatment plant
Administered activity Sampling period Sampling the amount 131I in outflow air to a patient speed of airDate MBq l s-1 m-3 µBq m-3 kBq d-1
19.3.2007 7.420.3.2007 390021.3.2007 7.4
22.3.07 14:30 - 23.3.07 12:10 3.9 302 191 ± 103 1.826.3.2007 3890
11378.04
28.3.2007 3800 28.3.07 14:13 - 29.3.07 12:35 3.8 317 738 ± 162 7.1
© Vattenfall AB 37
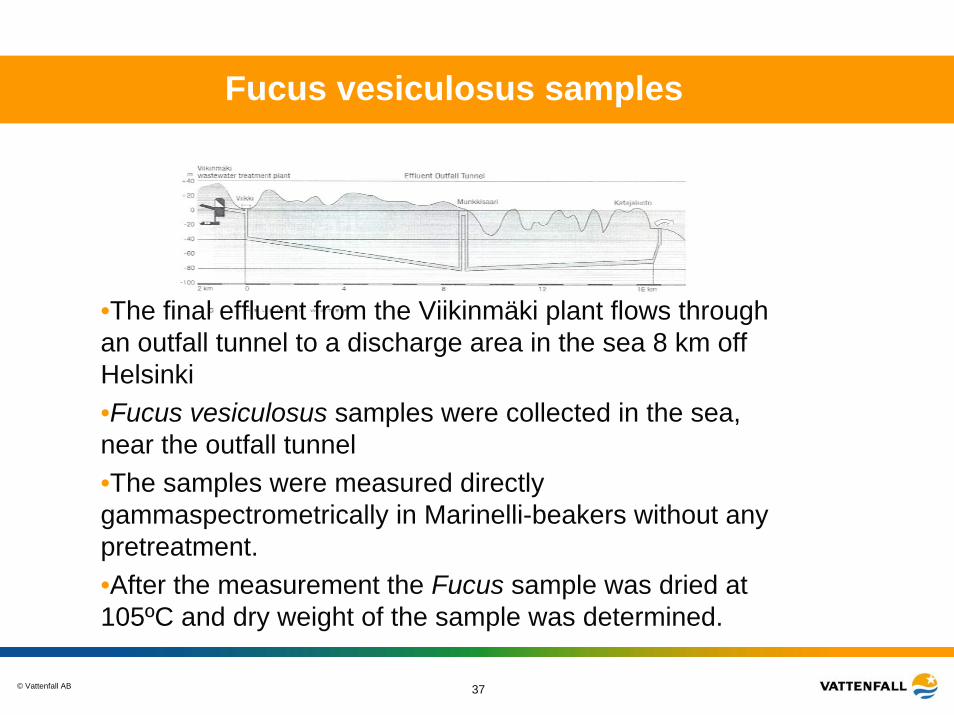
Fucus vesiculosus samples
•The final effluent from the Viikinmäki plant flows through an outfall tunnel to a discharge area in the sea 8 km off Helsinki•Fucus vesiculosus samples were collected in the sea, near the outfall tunnel •The samples were measured directly gammaspectrometrically in Marinelli-beakers without any pretreatment. •After the measurement the Fucus sample was dried at 105ºC and dry weight of the sample was determined.
© Vattenfall AB 38
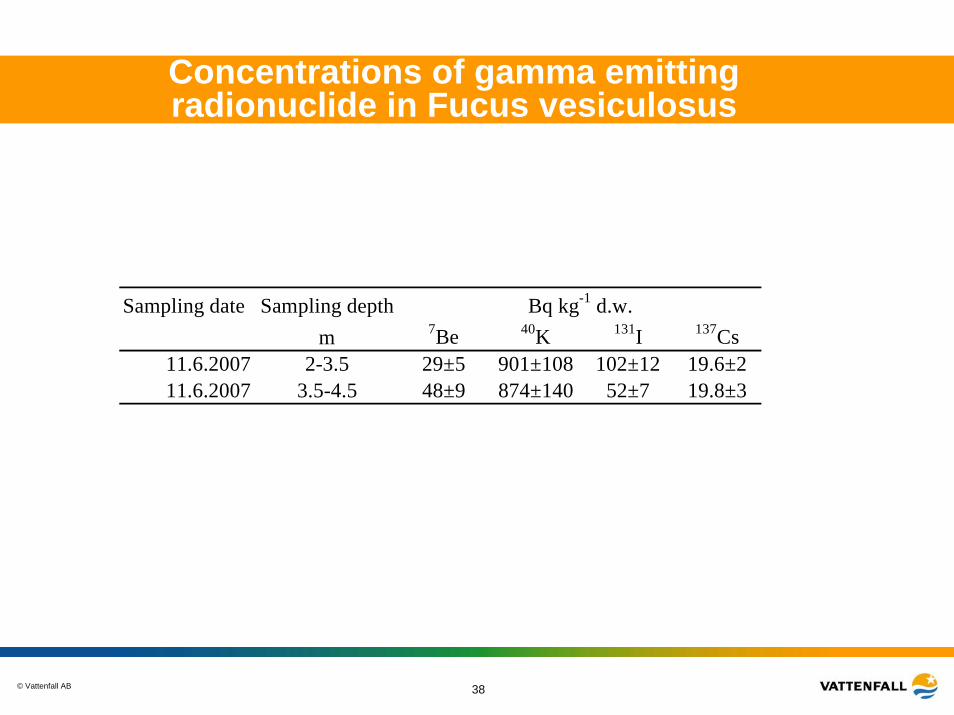
Concentrations of gamma emitting radionuclide in Fucus vesiculosus
Sampling date Sampling depthm 7Be 40K 131I 137Cs
11.6.2007 2-3.5 29±5 901±108 102±12 19.6±211.6.2007 3.5-4.5 48±9 874±140 52±7 19.8±3
Bq kg-1 d.w.

© Vattenfall AB 39
Study 2006 - 2007
• 6 samples daily for 13 days (13-29 Sep. 2006)
1. Water samples: incoming and outgoing
2. Sludge samples: primary and digested
• 24-hour composite samples, except for the weekends
• Totally 76 samples
• 9 TLD measurements (Sep. – Nov. 2007)
© Vattenfall AB 40
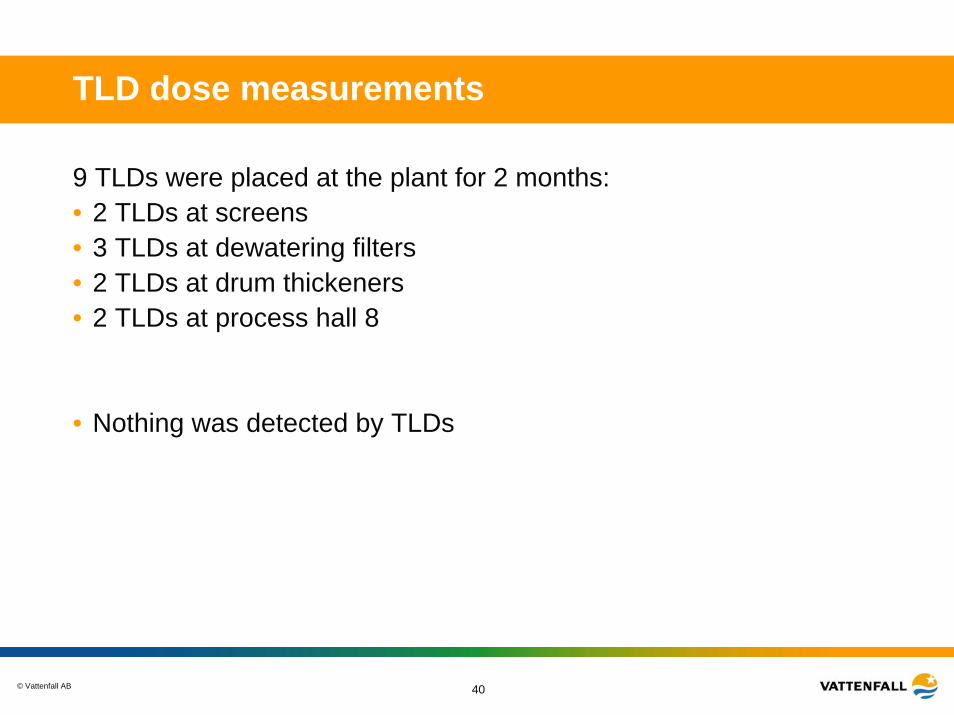
TLD dose measurements
9 TLDs were placed at the plant for 2 months:• 2 TLDs at screens• 3 TLDs at dewatering filters• 2 TLDs at drum thickeners• 2 TLDs at process hall 8
• Nothing was detected by TLDs
© Vattenfall AB 41
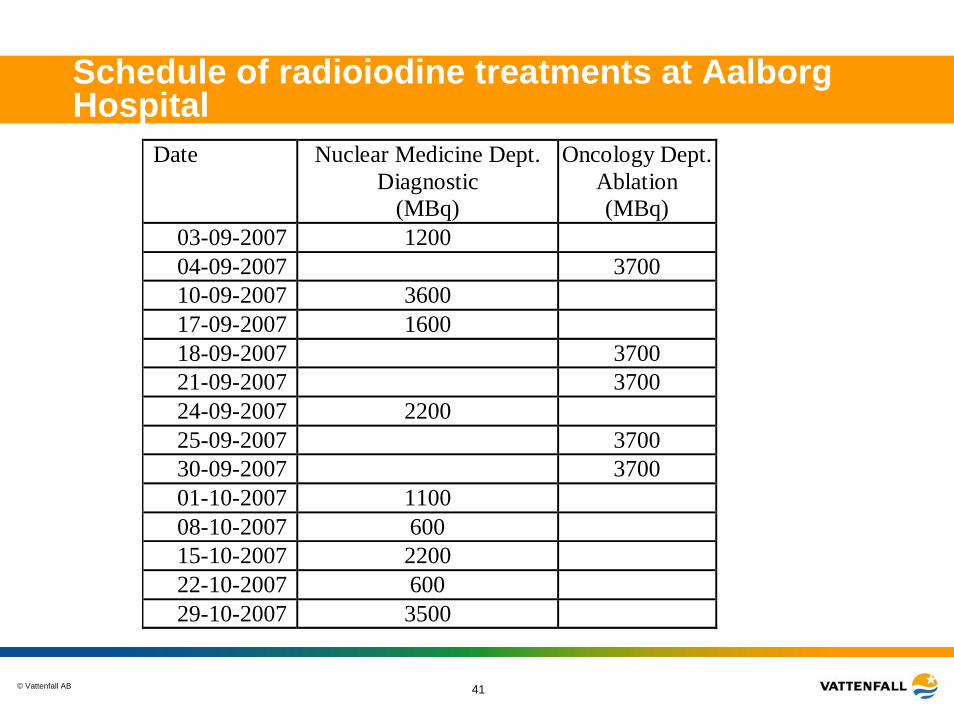
Schedule of radioiodine treatments at Aalborg Hospital
Date Nuclear Medicine Dept. Diagnostic
(MBq)
Oncology Dept.Ablation (MBq)
03-09-2007 1200 04-09-2007 3700 10-09-2007 3600 17-09-2007 1600 18-09-2007 3700 21-09-2007 3700 24-09-2007 2200 25-09-2007 3700 30-09-2007 3700 01-10-2007 1100 08-10-2007 600 15-10-2007 2200 22-10-2007 600 29-10-2007 3500
© Vattenfall AB 42
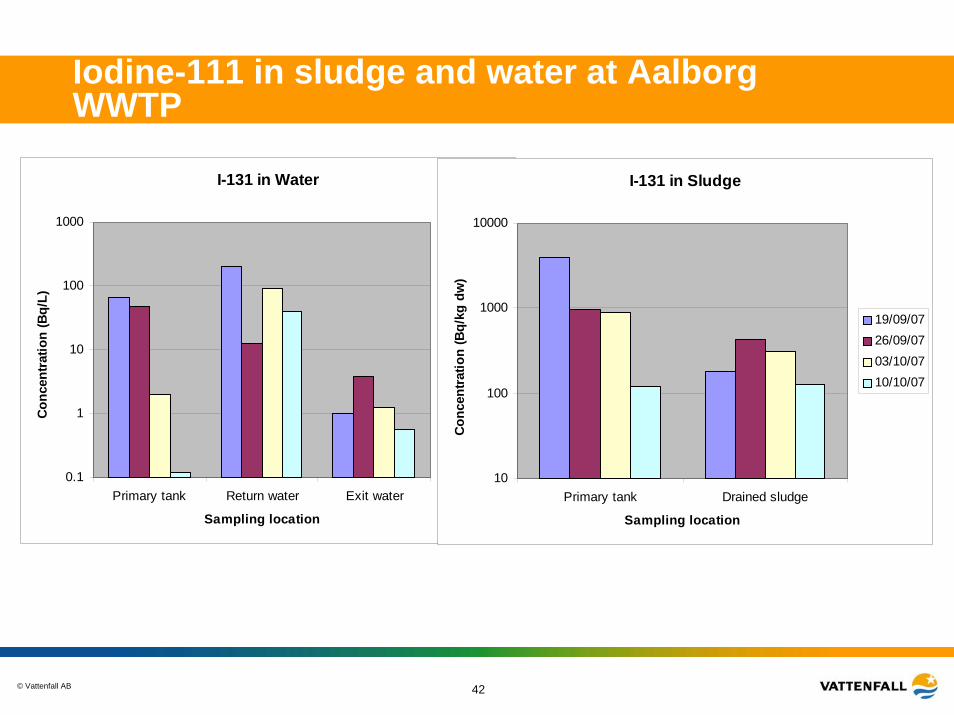
Iodine-111 in sludge and water at Aalborg WWTP
I-131 in Water
0.1
1
10
100
1000
Primary tank Return water Exit water
Sampling location
Con
cent
ratio
n (B
q/L)
19/09/0726/09/0703/10/0710/10/07
I-131 in Sludge
10
100
1000
10000
Primary tank Drained sludge
Sampling location
Con
cent
ratio
n (B
q/kg
dw
)
19/09/0726/09/0703/10/0710/10/07
© Vattenfall AB 43
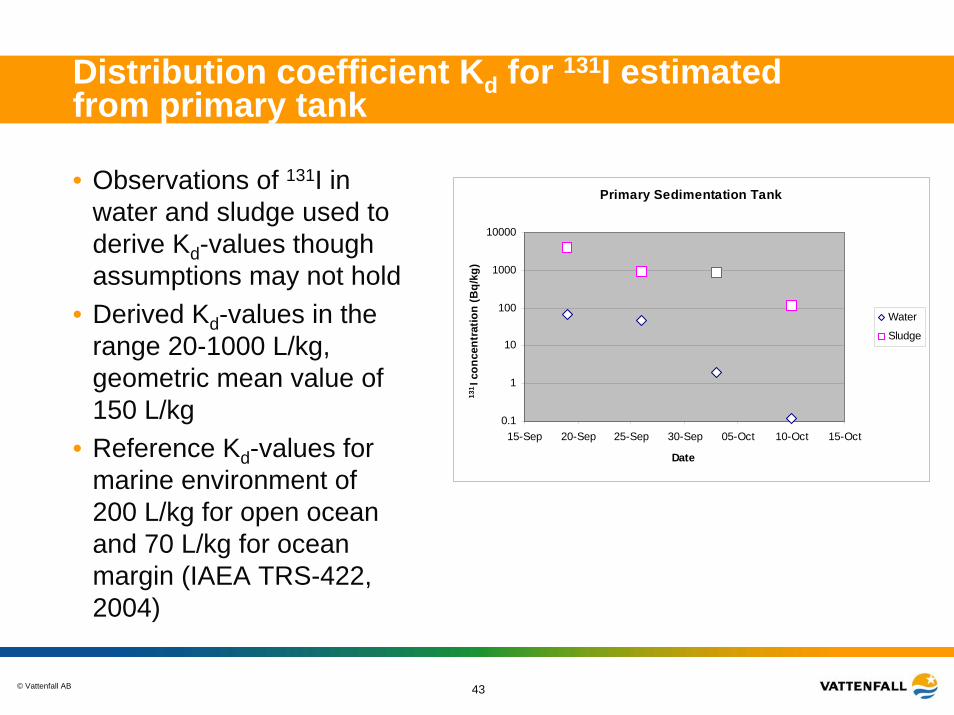
Distribution coefficient Kd for 131I estimated from primary tank
• Observations of 131I in water and sludge used to derive Kd-values though assumptions may not hold
• Derived Kd-values in the range 20-1000 L/kg, geometric mean value of 150 L/kg
• Reference Kd-values for marine environment of 200 L/kg for open ocean and 70 L/kg for ocean margin (IAEA TRS-422, 2004)
Primary Sedimentation Tank
0.1
1
10
100
1000
10000
15-Sep 20-Sep 25-Sep 30-Sep 05-Oct 10-Oct 15-Oct
Date13
1I c
once
ntra
tion
(Bq/
kg)
Water
Sludge
© Vattenfall AB 44
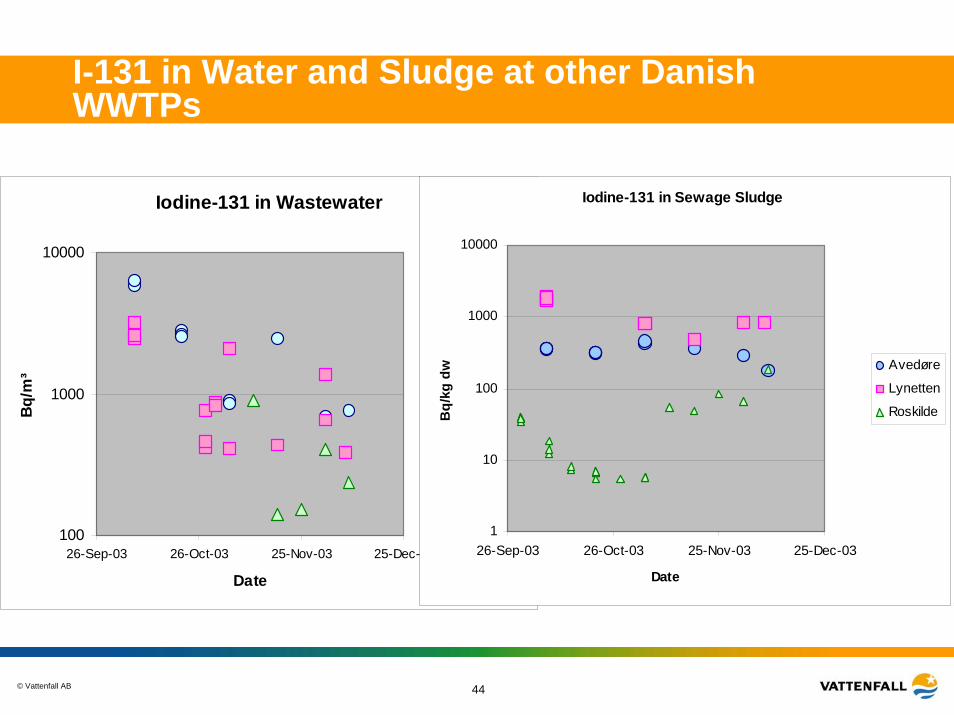
I-131 in Water and Sludge at other Danish WWTPs
Iodine-131 in Wastewater
100
1000
10000
26-Sep-03 26-Oct-03 25-Nov-03 25-Dec-03
Date
Bq/
m³ Avedøre
LynettenRoskilde
Iodine-131 in Sewage Sludge
1
10
100
1000
10000
26-Sep-03 26-Oct-03 25-Nov-03 25-Dec-03
Date
Bq/
kg d
w Avedøre
Lynetten
Roskilde
© Vattenfall AB 45
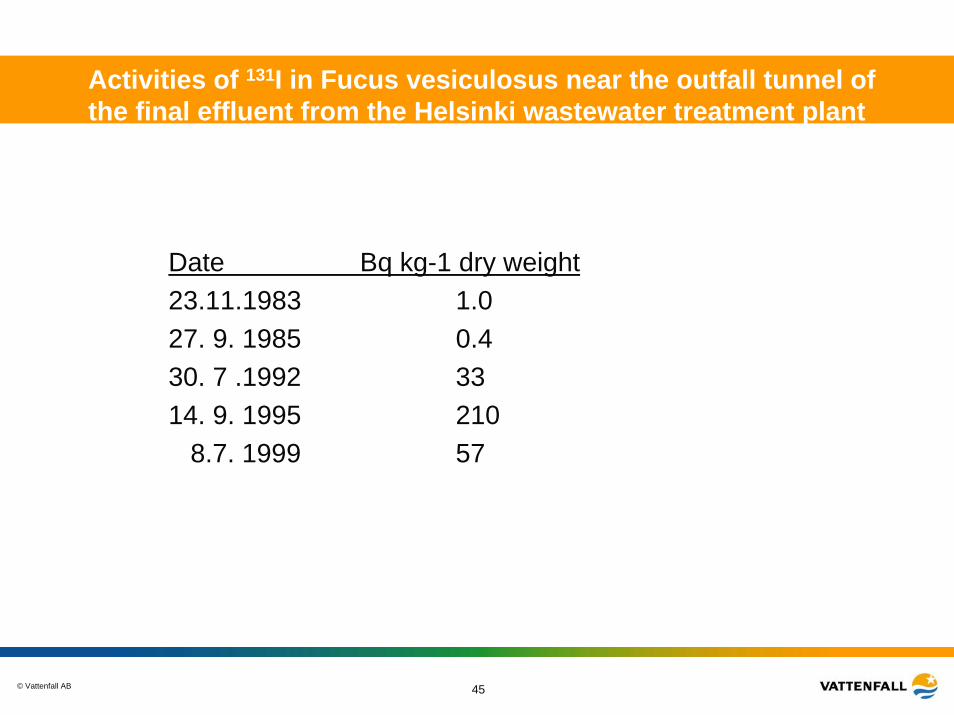
Activities of 131I in Fucus vesiculosus near the outfall tunnel of the final effluent from the Helsinki wastewater treatment plant
Date Bq kg-1 dry weight23.11.1983 1.027. 9. 1985 0.430. 7 .1992 3314. 9. 1995 210
8.7. 1999 57

© Vattenfall AB 46
Sample Concentration of 131I (Bq/kg)Primary sludge, 18-oct 2007, wet weigth 204+/- 4
Primary sludge, 18 -oct 2007, dried over night at 105°C covered with folie 8120+/-230Primary sludge, 18-oct 2007, dried over night uncovered 8560+/-730
Secondary sludge, 18-oct 2007 wet weight 185±2,5Secondary sludge, 18-oct 2007 dried over night, covered with folie 13800±500
Secondary sludge, 18-oct 2007, dried over-night uncovered 16000±1360Secondary sludge 22-oct 2007, wet weight 355±7,5
Secondary sludge 22-oct 2007, filtered 7980±152Secondary sludge 22-oct 2007, filtrate 46±1,5
Secondary sludge, 23-oct 2007, wet weight 322±7,8Secondary sludge, 23-oct 2007, filtered 6100±89Secondary sludge, 23 -oct 2007, filtrate 37±1,9
Secondary sludge 24-oct 2007, wet weight 357±6,4Secondary sludge, 24-oct 2007, filtered 6290±103Secondary sludge, 24-oct 2007, filtrate 35±3,4
Primary Sludge, 9-jun 2005 wet weight 862±1,2Primary sludge, 9-jun 2005 filtered 1945Primary Sludge, 9-jun 2005 filtrate 217
© Vattenfall AB 47
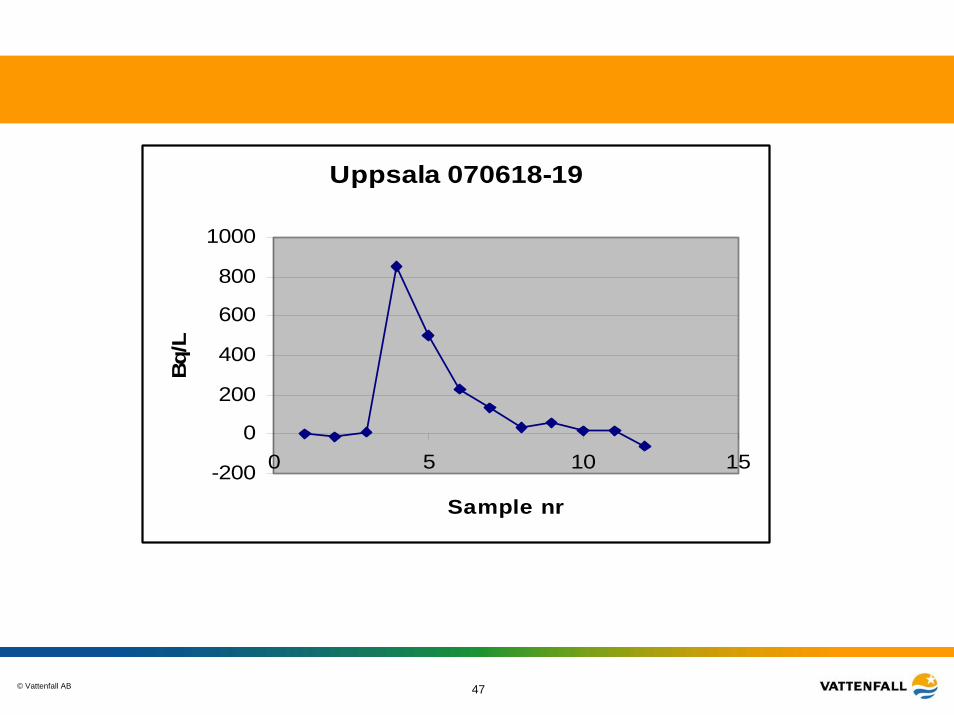
Uppsala 070618-19
-200
0
200
400
600
800
1000
0 5 10 15
Sample nr
Bq/L

© Vattenfall AB 48
7.6
Estimated relative concentration of I-131
25
1 0
2,91.8
13,5
4,5
18,5
0
5
10
15
20
25
30
12-okt 13-okt 14-okt 15-okt 16-okt 17-okt 18-okt 19-okt 20-okt 21-okt 22-okt 23-okt 24-okt
Start of treat-ment, 7.6 GBq
End of treatment
0.3 GBq 0,7 GBqAmounts of I-131 given at LSH :

© Vattenfall AB 49
Primary sedimentation
R1
Secondary sedimentation
R3
PolishingR4
Preliminary treatment.
Thickener
Storage Centrifuge
storageDigester
Primary sludge
Biological treatment
R2
Return sludge
To preliminary treatment
Secondary sludge
Silo Sink
B
C
A
ChemicalsChemicals
Sludgethickening
T1
Sludgedigestion
T2
Sludgedewatering
T3
To atmosphere
© Vattenfall AB 50
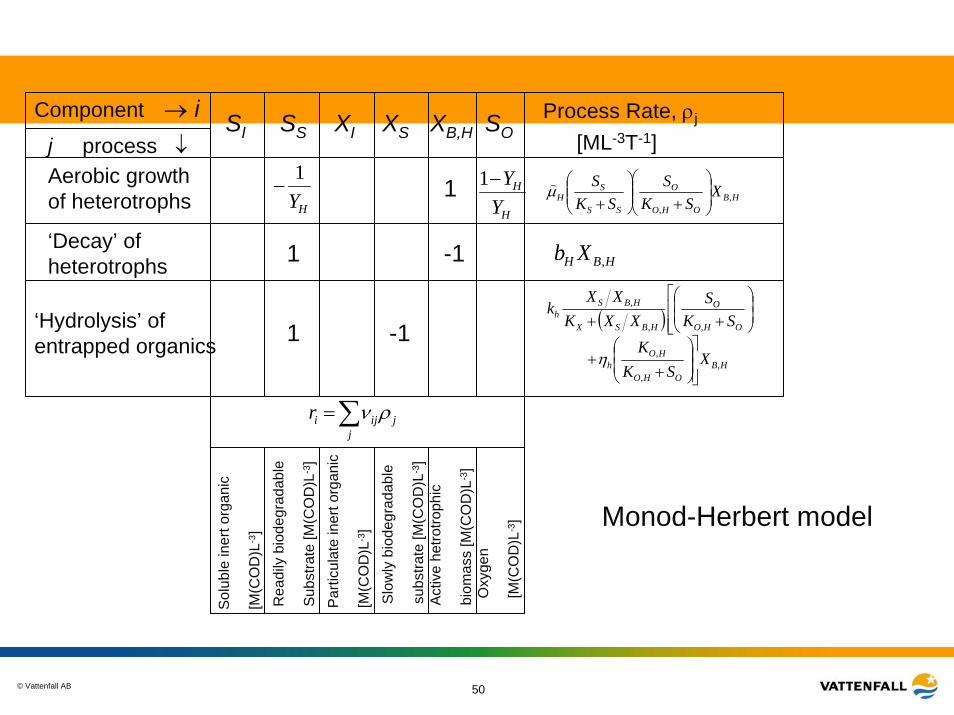
Component → ij process ↓Aerobic growthof heterotrophs
SI XB,HXSSS SOXI
Sol
uble
iner
t org
anic
[M(C
OD
)L-3
]
Process Rate, ρj
[ML-3T-1]
HBOHO
O
SS
SH X
SKS
SKS
,,
⎟⎟⎠
⎞⎜⎜⎝
⎛
+⎟⎟⎠
⎞⎜⎜⎝
⎛+
µ)1HY1
−H
H
YY−1
HBH Xb ,1 -1‘Decay’ ofheterotrophs
( ) ⎢⎢⎣
⎡⎟⎟⎠
⎞⎜⎜⎝
⎛
++ OHO
O
HBSX
HBSh SK
SXXK
XXk
,,
,
HBOHO
HOh X
SKK
,,
,
⎥⎥⎦
⎤⎟⎟⎠
⎞⎜⎜⎝
⎛
++η
‘Hydrolysis’ ofentrapped organics -11
∑=j
jijir ρν
Rea
dily
bio
degr
adab
le
Sub
stra
te [M
(CO
D)L
-3]
Oxy
gen
[M(C
OD
)L-3
]
Act
ive
hetro
troph
ic
biom
ass
[M(C
OD
)L-3
]
Par
ticul
ate
iner
t org
anic
[M(C
OD
)L-3
]S
low
ly b
iode
grad
able
subs
trate
[M(C
OD
)L-3
]
Monod-Herbert model
© Vattenfall AB 51
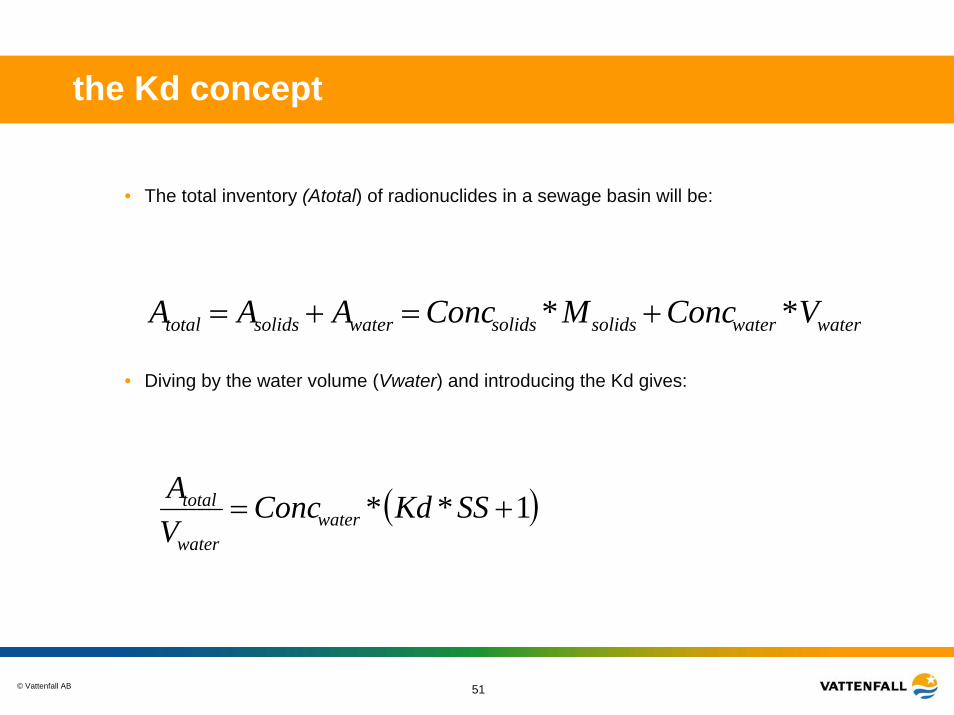
the Kd concept
• The total inventory (Atotal) of radionuclides in a sewage basin will be:
waterwatersolidssolidswatersolidstotal VConcMConcAAA ** +=+=
• Diving by the water volume (Vwater) and introducing the Kd gives:
( )1** += SSKdConcVA
waterwater
total
© Vattenfall AB 52
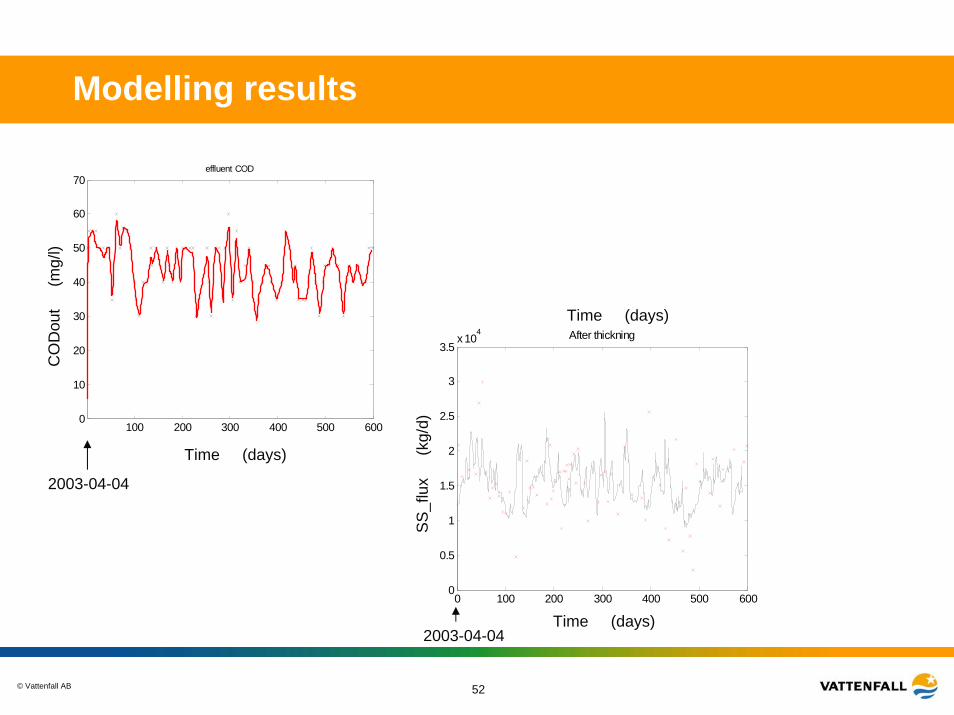
Modelling results
100 200 300 400 500 6000
10
20
30
40
50
60
70effluent COD
2003-04-04
Time (days)
SS_f
lux
(k
g/d)
Time (days)
Time (days)
CO
Dou
t(m
g /l)
2003-04-04
0 100 200 300 400 500 6000
0.5
1
1.5
2
2.5
3
3.5x 10
4 After thickning
© Vattenfall AB 53
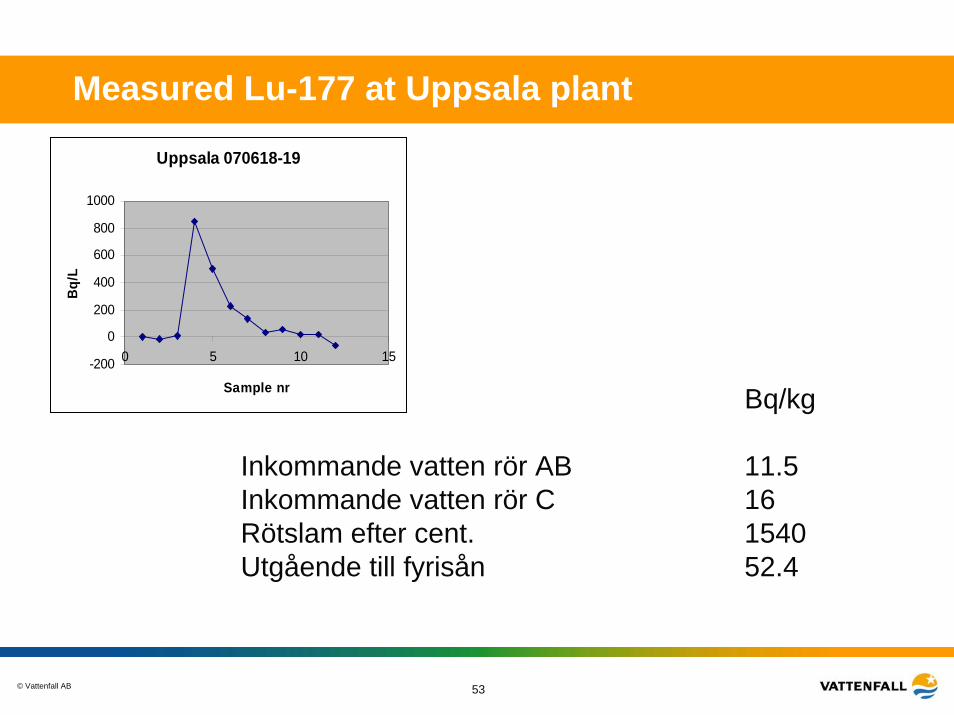
Measured Lu-177 at Uppsala plant
Uppsala 070618-19
-200
0
200
400
600
800
1000
0 5 10 15
Sample nr
Bq/
L
Bq/kg
Inkommande vatten rör AB 11.5Inkommande vatten rör C 16Rötslam efter cent. 1540Utgående till fyrisån 52.4
© Vattenfall AB 54
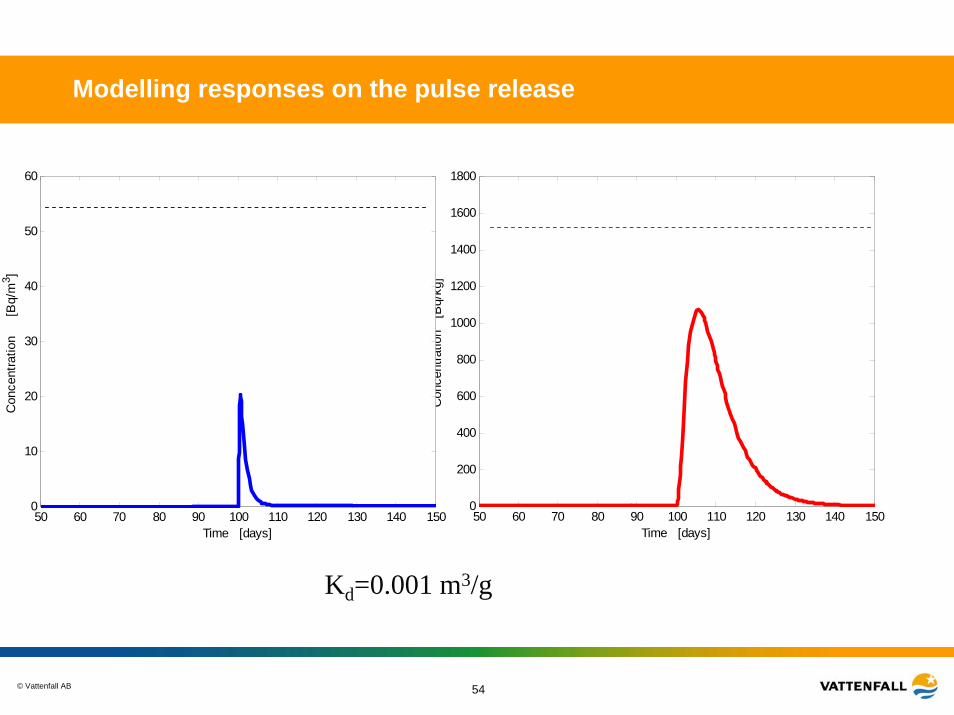
Modelling responses on the pulse release
50 60 70 80 90 100 110 120 130 140 1500
200
400
600
800
1000
1200
1400
1600
1800
Time [days]
Con
cent
ratio
n [
Bq/
kg]
50 60 70 80 90 100 110 120 130 140 1500
10
20
30
40
50
60
Time [days]
Con
cent
ratio
n
[Bq/
m3 ]
Kd=0.001 m3/g

© Vattenfall AB 55
Water pathways
• Drinking water from the recipient
• Eats fish living in this acquifer
• No dilution in the final recipient assumed.
• Activity concentrations in water and fish multiplied by the consumption rates and DCF (ingestion)

© Vattenfall AB 56
Sludge pathways
• Sewage workers
• Farmers
• Inhalation and external radiation for sewage workers
• Inhalation, external radiation and ingestion of crops, meatand milk
• Activity concentrations in crops, meat and milk• multiplied by the consumption rates and DCF (ingestion)

© Vattenfall AB 57
Dose factors for ingestion, inhalation (IAEA ,2001) and external exposure (Titley et al 2002)
Nuclide jingD
Sv/Bq
jinhD
Sv/Bq
jexD
Sv/a per Bq/m3
I-131 2,2E-08 7,4E-09 7,1E-10
Tc-99m 2,2E-11 1,2E-11 2,6E-10
© Vattenfall AB 58
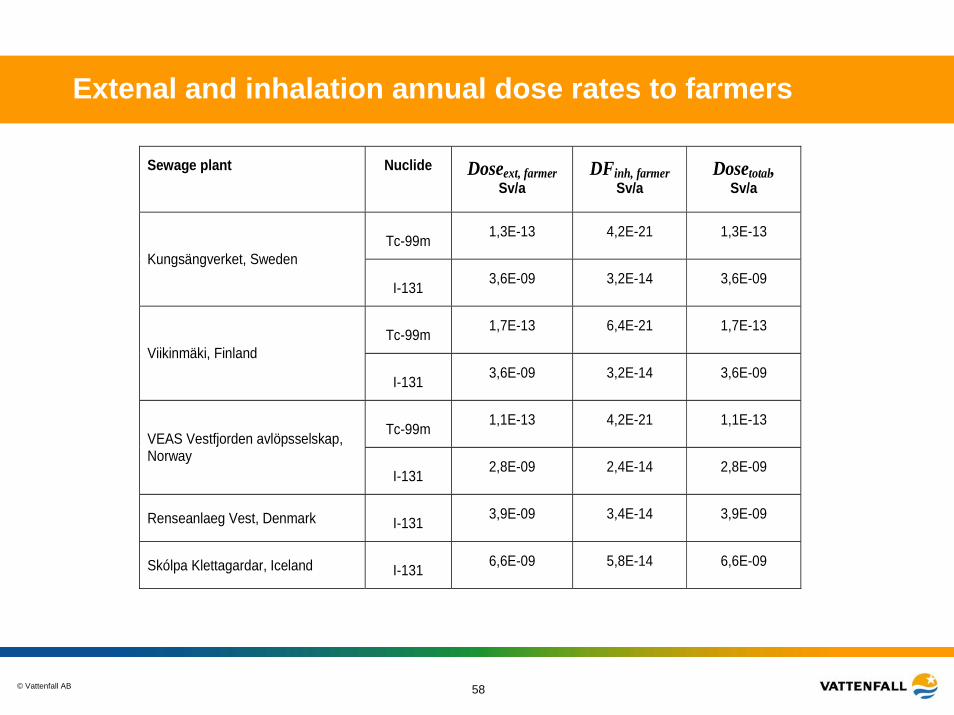
Extenal and inhalation annual dose rates to farmers
Sewage plant Nuclide Doseext, farmer Sv/a
DFinh, farmer Sv/a
Dosetotal, Sv/a
Tc-99m 1,3E-13 4,2E-21 1,3E-13
Kungsängverket, Sweden
I-131 3,6E-09 3,2E-14 3,6E-09
Tc-99m 1,7E-13 6,4E-21 1,7E-13
Viikinmäki, Finland
I-131 3,6E-09 3,2E-14 3,6E-09
Tc-99m 1,1E-13 4,2E-21 1,1E-13 VEAS Vestfjorden avlöpsselskap, Norway
I-131 2,8E-09 2,4E-14 2,8E-09
Renseanlaeg Vest, Denmark I-131 3,9E-09 3,4E-14 3,9E-09
Skólpa Klettagardar, Iceland I-131 6,6E-09 5,8E-14 6,6E-09
© Vattenfall AB 59
Accidental situations
• Consider the dynamics in the variation of the activity concentrations in sewage water and sludge;
• More proper assessments of the time variations of the dose estimations;
• More proper identification of people affected;
• Scenarios…..???

© Vattenfall AB 60
131I in sewage at Viikinmäki
-2
0
2
4
6
8
10
12
12.3.2006 14.3.2006 16.3.2006 18.3.2006 20.3.2006 22.3.2006 24.3.2006 26.3.2006 28.3.2006
crude sewage
final effluent
© Vattenfall AB 61
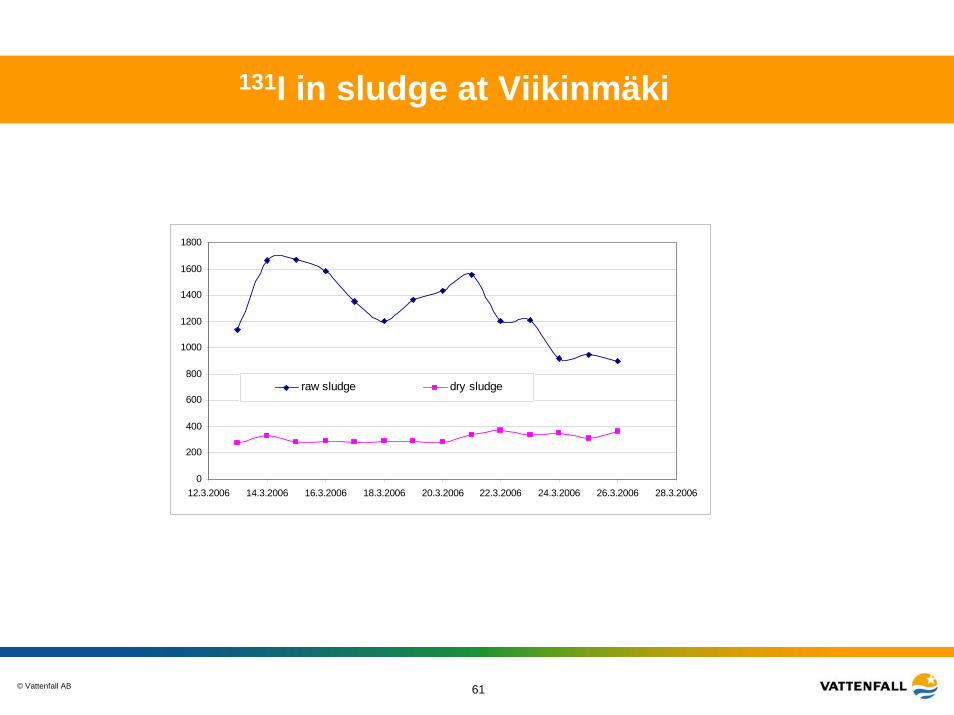
131I in sludge at Viikinmäki
0
200
400
600
800
1000
1200
1400
1600
1800
12.3.2006 14.3.2006 16.3.2006 18.3.2006 20.3.2006 22.3.2006 24.3.2006 26.3.2006 28.3.2006
raw sludge dry sludge
© Vattenfall AB 62
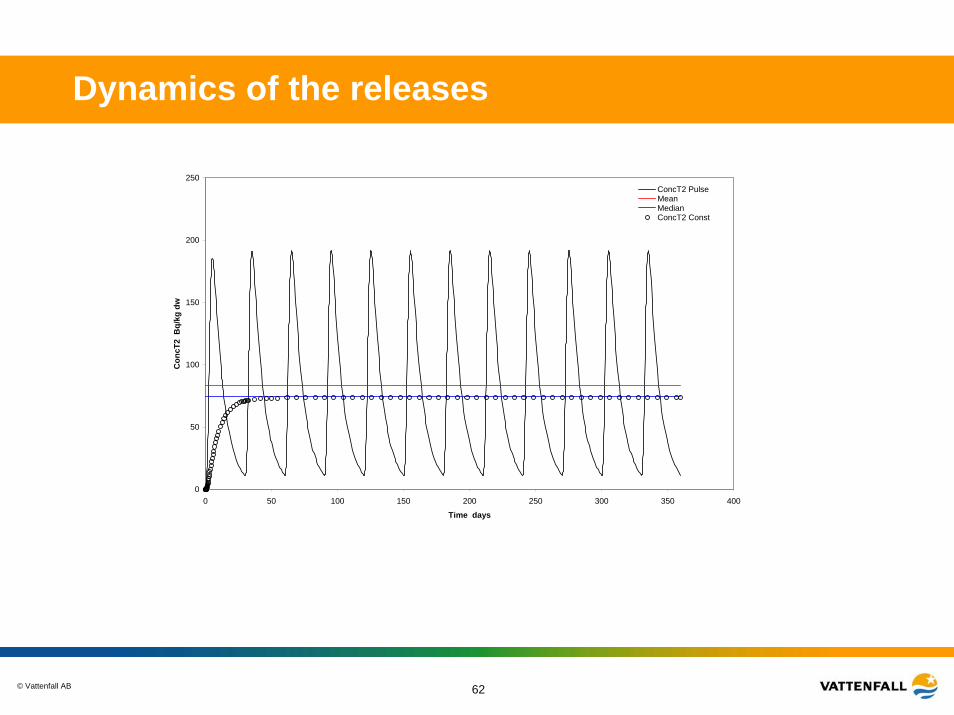
Dynamics of the releases
0
50
100
150
200
250
0 50 100 150 200 250 300 350 400
Time days
Con
cT2
Bq/
kg d
wConcT2 PulseMeanMedianConcT2 Const
© Vattenfall AB 63
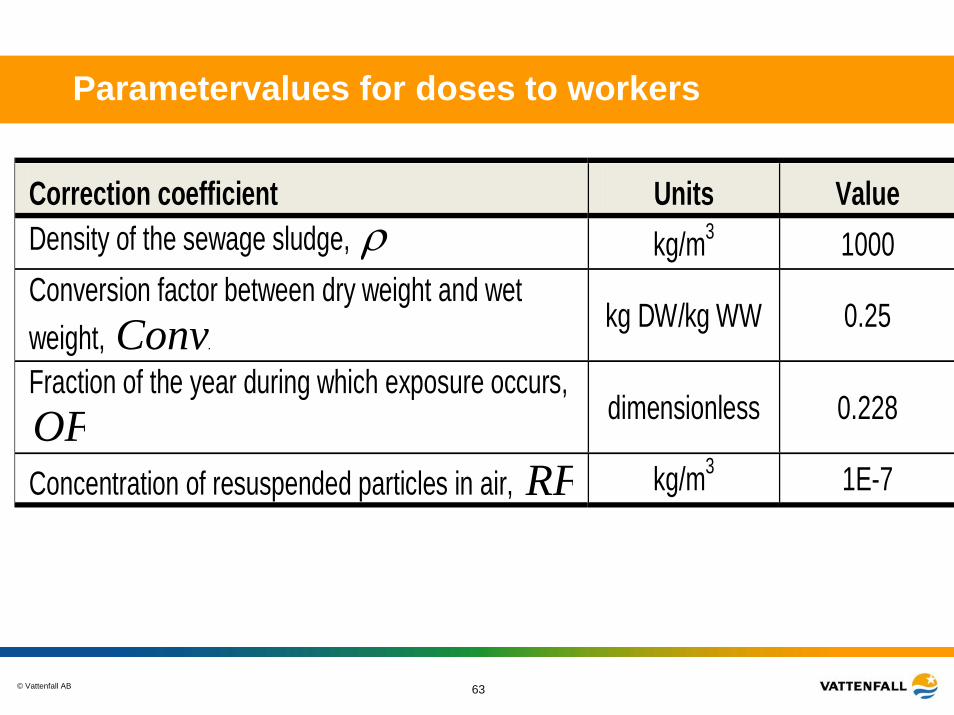
Parametervalues for doses to workers
Correction coefficient Units Value Density of the sewage sludge, ρ kg/m3 1000 Conversion factor between dry weight and wet weight, ConvF kg DW/kg WW 0.25
Fraction of the year during which exposure occurs, OF dimensionless 0.228
Concentration of resuspended particles in air, RF kg/m3 1E-7


![Risks from naturally occurring radionuclides in the Nordic ...¸d.pdf · radiation Other radionuclides in air [KATEGORINA VN] [KATEGORINA VN] Anthropogenic radionuclides in diet Average](https://img.pdfslide.us/doc/110x75/5f8a90afcd79846e8d420ef0/risks-from-naturally-occurring-radionuclides-in-the-nordic-dpdf-radiation.jpg)