Embed Size (px)
Citation preview
OF NL/TM-11944
OAK RIDGENATIONALLABORATORY
Study of Radionuclides Createdby _e_Ta(7, xn yp) Reactionsfor Bremsstrahlung Photons
Produced by 150'MEV Electrons
,., M.A. MillerJ. K. Dickens
MANAGEDBYMARTINMARIETrAENERGYSYSTEMS,INC.FORTHEIINITEflSTATES
DEPARTMENTOFENERGY "
This report has been reproduced directly from the best available copy.
Available to DOE and DOE contractors from the Office of Scientific and Technl-cal Information, P,O, Box 62, Oak Ridge, TN 37831; prices available from (615)576-8401, FTS 626-8401.
Available to the public from the National Technical Information Service, U.S.
Department of Commerce, 5285 Port Royal Rd., Springfield, VA 22161.
This report was prepared as en account of work sponsored by an agency ofthe United States Government, Neither the United States Government nor anyagency thereof, nor any of their employees, makes any warranty, express orImplied, or assumes any legal liability or responsibility for the accuracy, com- _.pleteness, or usefulness of any information, apparatus, product, or process dis-closed, or represents that its use would not Infringe privately owned rights.Reference herein to any specific commercial product, process, or service by .,trade name, trademark, manufacturer, or otherwise, does not necessarily consti-
tute or imply its endorsement, recommendation, or favoring by the United StatesGovernment or any agency thereof. The views and opinions of authorsexpressed herein do not necessarily state or reflect those of the United StatesGovernment or any agency thereof.

ORNL/TM--I 1 944
DE92 009883
Engineering Physics and Mathematics Division
Study of Radionuclides Created by lSlTa(7, xn yp) Reactions for Bremsstrahlung
Photons Produced by 150-MEV Electrons
M. A. Miller* and J. K. Dickens
DATE PUBLISHED -- December 1991
*Student participant from the University of Wisconsin/River Falls in the studentresearch participation program under contract number DE-AC05-76OR00033 be-tween the U.S. Department of Energy and Oak Ridge Associated Universities.
Prepared for theOffice of Energy Research
Division of Nuclear Physics
Prepared by theOAK RIDGE NATIONAL LABORATORY
Oak Ridge, Tennessee 37831" managed by
" MARTIN MARIETTA ENERGY SYSTEMS, INC.for the
" U.S. DEPARTMENT OF ENERGYunder contract DE--AC05-84OR21400
%_..-

CONTENTS
ACKNOWLEDGMENTS .............. vii
ABSTRACT .................. ix
1. INTRODUCTION ............... 1
2. PRE-EXPERIMENTAL DETAILS ........... 2
2.1 ESTIMATE OF RADIONUCLIDE PRODUCTION ..... 2
2.2 ESTIMATE OF HEATING OF THE TWO-PIECE SAMPLE . 6
2.3 SUMMARY ............. 10
3. EXPERIMENTAL DETAILS ......... 11
4. DATA REDUCTION ............ 19
5. DISCUSSION OF RESULTS ......... 31
6. CONCLUSION ............. 33
REFERENCES .............. 34
iii

F
LIST OF FIGURES
1 The intensity spectrum of bremsstrahlung photons created by 150 MeVelectrons in Ta, calculated by the Eq. (1) ........ 3
2 Total photon-tantalum interaction cross section vs photon energy . 5
3 The above plot shows (in the shaded area) the energy region of photonshaving the highest probability of interacting by the (_', lh) reaction . 6
4 Schematic of Ta irradiation experiment ......... 7
5 Flowchart showing the energy loss of the electron as it passes throughthe tantalum ,converter .............. 8
6 Schematic diagram showing cylindrical volume where electrons traversethe tantalum siample and deposit energy in the form of radiation andcollisions . _:................. 9
7 Beam-spot location diagram ............ 14
8 Plot of X-ray counts per second versus sample "scan" location in anattempt to define the location of the actual beam spot .... 15
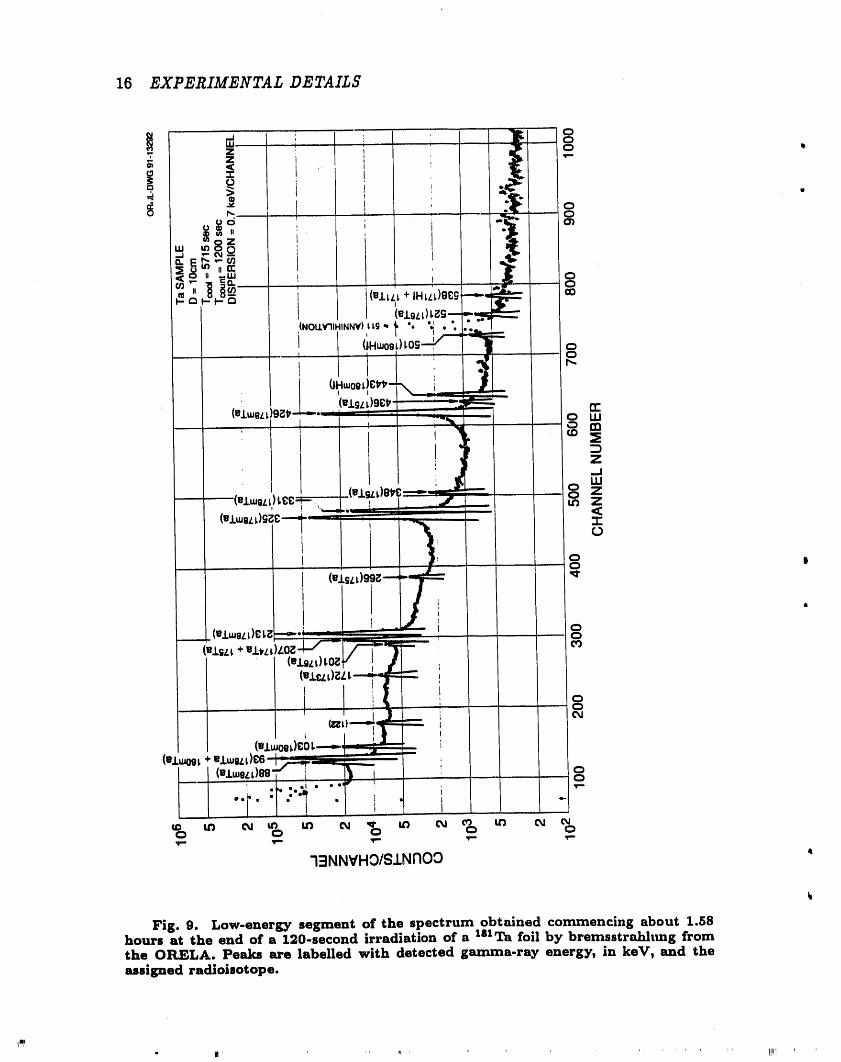
9 Low-energy segment of the spectrum obtained commencing about 1.58hours at the end of a 120-second irradiation of a lSlTa foil bybremsstrahlung from the ORELA. Peaks are labelled with detectedgamma-ray energy, in keV, and the assigned radioisotope .... 16
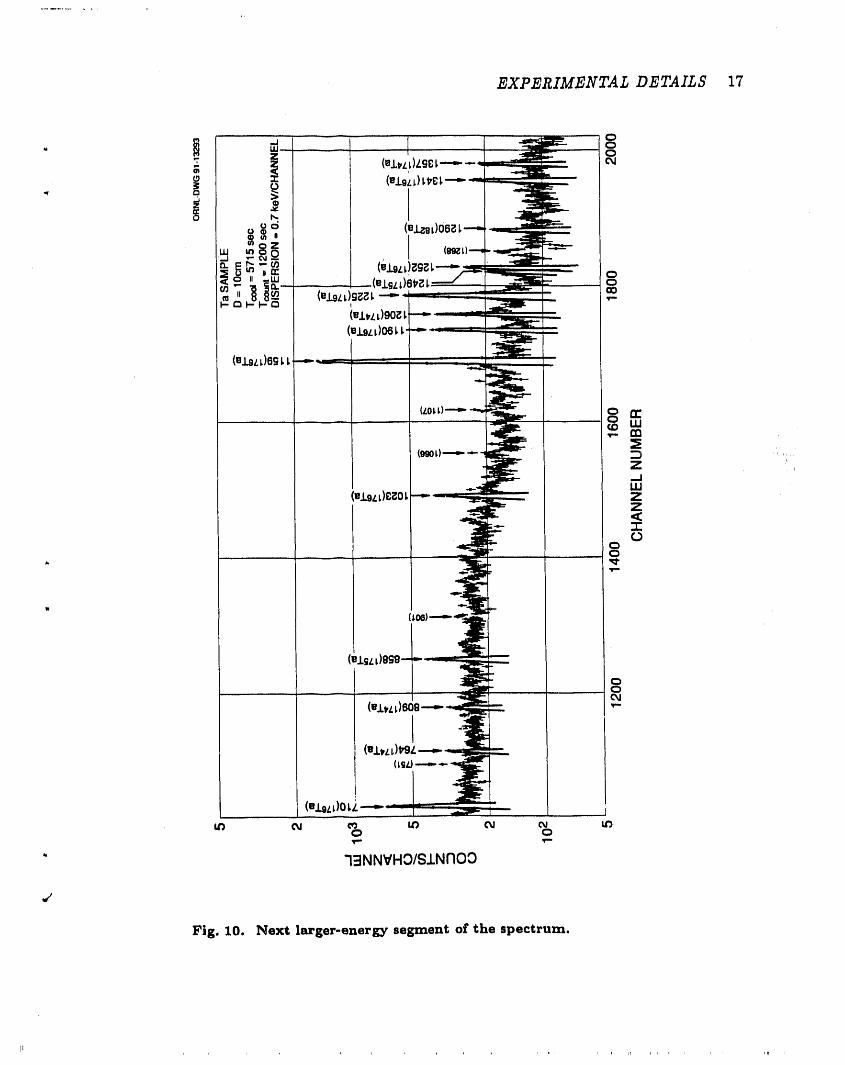
10 Next larger-energy segment of the spectrum ..... . . . 17,o
11 Highest-energy portion of the spectrum ......... 18
iv
Fig. Page
12 Half life of la°Ta deduced from the present experimental data for E v =93 keV ................. 21
13 Half life of lS°mHf deduced from tile present experimental data forE._ - 443 keV ............... 22
14 Half life of 1TSTa deduced from the present experimental data for E.y =1351 keV ................. 23
15 Half life of 178mTa deduced from the present experimental data forE v - 426 keV ............... 24
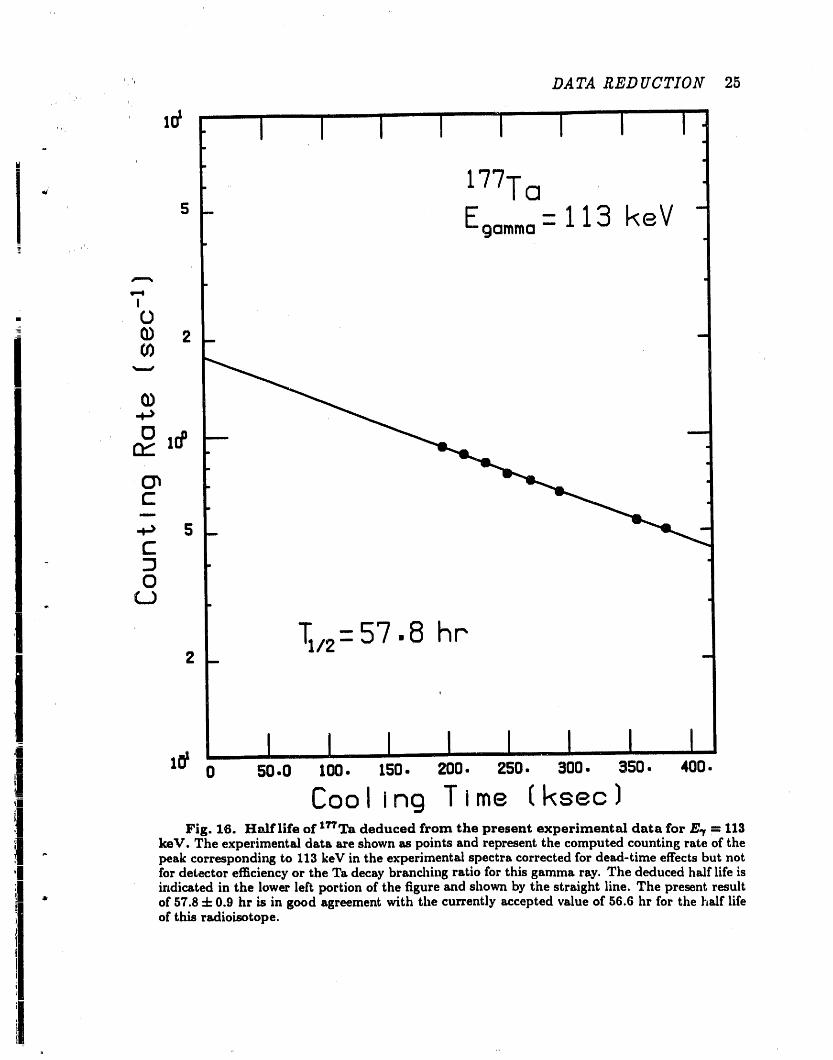
16 Half life of 177Ta deduced from the present experimental data for E.y =113 keV ................. 25
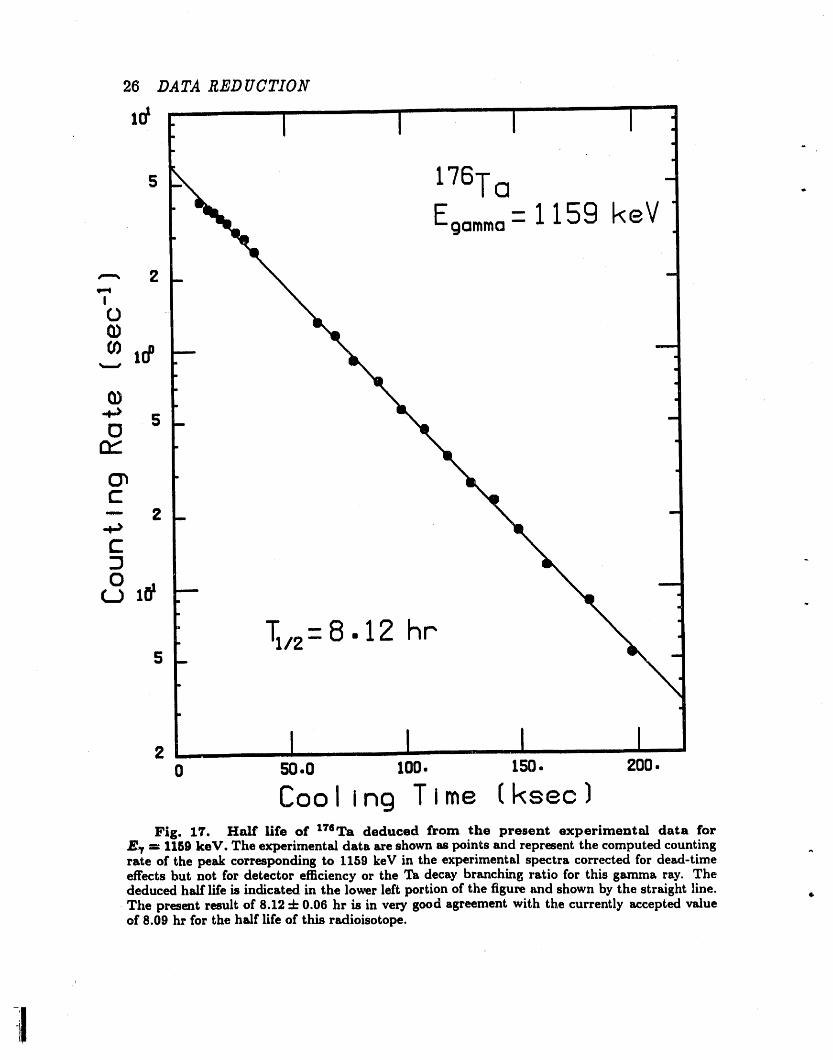
17 Half life of 176Ta deduced from the present experimental data for E_ =1159 keV ................. 26
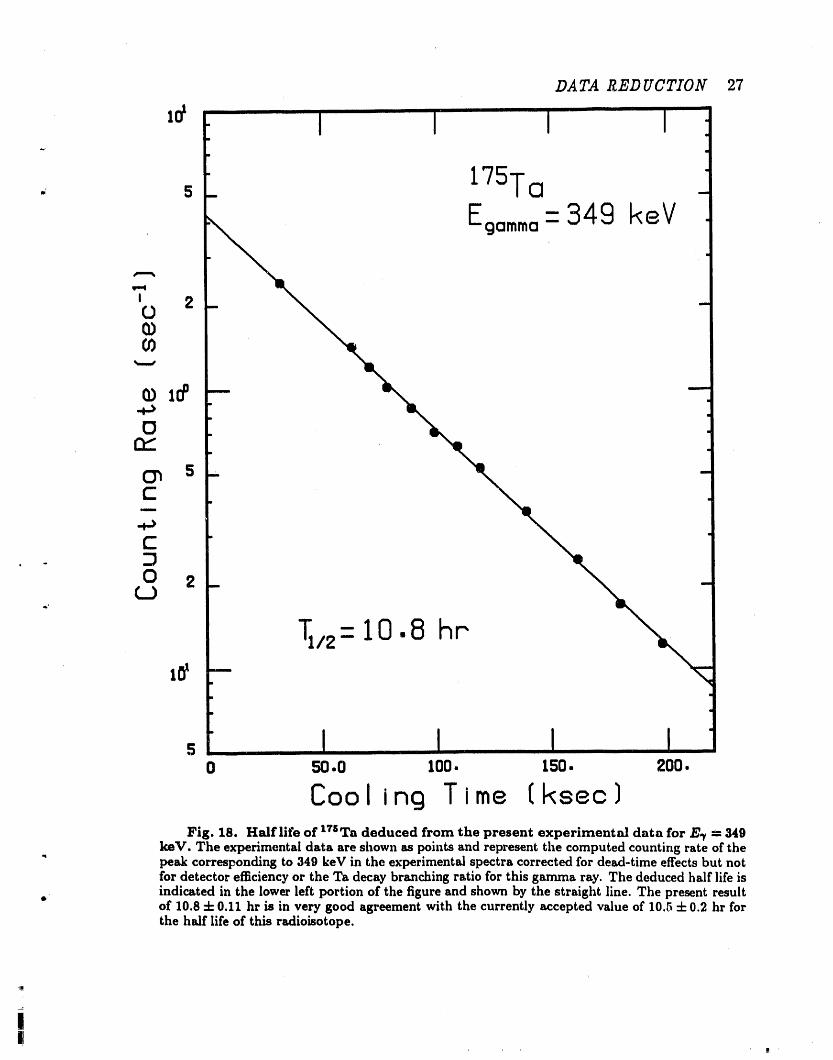
18 Half life of 175Ta deduced from the present experimental data for E._ =349 keV .................. 27
19 Half life of 174Ta deduced from the present experimental data, for E._ =765 keV .................. 28
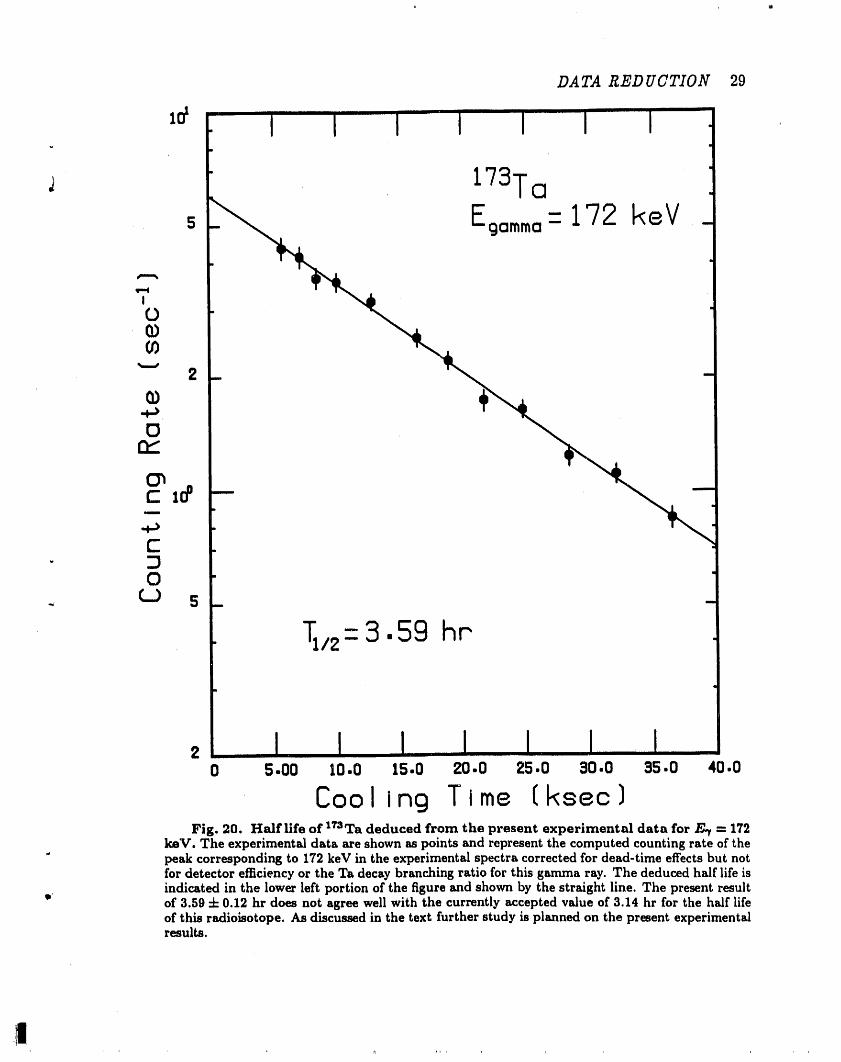
20 Half life of 1TSTa deduced from the present experimental data for E.y =172 keV .................. 29
21 Half life of 172Ta deduced from the present experimental data for E.y =1109 keV .................. 30
ACKNOWLEDGMENTS
We express our appreciation to D. C. Larson, J. A. Harvey, T. A. Lewis, and.¢
K. M. Wallace for active participation in the experiment, especially during theirradiation of the foils. We also thank A. L. Bangs and C. W. Glover for assistancein computer-aided preliminary documentation and S. R. Damewood and A. M.McCoy for final documentation. M. A. Miller also thanks the Oak Ridge AssociatedUniversities for support.
q
vii
ABSTRACT
. Ten radionuclides, including isomers, from 172Ta to iS°Ta and 18°'nHf wereproduced by photon interactions with a sample of elemental tantalum and measuredby counting photons using a high-resolution detection system. Relative yields ofthese radionuclides were obtained. In addition, precision half lives were obtainedfor 175'176,1S°Ta and lS°mHf. Those obtained for the three Ta isotopes agree withpreviously reported values. For lS°mHf, the present measurements resulted in a halflife determination of 6.05"4-0.06 hr, or about 10% longer than the currently adoptedvalue for this half life.
ix
1. INTRODUCTIONh
The Oak Ridge Electron Linear Accelerator (ORELA) has been a proven neu-" iron source for many experimental research projects. Briefly, the ORELA produces
a beam of electrons of nominal energy 150 MeV. The accelerated (and pulsed)electron beam strikes a target fabricated of tantalum resulting in production ofbremsstrahlung. This bremsstrahlung then initiates photonuclear events in thetantalum, and the resulting neutrons have energies over a wide range from nearlythermal energies to _100 MeV. As part of the design phase of this accelerator,Alsmiller et al.1 performed calculations of the expected neutron-energy fluencc [i.e.,N(En) vs En]; later Burgart et al.2 compared measured fluences with calculatedfluences for I < En < 20 MeV showing agreement to within a factor of ,,_3 forthis energy range. This agreement was considered very satisfactory and no furtherwork was proposed having the goal of improving the fundamental knowledge of thephoton plus tantalum interaction processes. Indeed, although measured values ofcross sections have been reported 3 for Ta(v, n) + Ta(v ,2n) + Ta(v, 3n) reactions,Alsmiller et al. 1 had to rely on calculated cross sections for total photon interac-tions with tantalum for E, r > 30 MeV. A search of the literature failed to locate
• more recent measurements of Ta photonuclear cross sections; however, Masumotoet al.4 reported on (%n), (_/,2n), and (_,3n) cross sections for bremsstrahlung E vto 70 MeV and for several heavy elements (Au and Pb). It is of some interest,then, to initiate a study of photon interactions with Ta not only for specific appli-cation of neutron production in the ORELA target but also leading to a furtherunderstanding of the fundamental nuclear processes involved in this reaction.
There is, in addition, a very pragmatic reason for this study, and that is to" quantify ;he build up of radionuclides in the target. With this knowledge, main-
tenance scheduling can be better planned. In wldition, the types and amounts of. materials needed for shielding used targets can be better estimated.
The present experiment was meant to be of a scoping nature. The experimentalconfiguration, an air-cooled radiator foil (0.051-cre Ta) preceeding the sample foil(0.0075-cm Ta), had never been tried before, and we were concerned if enoughradionuclide yield could be made in the sample without damage to the radiator foilby the impinging electron beam. Consequently, a careful pre-experiment analysiswas conducted, and this analysis is discussed in some detail in the next section.This analysis indicated that the experiment could be carried out, and the followingsections detail the experiment and presents our results. Finally, conclusions and
" recommendations for further work are given.

2. PRE-EXPERIMENTAL DETAILS
2.1 ESTIMATE OF RADIONUCLIDE PRODUCTION
Before the actual experiment was run, it was necessary to determine how longthe irradiation should last. The first question to be answered was whether or notthe irradiation would produce a sufficient amount of radioactivity. We started withthe assumption 5 that at a maximum power of 50 kilowatts, approximately 101_bremsstrahlung photons/see were produced in the ORELA tantalum target, t Forthe present experiment, the ORELA was to run at about 1 kilowatt, and thus thebremsstrahlung production should drop by a factor of 50:
1 101s 1014photons/sec= _-_× = 2 x
When an electrontravelsthrougha material,theradiationlengthofthatma-terialisdefinedtobe the distanceoverwhichtheelectronenergyisreducedby afactor1/e.Giventhattheradiationlengthintantalumis0.3823cre,Iitisreason-ableto assume thatelectronstravellingthroughtheORELA tantalumtargetwilllosenearlyalltheirenergyinthe form ofbremsstrahlungphotonssincethe tar-getitselfisverythick.However,the bremsstrahlungnecessaryfortheexperimentwas to be producedina tantalumconverterhavinga thicknessofonly0.051cre.One may determines thatapproximately12.3% oftheelectronenergyincidentonthe tantalumconverterwould be convertedintobremsstrahlungphotons.There-fore,thebremsstrahlungproductioninthetantalumconvertershouldbe,toa goodapproximation:
0.123 x (2 × 1014) = 2,46 × 10is photons/sec
Now that the estimate of the number of bremsstrahlung photons produced wascomplete, it was necessary to determine the intensity of the photons at a givenenergy, or in other words, the bremsstrahlung spectrum. The following equationfrom Johns et al.7 gives the relative intensity of the bremsstrahlung in the forwarddirection:
r (E, E0) =812(1 - z)(ln a- 1)+ z2(ln a- 0.5] (1)
t This statement is not strictly correct unless a photon-energy threshold is defined.The bremsstrahlung production becomes large and ill defined as Ephoton "-' zero.However, the energy spectrum, Epho_o. x g(Ephoton), is finite as Ephoto. ---*zero.For the pre-analysis given in this section we have assumed (a) a low photon-energythreshold not specifically defined but small compared to our photon energies of in,terest and (b) an essentially constant thin-radiator bremsstrahlung spectrum. Thenany change in the photon yield will result in an equivalent change in the energyyield (and vice versa), and the analysis in this section may be carried out as given.
Pt_E.EXPERIMENTAL DETAILS 3
where 2 20_10_ 2
_2
al = 2E0(1 - z)/#zm
o_2= 191/Z 1/3
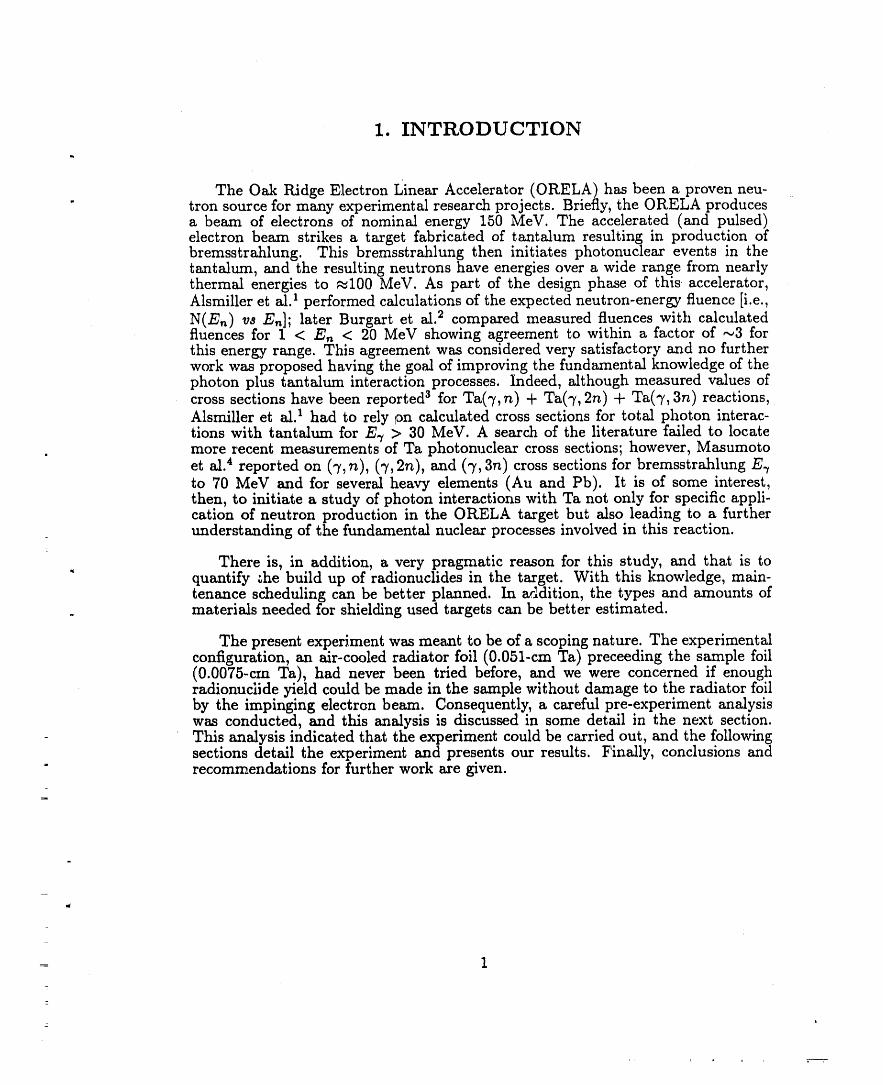
Here, F(E, E0) is the intensity, # is the rest energy of the electron, E is theenergy of the photon, z = E/Eo,Eo is the total energy of the electron, and Z is theatomic number of the target material. Evaluating Eq. (1) for 150-MEV electronsincident on tantalum for photon energies ranging from 0 to 150 MeV yields thebremsstrahlung spectrum shown in Fig. 1.
o
w
>,,
Q
(/)C: tS--(D
r'- 1o--0"'4
S---
_, 00 2O 40 6O W 1_ 120 140
Photon Ener-gy{MeV )
Fig. I. The intensity spectrum of bremsstrahlung photons created
by 150 Mc_V electrons in Ta, calculated by the Eq. (I).
The calculated intensity spectrum of Fig. 1 does not exhibit the expected 1/Edependence. In fact, if one defines a function N(E, Eo) as the number of photonsof energy E per unit photon energy interval, then s
N(E, Eo) = F(Eo)F(E, Eo)/E (2)
- where F(Eo) is a normalizing parameter. To complete the actual experimentaldescription of N(E, Eo) the right-hand side of equation (2) should also include aphoton attenuation function, a(E). However, the photon attenuation in the present
" experiment is small and has essentially no effect on the final results.
illi I[I [[
4 PRE-EXPERIMENTAL DETAILS
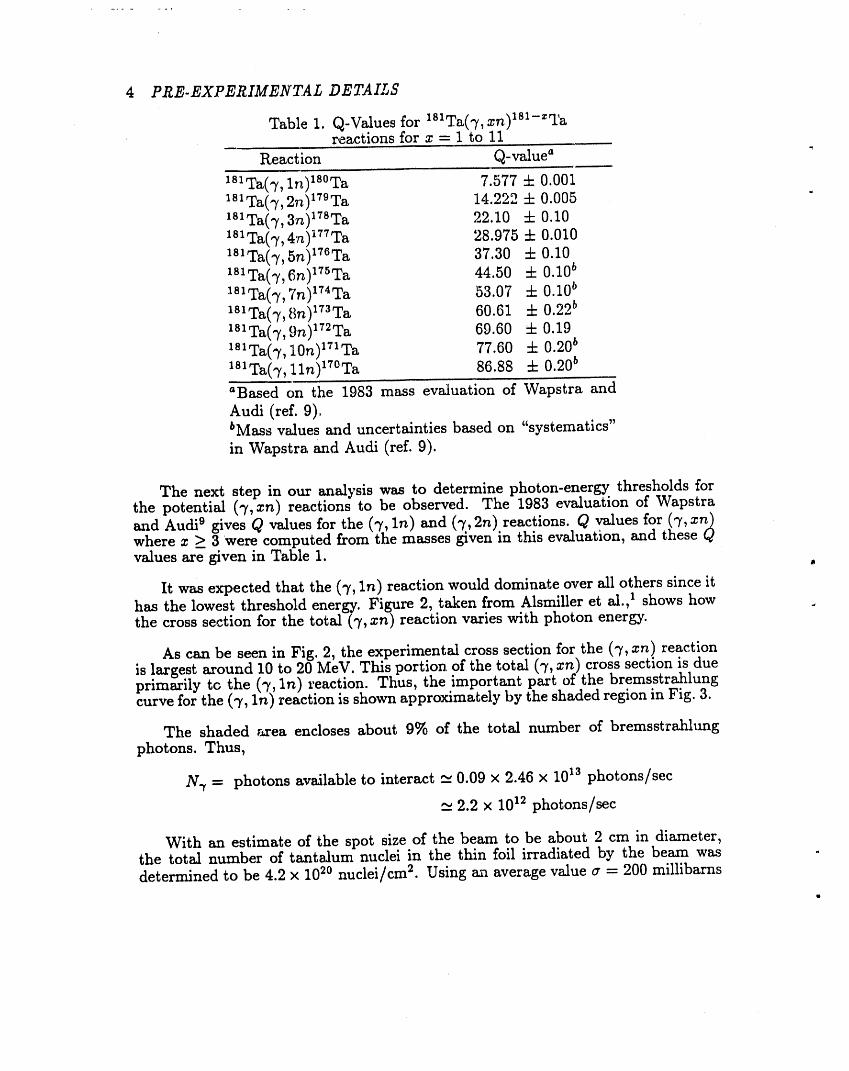
Table 1. Q-Values for lSlTa(v, xn)lSl-_'rareactions for x - 1 to 11
Reaction Q-value" "
181Ta(7, ln)lS°Ta 7.577 + 0.001181Ta(7,2n)179Ta 14.222 4- 0.005 "lSlTa(7,3n)lTSTa 22.10 4- 0.10181Ta(v, 4n)i77Ta 28.975 4- 0.010181Ta(-)',5n)176Ta 37.30 4- 0.101SlTa(7,6n)175Ta 44.50 4- 0.10 b
lSlTa(-),,7n)174Ta 53.07 4- 0.10 b181Ta(7, Sn)173Ta 60.61 4- 0.22 b181Ta(,'f,9n)172Ta 69.60 4- 0.19lSITa(7, 10n)171Ta 77.60 4- 0.20 b181Ta(7, lln)17eTa 86.88 4- 0.20 b
"Based on the 1983 mass evaluation of Wapstra andAudi (ref. 9).bMass values and uncertainties based on "systematics"in Wapstra and Audi (refi 9).
The next step in our analysis was to determine photon-energy thresholds forthe potential ('),,xn) reactions to be observed. The 1983 evaluation of Wapstraand Audi o gives Q values for the (7, lh) and (7,2n) reactions. Q values for ("t',xn)where x >_3 were computed from the masses given in this evaluation, and these Qvalues are given in Table 1.
at
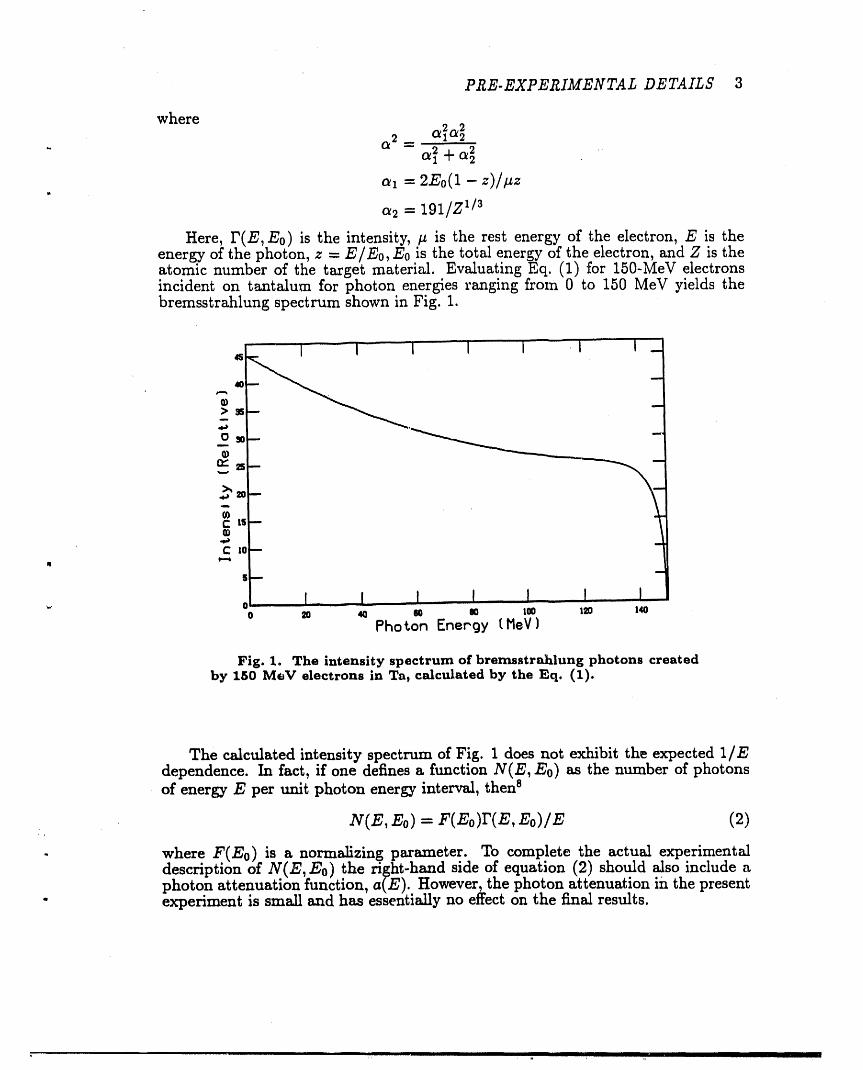
It was expected that the (% lh) reaction would dominate over all others since ithas the lowest threshold energy. Figure 2, taken from Alsmiller et al.,1 shows howthe cross section for the total (7,xn) reaction varies with photon energy.
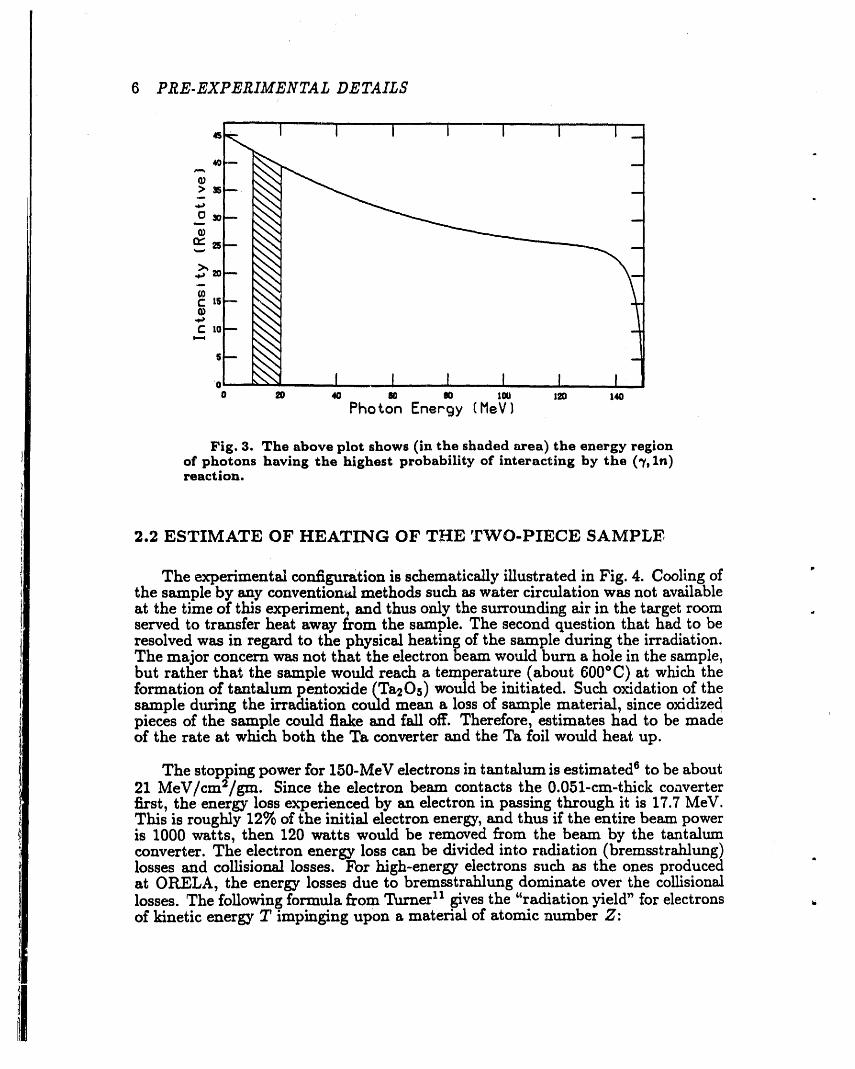
As can be seen in Fig. 2, the experimental cross section for the (7, xn) reactionis largest around 10 to 20 MeV. This portion of the total (7, xn) cross section is dueprimarily tc the (7, lh) reaction. Thus, the important part of the bremsstrahlungcurve for the (_', lh) reaction is shown approximately by the shaded region in Fig. 3.
The shaded area encloses about 9°_ of the total number of bremsstrahlungphotons. Thus,
N. r -- photons available to interact _'20.09 x 2.46 x 1013 photons/sec
__2.2 x 1012 photons/sec
With an estimate of the spot size of the beam to be about 2 cm in diameter,the total number of tantalum nuclei in the thin foil irradiated by the beam wasdetermined to be 4.2 x 10²o nuclei/cre 2. Using an average value a = 200 millibarns
PRE-EXPERIMENTAL DETAILS 5
A
103 ......,-- • . ....... - ._
• _.
:7 ....... EXPERIMENTAL_E -' • -- " CALCULATED
Z 2 _ • w-- ..... i.._..,l_
_tO z .......... . :- ----tri,,, _ !-,---- ... _ -_.-o 5u
I .... " • •
t04 , , ,,:Y
'" ' /
i
i50 20 40 60 BO I00 , 120 t40
PHOTONENERGY(MEV)
Fig. 2. Total photon-tantalum interaction cross section vs photonenergy. The solid line representsthe experimentaldata of ref. 3, and the"dotsindicatecalculatedvaluesbyAlsmilleretal.(ref.1). i_!''
' f
r
r4
(1barn - 1024cm 2)forthe crosssectionofthe(7,ln_ reactiontakenfrom Fig.2ledto thefollowingdeterminationoftheexpectedyieldofthereaction:
Yield of (% lh) reaction _ 4.2 x 10²⁰ nuclei/cre 2 x a x N_
1.8 × l0 s atoms/sec of irradiation
From exp,_rimental results by Masumoto et al. 4, the expected yield of otherphotoneutron reactions appears to decrease successively by a factor of about 4 foreach additional emitted neutron, meaning that the expected yield of the (7,2n)should be around 4.5 × 10v atoms/sec and the (7,3n) about 1.1 x l0 T atoms/sec.
The effects of radioactive decay on the yield of these freshly created isotopeswas also considered. Assuming that the half-life of a typical nuclide created in the/7,zn) reaction to be around 20 minutes, then the rate at which the nuclide decaysisgivenby
dN
" d--'t--- AN --- (5.8 x 10 -4 s -1)(1.8 x 10s atoms/sec) _ 1.1 x 10s decays/sec ,
, where A = In 2/t112. A quick glance at the Chart of the Nuclides 1° shows that mostof the Ta isotopes lighter than lsl Ta have half-lives on the order of hours or more,and thus if they were created during the irradiation they should be detectable.
6 PRE.EXPERIMENTAI, DETAILS
0 20 40 SO 00 IOU 120 140
Photon Energy (MeV }
Fig. 3. The above plot shows (in the shaded area) the energy regionof photons having the highest probability of interacting by the (% lh)reaction.
2.2 ESTIMATE OF HEATING OF THE TWO-PIECE SAMPL]_',
The experimental confi_z_tion is schematically illustrated in Fig. 4. Cooling ofthe sample by any conventional methods such as water circulation was not availableat the time of this experiment, and thus only the surrounding 8_rin the target roomserved to transfer heat away from the sample. The second question that had to beresolved was in regard to the physical heating of the sample during the irradiation.The major concern was not that the electron beam would burn a hole in the sample,but rather that the sample would reach a temperature (about 600°C) at which theformation of tantalum pentoxide (Ta2Os) would be initiated. Such oxidation of thesample during the irradiation could mean a loss of sample material, since oxidizedpieces of the sample could flake and fall off. Therefore, estimates had to be madeof the rate at which both the Ta converter and the Ta foil would heat up.
The stopping power for 150-MEV electrons in tantalum is estimated 6 to be about21 MeV/cm2/gm. Since the electron beam contacts the 0.051-cre-thick converterfirst, the energy loss experienced by an electron in passing through it is 17.7 MeV.This is roughly 12°_ of the initial electron energy, and thus if the entire beam poweris 1000 watts, then 120 watts would be removed from the beam by the tantalumconverter. The electron energy loss can be divided into radiation (bremsstrahlung)losses and collisional losses. For high-energy electrons such as the ones producedat ORELA, the energy losses due to bremsstrahlung dominate over the collisionallosses. The following formula from Turner 11 gives the "radiation yield" for electronsof kinetic energy T impinging upon a material of atomic number Z:

PRE.EXPERIMENTAL DETAILS 7
,,|
f ,,, Tantalum target
Fig, 4. Schematic of Ta irradiation experiment. The electron beam incidentfrom the left impinged on a Ta converter (A) of thickness 0.051 cm which resulted in
" the production of bremsstrahlung radiation in the forward direction. These photons theninteracted with the thin Ta foil (B) of thickness 0.0076 cm by means of the lsl Ta(7, z, yp)reaction.
6 x IO-4ZTY = radiation yield __
1+6 x IO-4ZT
For an electron of kinetic energy T = 150 MeV in tantalum (Z = 73), theradiation yield is 0.87. Thus, of the 120 watts deposited in the tantalum converter87% takes the form of bremsstrahlung photons and the other 13% is of the formof collisional losses. However, not all of the bremsstrahlung will interact with thetantalum. Low-energy photons interact primarily by the photoelectric eft'ect anddeposit all their energy. Photons of intermediate energy that do not interact by the
" (7,zn) reaction tend to undergo Compton scattering and may or may not depositall their energy in the sample. High energy photons have a higher cross section for
., pair production, and thus deposit most of their energy in that manner. Since thephotons are produced throughout the sample, the "average" distance travelled by aphoton in passing through it is taken to be half. the sample thickness. In the case of
8 PRE-EXPERIMENTAL DETAILS
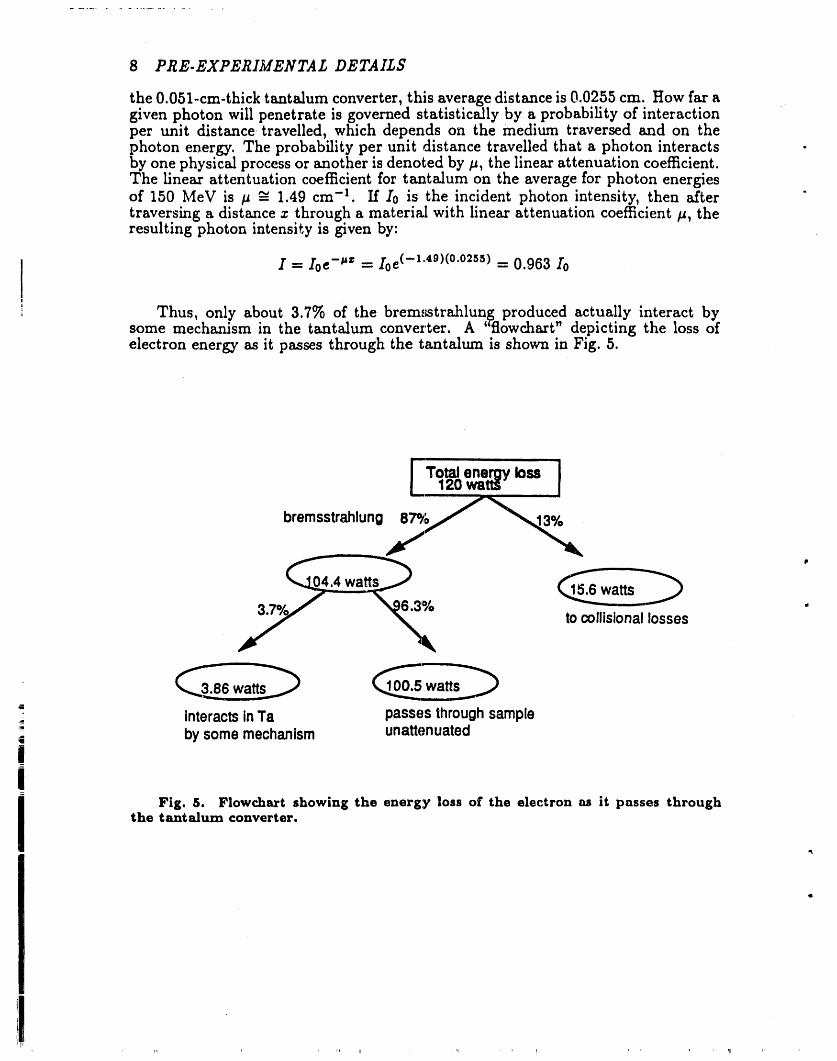
the 0.051-cre-thick tantalum converter, this average distance is 0.0255 cm. How far agiven photon will penetrate is governed statistically by a probability of interactionper unit distancetravelled, which depends on the medium traversed and on thephoton energy. The probability per unit distance travelled that a photon interactsby one physical process or another is denoted by p, the linear attenuation coefficient.The linear attentuation coefficient for tantalum on the average for photon energiesof 150 MeV is _ -_ 1.49 cm -1. If I0 is the incident photon intensity, then aftertraversing a distance z through a materiM with linear attenuation coefficient p, theresulting photon intensity is given by:
I = I0e -_z = I0e (-1"4_)(°'°255) = 0.963 I0_
!
i Thus, only about 3.7% of the brem,,_strahlung produced actually interact bysome mechanism in the tantalum converter. A "flowchart" depicting the loss ofelectron energy as it passes through the tantalum is shown in Fig. 5.
'TotaJenergy loss120 watt_" ]
bremsstrahlung,____1=
J _ to collisionallosses "
": InteractsinTa passesthroughsample
i by somemechanism unattenuated
i Fig. 5. Flowchart showing the energy loss of the electron as it passes through
the tantalum converter.
PRE-EXPERIMENTAL DETAILS 9
The temperature change when an amount of heat energy Q is deposited in amaterial of mass m and specific heat c is given by Halliday and Resnick 12 to be
t
QAT = -- (3)
mc
Usin_ Eq. (3), the temperature rise in the region of the converter struck by theelectron beam was expected to be _53 °/sec, in the absence; of any cooling.
The actual temperature rise was dependent on how mltch the converter wouldcool due to (a) black-body radiation enfission and (b) he,at conduction into thebody of the sample. As the sample heats up, it behaves like a black-body radiator,radiating energy at a rate proportional to the fourth power of its temperature.Calculations of black-body emissions were determined for a sample temperature of850 K, which is just below the oxidation temperature of 873 K. The calculationspredicted only 9.3 watts of cooling for the converter due to black-body radiation.
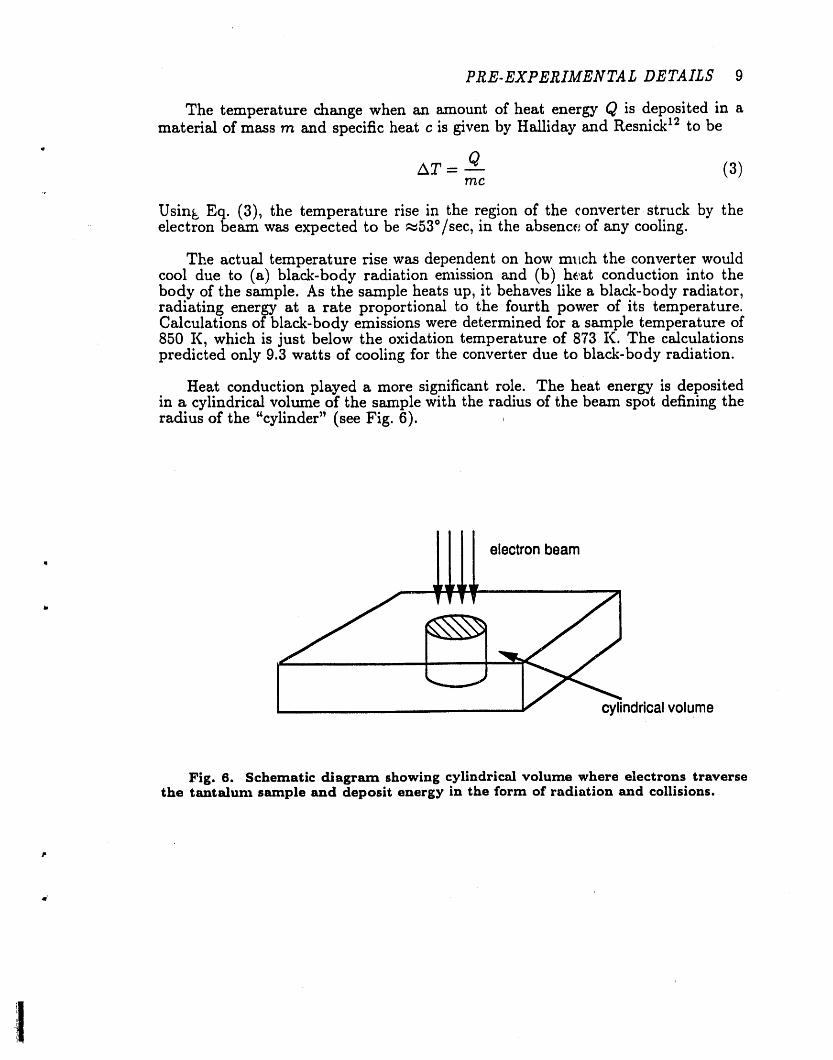
Heat conduction played a more significant role. The heat energy is depositedin a cylindrical volume of the sample with the radius of the beam spot defining theradius of the "cylinder" (see Fig. 6).
electronbeamII
cylindricalvolume
Fig. 6. Schematic diagram showing cylindrical volume where electrons traversethe tantalum sample and deposit energy in the form of radiation and collisions.

10 PRE-EXPERIMENTAL DETAILS
The surface area of the sides of the "cylinder" pictured above for the 0.051-cre-thick converter is
A = _r(2 cm)(0.051 cre)= 0.32 cm 2 .
The equation governing the conduction of heat through the converter is givenby Halliday and Resnick 12 to be:
A._Q= K A /kTAt L
where
/kt = time (1 second)AQ = heat energy transferred
K = thermal conductivity (0.5 watts/cm2/sec)/kT = 53°C
L = 0.1 cm
Solving for/kQ, the heat energy transferred gives AQ = 85 watts/sec, a valuelarger than the 19.5 watts/sec deposited in the foil. Thus, the body of the samplewill absorb the electron energy deposited. The mass of the irradiated area is 2.65gm and the mass of the entire converter is about 38.2 gm. Since the entire converteris about 14 times as massive as the irradiated volume, the temperature rise wouldbe expected to be:
(500C/sec)/14 ~ 3 5°C/sec_" ' ° , I
A similar type of analysis was done for the thin foil, and it was found by comparison ,that the Ta converter absorbed a greater portion of the incident electron beamenergy. Thus, it was desired to keep the temperature rise of the converter to aminimum.
2.3 SUMMARY
The expected rate of temperature increase, coupled with the expected yield ofthe reaction products per second, suggested that a continuous irradiation of about100 seconds would be sufficient to induce enough radioactivity by photo-nuclearreactions and still prevent oxidation of the sample.
3. EXPERIMENTAL DETAILS
Because of limitations imposed at the time of the irradiation, primarily safetyconsiderations but also because of a mechanical fault of the ORELA target systemat the time of measurement, the irradiation configuration had to be designed touse the then existing ORELA target configuration. The Ta converter and thin foilwere mounted onto the ORELA target using thin aluminum rods in the orientationshown in Fig. 4. The 150-IvleV electron beam produced by the ORELA first strucka Ta converter of thickness C.051 cm, resulting in the production of bremsstrahlungradiation in the forward direction. This bremsstrahlung radiation then went onto interact by means of the (rf, xn yp) reaction in a 0.0076-cm-thick Ta foil. Theirradiation of the foil at 1 kilowatt of beam power lasted for 120 seconds.
To measure the increase in temperature, a thermocouple was attached to theconverter at a location just outside of the expected incident beam spot. The ther-mocouple was monitored by personnel outside the accelerator room using an elec-tronic meter connected to the thermocouple by mea,us of a long wire. The initialtemperature of the Ta converter was 25°C and it rose to 67°C by the end of the120-second irradiation. Thus, the rate at which the converter heated was less thanthe 3.8°C/sec that was expected. This temperature rise as recorded by the thermo-col_ple may not be an accurate value, however. There is evidence, discussed below,that the electron beam struck the Ta converter above the expected spot, meaningthat the actual temperature rise of the converter was probably greater than the42°C recorded by the thermocouple. Nevertheless, no oxidation or discoloration ofthe sample occurred.
° At the end of irradiation, the foil and converter were retrieved from the targetroom and briefly monitored for radioactivity. After it had been determined thatthe sample had enough activity for analysis, it was transported in a lead pig to
" a laboratory equipped with two _'-ray detector systems, each of high-purity ger-manium. The thin sample foil was removed from the pig and initially placed onthe 20-cre level of the detector ladder and lowered into the lead cave containing aGe(Li) detector. The analyzer was activated and a short 10-second data acquisitionwas taken for the purpose of determining the dead time of the detector. Since thedead time was found to be only about 5%, the sample was moved to the 10-cre levelwhere the dead time was a reasonable 13°_. A sequence of data acquisitions ensued,consisting of 60, 90, 90, 90, 120, 120, 150, and 150 seconds in length. These shortacquisition times were intended to record the gamma emissions of any short-livedradioisotopes created in the irradiation. The total amount of time elapsed from theend of the irradiation to the start of data acquisition was about six minutes.
The times of the data acquisitions grew longer and longer after the initial eight,and as of this writing approximately 65 spectra have been recorded over a 28-dayperiod. The information on the spectra relevant to data taken on the thin foil is
, given in Table 2.
11
12 EXPERIMENTAL DETAILS
Table 2. Record of Data Gathered in Ta _radiation Experiment
Run Cooling time ReM time Live time Detector Distance .number (seconds) (seconds) (seconds) Type a (cm)
1 360 63 60 Gel 20.52 430 95 90 Ge 20.53 810 68 60 Ge 10.54 882 102 90 Gel 10.55 990 102 90 Geq 10.56 1095 101 90 Geq 10,57 1200 134 120 Geq 10.58 1339 133 120 Geq 10.59 1477 166 150 Ge_ 10.5
10 1648 165 150 Ge 10.511 1943 328 300 Ge 10.512 2316 392 360 Ge 10.513 2822 487 450 Ge 10.514 3339 592 550 Ge 10.515 4069 643 600 Ge 10.516 4735 961 900 Ge 10.517 5715 1273 1200 Ge 10.518 7140 1267 1200 Ge 10.519 8433 1576 1500 Ge 10.520 10002 1882 1800 Ge 10.521 12810 2244 2160 Ge 10.522 16480 2477 2400 Ge 10.523 18960 2777 2700 Ge 10.524 21750 3076 3000 Ge 10.525 24830 3680 3600 Ge 10.5 •26 28520 3669 3600 Ge 10.527 32190 4272 4200 Ge 10.528 36470 4870 4800 Ge 10.5 "30 63180 7200 7131 Ge 10.531 70870 7376 7316 Ge 10.532 78430 9186 9125 Ge 10.533 89220 10042 10000 Ge 10.5 q
34 99270 10034 10000 Ge 10.535 109300 10029 10000 Ge 10.536 119300 10023 10000 Ge 10.537 129400 10020 10000 Ge 10.538 139400 10017 10000 Ge 10.539 149500 11009 10994 Ge 10.540 161600 18022 1S000 Ge 10.542 197700 18016 18000 Ge 10.543 215700 18014 18000 Ge 10.544 233700 18013 18000 Ge 10.545 251800 18012 18000 Ge 10.546 270900 24014 24000 Ge 10.547 294900 24015 24000 Ge 10.548 319740 37064 37050 PS 5.5 .50 357900 24014 24000 Ge(Li) 10.5
EXPERIMENTAL DETAILS 13
Table2.Continued
o Run Coolingtime Realtime Livetime Detector Distancenumber (seconds) (seconds) (seconds) Type a (cre)
51 381360 24013 24000 Ge(Li) 10.5" 52 405500 40300 40275 LEPS 5.5
53 451068 41147 44101 Ge(Li) 3.054 510270 70258 70200 Ge( Li ) 3.055 591690 87732 87700 LEPS 5.056 698160 93975 93900 Ge(Li) 3.057 793470 84860 84800 Ge(Li) 3.059 871400 78430 78400 LEPS 5.061 957800 87144 87100 LEPS 5.063 1049000 134102 134007 Ge(Li ) 3.065 11$3320 180512 180404 Ge(Li) . 3.068 2365220 164627 164518 Ge(Li) 3.074 1821320 60827 60855 LEPS 5.075 1907680 232092 232199 LEP S 5.076 2166990 65000 65030 LEPS 5.077 2255250 62000 62029 LEPS 5.079 2320470 79700 79727 LEPS 5.0
aGe(Li) is a large-volume detector. LEPS is a Low-Energy Photon detector.
Two detectors were used to gather data, the Ge(Li) and a LEPS detector. TheGe(Li) detector recorded gamma energies up to 2800 keV while the LEPS detectormeasured low energy gammas (energies less than about 400 keV) with the betterresolution. In the LEPS, the sample was placed at the 5-cm source-to-detector
' level. Since the true location of the beam spot was not near the middle of thesample as expected, a correction to the final yields of radionuclides determinedusing LEPS data was needed. Also, looking at Table 2, the source-to-detector
" distances corresponding to runs 1-52 all have an additional 0.5 cm added on. Thiswas necessary because the sample was not flat initially but was bowed slightly, andthe estimated curvature was 0.5 cre. For the runs past No. 52, the sample wasphysically flattened so that the addition of 0.5 cm was no longer necessary.
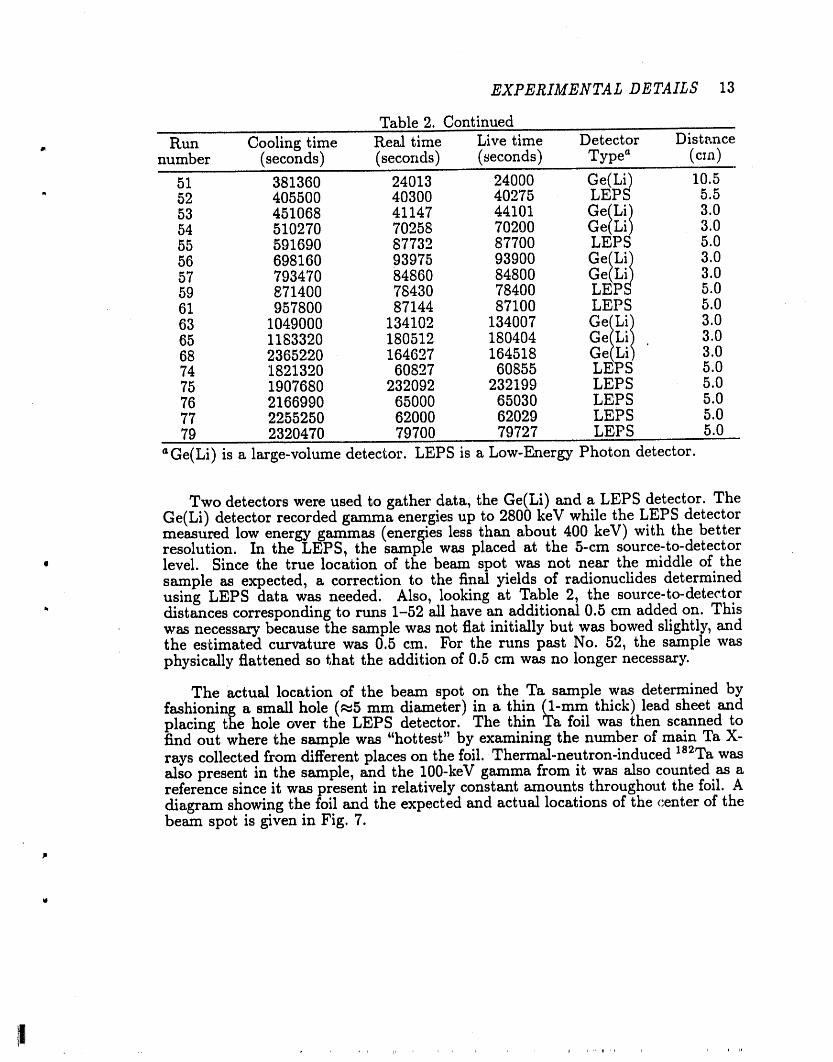
The actual location of the beam spot on the Ta sample was determined by
fashioning a small hole (_,5 mm diameter) in a thin (1-mm thick_ lead sheet andWasplacing the hole over the LEPS detector. The thin Ta foil hen scanned tofind out where the sample was "hottest" by examining the number of main Ta X-rays collected from different places on the foil. Thermal-neutron-induced lS2Ta wasalso present in the sample, and the 100-keV gamma from it was also counted as areference since it was present in relatively constant amounts throughout the foil. Adiagram showing the foil and the expected and actual locations of the center of thebeam spot is given in Fig. 7.
14 EXPERIMENTAL DETAILS
Fig. 7. Beam.spot location diagram. It was anticipatedthat the photon-induced radioactivity would be well inside thecircle shown in the figure. To check this assumption, the samplewas scanned as described in the text. The numbered points repre-sent locations at which the sample was scanned for radioactivitylevel. These numbers correspond to the trial numbers given inTable 3. 8
a
The results of searching for the center of the area struck by the electron beamis given in Table 3. The numbers on the face of the foil correspond to the trialnumbers in the table.
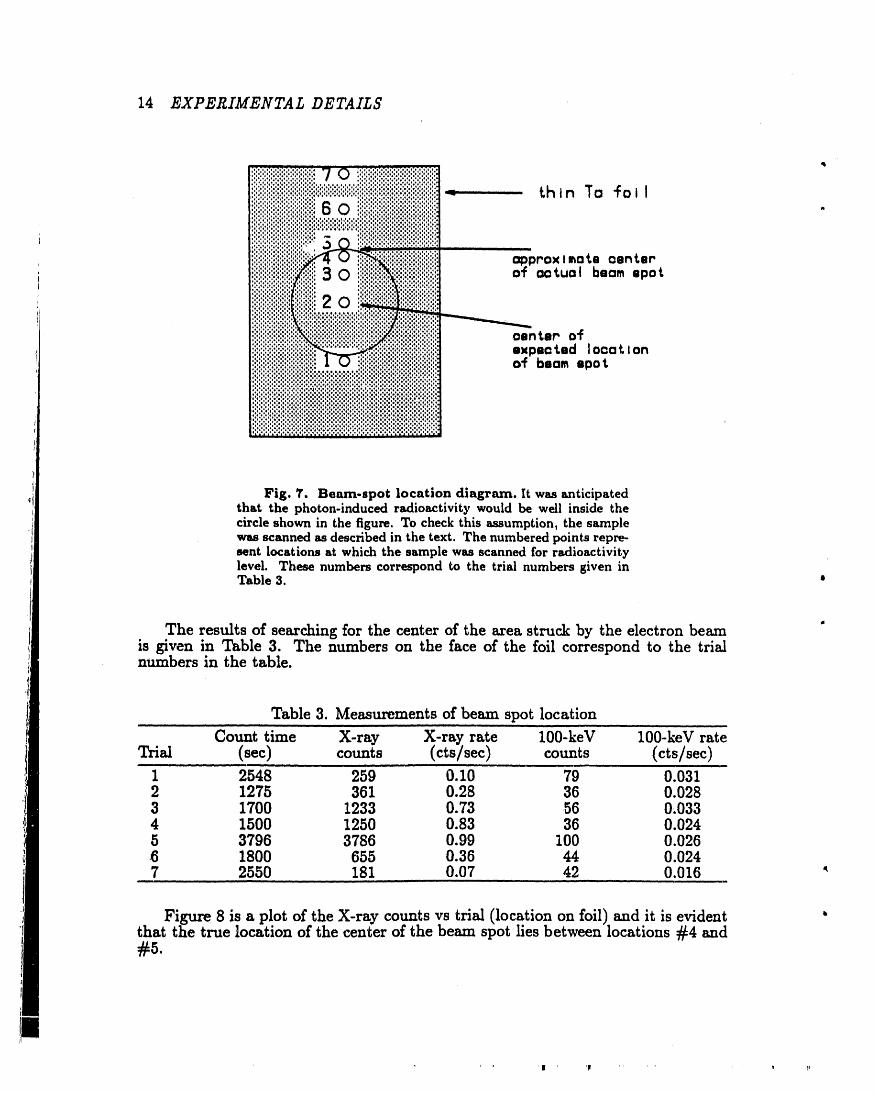
Table 3. Measurements of beam spot location
Count time X-ray X-ray rate 100-keV 100-kev rateTrial (sec) counts (cts/sec) counts (cts/sec)
1 2548 259 0.10 79 0.0312 1275 361 0.28 36 0.0283 1700 1233 0.73 56 0.0334 1500 1250 0.83 36 0.0245 3796 3786 0.99 100 0.0266 1800 655 0.36 44 0.0247 2550 181 0.07 42 0.016
Figure 8 is a plot of the X-ray counts vs trial (location on foil) and it is evidentthat the true location of the center of the beam spot lies between locations #4 and#5.
..... | ' til .... , , I_
EXPERIMENTAL DETAILS 15
_,4 m
• ,.2_ DETERMINATION OF THE BEAM SPOT
l.OU
_ 0,8e
SO 0.6
0,4
O.2
0.02 3- 4 S o ?.
6amp Ie scan Iocat i on
Fig. 8. Plot of X-ray counts per second versus sample"scan" location in an attempt to define the location of
the actual beam spot.
A sample of the actual spectral data can be found in Figs. 9-11 on the followingpages. The majority of the peaks are associated with tantalum isotopes, althoughthe presence of the le°Hf isomer with a gamma-ray energy of 443 kev is also evident.
16 EXPERIMENTAL DETAILS
i 7F! o
| .......
II -. W I
" ' (S.I.LLI.+ tHLL_)81_g"'_" "' " CO
(NO,_,H,NNV)_L_-_".'_."I (IH,,,Om)I.OG;--//'-" 0
! (J,"'"0_4c" 'i _I
(elszL)9ct,. =- _ -
.... C'-, ;-_ o°, =_
(e.Lu.,ezo.)tC_..,,i--." , L '
- I _ "I"
% 0
o I
m
I , ,I 1 ! 4_. i ,1 '_ 1 il _ " o
i ==)_._ __ ; c_, I(,=0,,)_a_--Ik_I_ 'T=Z_ ;
, ,I_ "e ",.!I" ' '• . • " ;" . l . I
7:INNVHOISINI7OO *
&
Fig. 9. Low-energy segment of the spectrum obtnined commencing about 1.58hours at the end of a 120-second irradiation of a 1s1 Ta foil by bremsstrnhhtug fromthe ORELA. Peaks are labelled with detected gamma-ray energy, in keV, and theassigned radioisotope.
EXPERIMENTAL DETAILS 17
t. Iu ® , (e.L_L)0SZl.----,.¢" Z
6_,';_. I ('_LL!_g_L---"-,___.' _-' "
= (e.Lt,zl.)90_l.t = -'-,
(._zLIO6_L',= -', = ,
, , ,',,
(egOI.).-.--_-.- _ _ ,;
(e.L_L_)9_'8--- "--"_=._ ..___'_'_
(eJ._z_l_g----- "-- _"
(LSZ)_ "-"
(eaz_)0_z._....... , _[lad OJ C_ LO O4 O_ I_D
0 o
" "I:JNNVHO/S.LNI']OO
./
Fig. 10. Next larger-energy segment of the spectrum.

18 EXPERIMENTAL DETAILS
(elgL I.)_9BI."-'-'_"
(D O O O O O O O CDO tr) cD to o _ o tn.q. cO tr) cq Cq ,- ,-
7_]NNYHOISINI700w
Fig. 11. Highest-energy portion of the spectrum. A double-escape peak is labelledwith the responsible gamma-ray energy, in keV, minus 1022 keV.
* 4. DATA REDUCTIONP
The spectral data were first reduced using TPASS, x3 a gamma-ray spectrum" analysis and isotope identification computer code. This code first determined peak
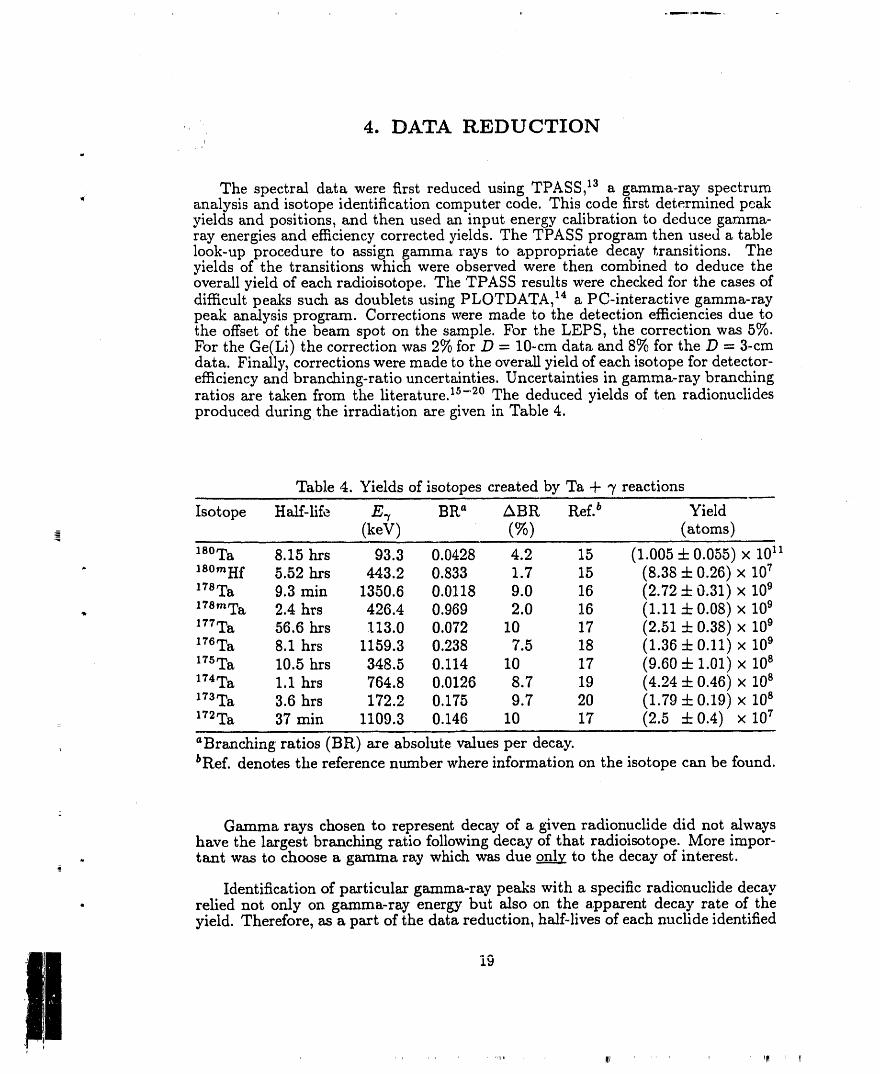
yields and positions, and then used an input energy calibration to deduce gamma-ray energies and efficiency corrected yields. The TPASS program then used a tablelook-up procedure to assign gamma rays to appropriate decay transitions. Theyields of the transitions which were observed were then combined to deduce theoverall yield of each radioisotope. The TPASS results were checked for the cases ofdifficult peaks such as doublets using PLOTDATA, 14 a PC-interactive gamma-raypeak analysis prograra. Corrections were made to the detection efficiencies due tothe offset of the beam spot on the sample. For the LEPS, the correction was 5%.For the Ge(Li) the correction was 2% for D = 10-cm data and 8% for the D = 3-credata. Finally, corrections were made to the overall yield of each isotope for detector-efficiency and branching-ratio uncertainties. Uncertainties in gamma-ray branchingratios are taken from the literature. 15-2° The deduced yields of ten radionuclidesproduced duringthe irradiation are given in Table 4.
Table 4. Yields of isotopes created by Ta + 7 reactions
Isotope Half-life E v BR a ABR Ref. b Yield
(keV) (%) (atoms)
iS°Ta 8.15 hrs 93.3 0.0428 4.2 15 (1.005 4-0.055) x 1011" Is°mill 5.52 hfs 443.2 0.833 1.7 15 (8.38 4- 0.26) x 107
l_STa 9.3 rain 1350.6 0.0118 9.0 16 (2.72 4- 0.31) × 109. 17S'Ta 2.4 hfs 426.4 0.969 2.0 16 (1.11 4- 0.08) x 109
177Ta 56.6 hfs 113.0 0.072 10 17 (2.51 4- 0.38) x 109l_STa 8.1 hrs 1159.3 0.238 7.5 18 (1.36 4- 0.11) x 109175Ta 10.5 hrs 348.5 0.114 10 17 (9.60 4- 1.01) x l0 s174Ta 1.1 hrs 764.8 0.0126 8.7 19 (4.24 4- 0.46) x 10817aTa 3.6 hrs 172.2 0.175 9.7 20 (1.79 4- 0.19) x l0 s
= 172Ta 37 rain 1109.3 0.146 10 17 (2.5 4-0.4) x 107
, "Branching ratios (BR) are absolute values per decay.bRef. denotes the reference number where information on the isotope can be found.
Gamma rays chosen to represent decay of a given radionuclide did not alwayshave the largest branching ratio following decay of that radioisotope. More impor-
. tant was to choose a gamma ray which was due _ to the decay of interest.m_
Identification of particular gaznma-ray peaks with a specific radionuclide decay- relied not only on gamma-ray energy but also on the apparent decay rate of the
yield. Therefore, as a part of the data reduction, half-lives of each nuclide identified
_A
IU
20 DATA RED UCTION
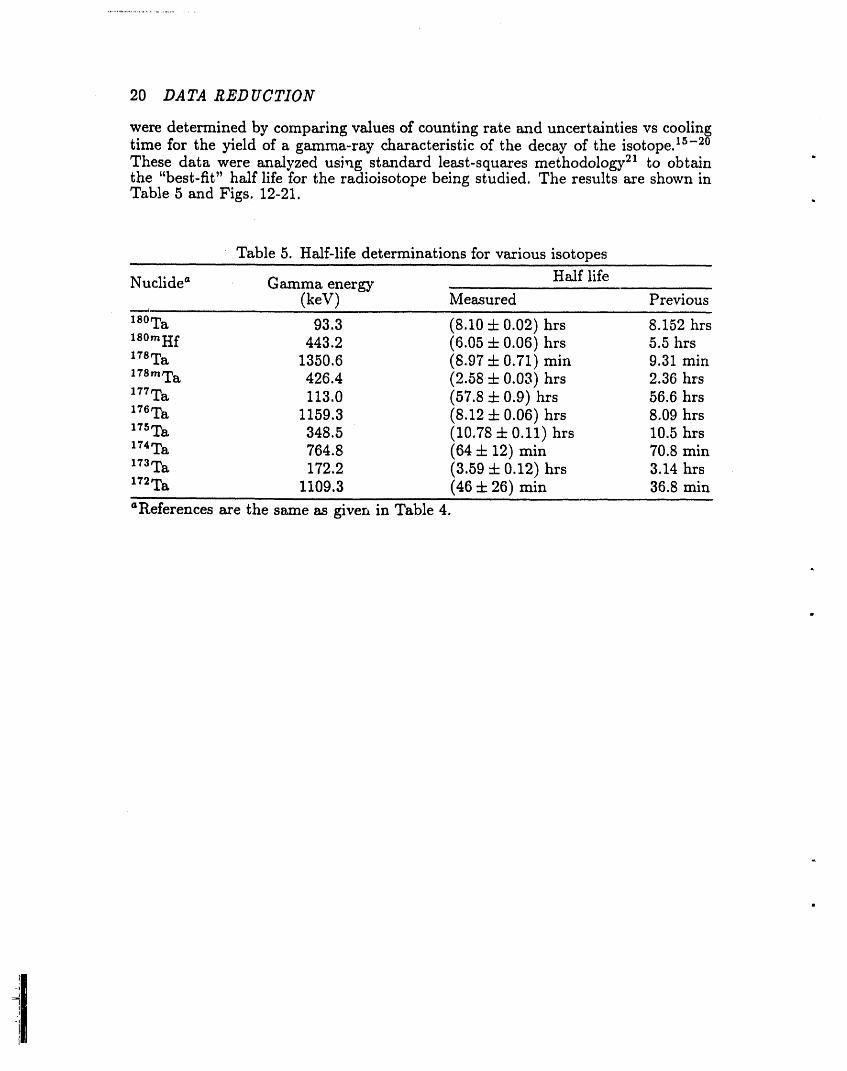
were determined by comparing values of counting rate and uncertainties vs coolingtime for the yield of a gamma-ray characteristic of the decay of the isotope. 15-2°These data were analyzed using standard least-squares methodology 21 to obtainthe "best-fit" half life for the radioisotope being studied. The results are shown inTable 5 and Figs. 12-21.
• Table 5. Half-life determinations for various isotopes
Nuclide a Gamma energy Half life(keV) Measured Previous
iS°Ta 93.3 (8.10 ± 0.02) hrs 8.152 hrslS°mHf 443.2 (6.05 4- 0.06) hfs 5.5 hfs178Ta 1350.6 (8.97 4- 0.71) min 9.31 rain178mTa 426.4 (2.58 4-0.03) hrs 2.36 hrs177Ta 113.0 (57.8 4- 0.9) hrs 56.6 hrs176Ta 1159.3 (8.12 4- 0.06) hrs 8.09 hrs175Ta 348.5 (10.78 4- 0.11) hrs 10.5 hrs174Ta 764.8 (64 4- 12) min 70.8 min173Ta 172.2 (3.59 4- 0.12) hrs 3.14 hrs172Ta 1109.3 (46 -4-26) min 36.8 min
aReferences are the same as given in Table 4.
ti
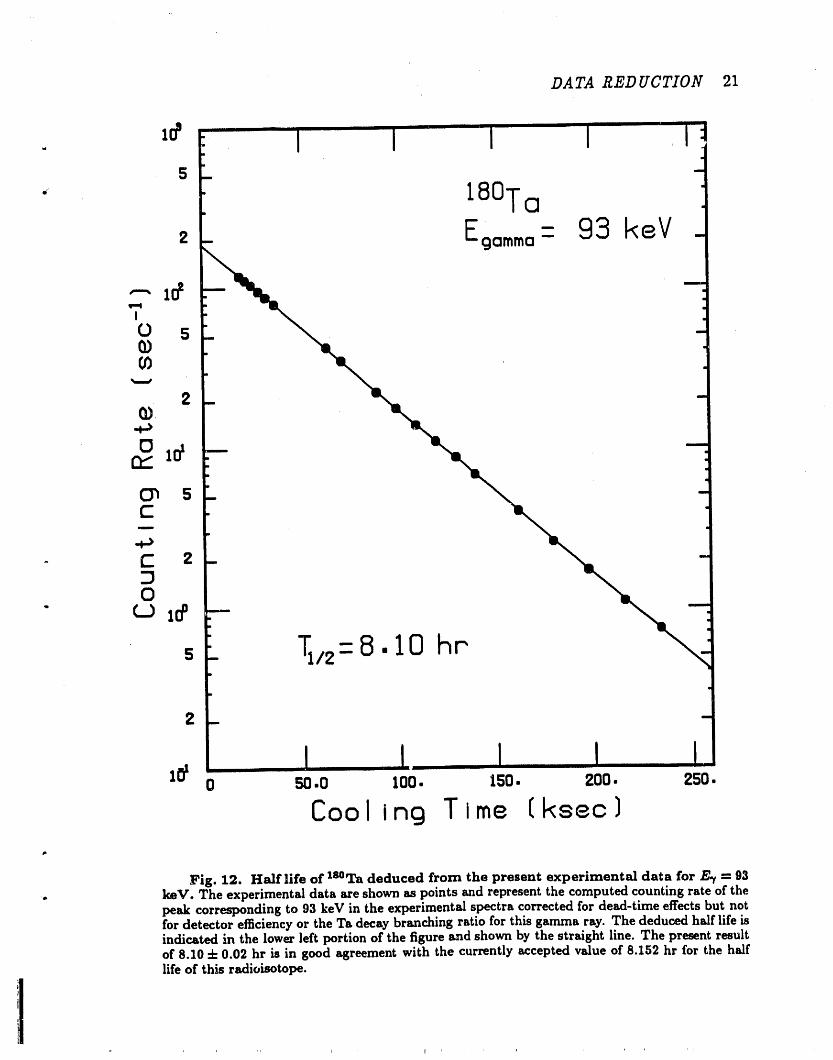
DATA RED UCTION 21
mm a
I I I I !o so.o _oo. _so. zoo. zso.
Cool ing T line ( ksec )
Fig. 12. Half life of la°Ta deduced from the present experimental data for E_ -- 93. keV. The experimentaldata areshown aspointsand representthe computed countingrateofthe
peak correspondingto 93 keV intheexperimentalspectracorrectedfordead-timeeffectsbut notfordetectorefficiencyortheTadecaybranchingratioforthisgamma ray.Thededucedhalflifeisindicatedinthe lowerleftportionofthe figureand shown by thestraightline.The presentresultof 8.104-0.02hr isingood agreementwith thecurrentlyacceptedvalueof8.152hr forthe halflifeofthisradioisotope.
I
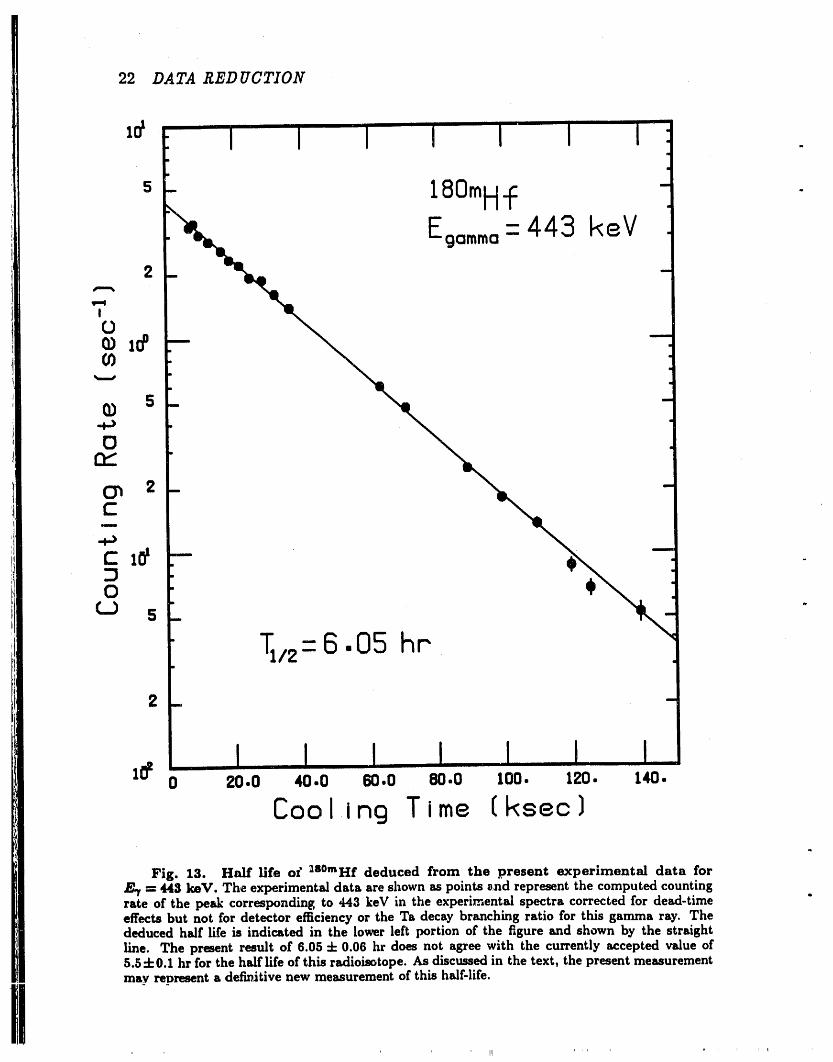
22 DATA RED UCTION
I I I I ! I IlO'o zo.o 40.0 eo.o eo.o lOO. '12o. _o.
Coo II ng T i me ( ksec )
Fig. 13. Half life of :S°mHf deduced from the present experimental data forE. r ----443 keV. The experimental data are shown as points end represent the computed countingrate of the peak corresponding to 443 keV in the experimental spectra corrected for dead-timeeffects but not for detector efficiency or the Ta decay branching ratio for this gamma ray. Thededuced half life is indicated in the lower left portion of the figure and shown by the straightline. The present result of 6.05 -t- 0.06 hr does not agree with the currently accepted value of5.5-t" 0.1 hr for the half life of this radioisotope. As discussed in the text, the present measurementmay revresent a defivitive new measurement of this half-life.
I! "ppl
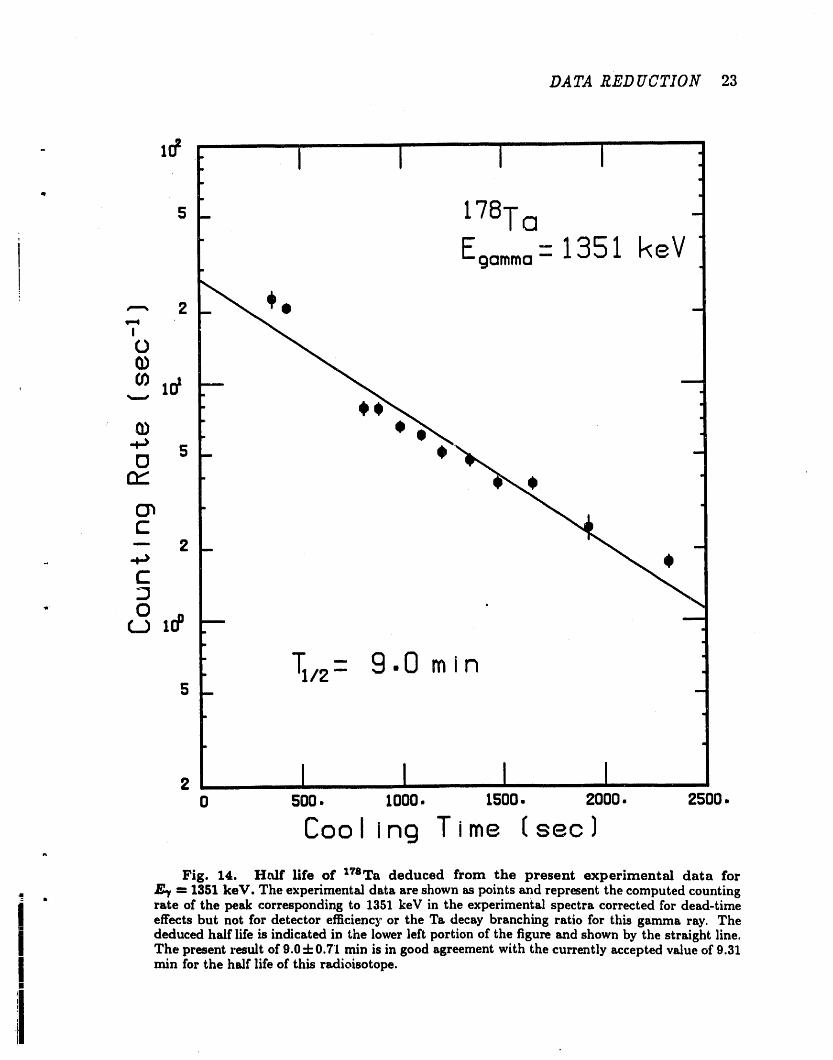
DATA RED UCTION 23
2 I I I I0 500. 1000. 1500. 2000. 2500.
Cool ing Time (see )
Fig. 14. Half life of :TSTa deduced from the present experimental data forE_ -- 13S1 keV. The experimental data are shown as points and represent the computed counting
_ " rate of the peak corresponding to 1351 keV in the experimental spectra corrected for dead-time
n
effects but not for detector efficiency or the Ta decay branching ratio for this gamma ray. Thededuced half life is indicated in the lower left portion of the figure and shown by the straight line.The present result of 9.0 4- 0.71 min is in good agreement with the currently accepted value of 9.31min for the half life of this radioisotope.
m
]
, 'i
24 DATA RED UCTION
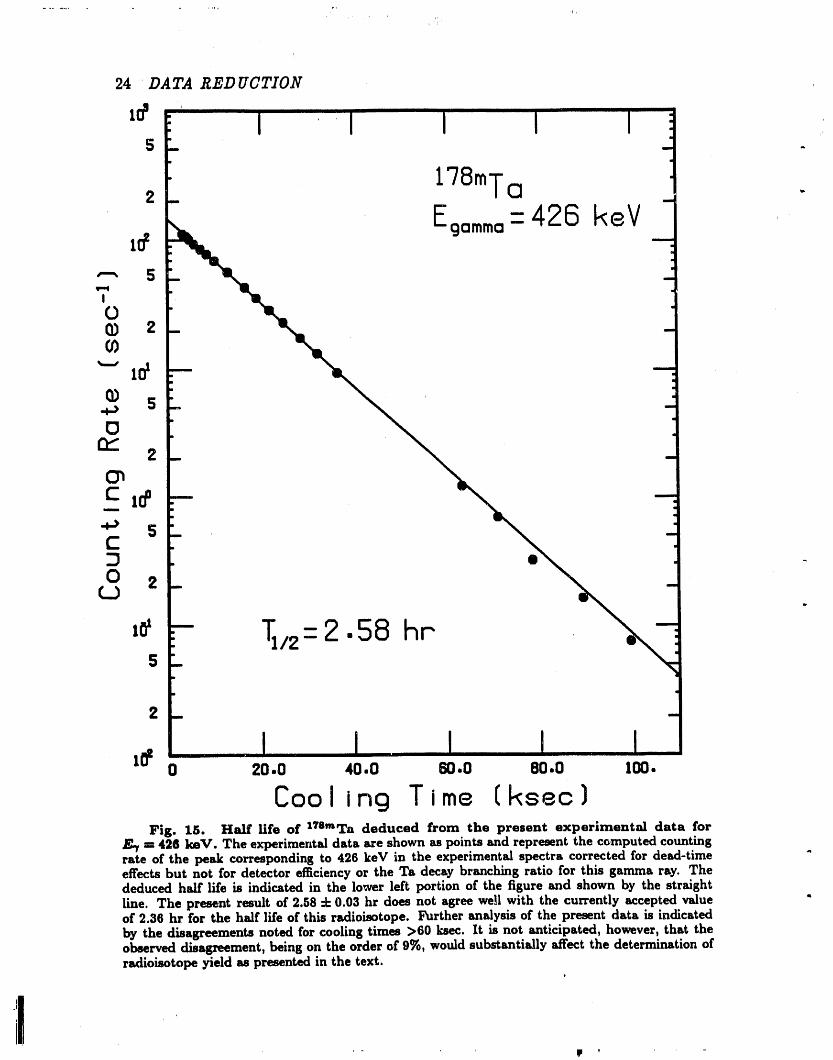
I ' I I I I
178mTa2 -
E = 426 keVI02 gamma __
5
I
0O) 2(/)
'-'ioI --
(I) 5.+.>
0
2
C_c _oo
5
0 20
- /2-2.58 ht-5 .
i
2 . --
I I, I , I1lr -0 20.0 40.0 60.0 80.0 100.
Cool ing Time ( ksec )Fig. 15. Half Ufe of 178mTa deduced from the present experimental data for
= 426 keV. The experimental data are shown as points and represent the cemputed countin8rate of the peak correspondin s to 426 kev in the experimental spectra corrected for dead-timeeffects but not for detector efficiency or the Ta decay branching ratio for this gamma ray. Thededuced half life is indicated in the lower left portion of the fisure anti shown by the straisht
line. The present result of 2.58 :I: 0.03 hr does not asree weil with the currently accepted value °of 2.36 br. for the half life of this radioisotope. Further analysis of the present data is indicatedby the disagreement_ noted for coolins times >60 -ksec. Ii is not anticipated, however, that theobserved disaszeement, being on the order of 9%, would substantially aft'ect the determination ofradioisotope yield as presented in the text.
F
'_" DATA RED UCTION 25
' lC¢g
i '
. t77Tas Ego,go- 113 keV=
I
i °Q) 2U)
Q)-la
1oO --
c"
2 ,2:57. r am
.J._101 0 50.0 100. 150. 200. 250. 300. 350. 400.
Cool ing Time [ksec ]16.Fig. Halt'life of 177Ta deduced from the present experimental data for E_ = 113
keV. The experimental data are shown as points and represent the computed counting rate of thepeak corresponding to 113 keV in the experimental spectra corrected for dead-time effects but notfor detector ei_ciency or the Ta decay branching ratio for this gamma ray. The deduced half life isindicated in the lower left portion of the figure and shown by the straight line. The present result
* of 57.8 4- 0.9 hr is in good agreement with the currently accepted value of 56.6 hr for the half lifeof this radioisotope.
i
26 DATA RED UCTION
_I-- '1 '1 " I ' I .s t76Ta la o
Ego.mo- I159 keV
,--, 2
I
OO)
(/) 10o ---.
Q)"_ 50
rv
O_c""-- 2,.+.>c-
0
TI/2-8.12 hr5 .
! I I I0 50.0 100. 150• 200.
Cool ing Time (ksec)Fig. 17. Half life of 17eTa deduced from the present experimental data for
-- 1159 keV. The experimental data are shown as points and represent the computed countingrate of the peak corresponding to 1159 kev in the experimental spectra corrected for dead-timeeffects but not for detector efficiency or the Ts decay branching ratio for this gamma ray. Thededuced haft life is indicated in the lower left portion of the figure and shown by the stredght line.The present result of 8.12 4"0.06 hr is in very good agreement with the currently accepted valueof 8.09 hr for the hedf life of this radioisotope.
i
DATA REDUCTION 27
I I I
tqSTaI_' 5 m.. i
Eg,:,,,,mo= 349 keV
i 20(1)0')
(1)ld_ --
0n_
CD 5 _r-
r-
0 20
/2 111_ --
a
i i i I "0 50.0 100. 150. 200.
Cool ing Time (ksec)Fig. 18. Half life of 1TSTa deduced from the present experimental data for E. r = 349
keV. The experimental data are shown as points and represent tile computed counting rate of the" peak corresponding to 349 keV in the experimental spectra corrected for dead-time effects but not
for detector efficiency or the Ta decay branching ratio for this gamma ray. The deduced half life isindicated in the lower left portion of the figure and shown by the straight line. The present resultO"
of 10.8 4- 0.11 hr is in very good agreement with the currently accepted value of 10.5 _ 0.2 hr forthe half life of this radioisotope.
||
m

28 _ATA_E_c_:o_
5 I I' I I '1 I' I I
t74TaEgom_o=765 keV .2
T
21 2 -0
Tl/2= 63,6 rain
50 1000. 2000. 3000. 4000. 5000. 6000. 7000. BOO0.9000.
Cool ing Time (see)]Fig, 19. Hafflife of Z74Ta deduced from the present experimental data for E v = 765
keV. The experimental data are shown as points and represent the computed countin$ rate ofthe peak corresponding to 765 keV in the experimental spectra corrected for dead-time effects butnot for detector efficiency or the Ta decay branching ratio for this gamma ray. The deduced halflife is indicated in the lower left portion of the figure and shown by the straight line. The present .result of 63.6 -t- 12 min is in very good agreement with the currently accepted value of 71 min forthe half life of this radioisotope.
DATA I_EDUCTION 29
_ i" I I 'i I I I -
t7aTaS F'gamma- 172 keV.
2 I I I I I !0 5.00 10.0 15.0 20.0 25.0 30.0 35.0 40.0
Cool ing T tree ( ksec )Fig. 20. Half life of l_Ta deduced from the present experimental data for F_ = 172
keV. The experimental data are shown as points and represent the computed counting rate of the" peak corresponding to 172 kev in the experimental spectra corrected for dead-time effects but not
for detector emciency or the Ta decay branching ratio for this gamma ray. The deduced half life isindicated in the lower left portion of the figure and shown by the straight line. The present result
"' of 3.59 4- 0.12 hr does not agree well with the currently accepted value of 3.14 hr for the half lifeof this radioisotope. As discussed in the text further study is planned on the present experimentalresults.
_!
t
30 DATA R_D _CTION
I I II I I I _-
,,J
t72Ta . :go,mo= 1109 keV
5
I0
°CO
_ 2 .
O_E
E_ .0
/2-45 6 rain
I, I ,I, I I0 1000. 2000. 3000• 4000. 5000.
Cool Ing T tree (see)Fig. 21. Half life of z72Ta deduced from the present experimental data for
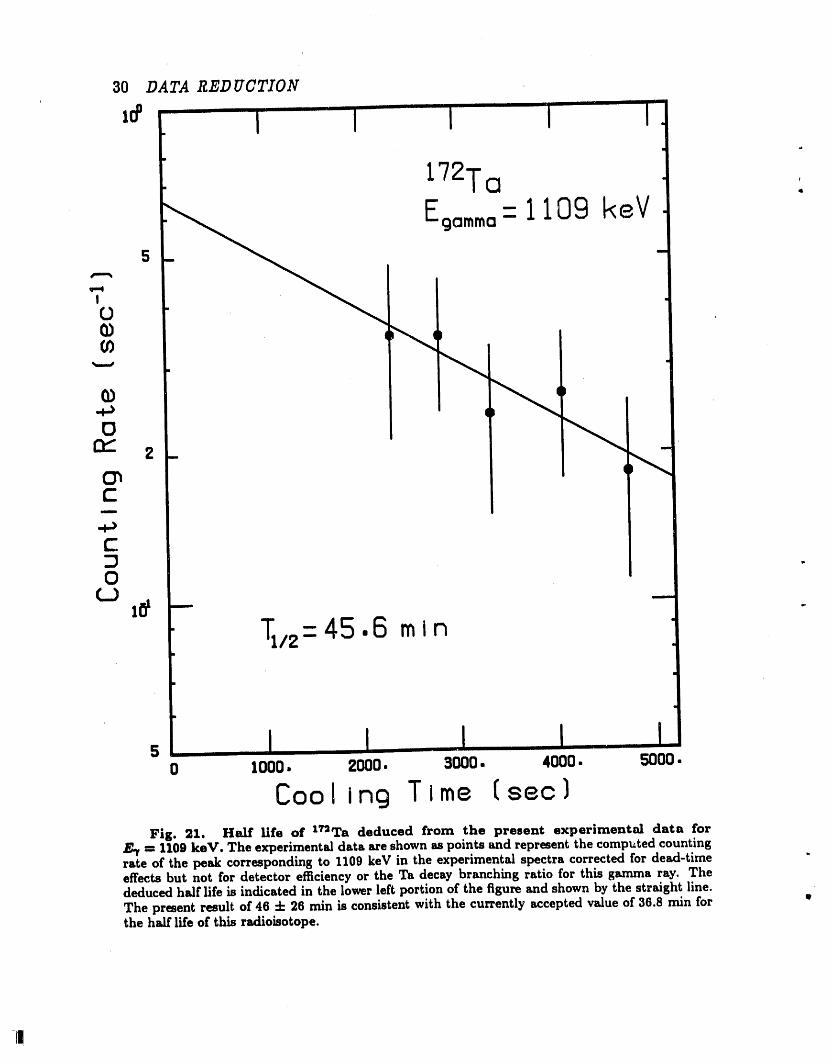
----1109 keV. The experimental data are shown as points and represent the computed countingrate of the peak corresponding to 1109 keV in the experimental spectra corrected for dead-timeeffec.ts but not for detector efficiency or the Ta decay branching ratio for this gamma ray. Thededuced half life is indicated in the lower left portion of the figure and shown by the straight line.
UThe present result of 46 4- 26 min is consistent with the currently accepted value of 36.8 rain forthe half life of this radioisotope.

5. DISCUSSION OF RESULTSJ
, The half-life determinations for 18°Ta, 1TSTa, 17eTa, lr4Ta, and 172Ta agree wellwith previous measurements. 1_-19 The half-life determination for XTVTais close tothe previous value lr and certainly within two standard deviations. A better valuemay have been obtained if points corresponding to shorter cooling times had alsobeen obtained. The half-life of 175Ta is also close enough to the previously measuredvalue 17 to be in satisfactory agreement.
The ls°mHf analysis is interesting in that it may suggest a new value for thishalf-life. We are confident in this suggestion since Xs°mHf has nothing to "feed"it and the gamma ray examined (443 keV) had no interference from other similarenergy gamma rays. The presently measured half life for 173Ta also tends to fitthe criteria used to establish the validity of the presently measured ls°mHf half-life. However, it is apparent from Fig. 20 that the data for 173Ta are more erraticthan in the case of the 18°mHf. Therefore, while the numbers may indicate a newdetermination of the half-life, we suggest that further analysis is required to obtain adefinitive answer. The 178mTa half life is not in agreement with previously measuredvalues. Figure 15 shows the relevant data and the data suggest that the gamma-raypeak in the spectral data may have another, yet to be identified, contribution to itsyield. However, the additional contribution, if there is one, is not large and shouldhave essentially no impact on the reported yield in Table 4 for the amount of 178mTaproduced by the irradiation.
The results displayed in Table 4 indicate that nearly all of the reaction products" are Ta, the most abundant being 18°Ta. As expected, the yields of the various
tantalum isotopes created during the irradiation decrease with decreasing neutron.. number. Thus, the yield of the 172Ta is less than that of 173Ta, which is less than
1T4Ta, etc. These results are not surprising since the yield of the incident photonspectrum (bremsstrahlung) decreases with increasing photon energy. Thus, thetotal number of incident photons having energms in excess of the reaction thresholdenergy (see Table 1) decreases as the value of the reaction threshold increases.
Another interesting observation is that the yields did not decrease successivelyby the anticipated factor of 4. Instead, for yield determinations down to 173Ta thedecrease between successive isotopes was no more than 2.4. This result is, however,approximately consistent with the overall _ 1lE shape of the bremsstrahlung. Oneaspect of the results that does demand further study is the factor of seven differencefrom the yield of the 173Ta to the yield of 172Ta. From Table 1 the Q-value forthe (_,,gn) reaction is 69.6 :t: 0.20 MeV, which lies nearly in the middle of thebremsstrahlung energy spectrum. It can be seen in Fig. 1 that the curve is notsteeply sloping at this point. Thus, this decrease in yield from 173Ta to 172Ta islarger than expected just from the shape of the bremsstrahlung curve.
.e
It is also interesting to note that previous experimental work at this laboratory 22: on photon irradiation of elemental Ni shows that the preferred reaction mechanism
was the (_', lp) reaction. In this experiment with tantalum, the yield of lS°mHfcorresponding to the (% lp) reaction is substantially smaller than the yield of the
31
' '' • , , n
32 DISCUSSION OF RESULTS
18°Ta which results from the (7, in) reaction. For tantalum the preferred reactionmechanism is (7, ln).
Finally, it was observed that a l_ge amount of thermal-neutron-induced lS2Tawas present in nearly constant amounts throughout the sample. The production ofthis radionuclide is not due to any (7, xn yp) reaction with tantalum, but instead isa result of the ORELA target being a strong source of low-energy neutrons, lS_Tahas a ha/f-life of 114.5 days, and its presence was in such large amounts that itinterfered with analysis of decay gamma rays from other long-lived radionuclidesproduced by photonuclear reactions during the irradiation.
6. CONCLUSION
The study of radionuclides created in the electron-bombardment of element181Ta has had the first purpose of determining types and yields of each isotope cre-ated. The results give both qualitative and quantitative information on the overallproduction yields of ten radionuclides covering a mass range of 9 units. As statedpreviously in the introduction, this information is useful for the purposes of bothbasic physics and applied science. In an applied sense, these yield determinationsprovide a basis for accurate assessments of what kind (and how much) of a particu-lar radiosotope will be present in the ORELA target. All of the tantalum isotopescreated by ('_: _n) reactions have fairly short half-lives and would not be expectedto be present in the ORELA target in any significant quantities after several days ofcooling. Since all the tantalum isotopes created in the irradiation with the excep-tion of very long-lived iS°Ta decay, the production of long-lived radionuclides suchas 172Hf, 175Hf, etc., is to be expected. The amounts of these, however, are smallin comparison to the amount of 182Ta produced. For maintenance and, ultimately,disposal purposes, the greatest concern should be with the amount of 182Ta presentm the ORELA target.
The analysis of the half-fives of the ten radionuclides also revealed useful in-formation. The previous half-fife measurements for five of the radionuclides 15-19(iS°Ta, 1TSTa, 176Ta, 174Ta, and 172Ta) were supported by our measurements. Half-life measurements 175Ta and 177Ta were interpreted as being supportive of previousmeasurements iv due to the fact that they were within two standard deviations.The last three half-life measurements for xTSmTa, 18°mHf, and 173Ta were found
• to disagree with measurements found in the literature. 15,16,19 The data suggest anew determination of the half-life for 18°mHf as 6.05 =t=0.06ht, or about 10% longer
, than the currently adopted value for this half life. The erratic nature cf the data" in Fig. 20 suggests that further analysis on 17ZTais needed. The only measurement
which appeared to have a problem was that for lrsmTa. The possibility of an un-known contribution necessitates further investigation before a definitive conclusioncan be reached.
As a final note, future experiments intending to study the (7, xn yp) reactionin greater detail are advised to use an experimental configuration in which captureeffects due to neutrons produced by the Ta target are minimized, thus revealingthe presence of any long-lived radionuclides created during irradiation. Placing thesample as far away from the target as possible is strongly recommended.
I
REFERENCESw
1. R. G. Alsmiller, Jr., T. A. Gabriel, and M. P. Guthrie, Nuclear Science andEngineering 40, 365 (1970).
2. C. E. Burgart, E. A. Straker, T. A. Love, and R. M. Freestone, Jr., Nucl. Sci.Eng. 42,421 (1970).
3. R. Borgere, H. Beil, and A. Veyssiere, Nucl. Phys. A121, 463 (1968).
4. K. Masumoto, T. Kato, and N. Suzuki, Nucl. Instruments and Methods 157,567 (197S).
5. T. A. Lewis, (private communication).
6. S_udies in Penetration of Charged Particles in Matter, National Academy ofSciences - National Research Council Publication 1133 (Washington, D.C.,1964).
7. H. E. Johns, L. Katz, R. A. Douglass, and R.N.H. Haslam, Physica/Review 80, 062(1950).
8. A. S. Penfold and J. E. Leiss, Phys. Rev. 114, 1332 (1959).
9. A. H. Wapstra and G. Audi, Nuc/. Phys. A432, 1 (1985).
10. F. Walker, D. G. Miller, and F. Feiner, Chart of the Nuc]ides, (General ElectricCo., 1984), Thirteenth Edition, p. 41.
11. J. E. "Turner, A_oms, Radiation, and Radiation Pro_ection, (Permagon Press,New York, 1986), p. 93, 123.
12. D. Halliday and R. Resnick, Fandamentals of Physics, (John Wiley and Sons,Inc., 1988), Third Edition, p. 466, 472.
13. J. K. Dickens, TPASS, A Gamma-Ray Spectrum Analysis and Isotope 'Identification Computer Code, Oak Ridge National Laboratory Report No.ORNL-5732 (1981).
14. R. L. Bywater, Jr., Gamma-Ray Production Cross Sections for 0.9 to 20 MeVNeutron Interactions with l°B, Oak Ridge National Laboratory Report No.ORNL/TM-10191 (1986).
15. E. Browne, Nucl Data Sheets 52, 127 (1987).
16. E. Browne, Nuc/. Data Sheets 54, 199 (1988).
17. U. Reus and W. Westmeier, Atomic and Nuclear Data Tab]es 29, 193 (1983).
18. E. Browne, Nuc/. Data Sheets 60, 227 (1990).
19. E. Browne, Nuc/. Data Sheets 41,511 (1988).
20. V. S. Shirley, Nuc/. Data Sheets 54, 589 (1988).
21. J. K. Dickens, Rad/ochem. Radioanal. Left. 39, 107 (1979).
22. J. K. Dickens, Study of Radionuclides Created by "atNi(7, xn yp) Reactions forBremsstrahlung Photons Produced by 140-MEV Electrons, Oak Ridge NationalLaboratory report No. ORNL/TM-9764 (1986).
34
ii

l' l t) IQp
.=
i
Ii-}


![Risks from naturally occurring radionuclides in the Nordic ...¸d.pdf · radiation Other radionuclides in air [KATEGORINA VN] [KATEGORINA VN] Anthropogenic radionuclides in diet Average](https://img.pdfslide.us/doc/110x75/5f8a90afcd79846e8d420ef0/risks-from-naturally-occurring-radionuclides-in-the-nordic-dpdf-radiation.jpg)