Embed Size (px)
Citation preview

Assessing the Barriers and Incentives to the Adoption of
Integrated Multi-Trophic Aquaculture in the Canadian Salmon
Aquaculture Industry
by
Stefan Crampton B.A. & Sc., McGill University, 2011
Research Project Submitted in Partial Fulfillment of the
Requirements for the Degree of
Master of Resource Management
Report No. 643
in the
School of Resource and Environmental Management
Faculty of Environment
© Stefan Crampton 2016
SIMON FRASER UNIVERSITY Spring 2016

ii
Approval
Name: Stefan Crampton Degree: Master of Resource Management Report No. Title:
643 Assessing the Barriers and Incentives to the Adoption of Integrated-Multi Trophic Aquaculture in the Canadian Salmon Aquaculture Industry
Examining Committee: Chair: Sinead Murphy Master of Resource Management Candidate
Duncan Knowler Senior Supervisor Associate Professor
Jonn Axsen Supervisor Associate Professor
Date Defended/Approved:
January 6, 2016

iii
Ethics Statement

iv
Abstract
In recent years, alternative systems of aquaculture production, including Integrated Multi
Trophic Aquaculture (IMTA) and Closed Containment Aquaculture (CCA), have been
developed to mitigate some of the potential adverse environmental effects of
conventional salmon farming. This study assessed the barriers to and incentives for the
adoption of IMTA in the Canadian salmon aquaculture industry, and also investigated
the potential for regulatory and market-based instruments as incentives for further IMTA
adoption. 21 participants representing salmon farmers, industry associations, provincial
and federal government regulatory agencies, and environmental non-governmental
organizations (ENGOs) were interviewed. Data were analyzed using a hybrid thematic
coding approach of both a priori and inductive coding. Results found that participants
considered uncertainty pertaining to biological and technical feasibility, fish health, and
regulations, to be key explanatory factors impeding IMTA adoption. Perceived lack of
profitability, existing regulatory and institutional frameworks, preference for CCA
technology, and a general lack of incentives, were other significant barriers to adoption.
Perceived incentives for adoption include positive ecological benefits of IMTA and the
ability to obtain a premium price for IMTA products through marketing schemes. Several
regulatory and market-based instruments were also perceived to be important in
incentivizing adoption, including further knowledge transfer, nutrient taxes on feed with
IMTA taxed less, corporate tax credits and subsidies. In order to address the multiple
barriers that cumulatively create a strong disincentive to adopt, a “whole-of-government”
approach towards IMTA will be required.
Keywords: Integrated Multi Trophic Aquaculture; Salmon; Farming; Adoption; Dynamics

v
Acknowledgements
I would like to thank my senior supervisor, Dr. Duncan Knowler and supervisor, Jonn
Axsen, for their guidance and support throughout this project. I am incredibly grateful for
the opportunity to have worked on this project with both of you. I would also like to thank
Dr. Thierry Chopin and my colleagues in the Canadian Integrated Multi-Trophic
Aquaculture Network, and the Natural Sciences and Engineering Research Council for
their support and funding.
Thank you also to the School of Resources and Environmental Management at Simon
Fraser University, for providing me with an exceptional learning experience these last
three years. Studying there has opened my mind to many cutting-edge concepts in the
environmental field, and challenged my thinking and ideas. Finally, I would like to give a
huge thank you to my friends and family for all their love and support during this time.

vi
Table of Contents
Approval ............................................................................................................................ ii Ethics Statement .............................................................................................................. iii Abstract ............................................................................................................................ iv Acknowledgements ........................................................................................................... v Table of Contents ............................................................................................................. vi List of Tables ................................................................................................................... viii List of Figures ................................................................................................................... ix List of Acronyms ................................................................................................................ x
Chapter 1. Introduction ................................................................................................ 1 1.1. Problem Statement ................................................................................................... 2 1.2. Research Questions ................................................................................................. 3 1.3. Scope of the Study ................................................................................................... 4 1.4. Organization of the Study ......................................................................................... 4
Chapter 2. Literature Review ....................................................................................... 5 2.1. Theoretical Frameworks of New Technology Adoption ............................................ 5
2.1.1. Inter-Firm Diffusion Models ......................................................................... 7 2.1.2. Intra-Firm Diffusion Models ....................................................................... 10 2.1.3. Real Options Approach ............................................................................. 11 2.1.4. Food and Agriculture Organization Conceptual Model .............................. 12
2.2. Experience from Case Studies ............................................................................... 13 2.3. Market-Based Instruments ...................................................................................... 19
Chapter 3. Background .............................................................................................. 23 3.1. Aquaculture in Canada ........................................................................................... 23
3.1.1. Aquaculture on the West Coast ................................................................. 25 3.1.2. Aquaculture on the East Coast .................................................................. 27 3.1.3. Integrated Multi-Trophic Aquaculture ........................................................ 30 3.1.4. Closed Containment Aquaculture .............................................................. 33
3.2. Governance and Regulation ................................................................................... 35 3.3. Existing Regulatory Barriers to Industry Competitiveness ...................................... 38 3.4. Hypothesized Barriers to IMTA Implementation ..................................................... 40
Chapter 4. Approach and Methods ........................................................................... 41 4.1. Qualitative Analysis Approach ................................................................................ 41 4.2. Participant Selection ............................................................................................... 42 4.3. Qualitative Data Analysis Methods ......................................................................... 45 4.4. Limitations ............................................................................................................... 47

vii
Chapter 5. Results ...................................................................................................... 49 5.1. Barriers to the Adoption of IMTA ............................................................................ 50
5.1.1. Biological Uncertainty ................................................................................ 50 5.1.2. Technical Uncertainty ................................................................................ 52 5.1.3. Regulatory Uncertainty .............................................................................. 54 5.1.4. Fish Health Uncertainty ............................................................................. 55 5.1.5. Profitability ................................................................................................. 56 5.1.6. Regulatory and Institutional Barriers ......................................................... 62 5.1.7. Environmental Concerns ........................................................................... 64
5.2. Incentives for IMTA Development ........................................................................... 67 5.2.1. Ecological benefits ..................................................................................... 67 5.2.2. Eco-Certification Designations and Niche Markets ................................... 68 5.2.3. Regulatory and Market-Based Instruments ............................................... 70
Chapter 6. Discussion ............................................................................................... 75 6.1. Biological Uncertainty ............................................................................................. 75 6.2. Technical Uncertainty ............................................................................................. 76 6.3. Regulatory Uncertainty ........................................................................................... 78 6.4. Fish Health .............................................................................................................. 80 6.5. Profitability .............................................................................................................. 81 6.6. Regulatory and Institutional Barriers ....................................................................... 83 6.7. Environmental Concerns ........................................................................................ 87 6.8. Ecological Benefits ................................................................................................. 89 6.9. Eco Certification Designations and Niche Markets ................................................. 89 6.10. Regulatory and Market-Based Instruments ............................................................ 90
Chapter 7. Policy Recommendations ....................................................................... 96
Chapter 8. Conclusions ........................................................................................... 102
References ................................................................................................................. 104 Appendix A. Salmon Farmer Questionnaire ................................................................. 114 Appendix B. Other Stakeholder Questionnaire ............................................................. 124

viii
List of Tables
Table 1. List of Codes Describing Themes using a Hybrid A-Priori and Inductive Approach .................................................................................. 49
Table 2. Occurrence of Theme “Biological Uncertainty” by Participant Group ....................................................................................................... 50
Table 3. Occurrence of Theme “Technical Uncertainty” by Participant Group ....................................................................................................... 52
Table 4. Occurrence of Theme “Regulatory Uncertainty” by Participant Group ....................................................................................................... 54
Table 5. Occurrence of Theme “Fish Health Uncertainty” by Participant Group ....................................................................................................... 55
Table 6. Occurrence of Theme “Profitability” by Participant Group ....................... 56
Table 7. Occurrence of Theme “Regulatory and Institutional Barriers” by Stakeholder Group ................................................................................... 62
Table 8. Occurrence of Theme “Ecological Benefits” by Participant Group ........... 68
Table 9. Occurrence of Theme “Eco-Certification Designations and Niche Markets” by Participant Group ................................................................. 68

ix
List of Figures
Figure 1. Categories of Adoption and Mansfield Technology Diffusion Curve .......... 6
Figure 2. Aquaculture finfish production in Canada, 1986-2013. ............................ 24
Figure 3. Average yearly price of Atlantic Salmon. ................................................. 24
Figure 4 Licensed marine based finfish sites in British Columbia, 2014. ............... 26
Figure 5. Respondent Rate by Stakeholder Category. ........................................... 43
Figure 6. Level of agreement of respondents on whether uncertainty over technical feasibility represented a barrier to the adoption of IMTA .......... 53
Figure 7. Given what you know about IMTA, would you agree that it would be profitable to adopt at present? ............................................................ 57
Figure 8. Participant perspectives on whether IMTA is profitable to adopt at present ..................................................................................................... 57
Figure 9. Profitability factors influencing the adoption decision. ............................. 59
Figure 10. Participant perspectives on whether they thought CCA was more profitable than IMTA. ................................................................................ 66
Figure 11. Participant perspectives on whether they thought CCA was more environmentally desirable than IMTA. ...................................................... 66
Figure 12. Participant perspectives on whether they thought CCA was more socially desirable than IMTA. ................................................................... 66
Figure 13. How important do you think the factor “Greener Image for Marketing Purposes” would be for farmers in making decisions about adopting new environmental/green technologies, now or in the future? ................................................................................................ 69
Figure 14. How important do you think the factor “Public Pressure” would be for farmers in making decisions about adopting new environmental/green technologies, now or in the future? ........................ 69
Figure 15. Support for general policies by stakeholder group ................................... 71
Figure 16. Industry stakeholder perspectives on specific policies ............................ 72
Figure 17. Government stakeholder perspectives on specific policies ..................... 73
Figure 18. ENGO stakeholder perspectives on specific policies ............................... 73

x
List of Acronyms
CCA CFIA DFO EC ENGO IMTA R&D
Closed Containment Aquaculture Canadian Food Inspection Agency Fisheries and Oceans Canada Environment Canada Environmental Non-Governmental Organization Integrated Multi Trophic Aquaculture Research and Development

1
Chapter 1. Introduction
With increasing demand for fish and seafood products and decreasing catches in
global fisheries, aquaculture has become the fastest growing food sector today (POC
2014). Aquaculture currently provides approximately 50% of total fish/seafood products
consumed by humans worldwide, and production is expected to grow by 7% per year
(FAO 2012; POC 2014). By 2030, it is estimated that global demand for seafood
products will outstrip available supply by 50-80 million tons. To meet increasing market
demand, this deficit likely will have to be met by further increasing aquaculture
production (Chopin et al. 2010). But this production needs to be as environmentally,
economically and socially sustainable as possible. In 2014, approximately 79 000 tonnes
of salmon were farmed in Canada, representing 84% of the total quantity of national
aquaculture production, and 75% of the total value (DFO 2015). Potential adverse
environmental effects of industrial open-net pen salmon aquaculture may include
nutrient loading to the marine environment, decreases in marine water quality, and
transfer of parasites and pathogens to wild salmon stocks (Morton et al. 2004; Krkosek
et al. 2005; Price et al. 2010; Hargrave 2003; Brooks & Mahnken 2003; Wang et al.
2012). Integrated Multi-Trophic Aquaculture (IMTA) is one emerging production
technology that has the potential to address some of the negative ecological impacts of
aquaculture, thereby potentially improving the overall environmental and social
sustainability of the industry. However, despite initial academic analyses having
indicated its potential technical feasibility and financial profitability (Ridler et al. 2007;
Whitmarsh et al. 2000; Neori 2008; Troell et al. 1997), adoption by most aquaculture
producers in Canada has not yet occurred, even on an experimental scale. Therefore,
my project seeks to assess the factors for this lack of adoption in Canada, and
hypothesizes that existing regulatory and policy uncertainty, and lack of existing
commercial “success stories”, are key explanations.

2
1.1. Problem Statement
In the Canadian context, IMTA is a same-site polyculture1 of fed finfish (e.g.
salmon), inorganic extracting2 (seaweed) and organic extracting (shellfish, bottom-
feeder) species (Chopin et al. 2008). IMTA typically involves three trophic levels, and
attempts to partially mimic the natural nutrient cycle by allowing nutrient outputs from
finfish to serve as inputs into the production of extractive species. By helping to recycle
nutrient waste into feed inputs for other commercial species, IMTA theoretically reduces
the net nutrient discharge into the marine environment (Chopin et al. 2007; Ridler et al.
2007). This generates both social and private benefits, as it reduces the environmental
footprint of the firm, while generating additional net revenues to the producer (Ridler et
al. 2007). On the East Coast, Cooke Aquaculture is currently conducting IMTA
experiments at two sites in New Brunswick. On the West Coast, Kyuquot SEAfoods is
also engaged in a pre-commercial Research & Development pilot site in British
Columbia. No other (pre)-commercial sites to the knowledge of the author were actively
investigating IMTA in 2015.
In Canada, aquaculture is conducted in all provinces and the Yukon Territory,
generating 172 000 tonnes of product worth over $ 900 million. Atlantic salmon (Salmo
salar) is the third most valuable species, and generated $ 634 million in 2013 (Statistics
Canada 2013). Almost all aquaculture production of salmon in Canada uses the marine
monoculture open-net pen model. Key salmon producing regions include British
Columbia, New Brunswick, Nova Scotia, and Newfoundland and Labrador. Open net
pen farming has been criticized by certain scientists, academics, Aboriginal Groups,
environmental non-profits, local communities and members of the public due to the
potential negative impacts that it can have on the environment, and especially on wild
salmon stocks (Cohen 2012a; POC 2013b).
As Canada increases its production of farmed salmon to meet global demand, it
should do so in a way that is “ecologically efficient, environmentally benign, societally
1 Refers to the co-culture of two or more species at the same time and place. 2 Extractive species are species that can be raised without supplemental feed.

3
beneficial and product diversified” (Chopin et al. 2010b). Whereas the industry has made
dramatic strides in this respect in the last two decades, many concerns still remain. The
National Aquaculture Strategic Plan Initiative of Fisheries and Oceans Canada (DFO),
led by the Canadian Council of Fisheries and Aquaculture Ministers, has recommended
advancing the development of IMTA as a potential means to help achieve economically,
environmentally and socially sustainable aquaculture development in Canada. Large-
scale adoption of IMTA by salmon farmers is theoretically possible, and could help to
address many of the issues that are often associated with current salmon farming
practices, including potential negative environmental impacts, negative public perception
and lack of social license (Barrington et al. 2010). However, several regulatory,
institutional and market barriers to its adoption likely exist, and these have not been
assessed in the Canadian context, despite the recognition by many authors that such an
analysis is necessary (Zilberman et al. 1997; Chopin et al. 2010). Therefore, this paper
will seek to address this gap in knowledge by determining the barriers that salmon
aquaculture companies face when considering IMTA adoption in Canada, and based on
these findings, assess the potential for various regulatory and policy instruments to
incentivize greater inter and intra-firm adoption, if that is what is desired.
1.2. Research Questions
The study investigates the potential for adoption of IMTA by the salmon aquaculture
industry in Canada. The two research questions are:
Research Question #1: What are the main barriers to and incentives for
adoption of IMTA by salmon farmers in Canada?
Research Question #2: What market-based policies and regulations would
encourage an appropriate level of diffusion of IMTA at the industry and intra-firm level,
recognizing that the industry in Canada is highly concentrated?
In order to address these research questions, I developed a semi-structured
interview questionnaire, and conducted interviews with relevant stakeholders associated
with the industry who wished to participate in the study. I then performed a qualitative

4
thematic analysis of interview data, which was supplemented by a thorough literature
review on the topic.
1.3. Scope of the Study
IMTA as a concept is not species-specific, and can be applied to various
combinations of species. It can also be applied to freshwater aquaculture, closed-
containment aquaculture and land-based aquaponics facilities. This study is limited to
the marine-based salmon aquaculture industry, and is focused on Atlantic salmon only.
However, it is worth noting that many findings reported here might be applicable to other
related marine aquaculture industries such as trout, steelhead, sablefish and char.
1.4. Organization of the Study
Chapter 2 presents a literature review of new technology adoption models, and
provides an overview of various case studies that assessed the explanatory variables of
green technology adoption. Chapter 3 provides background on aquaculture in Canada,
including IMTA. Chapter 4 presents this study’s methodology, Chapter 5 describes the
results of the analysis, and Chapter 6 provides a discussion of the findings. Policy
implications are discussed in Chapter 7, with conclusions provided in Chapter 8.

5
Chapter 2. Literature Review
In this chapter, I first review the key theoretical frameworks that have been
developed to explain the factors that influence new technology adoption, and present
those that I consider to provide a more comprehensive explanation for the observed
dynamics of adoption of IMTA to date in the Canadian salmon aquaculture industry.
Subsequently, I review the regulatory and policy barriers and incentives to the
adoption of new green technologies by drawing on the experience of multiple case
studies from around the world. Then, I explore this concept by focusing on the potential
for market-based instruments as incentives for adoption. This review will help frame the
qualitative assessment that this study undertakes to answer the research questions.
2.1. Theoretical Frameworks of New Technology Adoption
Technology diffusion is a slow process that typically occurs over several years
and oftentimes even decades. New ideas are invented and incorporated into products or
business methods, and from there may slowly be adopted by firms (Allan et al. 2013).
Rogers (1995) theorized that adopters tend to fall into five key categories, based on the
time at which they adopt the new technology. These are: pioneers, early adopters, early
majority, late majority, and laggards. “Pioneers” are defined as adopters who are often
willing to cope with high degrees of uncertainty and risk, and tend to “introduce the
innovation for the first time to their social system”. Somewhat differently, “early adopters”
are defined as tending to be more engrained in the “general social system”, are
considered to be “change agents” within the industry, tend to be respected by their
peers, and tend to make novel adoption decisions (Jacobson 1998). Figure 1 provides a
graphical representation of these categories. In 2015, very limited adoption of IMTA had
occurred in Canada, and therefore based on these definitions I would argue that IMTA

6
still finds itself distinctly situated between the “Pioneers/Innovators” and “Early Adopters”
phases of this theoretical model.
Figure 1. Categories of Adoption and Mansfield Technology Diffusion Curve Note: Diffusion of Innovations graph (adapted from Everett Rogers). Available online at: https://commons.wikimedia.org/wiki/File:Diffusion_of_ideas.svg
Diffusion is dynamic in nature, with various feedback mechanisms and
multidirectional linkages occurring simultaneously (Montalvo & Kemp 2007). Firms
interact with other social, institutional and market actors, responding to various stimuli
and incentives to make production decisions (Gonzalez 2005). Market forces,
stakeholder/investor pressure, regulation, financial incentives and the spread of
information are all factors that serve to influence the process of technology adoption.
Hall & Khan (2002, p.3.) describe diffusion as:
the cumulative or aggregate result of a series of individual calculations that weigh the incremental benefits of adopting a new technology against the costs of change, often in an environment characterized by uncertainty (as to the future evolution of the technology and its benefits) and by limited information (about both the benefits and costs and even about the very existence of the technology). Although the ultimate decision is made on the demand side, the benefits and costs can be influenced by decisions made by suppliers of the new technology. The resulting diffusion rate is then determined by summing over these individual decisions.

7
Indeed, diffusion of a technology across an industry is determined by individual firms,
who balance benefits and drawbacks of adoption, in a climate of uncertainty and limited
information. Hermosilla (2003) notes that a technology rarely achieves total diffusion
across an industry. Endogenous factors affecting firm decision to adopt include
information, firm size, age, capital ownership, liquidity, management and organizational
capacity, availability of skilled labor, foreign ownership, quality accreditations, and
switching costs (Battisti 2007). Expectation that costs may decrease in the future (known
as the arbitrage condition) also may lead firms to delay adoption. Exogenous variables
affecting the adoption decision include output prices and market conditions, regulations,
policy, and overall perceived uncertainty and risk (Battisti 2007).
New technology adoption by firms has traditionally been explained according to a
few theoretical models, organized into two main categories: equilibrium models and
disequilibrium models. Equilibrium models assume perfect information, whereas
disequilibrium models do not. The scale and scope of technology adoption by firms in an
industry can then be determined by assessing the extent of both inter-firm and intra-firm
diffusion. Inter-firm diffusion looks at “the timing and the factors leading to the adoption
for the first time of at least one unit of a new technology by an individual firm” (Battisti
2007). Intra-firm diffusion, however, looks at “the time path of use of a new technology
within a firm from a point immediately after the adoption of the first unit of a new
technology until the diffusion is completed for that firm” (Battisti 2007). Analysis of both
types of diffusion is necessary to obtain a holistic and accurate picture of technology
diffusion in the industry, and therefore to allow appropriate policies to be developed.
2.1.1. Inter-Firm Diffusion Models
As previously stated, there are both equilibrium and disequilibrium models that
have been proposed to explain inter-firm diffusion dynamics. In the class of
disequilibrium models, the two principal models are the Mansfield approach (also known
as the Learning or Epidemic Approach) and the Evolutionary approach. The Mansfield
approach suggests that due to market imperfections, there is a lack of information and
therefore high levels of uncertainty regarding the new technology, which deters potential
users from adoption (Allan et al. 2013; Hall 2002). The key factor driving the adoption

8
process is information acquisition. Typically, the cumulative adoption curve is
represented by a general “S-shape”, consistent with a logistic growth curve or an Ogive
curve. Initially, the rate of adoption is low. However, as information spreads throughout
the community of potential users, the rate of adoption increases substantially.
Eventually, the curve flattens out as the population of adopters becomes saturated
(Figure 1).
The Mansfield model makes a lot of intuitive sense, and was first proposed in the
1960s. It is often called the epidemic model because it is used by infectious disease
specialists in modeling the spread of a disease throughout a population. Whereas some
studies have noted the importance of information in achieving higher diffusion rates,
such as a study by Qaim (2005) on the adoption of genetically modified crops in India,
most studies conclude that learning effects play only a limited role in overall diffusion.
For example, a sophisticated econometric analysis conducted by Stoneman & Battisti
(1997) on a dataset of 341 British engineering and manufacturing firms adopting four
new technologies3, found that learning effects could at best explain only 10% of the
observed variation in adoption rates. Indeed, Karshenas & Stoneman (1993) concluded
that the main factors affecting diffusion in this case were endogenous learning, firm size,
industry growth rates, cost and expected future changes in cost of adoption. In the case
of IMTA in the Canadian salmon aquaculture industry, firms seem to be well aware of
the existence of IMTA as a concept, as well as studies pointing to its feasibility.
Furthermore, due to the limited number of firms in the industry (six), learning effects may
play less of an important role as information likely quickly disseminates throughout the
industry. Therefore, learning effects seem to be unable to explain adoption dynamics in
the industry. Nevertheless, it must be acknowledged that awareness does not directly
translate into trust and confidence in feasibility.
The evolutionary approach suggests that out of a series of initially competing
technologies, it may not be the most efficient or profitable one that gets “picked”. Due to
a variety of political, institutional, social, historical and cultural reasons, one technology
3 The CURDS dataset looks at four technologies: numerically controlled, computerized
numerically controlled, coated and carbide tool machines, and microprocessors.

9
can be “chosen” which then becomes locked-in (Gonzalez 2005). As users gain more
experience with it, positive returns increase in scale, which induces a positive feedback
loop. As information about the technology spreads across the population and the
benefits of adoption become clearly demonstrated, risk and uncertainty are reduced
which spurs even more adoption. R&D effort and investment therefore gets locked-in to
increasing the efficiency of this technology. At a certain threshold level of industry
adoption, network externalities become increasingly important (Hermosilla 2003), and
remaining firms find it necessary to adopt to remain competitive in the industry.
Equilibrium models assume perfect information, and suggest that the current
number of users of a new technology at time t equals the number of users who find it
optimal to adopt it at time t. Battisti (2007) states that it is expected net gain that drives
diffusion, and that individual firms base their adoption decision according to relative
prices, and the various exogenous and endogenous factors mentioned earlier in this
paper (Hermosilla 2003; Battisti 2007). Under the equilibrium category, there are Rank
models, stock effect models and order effect models. Rank models assume that firms
are heterogeneous in nature and therefore have different inherent characteristics. As
such, net returns of adoption of a new technology will vary across competing firms.
Those that find it profitable to adopt based on these characteristics will adopt
(Karshenas & Stoneman 1993). Benefit of adoption is independent of the number of
users (Battisti 2007).
The stock effect approach assumes that all firms who find it profitable to adopt a
new technology will do so, but that profitability is dependent on the number of existing
users. As such, marginal benefit of adoption decreases as the number of previous
adopters increases. Timing is dependent on operating/acquisition costs, output prices
and current demand (Battisti 2007). As firms adopt, their production costs fall, which
affects overall industry prices and therefore profitability of future adoption (Karshenas &
Stoneman 1993). Over time, adoption costs decrease enough and inter-firm diffusion
continues.
Finally, the order effect suggests that earlier adopters will capture the most
benefit from adoption, and that the incentive to adopt diminishes as more users adopt.

10
This outcome is due to such factors as limited number of best sites, the saturation of
small niche markets and the presence of limited pools of skilled labor. Order effects can
lead to strategic considerations by firms, who may adopt earlier than they otherwise
would to obtain these first-mover advantages (Fudenberg & Tirole 1985). Popp (2010)
provides evidence of order effects. Overall, net gain of adoption of a new technology
depends on firm specific characteristics, the number of other adopters, and the firm’s
position in the adoption order (Stoneman & Kwon 1996).
A desktop review of the Canadian salmon aquaculture industry revealed that
firms are heterogeneous in nature, and have different management and operating
structures, ownership regimes, and financial strategies. Limited evidence appears to
exist to support the Mansfield Model. The equilibrium models described above would
theorize that firms would adopt IMTA if they found it profitable to do so. Whereas studies
have noted that IMTA can be highly profitable (Ridler et al. 2007; Whitmarsh et al. 2006;
Neori 2008; Troell et al. 1997), and that a market exists that would be willing to pay a
premium price for IMTA products (Barrington et al. 2010; Kitchen 2011; Yip 2012; Irwin
2015), only very limited adoption of IMTA has occurred to date in Canada. Therefore,
whereas profitability is undoubtedly a critical explanatory variable in adoption, other
factors must help explain the reason for a lack of adoption to date.
2.1.2. Intra-Firm Diffusion Models
Two theoretical models have been proposed to explain the dynamics of intra-
firm diffusion. The first is, again, the Mansfield model. As a firm experiments with a new
technology for the first time, it undergoes a learning process. As its managers and
workers learn how to work with the technology efficiently, and as initial hurdles are
overcome, a firm can quickly assess based on its own characteristics whether further
adoption is desired. In this respect, endogenous learning (i.e. learning-by-doing) plays a
crucial part in intra-firm diffusion.
The second model is the Battisti model, which is an “equilibrium, intra-firm stock
rank effect model, where the firm decision to further use a new technology is likened to
an investment decision driven by profitability considerations” (Battisti 2007). The size of

11
the potential profit gains is the key determinant of further adoption. As such, price
expectations, switching costs, market and technological uncertainty, relative marginal
productivity with respect to old technology, R&D intensity and firm specific skills and
capabilities, are the defining explanatory variables (Battisti 2007). The Battisti model
applies a more comprehensive economic lens to the question of technology adoption. It
recognizes that profitability is a key driving factor to the adoption of a new technology,
and that profitability is influenced by more than just switching costs and output prices.
Battisti touches on another key concept, uncertainty, which coupled with the factors of
profitability, firm-specific characteristics and learning effects, may begin to explain the
dynamics of IMTA adoption in the industry.
2.1.3. Real Options Approach
Another theoretical model that explicitly addresses the dynamics of technology
adoption under uncertainty is the Real Options approach. First proposed by Dixit and
Pindyck (1994), it suggests that companies hold an “option call” to invest in a new
technology, which they can expend at the time of their choosing. If a firm proceeds with
an investment, it foregoes the possibility of waiting for new information that could affect
the desirability or timing of the investment. This ability to delay the investment decision
has value, and is an opportunity cost that must be considered. As such, the new
technology must be more profitable than the old one by a value at least equalling this
opportunity cost, which may be quite high (Dixit & Pyndick 1994). This value is
analogous to the “hurdle rate” that many managers claim is necessary for them to make
an investment. Summers (1987) found that typical hurdle rates under conditions of risk
ranged from 8-30% of increased profitability, with a median of 17%. Another study by
Anderson & Newell (2002) which assessed the technology adoption decision of 5264
manufacturing firms in response to energy audits, found that most plants required a
payback period of 15-18 months, corresponding to a 65-80% hurdle rate for projects
lasting ten years or more. The average was 1.4 years, with 79% having a two-year
threshold and 98% having a threshold less than five years. Applied to IMTA, the Real
Options Approach suggests that IMTA need not just be more profitable than
conventional salmon production, but must be considerably more profitable if it is to
induce producers to adopt it at present.

12
Investing in a new technology, if even only at one farm site or factory, also
involves some level of irreversibility. That is because equipment needs to be purchased
which will quickly depreciate in value, labour needs to be trained, and capital that would
otherwise have generated profit elsewhere must be used up. Given such considerations,
certainty over performance efficiency and future profit flows is very important. If there is
uncertainty over these factors, firms may wish to delay investment until they become
clearer. Furthermore, uncertainty over product prices, input costs, exchange rates and
taxes, also has very important negative impacts on the investment decision (Dixit &
Pyndick 1994). Perhaps most importantly, the Real Options Approach notes that an
uncertain regulatory environment and associated policy can have major negative
dampening effects on investment (Dixit & Pindyck 1994). Indeed, under such situations
the benefit of waiting for conditions to improve or become clarified likely outweighs the
immediate cost and associated potential benefits of adopting at present. The regulatory
and policy regime surrounding salmon aquaculture in Canada is presently undergoing a
process of rapid change, and this has translated into uncertainty for producers.
Uncertainty over future regulations and policy means that producers are more unwilling
to make investment decisions, grow their operations, and adopt novel approaches.
Therefore, in light of this situation, adopting new “green” technologies to satisfy a small
market niche is probably very low on their list of priorities. However, it could also be
argued that investing in IMTA could be a good “insurance policy” against regulatory
change that could see the implementation of stricter environmental regulations.
Nevertheless, I hypothesize that current uncertainty is perhaps one of the largest
barriers to IMTA adoption in Canada at the moment.
2.1.4. Food and Agriculture Organization Conceptual Model
The United Nations Food and Agriculture Organization’s conceptual framework
for the adoption of conservation technology in agriculture incorporates many of the
theories presented in the models above to explain the multitude of factors, feedback
loops and linkages that all work together to influence the adoption decision. Whereas
this model was designed to explain the adoption dynamics of smallholder farmers in a
context of multiple potential adopters, there are certain similarities in the factors that

13
likely also influence the adoption decision in the more concentrated Canadian salmon
aquaculture industry.
The model is premised on the fact that adoption of new technology by farmers is
inherently a voluntary decision, made from a private perspective, and based on on-farm
considerations. Various external stimuli operating at local, national and international
levels serve to influence the farmer’s perception of the new technology. These stimuli
include financial considerations such as input prices, output prices and markets; policies
and government regulations; and other factors such as suitability of the technology to
local biophysical conditions, understanding and ability to incorporate new technology into
existing production processes, and social and human capital considerations. Coupled
with various personal attributes (openness to new ideas, internal priorities, management
considerations, tolerance to risk, etc.) and farm characteristics (social, environmental
and economic), the farmer makes a decision to adopt or not to adopt. This has resulting
economic, environmental and social impacts (FAO 2001).
This theoretical framework provides a comprehensive overview of the multiple
factors that all interact at various spatial and temporal scales to determine the eventual
adoption decision in highly competitive agricultural sectors. Diffusion is non-linear and
complex, and involves many different social actors, including government agencies,
private enterprises and extension agents. Through their actions, they send signals that
interact with each other to create unpredictable feedback loops (FAO 2001). Major
factors influencing the decision to invest in “clean technology” include tenure security,
access to financing and credit, information, regulations, government incentives and
social/institutional factors.
2.2. Experience from Case Studies
Many of the theoretical frameworks reviewed in Section 2.1 fail to account for the
role and importance of policy in influencing the adoption decision. Policy is a critical
variable in the diffusion of “green” technologies, as these technologies are usually
adopted in response to policy developed to address an environmental externality of
concern to the public. Policy interventions “create constraints and incentives that

14
influence the process of technological change” (Kerr & Newell, 2003), and this then
affects adoption success.
Often, adoption of “green technologies” provides a social benefit, but a private
cost. In the absence of strict regulation or market incentives, diffusion of a green
technology is often slow. This is further exacerbated by the temporal asymmetry of the
flow of costs and benefits, where costs are incurred the moment a firm adopts a new
technology, but where benefits may only manifest themselves several months or years in
the future. A key challenge for regulators wishing to promote such technologies,
therefore, is to try to align private incentives with social objectives to achieve
environmental goals at a reasonable cost (Gonzalez 2005).
The following section will review various case studies that empirically assessed
the key barriers and incentives to clean technology adoption in various industries across
the world, and report on the various regulatory and policy measures that were utilized by
regulators in those jurisdictions to incentivize adoption. Results will help inform this
study’s hypothesis, and its subsequent qualitative assessment.
Allan et al. 2013 define a green technology as a technology that “generates or
facilitates a reduction in environmental externalities relative to the status quo”. There are
two main types of green technologies: End-of-Pipe technologies (EOP) and process
technologies. Process technologies can either be incremental or radical redesigns. EOP
technologies curb pollution emissions through add-on measures (e.g. sulphur scrubbers
in factory smokestacks) whereas cleaner process technologies reduce resource use
and/or pollution at the source by using novel production methods (Frondel et al. 2007).
IMTA would be considered an end-of-pipe technology because it reduces net nutrient
effluent (and thus total environmental externalities) by adding extractive species (“add-
on measures) to the operation.
A study by Lanoie et al. (2007) on 4200 facilities in seven OECD countries found
evidence that environmental regulation could stimulate certain kinds of environmental
innovations. If these innovations improved a firm’s resource efficiency or provided other
benefits, Rexhauser & Rammer (2014) argued that it could provide positive profitability
effects, whether such innovation was a result of regulatory pressure or voluntary actions.

15
As profitability is a key variable influencing adoption, policies that place a monetary
value on the nutrient effluent externalities generated by salmon aquaculture facilities
could theoretically be used to incentive IMTA adoption.
A study conducted by Kerr & Newell (2003) on the adoption of process
technologies that produced unleaded petrol by 378 petroleum refineries in the United
States over the period 1971-1995 found that regulatory stringency, cost savings, firm
size, technological capabilities and the presence of market-based instruments were the
key factors affecting the adoption of unleaded production processes. Indeed, the study
found that a +10% increase in regulatory stringency led to a +40% increase in the rate of
adoption. Similarly, a -10% reduction in adoption cost led to a +23% increase in the rate
of adoption. Somewhat less importantly, a +10% increase in refinery size led to a +4%
increase in the probability of adoption. Interestingly, the authors did not find any
evidence suggesting that information was a key factor influencing adoption.
In the United Kingdom, unleaded petrol was first adopted in 1986, and by 1995
had 60% market share. A study by Stoneman & Battisti (2000) on the adoption of
unleaded petrol by consumers found that regulatory stringency, coupled with changes in
consumer tastes and preferences, were the key determining factors affecting diffusion.
Indeed, the authors concluded that without government regulations, the diffusion of
unleaded petrol would not have occurred.
Gonzalez (2005) analyzed the factors governing the adoption of clean
technologies in the Spanish pulp & paper industry. He finds that regulatory pressure and
the desire to have an improved corporate image were the main factors influencing
adoption. Less important reasons included higher sales, better exports and access to
new markets. Interestingly, obtaining subsidies and investor pressure were the least
relevant factors. Gonzalez also found that there were several barriers to the adoption of
new clean technologies. The first was uncertainty: there was great uncertainty related to
the drastic changes that firm re-organization would cause in terms of changes to
production routines and processes. Technical uncertainty also created market
uncertainty, as there were concerns over investment recovery. Second, regulations at
the time did not require companies to adopt cleaner technologies, and there was

16
uncertainty regarding future environmental regulations. Therefore, this created an
incentive to delay investment until further information was obtained. Other barriers that
were noted by the author include a lack of an environmental department within the
company itself, lack of internal environmental management systems, general satisfaction
with current technologies and processes, and the fact that existing equipment did not
need to be replaced at the time. Many of these factors are currently being experienced
by salmon farmers in Canada, and are likely to be barriers to the adoption of IMTA.
Popp et al. (2011) looked at the factors that influenced the decision to produce
chlorine free paper by the pulp & paper industry in Norway, Sweden, Canada and the
United States. Such a process would require a re-organization of existing production
methods by adopting novel methods. The authors concluded that regulatory stringency
was an important determining variable, as was the desire to have a greener image,
reduce community resistance to their plans (i.e. obtain a social license), increase market
share and respond to new market demand for the product. In a study on the adoption of
NOX technologies in US coal fired power plants, Popp (2010) found that environmental
regulations were the dominant explanatory variable in explaining the diffusion of the post
combustion technique. The author found that expectation of future stringent regulations
could increase the probability of adoption seven to fourteen fold. He also concluded that
compatibility of technology with existing processes, financial capability of firm and costs
were important factors. Interestingly, he concluded that the expectation of rapid
technological change could delay investment, probably because in this case firms may
find it more profitable to hold onto their high-value “call option”.
Pizer et al. (2002) analyzed the factors influencing the adoption of four energy
saving incremental technologies in the pulp/paper, plastics, steel and petroleum
industries. The authors found that plant size and financial health had statistically
significant effects on adoption. They also stressed the importance of network effects in
adoption dynamics: they found based on their data that once a threshold of 10% of total
firms had adopted a certain technology, the remainder of the plants would adopt it within
an average of nine years.

17
Montalvo and Kemp (2007) cite a study by Luken and van Rompeay that
analyzed the factors influencing environmentally sound technology adoption by 106
plants in nine developing countries. They concluded that cost savings, as well as current
and anticipated future regulations, were the most important explanatory variables. Most
important barriers were high adoption costs, no alternative technologies and lack of
organizational/technical capabilities. In a study on clean production technology adoption
in the metal finishing industry in South Africa, Koefoed and Buckley (2008) found that
regulations & enforcement, norms set by clients, cost savings and stakeholder pressure
were the most important driving factors. Subsidies of 50% to demonstration plants to
Small and Medium Enterprises (SMEs) were also significant to obtain company
participation. Important barriers included lack of regulatory enforcement and lack of
awareness. In the fuel cell industry, risk and existing regulations were the most important
barriers, with technical capacity and community pressure acting as the most important
drivers (Montalvo & Kemp 2007).
A meta-analysis of the adoption of agricultural best management practices in the
USA found that environmental awareness and membership in networks/organizations
and programs were much more important explanatory factors than subsidies, which did
not have an important effect (Baumgart-Getz et al. 2012). In their review of
environmental diffusion on an international level, Allan et al. 2013 conclude that firm
size, organizational structure and capabilities, cost savings, community pressure, desire
for a greener image and size of expected profit were the most common explanatory
variables of clean technology adoption. Finally, firms already innovating in other
directions were more likely to adopt newer technologies (Battisti 2007). Interestingly,
Allan et al. 2013 concluded that EOP and process redesign technologies were never
found to be substitutes. Furthermore, they also found that investment in green R&D as
well as cost savings tended to be positively associated with process technologies, but
not EOP technologies. The latter were more associated with regulatory constraints, a
finding that may have important considerations in the development of a policy that would
provide incentives for IMTA adoption. The presence of environmental management tools
and a desire to prevent environmental incidents were associated with both, but again
more strongly with process technologies (Allan et al. 2013).

18
In a meta-analysis of the variables affecting the adoption of conservation
technology by farmers, Knowler & Bradshaw (2007) performed both an aggregated and
a disaggregated analysis of 31 case studies spread out across three regions of the
globe. The authors concluded that there were no universal determinants of adoption,
and that these factors were highly context and region-specific. However, they found that
in many cases, education, access to information, government policies and support
programs, and farm profitability, all played significant factors in the adoption decision.
All of these examples suggest that explanatory variables in studies of the
adoption of cleaner technology vary according to context and industry type. However,
there appears to be significant evidence in the literature pointing to the fact that
regulatory stringency, lack of uncertainty (technical, performance, economic), expected
profitability and cost savings, managerial/organizational and technical capabilities, public
pressure, consumer demand and desire to have a greener image can be key
explanatory variables for clean technology adoption. My literature review thus far
suggests that the Battisti Model and the Real Options Approach can likely be utilized to
explain the dynamics of IMTA adoption in the Canadian salmon aquaculture industry.
However, many of the studies noted above used quantitative methods of analysis, such
as regression analysis or other statistical models, to answer their research questions.
Many other studies, especially those in the social sciences and health sciences, as well
as in studies with a small number of participants (n<30), use qualitative data analysis
methods as a means of answering these very same questions. Indeed, Miles &
Huberman (1994) note that qualitative inquiry is “one among many systematic,
methodical processes for acquiring genuine, positive, scientific knowledge of social
phenomena”.
For example, a study by Abdullah et al. (2013) investigates the determinants of
adoption of new technology in Malaysian Small and Medium Enterprises, by conducting
a thematic analysis of interview data. Mallat (2007) adopts a similar approach in his
qualitative study to determine the explanatory variables of consumer adoption of mobile
payment systems. Similarly, Mackrell et al. (2009) use in-depth semi-structured
interviews followed by qualitative analysis to investigate the adoption process and use of
an agricultural decision support system in Australia. Other examples include Davis et al.

19
(2007), who investigated drivers to the incorporation of remote monitoring technologies
in rural primary care, and Belizan et al. (2007), who assessed barriers and facilitators to
the adoption of perinatal care in Latin America.
2.3. Market-Based Instruments
Section 2.2 found that policies that implemented market-based instruments over
non-flexible regulatory standards often led to greater rates of greener technology
adoption by firms. As firms are heterogeneous and face different marginal abatement
cost curves, such approaches can therefore reduce that financial burden that a firm
might otherwise face (Field & Olewiler, 2011). As such, this section will provide a brief
overview of the experience of market-based instruments as a means to incentivize
technology adoption, in order to meet the goals of my second research question. Results
will inform the questions posed in the semi-structured interview questionnaire, which
informs this study’s qualitative assessment of IMTA adoption in Canada.
In order to achieve a desired environmental objective, a government has several
policy tools at its disposal. Regulatory tools tend to fall into two categories: command-
and-control approaches, and market-based instrument approaches. Command-and-
control approaches tend to mandate specific technology or performance-based
standards that all firms must follow, regardless of their marginal abatement cost.
Technology standards mandate the type of technology that the producer must use. This
could, for example, be the type of nets that a farmer must use in their aquaculture
operation, or the type of chemical solution that a farmer must apply to his crop. However,
such restrictions have the potential to cause officially-induced error, thus stifling
incentives for further innovation (Krysiak 2010). This reduces overall consumer and
producer surplus, and therefore leads to an economically inefficient situation.
Performance standards set uniform control targets for firms, while allowing
flexibility in how this target is met (Stavins 2003). Standards must be designed
appropriately to balance social objectives. If set too low, they may not lead to significant
abatement. If set too high, however, they can create significant opposition and
potentially lead to political and/or economic conflict (Jaffe et al. 2003). An example of a

20
performance-based standard would be the current regulation mandating the maximum
allowable sulphide levels below a salmon aquaculture operation. Farmers are given
discretion on how they conduct their operations to meet this standard, however by law
they cannot exceed it. Whereas this standard helps achieve an objective, it does not
incentivize firms to continuously seek ways to improve their environmental performance.
Rather, firms choose a compliance pathway that maximizes their producer surplus
subject to this constraint.
Market-based instruments, however, continuously provide incentives for
environmental improvement by directly rewarding firms for marginal increases in
pollution abatement. Several authors have concluded that such instruments, at least in
perfectly competitive markets, are more effective and efficient at stimulating clean
technology adoption than command-and-control measures (Fischer & Newell 2004;
Requate 2005; Stavins 2003). These approaches tend to maximize efficiency because
they allow firms the flexibility needed to find innovative ways to alter their production
systems in ways that best fits in with their management processes and firm-specific
characteristics. Firms with lower abatement costs reduce the most, and firms with the
highest reduce the least. In tradable permit systems, these higher cost firms also have
the ability to buy permits from lower cost firms. Overall, market based instruments have
the ability to achieve an environmental objective at the lowest cost to society, with the
greatest reductions observed in firms that can achieve these reductions most cheaply
(Stavins 2003).
Market-based instruments include taxes (emission/ effluent tax, input tax, sales
tax, corporate tax), tax differentiation, credits, subsidies, tradable permit systems, user
charges, administrative fees, deposit-refund systems, insurance premium taxes, market
creation, liability rules and information programs (Stavins 2003; Requate 2005). Various
forms of such instruments have been applied to many industries across the world, with
varying levels of success. Common reasons for failure include (1) Mandated charges no
longer have an incentivizing effect due to high inflation over time; (2) Legislated charges
are set below the marginal cost of abatement (so actors pay the charge and don’t reduce
pollution); (3) The threshold at which a firm faces a financial penalty is set too high to
influence firm behaviour; (4) Upper bounds are set on maximum financial environmental

21
liability a firm may face, and these are much lower than the total social cost that may be
incurred;(5) Many exemptions are present in the regulation to appease industry groups,
severely weakening the effect of the original legislation and (6) Insufficient monitoring
and enforcement (Stavins 2003). Jaffe et al. (2003) provide a good overview of the
theoretical effects of instruments on technology adoption.
If organic loading to the marine environment is conclusively demonstrated to
have a negative and quantifiable environmental impact, and if society wishes to
discourage such behaviour, then certain (combinations) of market-based instruments
could be utilized, if voluntary initiatives alone do not compel producers to eliminate this
externality. These could include effluent taxes, higher license charges, performance
bonds, as well as tax credits and subsidies to adopt cleaner technologies. However, as
was concluded by Knowler and Bradshaw (2007), it would be unwise to assume that a
combination of policies that worked in another industry or in another country might work
in this specific context. Great differences exist between industries and countries, at
political, regulatory, economic and social scales. Market-based tools should be tailored
to these specific conditions after conducting a thorough socio-political and economic
analysis of the context. Therefore, this study undertook an assessment of these
stakeholder perspectives, to help inform policy-makers on stakeholder perspectives
towards various regulatory and market-based instruments that could be utilized to
incentivize adoption.
Nutrient Trading Credits have also been proposed by Chopin (2014) as a means
of internalizing nutrient externalities. Nutrient externalities are defined here as the
nitrogen and phosphorus effluent that enters the marine environment as a result of
salmon production. The author calculated, using average seaweed composition values
and an nutrient price of $10-20/kg (which is based on average nutrient recovery costs
from wastewater treatment facilities), that net ecosystem services from seaweed
production on a global scale would be valued at between $ 892.5 and $ 2.6 billion per
year. Chopin argues that if the ecosystem service of nutrient removal is internalized into
the cost of production, then IMTA systems would be much more competitive than
traditional monoculture operations. It is interesting to note that nutrient effluent charges
are already used in several European countries, albeit not in the aquaculture context. In
22
Denmark, for example, nitrogen is charged at a rate of $4.2/kg, and phosphorus at
$23.04/kg, with revenues going to the general budget (CFE 2016).
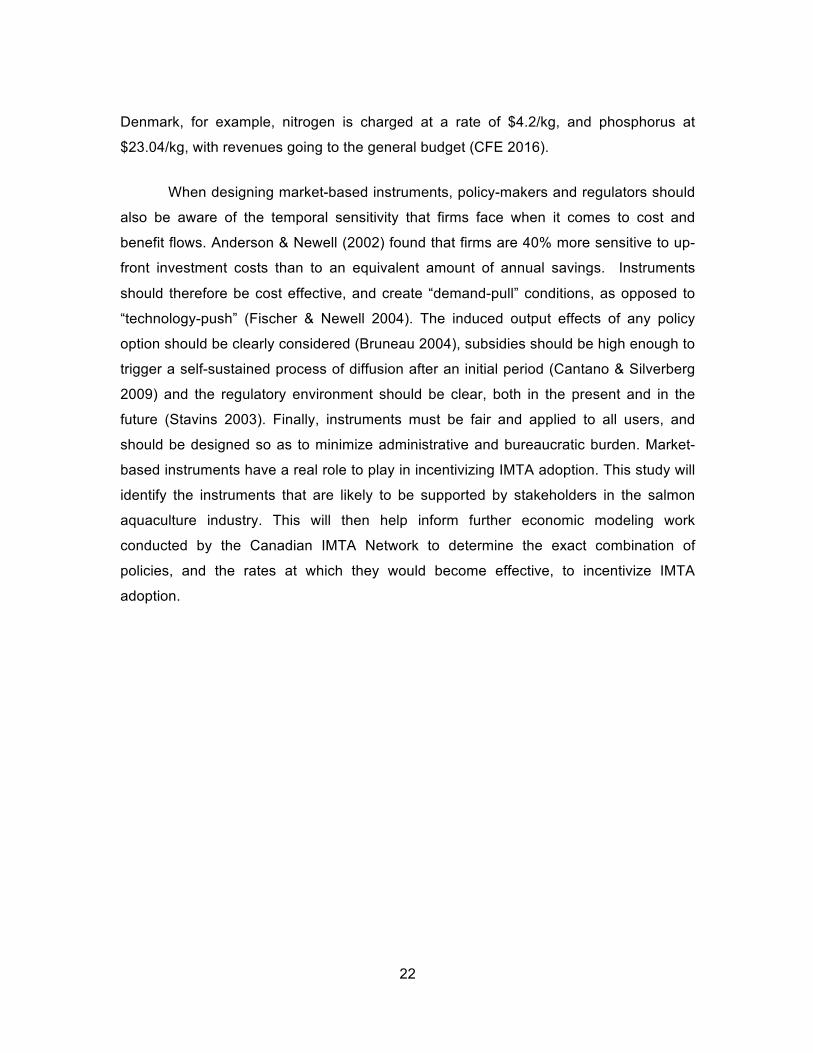
When designing market-based instruments, policy-makers and regulators should
also be aware of the temporal sensitivity that firms face when it comes to cost and
benefit flows. Anderson & Newell (2002) found that firms are 40% more sensitive to up-
front investment costs than to an equivalent amount of annual savings. Instruments
should therefore be cost effective, and create “demand-pull” conditions, as opposed to
“technology-push” (Fischer & Newell 2004). The induced output effects of any policy
option should be clearly considered (Bruneau 2004), subsidies should be high enough to
trigger a self-sustained process of diffusion after an initial period (Cantano & Silverberg
2009) and the regulatory environment should be clear, both in the present and in the
future (Stavins 2003). Finally, instruments must be fair and applied to all users, and
should be designed so as to minimize administrative and bureaucratic burden. Market-
based instruments have a real role to play in incentivizing IMTA adoption. This study will
identify the instruments that are likely to be supported by stakeholders in the salmon
aquaculture industry. This will then help inform further economic modeling work
conducted by the Canadian IMTA Network to determine the exact combination of
policies, and the rates at which they would become effective, to incentivize IMTA
adoption.

23
Chapter 3. Background
Chapter 3 will provide the reader with a brief overview of aquaculture in Canada,
and the observed adoption rates of emerging aquaculture technologies. It reviews the
complex governance and regulatory framework, and discusses existing uncertainties. It
also provides an in-depth discussion of IMTA, including studies that have demonstrated
its tentative profitability. Section 3.3 provides a synopsis of existing barriers to industry
competitiveness, as identified by the Canadian Aquaculture Industry Alliance (CAIA).
Based on Chapters 1 - 3.3, section 3.4 presents my hypotheses on the factors
influencing IMTA adoption.
3.1. Aquaculture in Canada
Aquaculture is defined as the “human cultivation of organisms in water…[and is]
determined by biological, technological, economic and environmental factors” (Asche
2008). In Canada, aquaculture generates a significant amount of revenue and
employment both nationally and provincially. In 2013, Canada produced 130 337 tons of
farmed finfish (Figure 2) and 41 760 tons of farmed shellfish, for a total value of $ 870
million and $ 92 million, respectively (Statistics Canada 2013). In total, aquaculture
contributed $ 962.895 million to gross domestic product (GDP), $ 2 billion in total
economy activity, 14 500 full time equivalent (FTE) jobs4 and almost $ 500 million in
labour income (DFO 2012). The vast majority of exported products went to the United
States (97%), with small quantities also exported to European and Asian markets
(Statistics Canada 2013; RIAS 2011). Whereas there are only 6 large Canadian
companies, these compete with Norwegian, Scottish and Chilean producers in the
American market, where most production is exported. Prices in global markets over time 4 Based on an employment multiplier of 2.5, which is a value that has been recorded by various
aquaculture studies (FAO 2014). Direct employment is 5000 FTEs (RIAS 2011)

24
are depicted in Figure 3. As such, whereas the industry is deemed to be highly
concentrated nationally, it can still be deemed to be operating competitively due to the
global nature of the commodity market.
Figure 2. Aquaculture finfish production in Canada, 1986-2013. Note: Data obtained from DFO (2015).
Figure 3. Average yearly price of Atlantic Salmon. Note: Reproduced from Marine Harvest (2014).
Plant cultivation in marine waters falls under provincial jurisdiction. Limited plant
cultivation has occurred to date in Canada. Some kelp is produced in New Brunswick
0
20000
40000
60000
80000
100000
120000
140000
160000
1980 1985 1990 1995 2000 2005 2010 2015
Finfish Produc.on (tonnes)
Produc0on (tonnes)
25
and British Columbia. Irish moss (Chondrus crispus) is also grown in land-based tanks in
Nova Scotia (CAIA 2012).
3.1.1. Aquaculture on the West Coast
In British Columbia, the main species produced by aquaculture are salmon, trout,
Pacific oyster, clam, mussels and scallops. Regions of production are northern and
eastern Vancouver Island. 98% of total value generated from finfish farming was
attributed to salmon (Statistics Canada 2013). 70% of total aquaculture production is
exported to the United States, largely to the West Coast (DFO 2012).
Salmon farming began in British Columbia in the 1970s, largely as small, family
owned businesses. By 1988, there were 101 salmon farming companies operating in the
province, mostly farming Atlantic salmon. In the next two decades, the industry became
increasingly consolidated and by 2014, four companies controlled virtually all production
(Cohen 2012c). These four companies are: Cermaq Canada Ltd., Marine Harvest
Canada Inc., Creative Salmon Company Ltd. and Grieg Seafood BC Ltd. In 2012, Cohen
found that there were approximately 120 salmon farming sites across the province,
holding a total of 32 million fish in the water (Cohen 2012c). A map depicting their
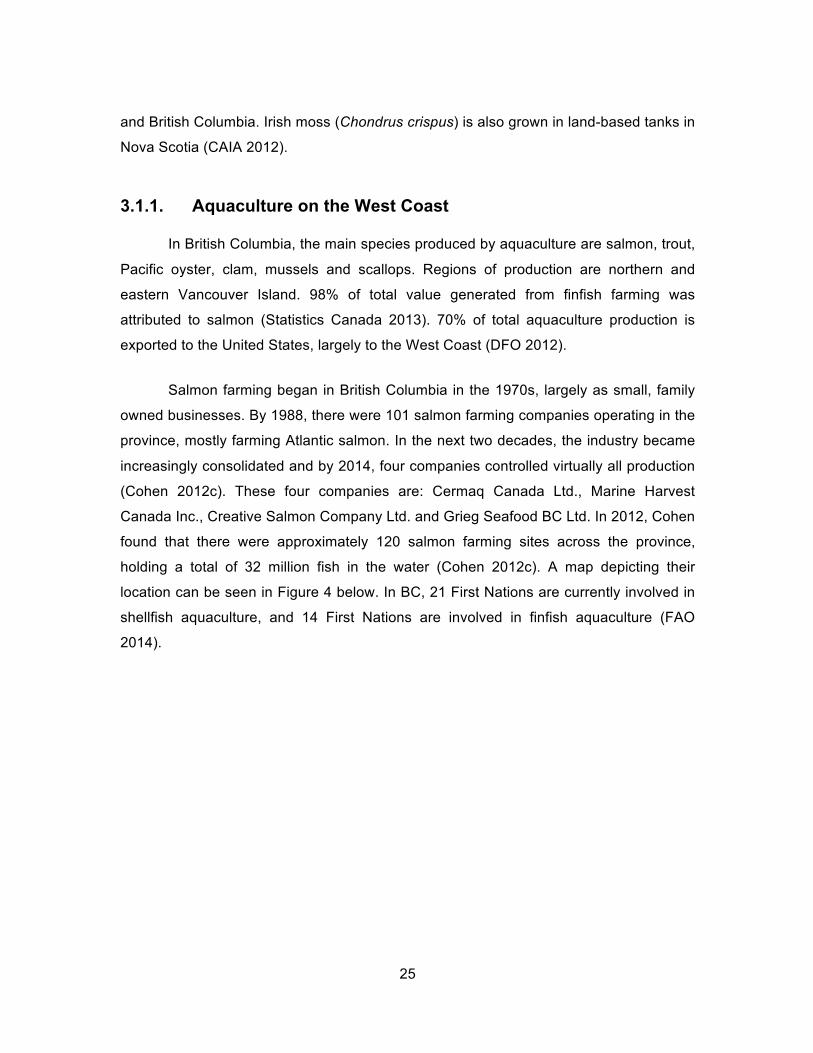
location can be seen in Figure 4 below. In BC, 21 First Nations are currently involved in
shellfish aquaculture, and 14 First Nations are involved in finfish aquaculture (FAO
2014).

26
Figure 4 Licensed marine based finfish sites in British Columbia, 2014. Note: Adapted from Fisheries and Oceans Canada, “Aquaculture Sites in B.C.”, accessed on December 7, 2015 and available at the following web address: http://www.pac.dfo-mpo.gc.ca/aquaculture/maps-cartes-eng.html. This does not constitute an endorsement by Fisheries and Oceans Canada of this project. This reproduction is a copy of an official work that is published and owned by the Government of Canada and it has not been produced in affiliation with, or with the endorsement of the Government of Canada. Used with permission.

27
A moratorium was imposed on the establishment of new salmon farms in the
province in 1995, pending regulatory review of the industry by the BC Ministry of
Environment. The BC Ministry of Environment reviewed121 farms, relocated some, and
made others change their operational strategies to meet more stringent criteria. After a
series of new regulations were instituted, the moratorium was lifted in 2002. Another
moratorium was applied on new licenses during a portion of the Cohen Inquiry process,
but this has since been lifted everywhere except in the Discovery Islands region of BC.
This was maintained due to the strong concerns that Cohen expressed in his Final
Report regarding the potential to cause serious, irreversible harm to wild salmon stocks
that migrate in the area. Therefore, pending further scientific research and data
collection, and until at least September 30 2020, no new licenses will be issued for this
region. A 2008 moratorium is also still in place for the North Coast of the Province, north
of Aristazabal Island. Overall, only 2 new licenses have been issued in the province
since 2007. In February 2014, the DFO signaled that it would consider new applications,
although none have yet been granted (Marine Harvest 2014).
Shellfish aquaculture is also important on the West Coast. In 2013, 8450 tonnes
of shellfish products were produced, with oysters and clams representing the majority of
production. Unlike the salmon aquaculture industry, the shellfish industry is highly
unconsolidated, consisting mainly of small producers. In 2008, there were 482 licensed
shellfish tenures occupying a total of 2114 hectares (Kitchen 2011).
3.1.2. Aquaculture on the East Coast
Both salmon and shellfish aquaculture are well established on the Atlantic Coast
of Canada. In 2010, the region produced 32 000 tonnes of salmon, or almost one third of
total national production (DFO 2012; Statistics Canada 2013). The main producing area
is New Brunswick, followed by Nova Scotia. Significant growth of the industry has also
occurred recently in Newfoundland and Labrador. Regarding shellfish, Prince Edward
Island is the largest producer. In 2010, it produced over 24 000 tonnes of blue mussels
worth $ 33 million.

28
In New Brunswick, salmon aquaculture began in the late 1970s. It occurs in the
south-western part of the province, in the Bay of Fundy. Water temperatures elsewhere
in the province are considered unsuitable for salmon aquaculture. In current regions of
production, there is limited room for further growth due to site access and availability
restrictions and public pressure (Chopin & Robinson 2004). In 2013, the province
produced 790 tonnes of shellfish and 18 837 tonnes of Atlantic salmon (Statistics
Canada 2013). Oysters are the dominant shellfish species cultured. Two salmon farming
companies operate in the province: Cooke Aquaculture Ltd. and Northern Harvest Sea
Farms Ltd. Due to severe issues with Infectious Salmon Anemia (ISA), in 2000 the
province instituted policies requiring single year-class farming and organization of fish
farms within Bay Management Areas. Today, there are three salmonid Bay Management
Areas in the province, which were designed according to biophysical, oceanographic,
business and socio-economic considerations. According to the Atlantic Canada Fish
Farmers Association, Bay Management Areas “allow farmers to coordinate the health
management practices on all farms in that area and help prevent the spread of disease
or parasites… [they also] help support other environmental management practices
including the remediation of the ocean floor beneath a farm site” (ACFFA 2010). Bay
Management Areas have had an important effect on the salmon farming industry of the
province, as companies have had to consolidate their operations to meet new
regulations and locate farms across all Bay Management Areas in order to be able to
supply salmon on an annual basis. Sites are now on a 3-year rotation system, each Bay
Management Area is stocked with a similar age-class of fish, and fallowing between
production cycles in mandatory.
In Nova Scotia, aquaculture began in the mid-1980s. In 2013, 6517 tonnes of
salmon and 1968 tonnes of shellfish were produced (Statistics Canada 2013). The main
shellfish product grown is mussels, followed by clams and oysters. Salmon farming
occurs in the south-western part of the province, where waters are warmer. There is
currently no BMA framework in place in the province due to the limited number of farms
present. However, if and when the industry continues to develop, a Bay Management
Area framework may eventually be developed. Two salmon farming companies operate
in the province: Cooke Aquaculture Ltd., and Northern Harvest Sea Farms. There is
currently an informal moratorium on new salmon farm licenses in the province, pending

29
the release and review of the final report of the Doelle-Lahey Independent Aquaculture
Regulatory Review for Nova Scotia (Doelle-Lahey 2014a). This report, which was
commissioned by the Nova Scotia Department of Fisheries and Aquaculture (NS DFA),
is meant to develop a new state-of-the-art regulatory framework for the province.
Consultation with various stakeholders was conducted, and recommendations will be
based on these findings, and will attempt to balance “the interests of industry, other
marine users, local communities, and environmental protection” (Doelle-Lahey 2014b).
Draft recommendations include increasing the transparency and openness of the
process, greater community consultation, including terms and conditions for salmon
licenses into binding pieces of legislation and strengthening environmental monitoring
and oversight. Therefore, until the final version of the report is published and the NS
DFA has the time to respond, there is a climate of great regulatory and policy uncertainty
in the province. This undoubtedly has a profound effect on investment, growth and
industry adoption of new technologies at present.
In Newfoundland, salmon farming began almost 25 years ago, and occurs on the
Province’s south coast. Total finfish production in 2013 was 22 196 tonnes. Data was not
available solely for Atlantic salmon production (Statistics Canada 2013). The largest
producer is Northern Harvest Sea Farms, followed by Cooke Aquaculture and Gray
Aqua Group Ltd. 4354 tonnes of shellfish were also produced, all mussels. There have
never been any moratoriums in the province. In 2014, the province began developing a
BMA framework. All licenses granted are single-species licenses. Therefore, if a
producer wanted to adopt IMTA, they would have to apply for an R&D license and
provide proof of concept to provincial regulators before they would be able to be granted
the authorization to apply for a multi-species license. No producer to date has expressed
interest in conducting IMTA in Newfoundland.
Market-based instruments in the salmon aquaculture industry:
In 2009, Statistics Canada indicated that the aquaculture industry received $ 1.7
million in subsidies (RIAS 2013). Certain grants and R&D tax credits are also available
to firms wanting to invest in more environmentally friendly technologies. These include
grants from DFO, provincial governments and Sustainable Development and

30
Technology Canada, as well as Scientific Research and Experimental Development tax
credits.
The Province of British Columbia has stated that commercialization of clean
technologies is essential, and that they recommended, among other things, developing
further policies to stimulate R&D, create or expand green innovation investment funds,
provide incentives for firms to adopt greener technologies, provide funding for applied
research at universities, and expand the Provincial Investment Tax Credit Program
(Globe Foundation 2010). These policy statements therefore suggest that there exists a
certain political appetite for the application of market-based instruments in British
Columbia.
3.1.3. Integrated Multi-Trophic Aquaculture
Integrated Multi-Trophic Aquaculture is a method of aquaculture production
which co-cultures in close proximity three or more species of different trophic levels. This
allows for the efficient conversion of food, nutrients and energy considered “lost” from
the fed component of the operation (i.e. finfish) into inputs to the production of other
species of economic value. This is done while taking into consideration operational
limits, site-specificity and food safety guidelines and regulations (Chopin & Robinson
2004). Such an approach improves the energetic and ecological balance of the
operation. By taking a more ecosystem-based management approach, Chopin et al.
2007 argue that a successful IMTA operation reduces environmental impact, diversifies
production and decreases economic risk, thereby increasing the overall sustainability of
the operation. Species should be chosen based on their complementary ecosystem
functions, as well as for their existing or potential economic value (Chopin 2011). It is
important to note that there is an important difference between polyculture and IMTA:
polyculture is the co-culture of several different species on the same site, but it does not
have a requirement to include different trophic levels. As such, the co-culture of three
species of finfish would be polyculture, but would not result in any environmental
benefits. To date, studies investigating the technical and biological feasibility of IMTA in
a variety of different settings have occurred in over 40 countries (Chopin 2012).

31
The result of a well-designed IMTA system is a reduction in net nutrient
discharge to the marine environment. Open-net pen salmon farms discharge both
particulate organic matter and dissolved inorganic nutrients such as ammonium (NH4+)
and phosphate (PO4-3). Along with uneaten feed, which has a high carbon content, these
particles either largely settle on the benthos below the farm site or travel downstream
from it, usually within 50 meters (Cross 2004). Robinson & Reid (2014) provide an in-
depth critical review of the factors influencing deposition rates. A study by Lander et al.
(2004) found that an average salmon farm in New Brunswick produces an estimated
discharge of 35 kg of Nitrogen and 7 kg of Phosphorus per ton of salmon per year.
Depending on a variety of physical conditions including depth and water velocities, these
effluents have the potential to cause certain negative environmental impacts on the
benthic environment and on local water quality (Wang et al. 2013). This includes
increases in total free sulphides, decreases in biological oxygen demand, pH and redox
potential (Chopin et al. 2012). General nutrification of the broader regional environmental
and its associated environmental impacts, for example, are also of concern. Effects on
biodiversity are highly site and context-specific and depend on such factors as
assimilative capacity of the environment and total net loading. Interestingly, general
conclusions suggest that if organic deposition does not cause anoxic conditions or
hydrogen sulfide generation, then impacts on biodiversity can be positive (Chopin et al.
2012). Therefore, the issue of nutrient loading may only be site-specific.
In Canada, IMTA systems typically include three trophic levels. These are the fed
trophic level (i.e. finfish), the organic extractive level (i.e. shellfish and invertebrates) and
the inorganic extractive level (marine plants). The focus of this study is on Atlantic
salmon-based IMTA. Studies have shown that significant mussel and seaweed
production occurs by culturing these organisms in close proximity to finfish cages
(Lander et al. 2006; Chopin & Bastarache 2004; Whitmarsh et al. 2006). Indeed, trophic
transfer efficiency rates between finfish and shellfish species can in some circumstances
be as high as 30% (Robinson & Greig 2014). Studies have shown that in IMTA systems,
mussels can more than double their weight, and kelp can increase their biomass
production by up to +46% (Chopin & Bastarache, 2004). Indeed, particulate organic
matter excreted from salmon is in a range highly utilizable by suspension feeding
shellfish (Lander et al. 2004). As such, a production analysis study conducted by

32
Kitchen (2011) found that oyster production associated with IMTA in BC could increase
by + 9- 237%, depending on production quantity per site and number of farms that
retrofit to IMTA.
Tentative profitability has also been demonstrated by a capital budgeting
exercise using actual data from a pilot salmon/mussel/kelp farm in New Brunswick
(Ridler et al. 2007). Conclusions by these authors demonstrated that Net Present Value
(NPV) was greater for IMTA than monoculture operations, under three varying
productivity and mortality scenarios. It was also found to reduce economic risk due to
product diversification. Whitmarsh et al. (2006) also found using a capital budgeting
model that an integrated salmon-mussel farm was more profitable than an equivalent
separated production of monoculture salmon and monoculture shellfish, respectively.
However, this conclusion was highly sensitive to variation in salmon prices. Other
authors, such as Neori (2008) and Troell et al. (1997), have also concluded that IMTA
can result in increased farm profitability.5 Nevertheless, these studies do not appear to
have taken into account adoption costs, increased operating and management costs,
perceived risk, uncertainty, the regulatory environment, and increased costs of
marketing.
Public perceptions are also important for the success of IMTA. In an attitudinal
survey conducted by Barrington et al. (2010) in Charlotte County, New Brunswick6, the
general public was found to have a largely positive perception of IMTA. Indeed, the
study concluded that respondents found IMTA had the potential to address certain
negative environmental impacts of the industry, while having positive effects for
community economies and local employment. The author also found that 50% of
respondents indicated that they would be willing to pay a 10% premium for IMTA
products. The study by Kitchen (2011) in B.C. found similar results on positive
perceptions of IMTA shellfish in prime export markets such as San Francisco, where
5 Currently, further studies are being conducted by the Canadian IMTA Network’s D3P1 project at
the School of Resources and Environmental Management at Simon Fraser University to further update financial analyses and model these with the inclusion of additional species into the IMTA operation.
6 Most salmon aquaculture operations in New Brunswick occur in Charlotte County.

33
consumers indicated that they would be willing to pay a premium price of 24%. Similarly,
a study utilizing a discrete choice experiment conducted by Yip (2012) in the prime
salmon export market of the U.S. Pacific Northwest, found that consumers were willing
to pay price premiums of 9.8% and 3.9% for IMTA and Closed Containment Aquaculture
(CCA), respectively, and that 44.3% and 16.3% of respondents preferred IMTA and CCA
methods to conventional salmon farming, respectively. Irwin (2015) also found, in an
online survey of 1321 British Columbia residents, that British Columbians were willing to
pay, on average, CAD $77.76- $159.54 per year to support the development and fund
incentives for the adoption of IMTA, and were in general highly supportive of using
government policy to improve the environmental performance of salmon aquaculture.
Whereas these findings do provide significant profitability incentives to producers, it is
important to note that with all studies involving the willingness-to-pay method,
overestimation by respondents is possible (Loomis et al. 2000).
Positive perceptions by the general public regarding IMTA and its associated
benefits has the potential to address some of the issues that the industry has been
facing regarding lack of social license to operate. Nevertheless, certain drawbacks also
exist. First, IMTA is not a conclusively proven technology, and uncertainty still exists
regarding its ability to mitigate a substantial proportion of salmon farm effluent. Second,
it increases production complexity, and requires high-skilled labour and large initial
capital cost investments. And third, it does not address other environmental issues that
may be associated with net-pen aquaculture, such as the transfer of sea lice and other
pathogens to wild species.
3.1.4. Closed Containment Aquaculture
Closed containment aquaculture (CCA) is another emerging aquaculture
production technology in BC, but it contrasts starkly in concept with IMTA. Nonetheless,
research is being conducted on this technology in British Columbia, and it is more highly
supported so far than IMTA (Irwin 2014). This is because CCA has the potential to
eliminate many environmental problems associated with marine, open-net pen
aquaculture, including eliminating the risk of parasite and disease transfer to wild stocks,
and eliminating the potential for farmed Atlantic salmon (a non-native species) to escape

34
into the marine environment. There are two main types of closed-containment
technologies: ocean-based solid wall containment, and land-based recirculating
aquaculture systems. Ocean-based solid wall containment systems float on the surface
of the water, and have a solid-walled fibre and foam composite tanks. Untreated water is
pumped into the tank, along with supplemental oxygen. Waste feed and feces are
filtered out via a drain on the bottom, removing up to 90% of settleable wastes (POC
2012). Some water and wastes also flow out of the top of the tank. Land-based
Recirculating Aquaculture Systems, on the other hand, completely separate production
from the external environment. Fish are raised in circular concrete tanks; treated water
and oxygen is pumped into the tank and continually re-circulated. Solid wastes are
removed via a drain at the bottom of the tank, and up to 98% of water is reused (POC
2012).
Currently, Recirculating Aquaculture System facilities are used by the industry to
grow smolt in hatcheries before being transferred to open-net pens. It is also becoming
increasingly common for broodstock to be kept in such facilities. Several species of fish
have been successfully and profitably raised in Recirculating Aquaculture System
facilities over the years, including sturgeon, tilapia and other high valued species (POC
2012). However, until recently, Atlantic salmon was never successfully grown to full
market size in a Recirculating Aquaculture System facilities. Several projects are
currently either planned, or in operation. Coho salmon is grown by Swift Aquaculture in
Agassiz, BC. AgriMarine also operates an ocean-based system growing Chinook
Salmon with funding from SDTC and the Gordon & Betty Moore Foundation. In 2014, the
‘Namgis First Nation began selling its first Recirculating Aquaculture System-raised
Atlantic salmon from their facility in Port McNeil, BC with funding from SDTC, Tides
Canada and the Coast Sustainability Trust. Another company in Nova Scotia,
Sustainable Blue, is also in the process of developing an Atlantic Salmon Recirculating
Aquaculture System facility in Burlington, NS. Other facilities in Washington state,
Montana, West Virginia and Denmark are also experimenting with Atlantic salmon
Recirculating Aquaculture Systems. Several other projects are also both planned and in
operation in Europe, Chile and China (Tides Canada 2013).

35
Recirculating Aquaculture Systems present several environmental benefits, but
also some environmental drawbacks. First, the risk of escapes into the marine
environment is eliminated. Second, the risk of disease/parasite transfer to wild stocks is
also eliminated. Third, as the water is treated upon entry, there are fewer disease issues
to be concerned of, including sea lice issues. Fourth, there is no release of (in)organic
waste to the benthic environment, and the marine environment is not harmed or altered
in any way (no deleterious substances deposited). Environmental drawbacks include
high energy costs, large land footprint, high water requirements, and high carbon dioxide
emissions.
3.2. Governance and Regulation
This section will give a brief overview of the legal and regulatory framework in
which aquaculture operates in Canada, to help inform the discussion on barriers and
drivers of adoption. According to memoranda of understandings (MOUs) signed between
DFO and the provinces in the 1980s, aquaculture falls under the jurisdictional authority
of the provinces. Provinces regulate and manage aquaculture, but are still subject to the
provisions of the Fisheries Act (1985) and its associated regulations, as well as to all
other Federal requirements (such as, for example, fish health standards established by
the Canadian Food Inspection Agency [CFIA]). The Fisheries Act (1985) is the main
federal instrument for aquaculture management; however, aquaculture is not mentioned
by name anywhere in the Act (RIAS 2012). DFO regulates fish products reserved for
export and interprovincial trade. Both jurisdictions coordinate in R&D, information
sharing, compliance and monitoring activities (Cohen 2012a). In the Atlantic Provinces,
finfish and shellfish licenses are reviewed and adjudicated by provincial authorities,
which incorporate all federal requirements into the license application process.
In British Columbia, however, Mr. Justice Hinkson ruled in December 2009 that
aquaculture was deemed to be a fishery, and should therefore fall under the exclusive
jurisdiction of DFO (Morton v. British Columbia [Agriculture and Land]). Therefore, as of
December 18, 2010 all BC salmon farms are now regulated by DFO. This is also the
case for shellfish, freshwater/land based aquaculture sites, and enhancement facilities.
DFO collaborates with Transport Canada and the provincial Ministry of Forests, Lands

36
and Natural Resources Operations and the Ministry of Agriculture, to review applications
in a harmonized manner. Aquaculture operations are regulated under the federal Pacific
Aquaculture Regulations, but tenure leases are issued by the Province. DFO is currently
in the process of developing and implementing various policies to support the Pacific
Aquaculture Regulations. As such, DFO is currently largely operating on a framework
inherited from the Province (Cohen 2012c). Whereas licenses were grandfathered into
the new system, licenses are currently only issued on a year-by-year basis. Therefore,
this reduces long-term investor certainty. However, DFO has indicated that licenses
would begin to be granted on six-year terms in the very near future (Marine Harvest
2014).
DFO is also in the process of developing three Integrated Management of
Aquaculture Plans: one for finfish, one for shellfish, and one for the freshwater/land-
based sector. Integrated Management of Aquaculture Plans are intended to take an
area-based approach to management, as opposed to a site-by-site basis (Cohen
2012a). These are to be developed by three Integrated Aquaculture Management
Advisory Committees, which will consult with First Nations, industry officials and other
stakeholders in plan development. It is important to note that whereas certain
environmental non-governmental organizations (ENGOs) were invited to participate in
this process and were offered three seats on the committee, they declined to participate
because they claimed they were advised by DFO that some of their key concerns would
not be addressed (Watershed Watch et al. 2014). Therefore, it appears as though this
issue (at least for some) will likely remain unresolved and polarized. Furthermore, social
license to operate may not be fully obtained.
In the absence of a Federal Aquaculture Act, which has been stressed as
necessary by a variety of stakeholders including the Canadian Aquaculture Industry
Alliance (ASF 2014), regulations are currently scattered across a patchwork of
legislation including 17 different federal departments and agencies and a variety of
provincial agencies (FAO 2014). Indeed, the Office of the Commissioner for Aquaculture
Development stated in 2001 that:
aquaculture is mired in a complex jurisdictional framework that involves federal, provincial and municipal agencies… Existing policies, regulations

37
and legislation were developed largely for fisheries management and not attuned to the needs of aquaculture, an aquatic agri-food industry. Aquaculture requires a modern legal and policy framework that is in concordance with the agri-food aspects of this aquatic farm sector. (OCAD 2003)
In order to address this complex regulatory and legislative environment, DFO has
developed guidelines and action plans under the National Aquaculture Strategic Plan
Initiative, which will aim to improve governance, social license and reporting,
productivity, competitiveness and sustainability (POC 2013). Furthermore, the recently
released Aquaculture Activities Regulations, 2015 were released by DFO to increase
clarity and reduce discrepancies and redundancies. The aim of the these regulations is
to “clarify conditions under which aquaculture operators may treat their fish and deposit
organic matter, while ensuring the protection of fish and fish habitat and sector
sustainability” (DFO 2014b). A thorough analysis of the Aquaculture Activities
Regulations will be required to determine whether these new regulations adequately
address the environmental concerns as expressed by the public, ENGOs and by the
Cohen Commission Report.
Other key federal actors include the CFIA, which administers the Health of
Animals Act (1990) and related regulations such as the Feed Act (1985), and co-
administers the National Aquatic Animal Health Program. Health Canada regulates feed
products and veterinary drugs. Agriculture and Agri-Foods Canada promotes export
market development. Environment Canada (EC) also conducts water quality monitoring
and manages the Contaminated Fisheries Regulations. Transport Canada grants
authorizations for aquaculture facilities under the new Navigation Protection Act (2012)
With recent changes to federal legislation, salmon farms no longer require a federal
environmental assessment (EAs). Proponents of salmon farms are not currently required
to undergo a provincial EA process for marine open-net pens in any of the Atlantic
Provinces or BC.
As previously mentioned, the regulation, management and licensing of shellfish
aquaculture operations is the responsibility of provincial authorities, except in the case of
British Columbia where DFO has assumed this responsibility. Nevertheless, shellfish
safety and health is regulated under the federal Canadian Shellfish Sanitation Program

38
and all producers must comply with it. Three federal departments work to deliver this
program: DFO, CFIA and EC. DFO regulates licenses, harvesting locations and times,
and deals with compliance and enforcement issues. EC identifies safe shellfish harvest
areas, conducts comprehensive sanitary and bacteriological water quality surveys,
identifies and assesses sources of pollution that could negatively impact shellfish
production, and recommends classification of shellfish harvest areas to DFO. Finally,
CFIA regulates all aspects of food safety, including the certification of producers. It also
maintains a biotoxin surveillance program (CFIA 2014). It is important to note that until
recently, the Canadian Shellfish Sanitation Program had a clause in its Manual of
Operations prohibiting the cultivation of shellfish within 125 meters of salmon farms, due
to concerns for possible fecal coliform contamination. This was a major barrier to the
initial implementation of IMTA and took four years of data collection (2004-2008) before
it was amended to legally allow co-culture of shellfish and salmon in close proximity.
Based on the above discussion, it can be concluded that policy at the Federal
level, in British Columbia and in Nova Scotia is currently in a process of great change.
There is significant uncertainty, which has slowed industry growth in the last decade.
Some of this uncertainty should become somewhat clarified in the upcoming years as
governments modernize and clarify their regulatory frameworks. This changing
regulatory landscape, combined with the barriers that IMTA faces as a technology, have
very important implications for companies who seek certainty upon which to base their
production decisions, which include choice of technology.
3.3. Existing Regulatory Barriers to Industry Competitiveness
The salmon and shellfish aquaculture industries in Canada today face a number
of regulatory challenges, which is argued to impede their ability to grow. This can, in
turn, hamper investment and job growth, and thus reduce total government revenues.
Regulatory Impacts, Alternatives and Strategies (2011) and Canadian Aquaculture
Industry Alliance (2013) identified several regulatory and institutional barriers that these
two industries currently face, and the financial implications of these on producer
revenues, government revenues, and the labor market.

39
For the finfish aquaculture sector, CAIA (2013) found that duplication and overlap
in authorization and permitting processes, lengthy timelines, lack of transparency, a
prescriptive and inflexible license amendment process, excessive information and data
requirements, and short tenure and site license terms, were the main factors impeding
growth. RIAS (2011) additionally found that a lack of consistency in the aquaculture
regulatory framework across provinces, and the difficulty in obtaining regulatory
approvals (e.g. from Health Canada or Canadian Food Inspection Agency) for new
products/processes proven in other jurisdictions, exacerbated the situation.
For the shellfish aquaculture sector, CAIA (2013) found similar results. It
concluded that barriers included an inflexible license amendment process, lengthy and
uncertain timelines, lack of transparency, duplicative authorization and permitting
processes, lack of clarity on recent regulatory changes, and excessive data and
information requirements. It also found that site license terms were issued for too short a
period, and that the inability to assign this as collateral (also an issue for finfish) made it
difficult to obtain financing.
CAIA (2013) concluded that these regulatory and institutional barriers resulted in
both high direct compliance costs, as well as in large inefficiencies, which translated into
high indirect costs and lost income. It concluded that the total value of direct compliance
costs for the finfish aquaculture industry was $ 10.3 million, indirect compliance costs
$80.9 million, and reduction in net income $ 306.5 million. Similarly, for the shellfish
aquaculture industry, it found that the total value of direct compliance costs was
$211,000, indirect costs were $ 5.5 million, and lost income was $ 20.9 million. As a
result of this, it was concluded that gross output was reduced by $ 324.5 million, GDP
was lowered by $ 345 million, and 4 313 FTE jobs were lost. Furthermore, it was
estimated that the government lost $ 45.1 million in income taxes, $ 16.1 million in
corporate taxes and $ 18.1 million in indirect taxes less subsidies. This number was
supported by another independent analysis conducted by the CCG Consulting Group in
2000, which estimated direct and indirect levels of federal regulatory burden to the finfish
industry to be approximately $ 90 million (RIAS 2011).

40
3.4. Hypothesized Barriers to IMTA Implementation
The CAIA (2013) study noted that addressing the regulatory barriers to IMTA
adoption was a priority regulatory issue in the medium term. I hypothesize, based on the
discussion noted above, that it would appear that Canada’s regulatory system likely
supports the tendency for industry to be conservative, and thus less likely to invest in
new production methods such as IMTA. Furthermore, I hypothesize that regulatory and
policy uncertainty plays a key role in acting as a disincentive to adoption. There is a
significant overhaul of policy and legislation currently happening at the federal level, in
British Columbia and in Nova Scotia, and producers are likely waiting to see how
regulations will change before making any further investment decisions, especially
pertaining to addressing environmental issues associated with their farming practices.
This lack of certainty for existing monoculture systems already creates difficult
challenges in attracting capital and financing, and this is for a well-demonstrated and
highly profitable production system (CAIA 2013). IMTA has yet to demonstrate its
profitability in a commercial setting and, in light of the aforementioned issues, it is
unlikely to attract much interest at the present time from salmon farming companies.

41
Chapter 4. Approach and Methods
Chapter 2 reviewed the many different theoretical frameworks that have been
developed to explain the observed diffusion of new technologies. Taken together, the
Battisti Model and the Real Options Approach were hypothesized to best explain the
dynamics of IMTA adoption. A review of multiple case studies supported this hypothesis,
demonstrating that certain key factors influence barriers to and incentives for new
technology adoption, independent of time or location. Chapter 2 also showed that the
qualitative analysis of data, especially in the domain of social sciences or in studies with
a small number of participants, is a scientifically defensible and rigorous method of
investigation. In order to answer my research questions, a variety of methods were
considered, both quantitative and qualitative. A qualitative method was chosen due to
the limited applicability of quantitative methods to this study (sample size <30), and the
desire to explore questions in depth with participants to generate a deeper
understanding of the topic.
4.1. Qualitative Analysis Approach
Qualitative analysis is exploratory and inductive in nature, focusing in-depth on
the analysis of content. It seeks to understand meaning and context, identify
unanticipated phenomena to help generate theory, understand the process by which
actions take place, and develop causal explanations (Maxwell 2005). Such analysis
requires careful and standardized procedures, and should be methodical and objective
(Huberman 1994). In-depth qualitative studies of situated experiences also provide a
deeper understanding than what would be obtained from the gathering of standardised
quantitative data (Mackrell et al. 2009). This approach to data analysis was therefore
chosen as it was most applicable to the exploratory goals of my research.
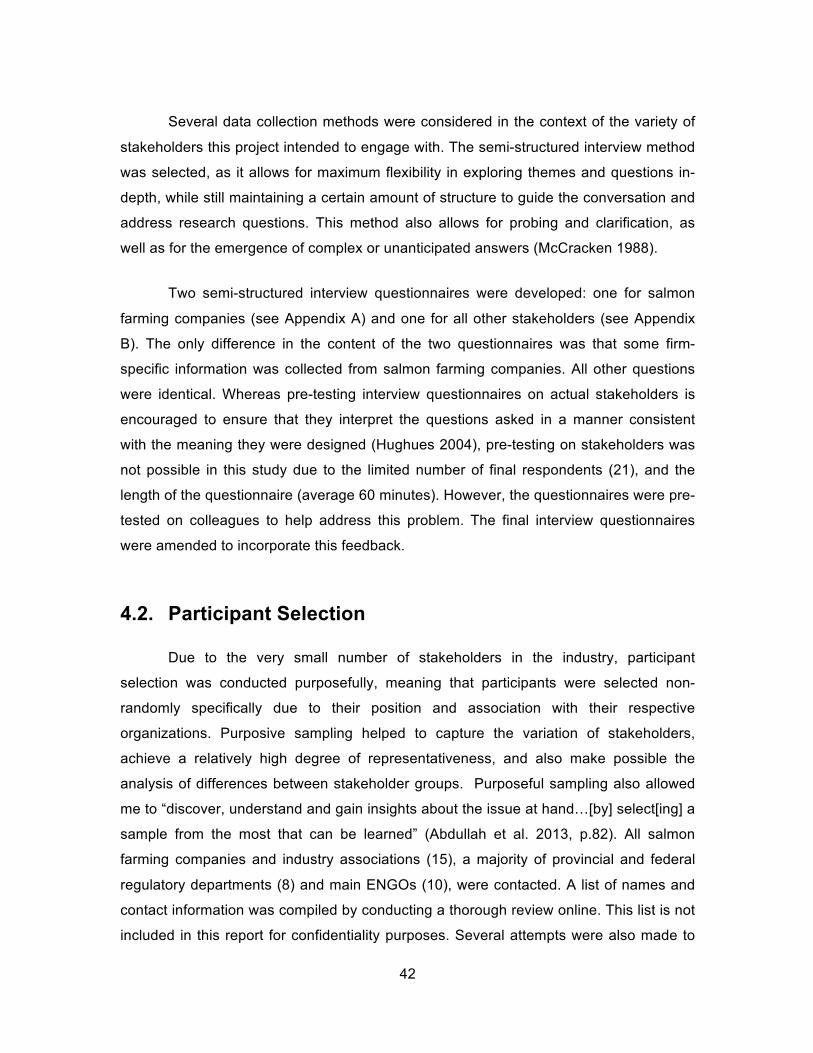
42
Several data collection methods were considered in the context of the variety of
stakeholders this project intended to engage with. The semi-structured interview method
was selected, as it allows for maximum flexibility in exploring themes and questions in-
depth, while still maintaining a certain amount of structure to guide the conversation and
address research questions. This method also allows for probing and clarification, as
well as for the emergence of complex or unanticipated answers (McCracken 1988).
Two semi-structured interview questionnaires were developed: one for salmon
farming companies (see Appendix A) and one for all other stakeholders (see Appendix
B). The only difference in the content of the two questionnaires was that some firm-
specific information was collected from salmon farming companies. All other questions
were identical. Whereas pre-testing interview questionnaires on actual stakeholders is
encouraged to ensure that they interpret the questions asked in a manner consistent
with the meaning they were designed (Hughues 2004), pre-testing on stakeholders was
not possible in this study due to the limited number of final respondents (21), and the
length of the questionnaire (average 60 minutes). However, the questionnaires were pre-
tested on colleagues to help address this problem. The final interview questionnaires
were amended to incorporate this feedback.
4.2. Participant Selection
Due to the very small number of stakeholders in the industry, participant
selection was conducted purposefully, meaning that participants were selected non-
randomly specifically due to their position and association with their respective
organizations. Purposive sampling helped to capture the variation of stakeholders,
achieve a relatively high degree of representativeness, and also make possible the
analysis of differences between stakeholder groups. Purposeful sampling also allowed
me to “discover, understand and gain insights about the issue at hand…[by] select[ing] a
sample from the most that can be learned” (Abdullah et al. 2013, p.82). All salmon
farming companies and industry associations (15), a majority of provincial and federal
regulatory departments (8) and main ENGOs (10), were contacted. A list of names and
contact information was compiled by conducting a thorough review online. This list is not
included in this report for confidentiality purposes. Several attempts were also made to
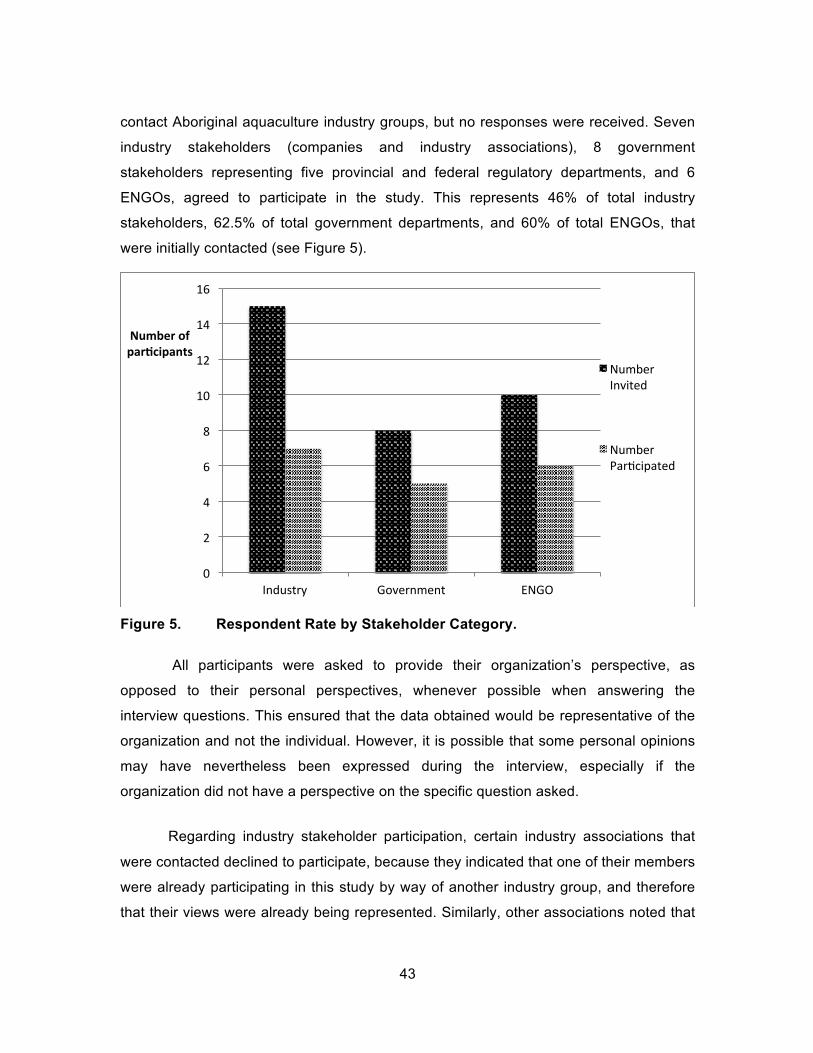
43
contact Aboriginal aquaculture industry groups, but no responses were received. Seven
industry stakeholders (companies and industry associations), 8 government
stakeholders representing five provincial and federal regulatory departments, and 6
ENGOs, agreed to participate in the study. This represents 46% of total industry
stakeholders, 62.5% of total government departments, and 60% of total ENGOs, that
were initially contacted (see Figure 5).
Figure 5. Respondent Rate by Stakeholder Category.
All participants were asked to provide their organization’s perspective, as
opposed to their personal perspectives, whenever possible when answering the
interview questions. This ensured that the data obtained would be representative of the
organization and not the individual. However, it is possible that some personal opinions
may have nevertheless been expressed during the interview, especially if the
organization did not have a perspective on the specific question asked.
Regarding industry stakeholder participation, certain industry associations that
were contacted declined to participate, because they indicated that one of their members
were already participating in this study by way of another industry group, and therefore
that their views were already being represented. Similarly, other associations noted that
0
2
4
6
8
10
12
14
16
Industry Government ENGO
Number of par.cipants
Number Invited
Number Par0cipated

44
their views would be represented by the major companies that I would be interviewing,
and therefore declined to participate. Finally, whereas some companies declined to
participate, they are listed as members in associations that were interviewed, and
therefore it logically follows that the views obtained throughout these interviews can
serve as a proxy for their views. Similarly for government departments, all departments
that have aquaculture as a key part of their mandates were interviewed. Some
government departments that were contacted that were involved in aquaculture but not
as substantially as the others also referred me to these “primary” departments, as they
considered my research questions to fall outside their mandates. Therefore, whereas I
obtained a participation rate that ranged from 46 to 62.5% of total stakeholders, the
views obtained are representative of an even greater proportion of this total. As this
number is quite significant, I consider my results to be representative of the stakeholders
in the salmon aquaculture industry of Canada.
After receiving approval from the Office of Research Ethics of Simon Fraser
University, stakeholders were initially contacted by e-mail. A follow-up e-mail was sent
two weeks later, and a phone call was attempted if there was still no response. If
participants indicated their desire to participate, a meeting time and location was agreed
upon. Whereas all efforts were made to conduct interviews in-person, some had to be
conducted over the phone due to stakeholder availability or travel cost reasons. All
interviews were recorded on a Digital Recording Device, with the written consent of the
participant. Interviews were later transcribed and then uploaded for analysis into NVivo,
a popular qualitative data software analysis package used by academics, governments
and the private sector, that applies the formal analysis methods I used (see section 4.2)
(QSR 2015). Developed by QSR International, NVivo is designed for qualitative
researchers to organize, manage, analyze and find insights in qualitative, non-numerical
and unstructured data, such as text, images, literature, surveys and social media. It
allows users to work with text-based data to conduct deep levels of analysis, explore the
data, test theories, run queries and visualize findings. As such, it allows the user to
uncover connections and insights in ways that are not possible manually. It also allows
the researcher to increase transparency and accountability, provide robust evidence and
therefore data-driven policy recommendations (QSR 2015), thereby ensuring that
conclusions are rigorous and fact-based.

45
4.3. Qualitative Data Analysis Methods
Qualitative data analysis is a complex process that requires objectivity, rigour
and consistency. Whereas various methods and guidelines have been developed in the
last few decades, there is disagreement in regard to the best approach to analyze a
mass of interview data (De Casterle et al. 2012). Nevertheless, most approaches tend to
begin by sorting data into categories of interest, to help uncover patterns across
interviews and thus develop themes. Known as thematic analysis, this process follows
the process of data reduction, data display, data verification and conclusion drawing
(Miles & Huberman 1994). Thematic analysis is an iterative and reflexive process,
frequently used by social scientists in their analysis of primary qualitative data to identify
patterns in the data (Thomas & Harden 2008).
This study drew upon the principles and theory of thematic analysis and
qualitative conceptual analysis (Miles & Huberman 1994), and tailored it to the research
questions by implementing a hybrid coding approach of both a priori coding and
inductive coding. A priori coding involves a researcher identifying or “coding” segments
of text to themes according to a pre-established coding framework, developed by taking
into account research questions and goals, knowledge of the content of the interview
transcripts, and the theory and literature (Lewis-Beck et al. 2004). Inductive coding is a
data-driven approach based on grounded theory that involves coding themes as they
emerge from the data during analysis (Flick 2014; Belizan et al. 2007). This study
adopted a hybrid combination of both methods, as this would provide the flexibility to
ensure that the final coding framework was a true representation of the data contained in
the text. This also allowed me to obtain greater insight, incorporate a richer definition of
meaning into the analysis, and helped preserve an explicit link between the text and the
conclusions to allow for evidence-informed policy and decision-making (Thomas &
Harden 2008; Carley 1993; Busch et al. 2008).
The conceptual framework that I used to develop both my interview questionnaire
and my a-priori coding framework was based on the theory presented in the Battisti
Model and Real Options Approach, from the conclusions I drew from my review of
empirical case studies (section 2.2), and from my knowledge of IMTA and the Canadian

46
salmon aquaculture industry. The theory and literature review suggested that certain key
explanatory variables such as “regulatory stringency”, “uncertainty”, “profitability”,
“economics” and “public pressure” were common denominators throughout various
global sectors. The literature review of empirical studies also helped to ground truth the
theory of the two models that I hypothesized could best explain IMTA adoption
dynamics. As such, it is from this perspective that I prepared my semi-structured
interview questionnaire. My knowledge of the content of the interviews, after having
conducted them, then allowed me to focus my conceptual framework into a list of initial
codes, viewed through the lens that was my research questions. My initial a-priori coding
framework therefore contained codes such as “Regulations”, “Institutional Frameworks”,
“”Uncertainty”, “Organizational and Managerial Experience”, “Research and
Development”, “Profitability”, “Economics”, “Learning Effects”, “Ecological Benefits”,
“Environment”, “Fish Health”, “Nutrients” and “Eco-certifications”.
Coding was conducted line by line to ensure that all material relevant to the
research question was adequately captured. Text segments were systematically
grouped into pre-identified thematic categories that contained highlighted commonalities
(Auerbach and Silversterin, 2003). As new themes emerged within and across
interviews, they were compared to the existing coding framework, to the research
questions, and to the existing data, to ensure validity. New themes were added if a
general pattern emerged across interviews, and if it was relevant to the research
questions. For consistency, I constantly re-evaluated my list of codes, merging codes
into one another if it was determined that they represented the same overarching theme
(for example, two discrete aspects pertaining to the same general concept could be
merged into one code, such as “Biological Uncertainty”). Every time the coding
framework was altered, all the interviews were re-coded to reflect this change. As such, I
was able to systematically and methodically code the data in my interviews, reaching my
goal of understanding the perspectives and opinions of participants in the interview
process. A total of 11 themes were identified and coded to, and are presented in Table 1
in the results chapter along with their associated definitions.
The semi-structured interview questionnaire also contained several Likert-style
questions, which are widely used in survey research (De Winter & Dodou, 2010). Likert-

47
style questions ask participants to indicate their level of agreement with a particular
statement, and are ordinal in nature. Likert-style data were assigned numbers (i.e.
Strongly Disagree = 1; Disagree = 2; Don’t Know =3; Agree = 4; Strongly Agree = 5),
and graphs were generated to inform the discussion. Due to the qualitative nature of the
study, the limited number of participants and the type of data collected, no additional
formal statistical analyses were conducted.
4.4. Limitations
This approach and methodology has four limitations. First, due to the nature of
the study and the types of stakeholders interviewed, it was not possible to triangulate the
data using more than one qualitative data collection method. Social scientists often use
triangulation to validate results and achieve a deeper understanding of meaning
(McCracken 1988). Additional methods such as focus groups and the use of multiple
data analysts could have helped increase robustness and perhaps capture different
dimensions of the issue. Nevertheless, this study implemented rigorous methods, was
objective, and remained true to the data by utilizing quotes from participant interviews to
substantiate the analysis and support the conclusions. Therefore, whereas triangulation
could have helped increase the study’s rigour, the lack of triangulation likely does not
reduce the validity of my data or its conclusions.
A second limitation of this study was the potential creation of self-selection bias
as a result of providing interview questionnaires to participants ahead of time. Many
participants requested that I provide them with the questionnaire a few days prior to the
interview, in order for them to prepare, to gather information from colleagues to help
answer specific questions, to follow along during the interview (which was absolutely
necessary for interviews conducted over the phone) or simply to prepare a formal
company, departmental or organizational reply. However, as a result of providing the
interviews ahead of time, some stakeholders who had initially agreed to participate
(largely from the industry group) then decided they no longer wished to proceed with the
interview. Therefore, it is possible that my results do not represent the full gamut of
stakeholder responses, and that they are naturally skewed towards the answers of
participants who were more willing to participate in this type of study. However, this is a

48
limitation that all researchers involved in primary qualitative data collection must deal
with. My participants are split into three roughly equal groups, so therefore one group’s
responses do not overwhelm the responses from another group’s, thereby overly
skewing the data. Conclusions may also be inferred from some of the non-responses.
A third limitation of this study is that it could be argued that different degrees of
rapport were established with participants who were interviewed over the phone versus
those who were interviewed in person. This, then, could influence how participants felt
during the interview and thus their willingness to participate and share information.
Whereas it should be the goal of all researchers to replicate their research methodology
as closely as possible for each test subject, this is sometimes not always perfectly
feasible (especially in the social science field). Indeed, one of the strengths of the semi-
structured interview is that it allows for extra discussion with the participant.
Nevertheless, interviews were standardized to the extent possible, and high quality
responses were obtained for both in-person and telephone interviews. Therefore, it is
unlikely that a significant difference in the quality of data exists between telephone
interviews and in-person interviews.
A final limitation of this study was the inability to successfully contact Aboriginal
aquaculture industry groups and have them participate in the study. Aboriginal
aquaculture is an important activity in many rural, coastal communities of British
Columbia, and understanding their perspectives on IMTA would have provided important
and unique insights. Nevertheless, research on Aboriginal perspectives towards IMTA is
currently being conducted by Canadian IMTA Network researchers based out of the
University of Victoria, and their results when available will help to supplement those of
this study.
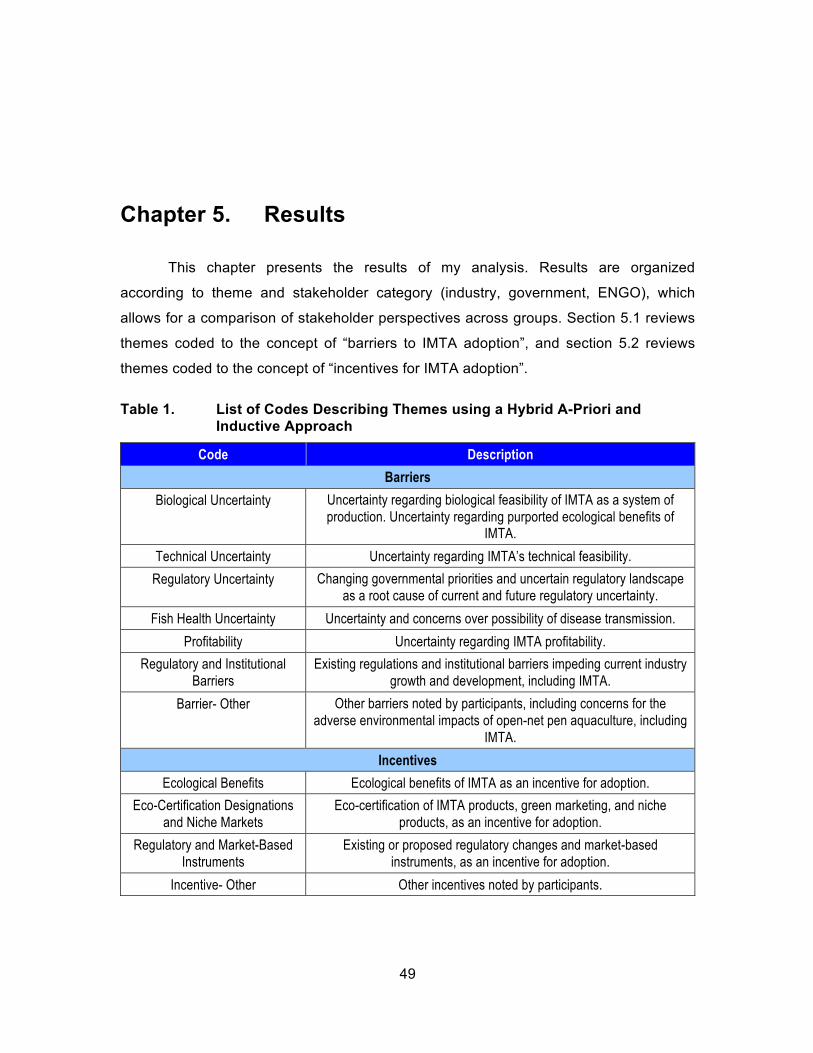
49
Chapter 5. Results
This chapter presents the results of my analysis. Results are organized
according to theme and stakeholder category (industry, government, ENGO), which
allows for a comparison of stakeholder perspectives across groups. Section 5.1 reviews
themes coded to the concept of “barriers to IMTA adoption”, and section 5.2 reviews
themes coded to the concept of “incentives for IMTA adoption”.
Table 1. List of Codes Describing Themes using a Hybrid A-Priori and Inductive Approach
Code Description Barriers
Biological Uncertainty Uncertainty regarding biological feasibility of IMTA as a system of production. Uncertainty regarding purported ecological benefits of
IMTA. Technical Uncertainty Uncertainty regarding IMTA’s technical feasibility.
Regulatory Uncertainty Changing governmental priorities and uncertain regulatory landscape as a root cause of current and future regulatory uncertainty.
Fish Health Uncertainty Uncertainty and concerns over possibility of disease transmission. Profitability Uncertainty regarding IMTA profitability.
Regulatory and Institutional Barriers
Existing regulations and institutional barriers impeding current industry growth and development, including IMTA.
Barrier- Other Other barriers noted by participants, including concerns for the adverse environmental impacts of open-net pen aquaculture, including
IMTA. Incentives
Ecological Benefits Ecological benefits of IMTA as an incentive for adoption. Eco-Certification Designations
and Niche Markets Eco-certification of IMTA products, green marketing, and niche
products, as an incentive for adoption. Regulatory and Market-Based
Instruments Existing or proposed regulatory changes and market-based
instruments, as an incentive for adoption. Incentive- Other Other incentives noted by participants.

50
Table 1 illustrates the final list of themes that were used to code the data. This list is the
result of the hybrid approach using both a priori and inductive coding. Tables 2-9
present occurrence of theme by stakeholder group, where occurrence is defined as the
theme being mentioned at least once by a stakeholder.
5.1. Barriers to the Adoption of IMTA
The analysis conducted in NVivo identified the presence of seven key themes
that were considered to be barriers to the adoption of IMTA. These were: (i) Biological
Uncertainty, (ii) Technical Uncertainty, (iii) Regulatory Uncertainty, (iv) Fish Health
Uncertainty, (v) Profitability; (vi) Regulatory and Institutional Barriers; and (vii)
Environmental Concerns (see Table 1). The sections below discuss each of these
themes in turn.
5.1.1. Biological Uncertainty
The theme “Biological Uncertainty” was observed for a total of 10 participants
across all three stakeholder groups (see Table 2). It was coded to the majority of
government participants, and to only one industry participant, indicating the relative
importance of this issue to the government stakeholder group (for more discussion, see
Chapter 6).
Table 2. Occurrence of Theme “Biological Uncertainty” by Participant Group
Stakeholder Group Number of Respondents Proportion of Total in Stakeholder Group
Industry 1 14% Government 6 86%
ENGO 3 43%
Certain participants expressed concerns that no conclusive scientific evidence
currently exists demonstrating that shellfish and kelp remove a significant amount of
nutrient effluent from the salmon farm. Some participants argued that studies
demonstrate that nutrient effluent either sinks right to the bottom, or due to currents and
tidal action flows right past the shellfish and kelp rafts and dilutes into the broader

51
environment, resulting in limited uptake. As such, these respondents questioned the
validity of IMTA’s claim to providing positive environmental benefits, and noted that
current configurations would not help to solve nutrient-related problems in the
surrounding marine environment. The following two quotes exemplify this perspective:
They don’t really have a good data set to show that it has this impact on reducing environmental impact… the biggest impediment to IMTA is that no one has been able to demonstrate that conclusively. (Participant 15, Government)
There’s a very strong component of the scientific industry that believes that there’s absolutely no benefit whatsoever to those organisms that you put around that farm simply because the nutrients – because they are washed away in the tide, they’re gone, sucked away so fast, that there’s no benefit at all to doing so. (Participant 16, ENGO)
The second key concept that was raised regarding biological feasibility was the
scale at which IMTA farms would have to operate in order to achieve desired
environmental mitigation of nutrient effluent. Some participants argued that current IMTA
configurations do not remove a sufficient amount of nutrients from the system prior to
dilution into the broader marine environment. For this to occur, they noted that a very
large amount of marine plants would have to be placed around the salmon farm, which
they believed would reduce water flow and dissolved oxygen levels at the farm site to a
point that would harm the health of the farmed salmon. This is represented by the
following quote:
Everything you put in the water around one of these farms… reduces your water flow. When the water flow is reduced, the oxygen level going through the fish in your pens is reduced…To impede water flow on any of these sites…existing or that you will be applying for, you’re gonna get problems. You’re gonna cut back on your profitability because you’re gonna loose some of your fish. (Participant 19, ENGO)
These respondents noted significant concerns regarding the potential for marine
plant species in such concentrations to negatively affect the biochemical and physical
conditions at the farm site, resulting in negative effects on salmon health. There appears
to be a belief among these respondents that the scale required to offset the
environmental impacts associated with nutrient effluent would result in increased salmon
mortality, and reduced profitability.

52
5.1.2. Technical Uncertainty
The theme “Technical Uncertainty” was observed for a total of 18/21 participants
across all three stakeholder groups (see Table 3).
Table 3. Occurrence of Theme “Technical Uncertainty” by Participant Group
Stakeholder Group Number of Respondents Proportion of Total in Stakeholder Group
Industry 5 83% Government 7 88%
ENGO 6 75%
Two key issues were coded to this theme. These are: (1) uncertainty regarding
the ability to successfully incorporate bottom-feeders into a commercial IMTA operation
from a technical perspective; and (2) uncertainty regarding the ability of companies to
successfully technically integrate IMTA as a production method into their operations.
Regarding the first issue, a substantial amount of nutrient effluent is thought to
deposit on the sea floor, directly beneath the farm site. Therefore, integrating a deposit-
feeder component into the IMTA operation (sea urchins, sea cucumbers, etc.) could
theoretically help to address the issue of mitigating nutrient impacts. Whereas this is a
concept that is currently being explored by researchers, some participants expressed
uncertainty regarding the technical feasibility of culturing these species on a commercial
scale below salmon farms. The following quotes provide context for this perspective, and
demonstrate the crucial importance of overcoming this technical barrier if IMTA is to be
successful from an environmental point of view:
There are immense logistics with growing things under the cages and as far as I know, there hasn’t been any success in making this kind of thing try and work out. (Participant 11, Government)
For the benthic critters which is going to be most important…unless that part works, I can’t see anybody really going for it [IMTA], on the

53
environmental front… If we had critters in the benthic environment that would help keep sulphite levels even lower than they are, that would allow to increase the productivity of the site, that is the only component that I can see making this really of interest to farmers. (Participant 6, Industry)
Regarding the second issue, results indicate that a majority of respondents
considered uncertainty over technical feasibility to be a moderately to very important
barrier to the adoption of IMTA (see Figure 6). This uncertainty appears to be particularly
important for industry respondents (80% indicated it was very important), and
moderately important to government respondents. The quote below provides further
evidence for this perspective:
They [salmon farming companies] told me outright 5 years ago, go show us whether or not it works, before we’ll even consider it. That was a quote from the salmon farmers (Participant 3, Industry).
Figure 6. Level of agreement of respondents on whether uncertainty over
technical feasibility represented a barrier to the adoption of IMTA Note: Results may not add up to 100% of total responses due to missing values.
0.00%
10.00%
20.00%
30.00%
40.00%
50.00%
60.00%
Industry Government ENGO
Percentage of
Par.cipants
No Importance
Moderately Important
Very Important

54
5.1.3. Regulatory Uncertainty
The theme of regulatory uncertainty was observed for a total of 10/21 participants
across all three stakeholder groups (see Table 4). This theme was coded most
frequently to the industry stakeholder group, with 86% of industry participants noting this
as an issue. Conversely, only a minority of government and ENGO respondents raised
this as an issue in the interviews.
Table 4. Occurrence of Theme “Regulatory Uncertainty” by Participant Group
Stakeholder Group Number of Respondents Proportion of Total in Stakeholder Group
Industry 6 86% Government 3 38%
ENGO 1 17%
Many participants noted that a constantly evolving regulatory framework, and
lack of certainty regarding how or when it might change again in the future, provides a
significant disincentive to invest in new operations, as well as to invest in new
technologies such as IMTA. This issue is exemplified below in a quote from an industry
producer:
All it takes is for the government to change and then of course it’s if they got a campaign that we’re going to slow something down or put a stop to it until we get a better view because that’s what the public wants to hear. Then they’ll stick one on [a moratorium]. To me that seems like what happened in BC…It seems as soon as one government comes in, everything changes - policies change, so now you’re kind of alright. It’s really hard as a company trying to look ahead to the future knowing they always can put the brakes on. (Participant 1, Industry)
Lack of regulatory certainty can impede planning processes, and reduce a
company’s desire to invest. Frequent changes, whether they be to regulations, to license
conditions, to monitoring requirements or even to re-organize production to abide by Bay
Management Areas, creates hurdles that must be overcome, and depending on the
severity of the change, can create an uncertain environment which is less conducive to
investment. Some participants also noted frustrations with changes in provincial land-
use policy, which they argue can also negatively affect the aquaculture industry. As
stated by one participant:

55
One First Nation that has an issue with government and they take them to Court and the Court favours something in their favour, and all of a sudden the brakes are on or can be put on by government, because they’re gonna question how they deal with every other decision they need to make, including any other industry companies that might want to be in expansion mode. The word moratorium isn’t going to catch all these types of issues, but it’s certainly that kind of issue that makes this a big issue for someone who is looking for investors. Investors want certainty, they want certainty when they put their money into something. (Participant 3, Industry)
Therefore, results suggest that regulatory uncertainty pertaining to government
direction and vision, as well as land policy, presents a significant barrier to adoption of
IMTA. Implications will be discussed in Chapter 6.
5.1.4. Fish Health Uncertainty
The theme “Fish Health Uncertainty” was observed for a total of 7/21 participants
across all three stakeholder groups (see Table 5). Frequency of theme occurrence was
greatest for industry (71%), followed by government (25%). This theme was not coded to
ENGO participants. Note that this theme specifically refers to the uncertainty regarding
the potential for additional species in the operation to adversely affect the health of the
salmon crop. Concerns over disease transmission to wild stocks is not covered here.
Table 5. Occurrence of Theme “Fish Health Uncertainty” by Participant Group
Stakeholder Group Number of Respondents Proportion of Total in Stakeholder Group
Industry 5 71% Government 2 25%
ENGO 0 0%
Certain participants expressed concerns regarding the potential for disease
transmission between cultured shellfish or bottom-feeder species, and the salmon.
Concerns include that these species could harbor viruses, parasites or pathogens which
could infect farmed salmon due to their close proximity. This perspective is supported by
the following quotes:

56
I’ll say no we haven’t pursued IMTA at this point and the major concern there is the potential for disease transfer to our fish. Until the work with the network, focuses in enough on disease pathogens then we’ll probably still be resistant to putting our fish at risk. (Participant 2, Industry)
The fish health people consider that multi-culture of any species on the site as a fish health risk… the seaweed can act as an intermediate host for parasites and things like that…But it can also harbour viruses and things like that over extended periods. And screw up fish fouling and things… so the fish health people on the east coast, they are well, well basically Nova Scotia and Newfoundland said no, because of fish health concerns. (Participant 13, Government)
Results therefore indicate that uncertainty regarding the ability of additional organisms to
adversely affect fish health is a key concern to industry.
5.1.5. Profitability
The theme “Profitability” was observed for a total of 21/21 participants across all
three stakeholder groups (see Table 6). This unanimity likely indicates the importance of
this factor as a barrier to adoption.
Table 6. Occurrence of Theme “Profitability” by Participant Group
Stakeholder Group Number of Respondents Proportion of Total in Stakeholder Group
Industry 7 100% Government 8 100%
ENGO 6 100%
For a technology to be attractive to producers, it needs to achieve its desired objective,
and it needs to be profitable. Without profitability, there is very little incentive to depart
from the status quo. In order to determine whether profitability was a barrier to the
adoption of IMTA, I asked participant’s to indicate, based on their current level of
knowledge of IMTA, whether or not they considered IMTA to be profitable. Results are
illustrated in Figure 7. Figure 8 depicts stakeholder perspectives on IMTA profitability by
stakeholder subgroup.

57
Figure 7. Given what you know about IMTA, would you agree that it would be
profitable to adopt at present?
Figure 8. Participant perspectives on whether IMTA is profitable to adopt at
present
The results above suggest that overall stakeholders associated with the salmon
aquaculture industry consider themselves to be very well informed about IMTA. Industry
and Government stakeholders generally considered themselves to be very well
informed, with lower levels of stated knowledge indicated by ENGOs. When asked to
give their perspectives on whether they thought IMTA was profitable to adopt at present,
results demonstrate that answers varied across stakeholder groups. Industry participants
largely disagree that IMTA is profitable at present. Government stakeholders appear to
0
2
4
6
8
10
12
14
16
Not Informed Not Very Informed
Somewhat Informed
Very Well Informed
Strongly Agree
Agree
Undecided
Disagree
Strongly Disagree
0
1
2
3
4
5
6
7
8
9
Industry Government ENGO
Strongly Agree
Agree
Undecided
Disagree
Strongly Disagree

58
be split, with values ranging from “strongly agree” to “strongly disagree”. 38% (3/8) also
indicated that they were unsure, indicating ongoing uncertainty. Substantial variance
was also present in ENGO responses, which also varied from “disagree” to “strongly
agree”. The following quotes demonstrate participant views on IMTA profitability:
We will monitor IMTA to the point where… it’s clearly profitable and the technology is well enough understood. When it proves itself in a profitable way, then we’ll be in a position to incorporate it within the company. (Participant 2, Industry)
I don’t think there is enough information yet as to whether this is an effective and truly number one hugely profitable business beyond one or the other… Is it as profitable as open net pen? Not in the short term, that’s the biggest stumbling block of convincing the industry to go over. (Participant 16, ENGO)
They would have to really honestly believe that it was having an impact and would it have an impact on for example their bottom line, so you have a big company like that take on that extra burden, it’s not gonna impact your balance statement, your balance sheet – I think that’s where it really boils down to…. someone would have to demonstrate more positively the economic incentives from IMTA. (Participant 3, Industry)
Participants were then asked to rate their level of agreement with the following
profitability factors that influence producers’ adoption decisions: (1) uncertainty about
profitability; (2) profitability assessed and not high enough; (3) switching costs too high at
present; and (4) switching costs will decrease in the future.

59
Figure 9. Profitability factors influencing the adoption decision.
Results indicate that uncertainty regarding profitability is a moderately to very
important consideration for 15/21 respondents. In regard to whether profitability was not
high enough, many participants indicated that they either did consider this to be a
moderately to very important barrier, or that they were unsure. Profitability of adopting a
new technology includes both expected future cash flows and expected immediate and
future costs. Immediate costs of adoption, known as “switching” or “adoption” costs, refer
to hiring skilled labour, upgrading existing employee skills, hiring contractors, developing
new relationships with buyers and sellers, and overall adjusting to a new way of
managing and operating the new system. This difficulty of transition on its own can
provide a significant disincentive to depart from the status quo, especially if the current
operating system is already highly profitable:
This cost saving one is kind of a neat question because there have been economic projections of IMTA that you can make more money with it than conventional monoculture fish farming operations. Published work, right? That I am sure the salmon farming companies are aware of. So they know that adopting IMTA technologies could help them make more money. And yet they are not adopting the technology. And my thought process is that they are already making a crap load of money already with a system they know works and how to do it. (Participant 10, Government)
0
5
10
15
20
25
Uncertainty about
Profitability
Profitability not High Enough
Switching Costs Too High at Present
Switching Costs will Decrease in
Future
Don’t Know
Very Important
Moderately Important
No Importance

60
I’d say, that they are running pretty close with their salmon, and to branch out into something with uncertain profitability, it just wouldn’t, it just doesn’t sound well with their investors. (Participant 13, Government)
The issues I hear from a company like [Name Redacted] for instance, [is] I don’t have the man power to have separate mussel stocking, separate barges, employees to deal with these things, processing, marketing, sales, so this is about labour, lack of managerial expertise…Again its switching cost –if you’re looking at having a stocking crew, having a harvesting crew, having a barging crew – that’s the managerial, but again that’s switching to a different species, these guys know nothing about how to farm mussels. (Participant 6, Industry)
Results further indicate that over half of the respondents indicated that they considered
switching costs to be a moderately to very important reason why companies have not yet
adopted. Interestingly, a third of respondents indicated that they considered switching
costs to be not important in influencing the adoption decision. An in-depth analysis of
these responses suggests that this is due to two related factors: (1) profitability is not
high enough, so therefore the argument over switching costs is mute; and (2) uncertainty
regarding profitability is still too great to make an informed decision.
Two reasons exist to explain the observed uncertainty pertaining to profitability.
The first is simply that comprehensive models have not been run to determine the
economic and financial benefits of adoption, beyond a few preliminary analyses. And the
second is that there exist risk factors that could influence profitability, and that these risk
factors have not been properly assessed. The following quotes provide examples of this
perspective:
My primary expectation as to why it hasn’t been incorporated is that the potential risks to the primary farm stock are just too great… you’d have to grow a shit load of mussels or other additional species to even get towards 1 or 2 % of the cost of the potential profit on the primary fish…does the additional revenue stream make up for the risks that you are placing upon the activity?… And putting that at risk, is certainly going to need a big profit margin I would have thought…There has to be a very compelling reason for them to be doing this type of activity, and the narrative around environmental benefits may be satisfying to marketing, but in terms of the risks posed to the stocks from doing it, no I don’t think, the company would have to be on their own basis. (Participant 8, Government)

61
Results also indicate that almost half of respondents indicated that expectation that
adoption costs might decrease in the future would be a reason for delaying adoption
(known as the arbitrage condition). However, one third believed that it does not have any
importance, due to the more overarching issues presented above.
Finally, participants were asked how much more profitable they thought IMTA
would have to be compared to conventional monoculture production, for producers to
adopt it. There was a wide variance in responses. All agreed that it had to be at least
“more profitable”, with numerical answers ranging from 5-40%. Most also believed that
payback period on investment should be better than, or equal to that of current
monoculture production, but that it should be less than five years. Many participants had
difficulty answering this question, as respondents did not work in the accounting
branches of companies and were not usually the ones responsible for making such
decisions.
A final issue that was identified in the study that pertains to profitability is scale
issues. For IMTA to be profitable, new networks must be developed to sell the products,
agreements must be negotiated with retailers and restaurants, new markets need to be
created or expanded through advertisement, and these need to be supplied on a
continual basis. As such, the producer must be able to deliver a certain quantity of
product on a regular basis to satisfy consumer needs. If the producer is unable to meet
these conditions, due to lack of production capacity for example, retailers or restaurant
owners may not wish to sign contracts. This situation is exemplified by the following
quote:
Yes, and well just economies of scale. [Name Redacted] needs to have enough mussels, it’s too expensive to keep a plant operating. You need to have so many mussels go through it. And their marketing people, they are used to working and selling tons of salmon, truckloads of salmon, year round. They make contracts year round, multi year contracts. And if you only have mussels for a couple months of the year, and hardly a truckload. It’s hard for them to sell them. (Participant 13, Government)

62
5.1.6. Regulatory and Institutional Barriers
The theme “Regulatory and Institutional Barriers” was observed for a total of
18/21 participants across all three stakeholder groups (see Table 7). Frequency of
theme occurrence was 100% for industry participants, and was very high for both
government and ENGO participants, respectively. Participants identified multiple
regulatory and institutional barriers to the development of IMTA. Some are general, and
apply to both IMTA and conventional salmon farms, whereas others are IMTA-specific.
The results of both will be presented here.
Table 7. Occurrence of Theme “Regulatory and Institutional Barriers” by Stakeholder Group
Stakeholder Group Number of Respondents Proportion of Total in Stakeholder Group
Industry 7 100% Government 7 88%
ENGO 5 83%
Many participants expressed serious concerns with the current regulatory and
institutional framework surrounding salmon and shellfish aquaculture in Canada. For
barriers that apply to all salmon farms, including IMTA farms, the main regulatory
barriers raised in the interviews pertained to the following topics: (1) lengthy license
adjudication times; (2) onerous, unpredictable and costly process; (3) regulatory overlap
and duplication; (4) multiple department-specific policies to work with; and (5) lack of
government capacity.
Most participants generally agreed that license processing times were a
significant barrier to obtaining new sites, and therefore to growth and productivity. Many
participants complained that processing times were lengthy, often requiring several
years for a decision to be made on their application. They also noted that the process of
obtaining new licenses was inherently complex, due to the excessive amount of
regulatory burden, and the duplication/overlap caused by the multitude of regulatory
agencies involved in the process. As IMTA involves a greater number of species that
have additional regulatory requirements, this problem becomes magnified. This
perspective is captured by the quote below:

63
Obviously, we’re under about eight or nine government agencies that we have to appease and we have to report up to. It is cumbersome; if they could streamline things it would make managing that many fish farms much easier…each one of those institutions has their own thing that they want to work towards, their own goals or visions. It’s very challenging, there’s no doubt about it…. It [the salmon farm license application] kept going back to the government and then the government had to put their input on it before it was sent to another department. All it had to take was one department to drag their feet and it all stops. And nothing moves ahead after that. (Participant 1, Industry)
A second issue noted by some participants was the difficulty in obtaining license
amendments, including amendments to retrofit sites towards IMTA operations. The time
to obtain license amendments was described as “outrageous” by some participants,
often ranging from two to four years but with reported examples of eight and ten and a
half years, respectively (Personal Communications). This has substantial implications for
sites that are considering retrofitting to IMTA operations, and is exemplified by the quote
below:
I would never get anywhere if I put an application in to expand my boundaries. I would get beat up by every agency out there… if I want to go enlarge my site for kelp and really kelp should be farther away from the farms than what they are today, but I am restricted to my site boundary, to make it better, more profitable, more everything, they should be farther away from the cages. (Participant 1, Industry)
A third issue that was noted by some participants was the onerous monitoring
and reporting requirements demanded by regulatory agencies. Several participants
expressed frustration at the extent of the monitoring and reporting that they had to
undertake, and noted that much less could be required to achieve the same
environmental objectives. It was noted that due to the onerous requirements, producers
often had to hire consulting companies to meet their legal reporting obligations. As IMTA
requires that multiple species be grown in close proximity, an IMTA operation would
have increased reporting requirements, which would translate into higher reporting
costs. As such, onerous reporting requirements currently present a barrier to IMTA
adoption.
Participants identified several other regulatory and institutional barriers that were
considered to be IMTA-specific. These fell into the following categories: existing

64
regulations, existing policies, lack of coordination across jurisdictions, and lack of
capacity. For example, one participant in British Columbia noted that the policy by DFO
to not accept applications for commercial licenses to culture sea cucumbers, red and
green sea urchins, northern abalone, geoducks and bay scallop in British Columbia, was
a significant barrier to adoption. Without these species, this participant observed that it
would be very difficult to incorporate a bottom feeder component into an IMTA operation.
In Newfoundland, it was noted by another participant that the provincial restriction on
commercial multi-species licenses was another problem, as it de facto prohibited IMTA
operations.
On the east coast, another participant noted that the lack of capacity by
government to certify new zones as “safe” for shellfish harvesting meant that farmers
were geographically restricted to certain pre-approved waters, which posed substantial
challenges to farmers seeking new sites. Other participants across the country also
noted that the requirement to process shellfish in federally certified facilities exacerbated
scale issues, making small IMTA operations very difficult to sustain financially.
Finally, many participants noted key institutional issues that created disincentives
to consider adoption. These include the requirement to duplicate research effort on
health effects of IMTA operations across provinces, lack of bottom-feeder species-
specific disease profiles to inform health assessments, insufficient number of
government-funded fish health veterinarians, lack of government support and funding,
and a lack of whole-of-government approach7 to IMTA. These will be discussed in detail
in Chapter 6.
5.1.7. Environmental Concerns
The theme of “Environmental Concerns” specifically pertains to concerns about
the adverse impacts of open net-pen farming on the marine environment. Many 7 The Public Health Agency of Canada defines “whole-of-government approach” as: “public
service agencies working across portfolio boundaries to achieve a shared goal and an integrated government response to particular issues. Approaches can be formal and informal. They can focus on policy development, program management and service delivery.” (PHAC 2013).

65
participants, especially from the ENGO stakeholder group, noted that this was a key
concern, and was the reason why, in their view, the industry had a lack of social license
to operate. For these reasons, some participants argued that the industry should not
focus on IMTA development, but should instead focus on CCA development.
Participants were asked to state their level of agreement on whether they considered
CCA to be more profitable (Figure 10), more environmentally desirable (Figure 11), and
more socially desirable (Figure 12), than IMTA. Results are illustrated below.
Analyzed by stakeholder sub-group, differences in perspectives emerge. ENGOs
tended to favour the idea that CCA was more profitable than IMTA, with most industry
and government participants indicating that they either disagreed or were unsure.
ENGOs also overwhelmingly believed that CCA was more environmentally desirable
than IMTA, with 100% of participants indicating they held this belief. Government
participant answers varied across the spectrum of responses, and most industry
participants either disagreed or were unsure. Both ENGO and government participants
tended to hold the view that CCA was more socially desirable, while industry participants
tended to strongly disagree.

66
Figure 10. Participant perspectives on whether they thought CCA was more
profitable than IMTA.
Figure 11. Participant perspectives on whether they thought CCA was more
environmentally desirable than IMTA.
Figure 12. Participant perspectives on whether they thought CCA was more
socially desirable than IMTA.
0
2
4
6
8
10
Industry Government ENGO
Number of Par.cipants
Strongly Agree Somewhat Agree Don't Know Somewhat Disagree Strongly Disagree
0
2
4
6
8
10
Industry Government ENGO
Number of Par.cipants Strongly Agree
Somewhat Agree
Don’t Know
Somewhat Disagree
Strongly Disagree
0
2
4
6
8
10
Industry Government ENGO
Number of Par.cipants Strongly Agree
Somewhat Agree
Don’t Know
Somewhat Disagree
Strongly Disagree

67
5.2. Incentives for IMTA Development
The analysis conducted in NVivo identified the presence of three key themes that
were considered to be incentives for the adoption of IMTA. These were: (i) Ecological
Benefits; (ii) Eco-certification designations and niche markets; and (iii) Regulatory and
Market-Based Instruments.
5.2.1. Ecological benefits
Several participants expressed the opinion that IMTA had positive environmental
benefits, as it reduced net nutrient discharge to the marine environment. The theme of
“Ecological Benefits” was observed for a total of 10 participants across all three
stakeholder groups (see Table 8). Theme observance was highest for government
participants, followed by industry and ENGO participants, respectively. The low
observed thematic occurrence rate in the ENGO stakeholder group can likely be
explained by their apparent preference for CCA technology.
It was argued that this positive ecological attribute would be a supporting factor in
influencing the adoption decision of farmers. The following quote provides an example of
this perspective:
IMTA has two considerations: the first is that the extra crops are mitigating environmental issues and the second is that you are growing high value crops, which benefit the industry (Participant 11, Government)
When asked about their views on IMTA versus other production technologies,
another participant also expressed the perspective that IMTA’s ecological
benefits were a desirable attribute:
IMTA would definitely be an improvement on plain old open nets, for sure. So yes, it is certainly a step in the right direction. (Participant 21, ENGO)

68
Table 8. Occurrence of Theme “Ecological Benefits” by Participant Group
Stakeholder Group Number of Respondents Proportion of Total in Stakeholder Group
Industry 3 43% Government 4 50%
ENGO 2 33%
5.2.2. Eco-Certification Designations and Niche Markets
The theme of “Eco-Certification Designations and Niche Markets” specifically
refers to the green marketing of IMTA products and the ability to obtain a premium price
for these in the marketplace. Due to the positive environmental attributes of IMTA,
several participants noted that IMTA could be marketed as “green” and “environmentally
friendly”, and therefore obtain a premium price and increase producer profitability. This
theme was observed for a total of 12 participants across all three stakeholder groups
(see Table 9). Theme observance was high for government participants, and moderate
for both industry and ENGO participants.
Table 9. Occurrence of Theme “Eco-Certification Designations and Niche Markets” by Participant Group
Stakeholder Group Number of Respondents Proportion of Total in Stakeholder Group
Industry 3 43% Government 6 75%
ENGO 3 50%
Results illustrated in section 5.1.2 also demonstrate that 5 participants considered IMTA
to be profitable, due to these reasons. This perspective is supported by the quote below:
Public perception and market access for various certification programs. and the seals and approvals from different organizations are definitely impacting the amount of product that can be sold into specific retailers. So that is definitely changing over time. So if it comes to a point where there are certain retailers that say, will only accept products if it is grown in X, Y or Z fashion which includes IMTA, then absolutely people are going to be switching to IMTA (Participant 14, Government).

69
Participants were also asked if they considered a greener image for marketing purposes,
and public pressure, to be two potential factors that could incentivize the adoption of
greener technologies. Figures 13 and 14 illustrate results by stakeholder group,
respectively.
Figure 13. How important do you think the factor “Greener Image for Marketing
Purposes” would be for farmers in making decisions about adopting new environmental/green technologies, now or in the future?
Results indicate that most participants believe that a desire for a greener image for
marketing purposes, and public pressure, are both important factors that influence green
technology adoption. This has important implications for IMTA adoption, which will be
discussed in Chapter 6.
Figure 14. How important do you think the factor “Public Pressure” would be
for farmers in making decisions about adopting new environmental/green technologies, now or in the future?
0
1
2
3
4
5
6
7
8
9
Industry Government ENGO
Number of Par.cipants
Don't Know
Very Important
Moderately Important
No Importance
0 1 2 3 4 5 6 7 8 9
Industry Government ENGO
Number of Par.cipants
Don't Know
Very Important
Moderately Important
No Importance

70
5.2.3. Regulatory and Market-Based Instruments
Several participants noted that a variety of regulatory changes and market-based
instruments could be implemented to incentivize farmers to adopt IMTA. This was
captured by the theme “Regulatory Change and Market-Based Instruments”. As
questions in the interview questionnaire specifically asked participants to state their level
of agreement with specific hypothetical regulatory changes and market-based instrument
policies, this code was present in all participant interviews.
Participants were initially asked to state their level of agreement with the
following general policies, which would be theoretically applied to the current status quo.
The policies were: (1) Create stricter on-site environmental regulations for the salmon
farming industry (“ENV_REG”); (2) Allow salmon farming companies to develop more
stringent voluntary environmental guidelines (“VOLUN_GUID”); (3) Hold salmon farming
companies financially responsible for their environmental impacts using green taxes or
similar measures (“POLLUTER_PAY”); (4) Fund research to develop greener
technologies that improve salmon farming’s environmental performance (“RESEARCH”);
and (5) Provide financial incentives to salmon farming companies to adopt greener
technologies that improve their environmental performance (“FINANC_INCENT”). Figure
15 below illustrates the percentage of respondents that expressed tentative support for
each policy, disaggregated by stakeholder group. Many participants noted that their
responses to these questions were tentative, as these policy options are broad and lack
specific details. Results indicate that additional R&D funding, and financial incentives,
are the most preferred broad policy options, with ENGO participants indicating a
preference for stricter environmental regulations and environmental taxes, and industry
participants indicating a preference for industry proposed environmental guidelines.

71
Figure 15. Support for general policies by stakeholder group
In order to understand participant perspectives on specific financial incentives,
participants were then asked to indicate how important the following specific policies
would be to incentivize producers to adopt IMTA. The policies were: (1) New site
licenses granted only if IMTA used (“LICEN_IMTA”); (2) Direct government subsidies to
reduce investment costs of IMTA (“SUBSIDY”); (3) Government technical assistance
and knowledge transfer (“TECH_KNOW_TRANSFER”); (4) Additional Research &
Development tax credits for IMTA development and implementation (“R&D TAX
CREDITS”); (5) Corporate tax credits tied to IMTA production
(“CORPORATE_TAX_CR”); (6) Nutrient tax on salmon feed, with partial rebates to IMTA
operations (i.e. nutrient credits) (“NUTR_TAX_FEED”); (7) Uniform nutrient tax instituted
on salmon production, with IMTA taxed less (“NUTR_TAX_OUTPUT”); and (8) hybrid
tax/subsidy program, where taxes on nutrients are combined with subsidies for
investments in IMTA (“NUTR_TAX_SUBS”). As some of these policies are somewhat
complex, they will be elaborated upon further. Policy #5 specifically refers to the
producer obtaining corporate tax credits for engaging in IMTA production. Policy #6
refers to the producer obtaining a partial rebate on the nutrient tax levied on salmon
0%
20%
40%
60%
80%
100%
% support
Industry
Government
ENGO
72
feed, if IMTA is used. Policy #7 refers to IMTA producers being charged a lower
marginal tax rate on actual salmon production (performance) than monoculture
producers. Finally, policy #8 refers to an integrated tax/subsidy program where a part of
the revenue earned from the tax is recycled into an investment subsidy for IMTA.
Results of participant responses are illustrated in Figures 16, 17 and 18 below.
Figure 16. Industry stakeholder perspectives on specific policies
0
1
2
3
4
5
6
7
8
Don't Know
Very Important
Moderately Important
No Importance

73
Figure 17. Government stakeholder perspectives on specific policies
Figure 18. ENGO stakeholder perspectives on specific policies
Results indicate that industry participants consider technology transfer, subsidies and
IMTA-only licenses as the most important incentives for IMTA adoption. Government
0
1
2
3
4
5
6
7
8
9
Don't Know
Very Important
Moderately Important
No Importance
0
1
2
3
4
5
6
7
Don't Know
Very Important
Moderately Important
No Importance
74
participants also agreed that a policy of IMTA-only licenses would be a strong incentive,
and were generally in agreement that most financial policies proposed would provide an
incentivizing effect. ENGOs considered IMTA-only licenses, technology transfer, R&D
tax credits and corporate tax credits as most important, also recognizing that most
policies would provide an incentivizing effect. An analysis and discussion of these results
will be presented in Chapter 6, Discussion.

75
Chapter 6. Discussion
Chapter 6 will provide a critical analysis of the results presented in Chapter 5.
This section will be organized similarly to the previous section, with a discussion of each
theme individually. Links to the literature and my initial hypotheses will be made. Policy
implications will be presented in Chapter 7, and conclusions in chapter 8.
6.1. Biological Uncertainty
Chapter 5 noted that uncertainty pertaining to biological feasibility of current
IMTA systems is a key concern for government and ENGO participants. The concerns
expressed are twofold. First is that current configurations of shellfish and kelp
components do not mitigate a significant amount of nutrient effluent from the salmon net-
pens. And second, for significant mitigation to occur, a tremendous increase in marine
plant cultivation would be required, which may adversely affect the health of the salmon
crop.
The theme of biological uncertainty was coded to 86% of government participant
interviews, and 43% of ENGO participant interviews. Interestingly, this theme was only
coded to 14% of industry participant interviews. These results suggest that nutrient
mitigation effectiveness is likely of much greater concern to regulatory agencies and
ENGOs, than it is for industry groups. Thus, government and ENGO groups may be
more focused on IMTA’s nutrient mitigation effectiveness, while industry groups are
more focused on technical feasibility and profitability concerns. This makes sense, as it
demonstrates private versus public/social perspectives on a given externality.
IMTA could theoretically be marketed as a more sustainable, green technology
that is more desirable from a social and environmental perspective than conventional
open-net pen aquaculture, specifically because it has the potential to reduce some of the

76
potential adverse impacts of farming to the marine environment. IMTA also has
economic benefits, as the additional species are relatively inexpensive to raise once the
infrastructure is in place (extractive species do not require feed inputs), and can be sold
into premium markets (sea cucumbers are a delicacy in many countries) and niche
markets (seeking greener attributes) for additional profits. Studies have already
demonstrated the willingness of the public to pay a premium price for IMTA products
based on its positive environmental attributes (Irwin 2015, Yip 2012, Kitchen 2011,
Barrington et al. 2010). However, results from this study suggest that there is substantial
uncertainty as to whether current IMTA configurations actually do mitigate net nutrient
discharge to the marine environment, and in what quantities. This has important
implications for promoters of IMTA, as regulatory agencies may be unlikely to strongly
support the commercialization of this technology and implement regulatory and/or
market-based incentives for its adoption, until this is demonstratively proven. Certain
ENGOs and by extension broader members of the public, may not fully support and
therefore either lend their political support or be willing to pay more for the product,
preferring instead to support competing technologies such as CCA (section 6.7).
Similarly, farmers may not be willing to invest in a supposedly “green” technology if there
is uncertainty as to its actual environmental benefits, or if there is uncertainty pertaining
to the premium price that it might be able to obtain as a result of these green attributes.
Therefore, the results of this study suggest that more scientific evidence is needed to
objectively demonstrate and quantify the nutrient uptake capabilities of the shellfish and
marine plant components.8 From a biological feasibility perspective, ongoing uncertainty
is a major barrier to IMTA adoption.
6.2. Technical Uncertainty
Results presented in Chapter 5 demonstrated that uncertainty with regard to
IMTA’s technical feasibility is a significant barrier to adoption. This theme was coded to
18/21 participant interviews, indicating that most participants across all three stakeholder
8 Indeed, this is the stated aim of the Canadian IMTA Network program funded by the Natural
Sciences and Engineering Research Council of Canada.

77
groups consider this to be an issue. The frequency of this theme (as a proportion of total
respondents) was also similar across stakeholder groups, ranging from 75-88% of total
respondents. As presented in Chapter 5, the majority of respondents indicated that they
considered this to be a moderately to very important barrier.
Certain respondents appear to be concerned regarding the feasibility of
successfully integrating deposit-feeder species into a commercial IMTA operation, due to
the inherent complexities of culturing these species. As deposit-feeders have the
potential to uptake a significant proportion of nutrient effluent that sinks directly from
salmon net-pens to the sea floor, their integration into IMTA systems may be key to
realizing its purported environmental benefits. The data suggests that commercial
production methods are not yet available, or if they are, that respondents are not aware
of them. As such, resolving this technical issue, while ensuring no adverse health effects
to any species in the operation occur, will be a critical step towards providing greater
technical certainty to producers.
Participants also expressed concern regarding the ability for salmon farmers to
integrate a multi-species operation into their existing monoculture operations. Results
suggest that currently, IMTA’s technical feasibility has not been conclusively
demonstrated to the point where potential adopters would consider investing in it.
Whether or not this is actually the case is an issue for debate; however, this perception
will continue to hinder adoption.
IMTA systems are by nature much more complex than monoculture operations.
Potential adopters would be required to learn how to farm these additional species, and
develop the skills to do so efficiently and effectively in an integrated operation. This
would require significant investment in new infrastructure and methods of production. It
would require hiring new skilled labor, and developing relationships with new suppliers
and retailers. It would also require dealing with new regulatory and institutional
frameworks, which would have their own data monitoring requirements and species-
specific regulations. These “learning” and “switching” costs, provide a significant hurdle
to investment. As will be discussed in Chapter 6.5 (Profitability), the Real Options

78
Approach argues that the value of the new technology needs to be at least greater than
this “hurdle” rate of investment (Dixit & Pyndick 1994).
Therefore, results suggest that technical uncertainty remains a critical barrier to
IMTA adoption. Even if this barrier is overcome, other issues such as opportunity cost of
investment and profitability will play key considerations.
6.3. Regulatory Uncertainty
Results presented in Chapter 5 provide evidence that regulatory uncertainty was
a significant barrier to the adoption of IMTA. This theme was coded to 10/21 interviews,
including 86% of industry participant interviews. The variation in theme occurrence
across groups suggests that this is perceived as more of an issue for industry than it is
for government or ENGO participants. Indeed, only 38% of government participants and
17% of ENGO participants noted this as an issue. These results are likely representative
of fundamental differences in perspectives, with industry profitability and investment
being directly affected by regulatory and institutional changes and uncertainty associated
with it.
New regulatory frameworks are currently being developed in British Columbia
and Nova Scotia, largely as a response to industry concerns, environmental concerns,
public pressure and recent legislative and institutional changes. In British Columbia, for
example, the decision by Justice Hinkson in 2010 to transfer jurisdiction of finfish and
shellfish aquaculture management to the federal government has ushered in a period of
regulatory change and uncertainty. With respect to IMTA, marine plants still fall under
the jurisdiction of the province in British Columbia, adding an additional regulatory layer
for potential IMTA producers. Regulatory changes in both provinces have been occurring
slowly, over a period of several years. In certain regions, formal and informal
moratoriums are currently in place. As such, regulatory agencies will not accept license
applications for new sites. This acts as a disincentive for companies to invest and grow.
Furthermore, if companies are unable to secure new sites, logic suggests that they will
likely be less willing to adopt risky and untested technologies at existing sites, as this
action could compromise their overall cash flows.

79
Second, uncertainty regarding future environmental regulations, and the
knowledge that existing ones are likely to change in some way in the near future, acts as
an incentive for companies to delay investment and production decisions until the
situation becomes clearer. From a producer perspective, if environmental regulations are
likely to change in the near future, why adopt a “green” technology such as IMTA today if
it may not abide by the future regulation? From a Real Options Approach, the
opportunity cost of delaying investment and adoption far outweighs any benefit of
adopting today.
Notwithstanding the above, it must be recognized that all regulatory landscapes
change. Policies are developed and laws are passed, in reaction to the ever-changing
political and socio-economic landscape, as well as in response to new public concerns
and to new evidence brought forth by science. The aquaculture industry in Canada is
very new, and requires a modernized framework. As such, it is only natural that it is
currently changing. However, until it settles and becomes clear, investment decisions will
likely continue to be affected, and therefore this will continue to act as a barrier to the
adoption of IMTA on a commercial scale.
The other regulatory uncertainty issue that was identified in the data was
uncertainty regarding land use policy. This issue is especially acute in British Columbia,
where land claims by Aboriginal groups have been filed for most land in the province.
The evolving relationship between the Crown and Aboriginal groups now affirms that the
Crown has a legal duty to consult and where appropriate, accommodate, Aboriginal
groups if it contemplates an activity (i.e. issuing a permit, license or authorization) that
may result in actions that adversely impact their asserted or established Aboriginal or
Treaty rights. This includes asserted, established or Treaty rights to fish and harvest
resources in marine areas, including those where salmon farms are located. As
government departments and agencies adapt their policies in response to recent court
cases (many of which are still pending), decision-making regarding land use activities
(including marine sites) can be affected. Most land in British Columbia has not been
ceded and rights and title over these areas has been asserted by various Aboriginal
groups. Many groups are currently either in negotiations with the Crown, or in litigation in
Court, over rights and title to the land and its natural resources. Whereas the Crown has
80
begun addressing issues of rights and title on land, it has not yet addressed the question
of title over marine waters. As such, tremendous uncertainty exists in regard to the land
question, and this permeates into uncertainty for salmon farmers when they seek to
obtain or renew site and tenure licenses.
Therefore, regulatory uncertainty is considered to be a key barrier to the adoption
of IMTA.
6.4. Fish Health
Results presented in Chapter 5 demonstrated that the theme of “Fish Health
Uncertainty” was raised by a number of participants, including most industry participants.
This is indicative of the fact that industry is extremely concerned about potential adverse
effects occurring to their primary crop, salmon. Salmon is the focus of the farmers’
business, and it generates the majority of their revenue. From their perspective, adopting
IMTA is a means to reduce impacts from farming salmon, while still farming salmon.
Therefore, any uncertainty with regard to their continued ability to grow healthy salmon
will be met with extreme caution.
Recent work, as discussed in Chapter 3, has demonstrated that culturing
shellfish in close proximity to salmon farms would not lead to adverse effects to farmed
fish health (Cross 2004). This research was quintessential in obtaining regulatory
approval to begin in-situ Research & Development and pre-commercial IMTA
operations. However, as my results demonstrate, more research needs to be conducted
on the potential for bottom feeders and seaweeds to act as reservoirs for disease. Fish
health concerns are paramount to salmon farmers, because a disease outbreak can lead
to widespread mortality of their crop, and therefore result in significant monetary losses.
Until research demonstrating that marine plants and bottom-feeders will not negatively
affect fish health, or that the co-culture of these organisms will not affect the biophysical
and biochemical conditions on which the salmon rely on for their continued health, both
governments and producers are likely to resist the further adoption of IMTA.

81
It is interesting to note that this theme was not coded to any ENGO participants. I
hypothesize that this is likely because their concerns lie with disease transmission to
wild fish stocks. I also observed a low thematic occurrence rate for government
participants, but I credit this to the fact that I did not interview fish health veterinarians,
who are the representatives from government who would have the authority to speak to
this. This represents a limitation to the study.
6.5. Profitability
Results presented in Chapter 5 indicated that the theme of profitability
uncertainty was coded to all participant interviews. This demonstrates the crucial
importance of this theme in influencing the adoption decision. Most participants
interviewed were very knowledgeable of IMTA, and yet thought that it would not be
profitable to adopt at present. This demonstrates that lack of information amongst key
stakeholders regarding the existence of the technology is likely not an important
explanatory factor to explain the lack of adoption to date. Therefore, and as supported
by my literature review, learning effects as presented in the Mansfield Model probably
only play a minor role in supporting the diffusion of IMTA in the industry. As noted in the
Battisti Model and the Real Options Approach frameworks reviewed in Chapter 1,
profitability is an important explanatory factor influencing the adoption decision. My
findings concur. The majority of industry respondents (71%) considered IMTA to be not
profitable at the current time, with the remainder being undecided. Whereas authors
such as Ridler et al. (2007), Whitmarsh et al. (2006), Neori (2008) and Troell et al.
(1997) have demonstrated IMTA’s tentative profitability through theoretical modelling
exercises, it is interesting to note that none of the industry respondents considered it to
be profitable to adopt at present. This is likely due to the following factors: substantial
uncertainty in regard to IMTA as a production technology, existing and future regulations
and policy, and an unwillingness (due in part to a lack of incentives) to shift away from a
production system that is certain, predictable and highly profitable. The profitability issue
is a critical barrier that must be overcome if IMTA adoption is to occur.
Many government participants also indicated that they were undecided.
Interestingly, 25% (2/8) of government respondents and 50% (3/6) of ENGO
82
respondents indicated that they considered IMTA to be profitable, largely because they
believed producers could obtain a premium price for their products, and that this should
make IMTA profitable. Such stark differences from industry perspectives could also
indicate a disconnect between beliefs grounded in theories, models or literature, and
beliefs grounded in empirical observation and lived experience, respectively.
Regardless, these results suggest that there is significant uncertainty surrounding
profitability of IMTA as a technology among interviewed stakeholders, and that most
participants do not believe it to be profitable at present.
Results also suggest that lack of experience was a significant explanatory
variable in affecting the adoption decision (76% of total respondents). As lack of
experience generally translates into lower producer efficiency and therefore higher
operating costs, adoption of IMTA would likely involve high and immediate learning
costs. Switching costs, and the expectation that these might decrease in the future, were
other considerations that were found to influence the adoption decision.
This study also found that scale issues as they pertain to profitability were quite
important. As concluded by Kitchen (2011), in order to make an IMTA operation
profitable, a producer will have to produce enough product to meet supplier
requirements on a continual basis. Therefore, the producer will be required to produce
enough shellfish to operate a shellfish processing plant year round, and it will be
required to produce enough IMTA-branded products to keep restaurants and buyers
interested in buying these products from them and not a competitor. As such, it appears
as though a company cannot just invest minimally in a commercial IMTA operation if it is
to succeed long-term.
Overall, not enough conclusive empirical evidence exists to demonstrate IMTA’s
attractiveness as a technology from a financial perspective, incorporating the risk factors
noted above. Several studies are underway in Canada by the Canadian IMTA Network
and its partners at both experimental and pre-commercial scales to develop and refine
the technology. Additional work is also being conducted in numerous other countries
around the world. However, until it has been shown that IMTA generates a substantial
increase in profit for companies, either due to increased sales from the additional

83
species, from the penetration of new niche markets, or as a response to regulatory
change, producers will be unlikely to want to invest significantly in IMTA. Therefore,
uncertainty regarding profitability is a major barrier to the adoption of IMTA.
6.6. Regulatory and Institutional Barriers
As noted in Chapter 3, studies have demonstrated that there exist several regulatory
and institutional barriers to the growth of the salmon aquaculture industry in Canada
(CAIA 2013; RIAS 2011). Logic would dictate that if these barriers in general negatively
influenced the production and investment decisions of producers, then many of these
barriers should also act to negatively influence the decision of these producers to invest
in new “commercially unproven” technologies such as IMTA. One such example of a
barrier to both the growth of the industry in general, and the adoption of IMTA, is
ongoing moratoriums on new site licenses, such as was the case in Nova Scotia in
2015, and currently still is the case in British Columbia on the North Coast and in the
Discovery Islands region. Results presented in Chapter 5 indicated that the majority of
participants considered that there exist regulatory and institutional barriers to the
development of IMTA. As noted there, my analysis found that these regulatory barriers
fall into the following five sub-categories: (1) lengthy license adjudication times; (2)
onerous, unpredictable and costly process; (3) regulatory overlap and duplication; (4)
multiple department-specific policies and procedures; and (5) lack of government
capacity.
Lengthy and uncertain license processing times provides uncertainty to
applicants, as they cannot predict how long an application would take for review. A lack
of predictability reduces business certainty and confidence, and may adversely affect
investment decisions. As salmon farmers operate on a biological cycle, bureaucratic
delays can result in missed “biological windows” to stock fish. This issue is especially
serious in New Brunswick, for example, where farmed salmon production operates
according to Bay Management Area production schedules that are organized according
to three-year rotation cycles. A missed stocking opportunity there could lead to a three-
year delay, resulting in significant productivity and profit losses. Such situations can also

84
result in producers being unable to supply markets, and as discussed earlier, lose out on
important contracting opportunities for IMTA products.
Some participants also noted that to maximize ecological and technical
efficiencies, IMTA operations often require more space than that provided by standard
monoculture salmon site tenures. Therefore, an inability to obtain boundary
amendments, or a perceived inability or even unwillingness to apply due to the difficulty
and time required to obtain it, is a significant barrier to IMTA adoption. Again, if IMTA is
to be adopted, it needs to be able to realize its purported environmental benefits. If site
tenures cannot be amended easily to make IMTA production as efficient as possible,
producers may not be willing to consider adopting it. This situation is especially serious
in areas where there is very limited capacity for new salmon farms, such as in New
Brunswick and parts of British Columbia, for example, and is probably an important
reason for IMTA’s inability to “take off”.
Furthermore, some participants complained that a processing delay by one
regulatory authority, for whatever reason, could potentially delay the entire application
review process, as each subsequent department then has to readjust their review
schedules. Therefore, interview data suggests that significant effort and time has to be
invested to obtain a site license, and that the process is uncertain. As many participants
have indicated ongoing uncertainties with the feasibility of IMTA, it would not be
unreasonable to expect an even more lengthy and unpredictable process to obtain
approvals for an IMTA operation. As such, reducing regulatory burden and implementing
streamlined authorization processes would help to remove this barrier to IMTA adoption.
As presented in the Results section, some participants (mainly industry)
considered reporting and monitoring requirements to also be a barrier to adoption, and
noted that there may be some room to reduce these requirements while still meeting
stringent environmental objectives. While this paper does not seek to pass judgment on
this issue, it does however conclude that additional monitoring and reporting
requirements for additional species in an IMTA operation would serve to exacerbate this
situation. I also note that as some producers complained about the cost of these data

85
reporting requirements, they may be unwilling to increase this cost even further if they
were to adopt IMTA.
The analysis found a series of additional IMTA-specific barriers within the
excerpts coded to the theme “Regulatory and Institutional Barriers”. As presented in
Chapter 5, these present themselves as an additional challenge that a company must
address in order to obtain approval for an IMTA operation. Cumulatively, I conclude that
they act as a significant disincentive for adoption.
For example, at the time of research (2014), some participants indicated that
DFO was not accepting applications under the Pacific Aquaculture Regulations to culture
sea cucumbers, red and green sea urchins, northern abalone, and bay scallops, as well
as in certain cases geoducks (Personal Communication). Whereas at the time of
publication this policy appears to have been lifted, such a restriction would have made it
very difficult for potential IMTA adopters to incorporate these bottom-feeder species into
their operations, and therefore to achieve the true ecological benefits of IMTA. As
emerging research suggests that bottom-feeders may become a critical component of
IMTA systems, the inability to obtain licenses to culture these species would have
presented itself as a significant barrier to IMTA adoption.
Another identified barrier is the alleged lack of government capacity in certain
regions to certify new zones as “safe” for shellfish harvesting. As all shellfish sold must
legally originate from these zones, potential adopters seeking to add a shellfish
component to their operations are geographically restricted to existing certified zones.
This has very important implications for prospective adopters, because until this situation
changes, all non-certified waters are de facto eliminated as potential locations for IMTA
sites. Somewhat similarly, a third identified barrier is the requirement to process all
shellfish in federally certified facilities. As argued in this paper and as shown by Kitchen
(2011), this requirement as it pertains to IMTA leads to issues of scale and production
ability.
The analysis also uncovered that duplication of research effort across
jurisdictions was considered by some to be a significant barrier to adoption. For
example, it was noted by some participants that Cooke Aquaculture had difficulty

86
obtaining approvals to adopt IMTA in Nova Scotia, as provincial regulators did not
consider the years of research the company conducted in New Brunswick as applicable
to Nova Scotia. Indeed, one participant noted that regulatory authorities in Nova Scotia
required the company to collect several years of data in Nova Scotian waters, on the
effects of therapeutants, chemical tests, coliforms, etc., before applications for IMTA
would be considered. A second example of the presence of this barrier was provided by
another participant, who similarly noted that the regulatory agencies he dealt with
required area-specific supporting research demonstrating that cultured shellfish would
not undermine traditional wild clam beds, even though this research had conclusively
demonstrated this elsewhere. These two examples demonstrate that the unwillingness
to accept research conducted in other jurisdictions poses a significant barrier to the
adoption of IMTA by farmers, as companies will likely not wish to spend significant
additional resources to collect this data over several years, simply to have authorities
finally agree to accept an application for review.
Some participants also noted that the unavailability of full disease profiles for
bottom feeder species in an IMTA-like setting was a barrier to adoption. For example, it
was noted that in order to obtain approval to co-culture species in close proximity, CFIA
and other regulatory agencies must be satisfied that no adverse health effects would
occur to any of the cultured species. Therefore, they require that a complete disease
profile be conducted, with the potential for any cross-over diseases to be thoroughly
assessed. With regard to IMTA, interviews revealed that this information currently does
not exist for many potential bottom-feeder species. Therefore, a producer wishing to
incorporate a bottom-feeder component into an IMTA operation would have to develop
and implement a research plan to investigate these issues to support his license
application. Whereas conducting this research thoroughly is in everyone’s best interest
to ensure food safety, current lack of information on this topic is a barrier to the
incorporation of bottom feeder species into an IMTA operation.
Another barrier noted by some participants was the perceived insufficient number
of fish health veterinarians in certain jurisdictions. It was argued by these participants
that due to budget cuts and staff reductions, fish health veterinarians are in many cases
stretched to capacity and do not have the resources to add additional farms to their

87
workloads, especially IMTA farms that have more complex requirements. This was noted
to be a problem in Nova Scotia. Due to this lack of capacity, and the inherent
complexities and uncertainties with IMTA systems as potentially being hosts to parasites
and pathogens, it was noted that certain provincial fish health veterinarians are at the
present time unwilling to consider working with IMTA facilities.
The analysis also revealed that the current prohibition on commercial multi-
species licenses in Newfoundland and Labrador is a barrier to IMTA development in that
province. The examples presented above suggest that numerous regulatory and
institutional barriers exist to hinder the development of IMTA in Canada. What appears
to be missing is a lack of whole-of-government approach to IMTA, with a focused vision
and coordinated by all relevant federal and provincial regulatory agencies, to help
remove these barriers where appropriate. Policy Recommendations will be discussed in
Chapter 7.
6.7. Environmental Concerns
Public opposition to salmon aquaculture operations largely originates from
concerns over the potential for adverse environmental effects to occur. As discussed in
Chapter 3, several potential effects can occur, depending on siting, local environmental
conditions, farm management and production capacity. Whereas IMTA has the potential
to address the concern for nutrient loading and benthic impacts, it does not address the
primary concern of parasite and pathogen transfer to wild stocks. CCA is an alternative
“green” production technology that is vastly different in concept than IMTA, but that
competes with it in the market for green and sustainable aquaculture products. As such,
environmental concerns associated with net-pen operations (including IMTA) are a
barrier, in the sense that support (political, economic, etc.) would go to CCA instead.
Results presented in Chapter 5 demonstrate that the majority of participants
considered IMTA to be more profitable than CCA. Government and industry participants
generally considered IMTA to be more environmentally friendly than CCA, although all
ENGO participants considered the opposite to be true. Most ENGO and government
participants considered CCA to be more socially desirable, while the opposite was found
88
to be true for industry. Overall, there appeared to still be a lot of uncertainty with respect
to both these technologies, as represented by the amount of “Don’t Know” responses.
These results suggest that significant differences in perspectives exist between groups.
These differences will manifest themselves in a variety of different ways, including in the
choice of the technology adopted by firms, in the policies and incentives (if any) that
government authorities choose to implement to support the diffusion of a technology,
and in political pressure and lobbying.
Current research suggests that CCA has certain advantages over IMTA, such as
reduced business risk and reduced environmental impacts. Nevertheless, uncertainty
remains with regard to its environmental impacts, as CCA facilities require large
amounts of electricity and water for its operations (POC 2013b). Uncertainty also exists
with respect to CCA’s economic feasibility, as costs are much greater for CCA facilities
than for IMTA or conventional salmon operations. As salmon is a global commodity, it
may be very difficult for CCA salmon to compete in the global market. Nevertheless,
CCA may be better able to compete with IMTA in premium niche markets. To save on
costs, CCA operators may want to site their facilities in locations that minimize energy,
transportation, water and land costs. This may result in significant adverse socio-
economic impacts, as facilities move away from coastal areas and closer to urban
centres to be more competitive and closer to markets (POC 2013b). Additional research
in the next few years should help clarify outstanding questions pertaining to CCA, and
therefore its relative desirability with IMTA.
Therefore from a profitability perspective, given the results presented here,
producers are unlikely to adopt CCA over IMTA at the present time. The key to which
technology may eventually win greater support from government will be influenced by a
combination of ecological, social, and economic considerations. In the meantime, results
suggest that industry strongly prefers IMTA over CCA as a method of aquaculture
production.

89
6.8. Ecological Benefits
With regard to the theme “Ecological Benefits”, my results have demonstrated
that IMTA’s purported environmental benefits are arguably the main reason for the
desire to support R&D to further investigate the feasibility of commercial IMTA farms. By
potentially reducing net nutrient discharge to the marine environment, it is argued that
IMTA-farms have a comparatively smaller ecological footprint than their conventional
counterparts. As such, this “green” attribute presents itself as a key driving force for
IMTA development in Canada. For these reasons, Canadian researchers have been and
continue to investigate various biological, biochemical, fish health, technical,
engineering, and socio-economic issues associated with IMTA. Given the uncertainty
associated with the nutrient mitigation effectiveness of shellfish and marine plants,
bottom-feeder species may hold the greatest promise for the realization of IMTA’s
ecological benefits. As such, the potential ability of IMTA to mitigate some of the adverse
environmental impacts of conventional salmon farming provides a key incentive to its
adoption.
6.9. Eco Certification Designations and Niche Markets
As noted in the results chapter, some participants noted that eco-certification
designations and the ability to penetrate high-value niche markets could provide strong
profit incentives for producers to adopt IMTA. By distinguishing IMTA products as
separate from conventionally grown salmon, and by marketing them with attributes such
as “environmentally friendly”, “green”, “organic”, “sustainable” and “traceable”, for
example, it was argued that producers could be able to obtain a higher price per pound
for salmon and shellfish, and perhaps even for bottom-feeder species and marine plants.
Experience on the east coast has demonstrated that Cooke Aquaculture has been able
to sell its IMTA-raised salmon and shellfish at a premium price in grocery stores and
restaurants in both Canada and the United States, through successful marketing. On the
west coast, Kyuquot SEAfoods has also demonstrated the ability to obtain a premium
price for IMTA products through marketing. Therefore, the ability to market IMTA
products as green and more sustainable, and the ability to penetrate and/or create niche
markets, is a significant incentive to the adoption of IMTA.

90
Eco-certification designations serve to independently validate the marketed
product and provide customers with the confidence that the product they are consuming
meets a set of rigorous standards. Whereas obtaining such designations may also
provide some benefits to producers, no IMTA-specific designations have yet been
developed. Many eco-certification designations for seafood products already exist, and it
may be costly and difficult to develop an entirely new designation for IMTA and then
explain to consumers what this means and why they should pay more for it. Therefore,
whereas such designations could be helpful, they may not necessarily contribute
substantially in providing incentives for adoption, given the current context and the
success of marketing strategies.
Additionally, IMTA products have been observed to have measurable differences
in certain key attributes. For example, one participant expressed that IMTA-raised
mussels have a different taste, appearance and consistency than conventionally raised
mussels. For example, IMTA-raised mussels were found to have meat yields in
exceedance of 50%, whereas conventionally raised mussels had average meat contents
of 20-27% (Personal Communication). This participant also noted that customers found
these mussels to be “juicier” and “tastier”, and that these were highly valued attributes.
As such, and as concluded by various authors, there is significant market demand for
premium-priced IMTA-based products (Kitchen 2011, Yip 2013; Irwin 2015). Additionally,
seaweed products could be processed and sold for use in the cosmetic industry, and
shellfish, bottom feeder and salmon products could be packaged and marketed in a
number of novel ways. Whereas initial switching costs may be high in the short-term, the
case has been argued for higher long-term profitability (Ridler et al. 2007). Therefore,
the potential for niche market opportunities and high profits is substantial, and this
should be a significant incentive for adoption.
6.10. Regulatory and Market-Based Instruments
In order to reduce the uncertainty associated with biological feasibility, technical
uncertainty, and fish health issues, and to build a greater customer demand for IMTA
products, continued education of farmers, industry associations, government
departments and the public on IMTA and its benefits will be required. By reducing

91
uncertainty, the perceived risk of adopting IMTA will be reduced, and thus the perceived
opportunity cost of adoption. As argued by the Real Options Approach (Dixit & Pindyck
1994), reducing this perceived or real risk will reduce the hurdle rate required to find the
technology attractive and/or profitable from a producer perspective. Furthermore, as
argued by Battisti (2007), profitability considerations and uncertainty are two key
explanatory variables of adoption. As my results have demonstrated that most
participants consider IMTA to be unprofitable and uncertain at the present time, much
evidence exists to support the Battisti Model of technology adoption in this study.
Therefore, additional regulatory, policy and market based incentives could be utilized to
address these issues.
Once established, a modernized, clear and certain regulatory framework should
help address numerous barriers noted throughout this study, and help restore industry
confidence in the regulatory process. Legislative timelines for license reviews and
amendments, for example, could reduce regulatory uncertainty and should therefore
make conditions more suitable for growth and investment, which IMTA requires. Many
participants, especially ENGO participants, noted that increased auditing, compliance
and enforcement of the industry would be required as a pre-condition for the industry to
obtain the social license to operate. Therefore, additional funding to increase capacity of
regulatory agencies to conduct independent monitoring, and/or to verify and audit
industry-reported data, will increase transparency and may perhaps help alleviate public
concerns. This would be a positive development for salmon farmers who seek new sites
to adopt IMTA-based salmon production. An increased capacity for regulatory agencies
to classify new waters as safe for shellfish harvesting, or for fish health veterinarians to
add new farms to their portfolios, for example, should also act as a substantial incentive
for IMTA development. If the latter is not possible, implementing cost recovery
regulations could help address this capacity issue.
Some participants also noted that requiring salmon farmers to post a
performance bond as a pre-condition for license approval would also help alleviate some
public concerns regarding salmon farms, including new IMTA-based salmon farms.
Posting performance bonds to obtain site licenses would ensure that the “polluter-pays”
principle is respected, and that companies that polluted the marine environment would

92
be held accountable if they failed to remediate the site after operations ceased (Faure &
Wibisana 2013). As IMTA farms have the potential to reduce net nutrient discharge to
the marine environment, lower bond prices for IMTA farms could provide a further
incentive for adoption. Performance bonds were one of many regulatory changes that
were being considered in Nova Scotia in 2015, and was argued to help address issues
of public confidence and social license to operate. Mandatory performance bonds could
also incentivize producers to look at other process technologies that inherently reduce
on-site impacts, such as IMTA.
Finally, providing incentives to internalize environmental externalities would
provide a significant incentive for IMTA adoption. Many participants noted that due to the
fact that negative environmental externalities resulting from salmon aquaculture were
neither assigned a financial value, nor internalized into the cost of production, that the
status quo would remain the preferred option of industry. Therefore, it was argued that
internalizing these externalities into the cost of production through regulation would
make it much more expensive for producers to operate using conventional methods, and
would therefore help incentivize alternative technologies such as IMTA.
As shown in my literature review, green technologies have often diffused with the
assistance of government incentives, both regulatory and market-based. No IMTA-
specific market-based instruments currently exist, other than R&D funding and
knowledge transfer. No regulatory incentives exist either, to increase the attractiveness
from a profitability perspective to invest in IMTA operations over the status quo. As the
primary push from adoption comes from a social benefit perspective, and not a cost
savings perspective, salmon farming companies will most likely need to be incentivized
to adopt IMTA. This is especially the case as current production technologies are highly
profitable9, and operations and management systems are well understood, refined,
predictable and efficient. Until incentives are developed to increase the attractiveness of
IMTA from a profitability perspective, it is unlikely that producers will adopt on their own.
9 An economic feasibility study by DFO concluded that a new open-net pen salmon farm with a
production capacity of 2,500 tonnes/annum would require a $5 million initial capital investment, but would generate an annual rate of return of 40.3% (POC 2013b).
93
Participants were asked to state their level of support for five broad policy
categories: stricter on-site environmental regulations, industry-based voluntary
environmental guidelines, green taxes (i.e. nutrient taxes), funding for further research,
and financial incentives for adoption. Results demonstrate that providing financial
incentives to companies to adopt greener technologies, and funding more research to
develop green technologies, are most supported by respondents. Indeed, 88.2% of
respondents (15 participants) indicated that they both supported financial incentives and
further research into green technologies as policy tools. A higher degree of variance was
observed for the proposed stricter environmental regulations, voluntary environmental
guidelines, and green taxes policies. Analysis of interview text suggests that this is due
to two reasons: (1) differences in stakeholder perspectives, and (2) lack of clarity of
details of the policy. Participants noted that it was difficult or impossible for them to
specifically state their level of support with these “general” and “theoretical” policies, and
that they would have to review the details of specific policies on an ad-hoc basis.
Analysis of responses by stakeholder group reveals that the industry sub-group
tended to be more opposed to the general idea of stricter on-site environmental
regulations. Analysis of interview text indicates that this is because many of these
participants felt that environmental regulations were already strict and reporting
requirements onerous, and thus noted that they would want to know exactly what the
new regulation would be and what it would try to address prior to giving support for it. As
one participant noted: “I don’t mind stricter regulations, but it has to make sense”.
Results demonstrate that industry generally supports voluntary environmental
guidelines, and appeared to be split in their views regarding stricter environmental
regulations and green tax policies, due to the uncertainty as to their effectiveness and
desirability. The data suggests that the government sub-group is more supportive of
stricter on-site environmental regulations, although many expressed uncertainty due to
lack of specific details surrounding the proposed policy. Government stakeholders
seemed to be generally split regarding the implementation of voluntary environmental
guidelines and environmental taxes. Finally, the data indicates that ENGOs are highly
supportive of stricter on-site environmental regulations and environmental taxes, and
generally opposed to voluntary industry standards. This data therefore provides
important insights into general perspectives towards broad categories of policies, which

94
will help inform the potential political feasibility of these, which is a critical factor that
policy-makers must consider when making decisions.
Participants were then asked to indicate how important they considered eight
more specific policies, many of them market-based instruments, as incentives for IMTA
adoption. These included IMTA-only licenses, technology and knowledge transfer,
subsidies, and various forms of taxes and tax credits. Results indicate that the policy of
IMTA-only licenses was considered to be the most important policy to incentivize
adoption. If an aquaculture zoning framework were to eventually be developed, with
certain geographical areas zoned as “IMTA-only”, such a policy would provide strong
incentives for adoption. Many participants, however, indicated that whereas they
considered this to be a potential significant incentive in theory, that they strongly
opposed such a policy in practice. As such, this policy may not be politically feasible.
Nevertheless, if certain aquaculture sites were deemed to be too ecologically sensitive
for conventional farming but could accommodate IMTA farms, then this policy could be
politically feasible and could provide incentives for IMTA adoption.
Technical and knowledge transfer was found to be the second most important
variable, followed by corporate tax credits, nutrient taxes on salmon feed with IMTA
taxed less, and subsidies. Indeed, technical uncertainty and a lack of managerial
expertise and organizational capabilities were found to be key barriers to IMTA adoption.
Therefore, continued knowledge transfer to the industry will be critical to overcoming this
barrier and reducing uncertainty. Corporate tax credits and nutrient taxes with IMTA
rebates, are also fairly easy to implement, and would be directly proportional to the
degree of IMTA adoption. Subsidies could be provided in addition to technical and
knowledge transfer.
Upon analysis by stakeholder sub-group, industry respondents appeared to
consider IMTA-only licenses, technology and knowledge transfer, and subsidies, to be
most important in potentially incentivizing IMTA (Figure 16). A majority of respondents
seemed to think that a nutrient tax on feed with partial IMTA rebates, uniform nutrient
output tax with IMTA taxed less, and hybrid nutrient tax/subsidy programs, could be
moderately to very important in incentivizing IMTA adoption. Regarding nutrient taxes,

95
some participants raised the issue of fairness, questioning why salmon farmers should
be charged a nutrient tax, when other land and coastal marine users that similarly
discharge nutrients would not. This raises a very important social consideration which
may make it very politically difficult for these types of taxes to be imposed unilaterally on
only one point-source of discharge.
Government participants indicated that they believed IMTA-only licenses,
technical assistance and knowledge transfer, direct government subsidies, and a
nutrient tax on feed with partial IMTA rebates, to be most important in incentivizing
adoption. ENGO participants indicated that technical assistance and knowledge transfer
would be the most important policy in affecting the adoption decision. Participant
answers varied for the other variables, but were mostly consistent in that they mostly
believed they would have an incentivizing effect. It is interesting to note that some
participants considered direct subsidies to have no incentivizing effect in practice, as
they did not believe it to be effective. Certain participants also made the observation that
R&D grants have been given to the industry for many years, and that without more
stringent incentives, farmers may be content to simply collect these grants and engage
in further research, but not move to the commercialization stage.
Overall, these results conclude that financial incentives such as a nutrient tax on
feed with partial IMTA rebates, corporate tax credits, subsidies, and government
technology and knowledge transfer to industry, would be the most popular instruments to
incentivize the development of IMTA in Canada, and that these would be generally
supported by industry. These results concur with Irwin (2015)’s study that assessed the
general public’s perspectives on these similar instruments. This study also identified that
most participants generally believe that nutrient tax policies and subsidies also have the
potential to incentivize IMTA development. However, the popularity of these policies will
depend on the details: what exactly is proposed, who it targets and who it does not, and
the effectiveness of IMTA at reducing nutrient impacts that the government may want
addressed. Policy recommendations will be discussed in Chapter 7.

96
Chapter 7. Policy Recommendations
Chapter 6 discussed the multitude of barriers and lack of incentives that
cumulatively act to hinder the diffusion of IMTA across the sector, while also noting
several current and potential incentives for further adoption. This chapter will suggest
policy recommendations to address these issues.
This study found that barriers to the diffusion of IMTA can be organized into five
broad categories: Uncertainty, Profitability, Regulatory Regime, Environmental
Concerns, and Lack of Incentives. As noted in the literature, a variety of social,
institutional and market factors with various feedback mechanisms and multidirectional
linkages all influence adoption dynamics (Montalvo & Kemp 2007; Gonzalez 2005), and
results from this study conclude much the same. I have found much evidence to support
some of the key aspects of the theories of the Battisti Model and the Real Options
Approach. Indeed, respondents indicated that profitability considerations, market and
technical uncertainty, risk, comfort with the status quo, firm specific skills and
capabilities, and existing regulations and policies, were key explanatory factors. As such,
my findings suggest that stakeholders in the industry perceive that the adoption of IMTA
is about much more than simply comparing the Net Present Value of two production
methods, and choosing the one that is the highest. If further IMTA adoption is desired,
policy-makers will need to address several factors to remove existing barriers, and
should focus their efforts on reducing uncertainty, which appears to permeate most
aspects of the adoption decision.
To address uncertainty regarding biological feasibility, studies need to
conclusively demonstrate whether or not shellfish and marine plants take up a significant
proportion of nutrient effluent from the salmon net-pens, quantify this rate controlling for
a variety of biophysical conditions, and demonstrate under which conditions uptake rates

97
could be optimized10. Second, this research also needs to be applied with the inclusion
of the bottom-feeder component, which from the results of interviews appears to hold the
greatest promise for achievement of ecological benefits. This is of the utmost
importance, because if IMTA’s greatest advantage is the realization of ecological
benefits, then these need to be objectively and conclusively demonstrated. Third,
knowledge transfer programs are recommended to educate potential adopters about the
biophysical benefits of co-culturing marine plants, emphasizing their oxygen producing
capabilities.
Further research is also required to demonstrate the technical feasibility of the
commercial culture of bottom-feeders, such as sea cucumbers. Interview results suggest
that culturing these species present several technical challenges. Therefore, developing
methods to culture these species with low escape rates is necessary, as this component
will likely be key in realizing ecological benefits. Further engineering research will also
be required to study how IMTA sites can best be optimized from a bio-economic
perspective, and thereby demonstrate their commercial feasibility. Then, skills
development, labor training and knowledge transfer will be required to reduce
transitioning costs and incentivize adoption.
Reducing the uncertainty surrounding potential adverse effects to fish health will
also be crucial. As demonstrated in Chapter 5, certain industry and government
participants are reticent to adopt or permit a multi-species culture on salmon farms, due
to the potential for parasite, pathogen and disease transfer to the salmon crop. It is
recommended that full disease profiles be conducted on all candidate IMTA species.
This will allow regulators and companies to comprehensively assess potential health
effects, and understand whether candidate species are vectors for disease transfer, and
therefore whether they have the potential to cause adverse health effects on salmon.
This research would help to significantly reduce risk and uncertainty in producer’s minds
and provide confidence to stakeholders that adoption would not negatively affect
operations, and therefore profitability.
10 Some of this needed research is currently being conducted by the Canadian Integrated Multi-
Trophic Aquaculture Network.

98
In terms of profitability, all of these aforementioned considerations feed into the
creation of a high “risk coefficient”, which translates into a large hurdle rate factor.
According to the Real Options Approach, profitability of IMTA must be greater than that
of the status quo, plus the hurdle rate, for a producer to consider adoption. Currently, the
lack of observed adoption indicates that perceived IMTA profitability does not exceed the
value of the status quo plus this hurdle rate, and therefore producers appear to be quite
content to continue operating according to the status quo, which is highly profitable and
which is a very well understood production method. To reduce this hurdle rate
coefficient, uncertainty as discussed above must be addressed. Second, comprehensive
bio-economic models and profitability simulations need to be conducted to theoretically
demonstrate IMTA profitability. This said, however, profitability will also need to be
demonstrated empirically, to convince farmers that it is a worthwhile investment.
Policy-makers are also urged to address the multitude of regulatory and
institutional barriers that have been discussed. The uncertain regulatory landscape
creates a climate of uncertainty, which dampens investment. Jurisdictions are therefore
urged to clarify not only their regulatory framework, but also their whole-of-government
approach to aquaculture and related policy goals. These should be developed in
consultation with all affected stakeholders, including government departments and
agencies at federal and provincial levels, aquaculture companies, Aboriginal groups, and
members of the public. This would help to restore confidence and attract investment.
The following specific actions are also recommended. First, if IMTA is to be
incentivized, regulatory agencies are encouraged to accept license applications for
bottom-feeders, such as sea cucumbers, sea urchins and geoducks. Indeed, IMTA with
a bottom-feeder component can never be developed if producers cannot obtain the
licenses required to culture these species. Second, licenses and license amendment
processing times must be reduced to provide process certainty to producers. This could
be done, for example, by incorporating statutory timeframes in the regulations that would
mandate that licenses would need to be adjudicated within a specified period of time.
This is currently done by the Canadian Environmental Assessment Agency in the
environmental assessments of major projects at the federal level, and could also be
applied here. Provisions would however need to be included to allow for timeline

99
extensions if scientists or regulators were not satisfied with the contents of the
application, and needed more time to collect data and/or conduct research to support the
application requirements.
Results from the data also indicate that certain stakeholders consider that
government regulators require more funds and capacity to implement their mandates.
For example, interview data indicated that more capacity needs to be given to
Environment Canada to classify new waters, in order for potential adopters to be able to
obtain the licenses required to grow shellfish. More capacity is also allegedly needed for
fish health veterinarians, whom were noted in some interviews to be stretched to
capacity in certain jurisdictions. All of this would help solve many of the frustrations that
participants noted in trying to “get through” the process. If further funds cannot be
allocated to these regulators, then perhaps cost recovery regulations or something
similar could be developed, in consultation with all affected stakeholders.
Another recommendation would be to explore ways to streamline reporting
requirements, to reduce the burden that would be placed on producers if they were to
co-culture multiple species. As was noted in Chapter 5, producers felt current reporting
requirements were onerous and burdensome, and that they were required to report on
several parameters that were not necessary to help determine adverse effects on the
environment. If this is true, and if IMTA would increase reporting requirements and
therefore cost, it logically follows that it would be useful to determine if there are ways to
reduce this requirement while still ensuring that a stringent and rigorous review of
potential environmental effects is conducted. Similarly, it was noted by many participants
that too many government agencies are involved in the process, creating overlap and
duplication. As such, streamlining this process where possible is also recommended.
Some participants also expressed frustration at the inability to transfer knowledge
and experience gained from one jurisdiction to the other. Therefore, regulatory agencies
are urged to explore the conditions under which this research may be transferred.
Otherwise, if multi-year research must be re-started in each jurisdiction, firms are much
more unlikely to choose to adopt IMTA in these new provinces. Finally, governments are

100
encouraged to look for opportunities to provide funding to potential IMTA adopters, as
lack of adequate funding was noted by some participants as being an adoption barrier.
The literature review of clean technology adoption in Chapter 2 noted that the
key explanatory variables that served to incentivize the diffusion of green technologies
across multiple industries around the world were: regulatory stringency, market-based
instruments, lack of uncertainty, expected profits and savings,
managerial/organizational/technical capabilities, public pressure, consumer demand,
and a desire for a green image. Key incentives for IMTA development noted in Chapter 5
were found to be very similar. To reiterate, the analysis found that incentives could be
organized into three categories: (i) ecological benefits, (ii) increased profitability as a
result of the penetration of niche markets and potentially the use of eco-certification
designations, and (iii) regulatory changes and market-based instruments. Indeed, the
realization of ecological benefits allow firms to market themselves as “greener”, which
then allows them to cater to consumers that desire such attributes in their seafood
products. Successful marketing strategies will allow for the charging of a premium price,
which will increase operation profitability and help make IMTA more attractive from a
financial perspective. Overall, by continuing to work on the penetration of new markets
and on marketing their green image, IMTA has the potential to create incentives for
further adoption by the industry.
Finally, if further IMTA adoption is desired, the implementation of more stringent
environmental regulations and market based-instruments will help to incentivize this
diffusion. Zoning policies where only IMTA-based production is allowed in sensitive or
already disturbed areas, would provide strong regulatory incentives for adoption. More
stringent and diverse on-site environmental performance standards also have the
potential to incentivize IMTA adoption, but support would depend on the exact details of
the policy. This study also concluded that the theoretical implementation of financial
incentives such as a nutrient tax on salmon feed with partial IMTA rebates, subsidies,
corporate tax credits, and knowledge transfer, was considered by most participants to
likely provide important incentives for adoption. There appears to be a political appetite
for certain financial incentives, but specific details need to be presented for stakeholders
to determine whether or not they support it. For such policies to work, they must

101
incentivize the protection of environmental values, be economically efficient,
administratively feasible, politically acceptable, and socially desirable. Further research
is recommended to model the economic efficiency of various measures, for incorporation
into potential policy proposals.

102
Chapter 8. Conclusions
Several barriers to the adoption of IMTA currently exist in Canada. These are
compounded by the already existing challenges that the salmon aquaculture industry as
a whole faces. As the global demand for seafood products continues to rise, Canada
should increase its production of aquaculture products in a manner that is as ecologically
efficient, environmentally benign, and societally beneficial as possible (Chopin et al.
2010b). IMTA has the potential to mitigate some of the potential adverse environmental
effects of open-net pen salmon farming, especially if a bottom-feeder component is
added to the operation. Furthermore, salmon farmers will be able to produce additional
crops at a minimal additional cost and sell these for a premium price. Therefore, the
argument can be made that the sustainability of their operation should increase.
Nevertheless, this study has found that many barriers exist that must be
overcome for producers to find it desirable to adopt IMTA. First, tremendous uncertainty
still exists pertaining to biological and technical feasibility, fish health issues, and
regulations. Uncertainty also still remains regarding environmental impacts of salmon
farming in general. Second, profitability has yet to be clearly demonstrated, and third,
many existing regulations and institutional frameworks make it very difficult for potential
adopters to begin operations. These will all need to be addressed for IMTA to be able to
“take off”. However, several incentives for IMTA adoption also exist. These largely
revolve around its potential positive ecological benefits (internalizing a negative
externality), and the potential ability to obtain a premium price in niche markets by
marketing IMTA products appropriately. Regulatory and market-based instruments can
also be utilized, including implementing stricter on-site environmental regulations,
increasing government capacity for auditing, compliance and enforcement, knowledge
and technology transfer, and through various financial incentives including subsidies,
corporate tax credits and nutrient tax on feed with partial rebates to IMTA operations. By
adopting a “whole-of-government” approach to IMTA, regulatory agencies should be

103
able to create a climate more conducive to IMTA adoption, and thereby work towards
increasing its diffusion across the industry.

104
References
Abdullah, N.H., Wahab, E. & Shamsuddin, A. (2013). Exploring the Common Technology Adoption Enablers among Malaysian SMEs: Qualitative Findings. Journal of Management and Sustainability 3(4): 78-91.
ACFFA “Atlantic Canada Fish Farmers Association”. (2010). Bay Management Areas. Available online at: http://atlanticfishfarmers.com/bay-management-areas.html
Allan, C., Jaffe, A. & Sin I. (2013). Diffusion of Green Technology: A Survey. International Review of Environmental and Resource Economics,7(1):1-33.
Anderson, S. & Newell, R. (2002). Information Programs for Technology Adoption: The case of Energy-Efficiency Audits. Discussion Paper 02-58.
ASF “Atlantic Salmon Federation”. (2014). DFO may unveil streamlined aquaculture regulations in August. Available online at: http://www.asf.ca/dfo-may-unveil-streamlined-aquaculture-regulations-in-augus.html
Asche, F. (2008). Farming the Sea. Marine Resource Economics 23: 527-547
Auerbach, C.F. & Silverstein, L.B. (2003). Qualitative data: an introduction to coding and analysis. New York, NY. New York University Press.
Barrington, K., Ridler, N., Chopin, T., Robinson, S., & Robinson, B. (2010). Social aspects of the sustainability of integrated multi-trophic aquaculture. Aquaculture International, 18, 201-211.
Battisti, G. (2007). Innovations and the economics of new technology spreading within and across users: gaps and way forward. Journal of Cleaner Production 16S1: 22-31.
Baumgart-Getz, A., L. S. Prokopy, and K. Floress. 2012. “Why Farmers Adopt Best Management Practice in the United States: A Meta-Analysis of the Adoption Literature.” Journal of Environmental Management 96(1): 17–25.
Belizan, M., Meier, A. & Althabe, F. et al. (2007). Facilitators and barriers to adoption of evidence-based perinatal care in Latin American hospitals: A qualitative study. Health Education Research 22(6): 839-853.
105
Brooks, K.M., Stierns, A.R., Mahnken, C.V., & Blackburn, B.D. (2003). Chemical and biological remediation of the benthos near Atlantic salmon farms. Aquaculture 219(1), 355-377.
Bruneau, J. (2004). A Note on Permits, Standards and Technological Innovation. Journal of Environmental Economics and Management 48: 1192-1199
Busch, C., De Maret, P.S., Flynn,T. et al. (2012). Content Analysis. Writing@CSU. Colorado State University. Available online at: http://writing.colostate.edu/guides/guide.cfm?guideid=61
CAIA “Canadian Aquaculture Industry Alliance”. (2012). Aquaculture in Canada. Available online at: http://www.aquaculture.ca/files/aquaculture-in-canada.php
CAIA” Canadian Aquaculture Industry Alliance”. (2013). CAIA Discussion Document #1- Regulatory Cost, Economic Impacts. Draft for Discussion.
Cantano, S. & Silverberg, G. (2009). A Percolation Model of Eco-Innovation: The Relationship between Diffusion, Learning Economies and Subsidies”. Technological Forecasting and Social Change 76: 487-496
Carley, K. (1993). Coding Choices for Textual Analysis: A Comparison of Content Analysis and Map Analysis. Sociological Methodology 23: 75-126
CFE “Confederation Fiscale Europeene”. (2016). Environmental Taxes in Denmark. Accessed on January 13, 2016. Available online at: https://www.cfe-eutax.org/taxation/environmental-taxes/denmark
CFIA “Canadian Food Inspection Agency”. (2014). Canadian Shellfish Sanitation Program. Available online at: http://www.inspection.gc.ca/food/fish-and-seafood/shellfish-sanitation/eng/1299826806807/1299826912745
Chopin, T. & Bastarache, S. (2004). Mariculture in Canada: finfish, shellfish and seaweed. World Aquaculture 35: 37-41
Chopin, T. & Robinson, S. (2004). Defining the Appropriate Regulatory and Policy Framework for the Development of Integrated Multi-Trophic Aquaculture Practices: Introduction to the Workshop and Positioning of the Issues. Bulletin of the Aquaculture Association of Canada 104-3:
Chopin, T., Yarish, C. & Sharp, G. (2007). Beyond the monospecific approach to animal aquaculture – The light of integrated multi-trophic aquaculture. Ecological and Genetic Implications of Aquaculture Activities. Reviews: Methods and Technologies in Fish Biology and Fisheries, 6 (4), 447-458

106
Chopin, T., Robinson, S., Troell, M., Neori, A., Buschmann, A., & Fang, J. (2008). Multi-trophic integration for sustainable marine aquaculture. In S. Jorgensen, & B. Fath (Eds.), Encyclopedia of ecology (pp. 2463-2475). Oxford: Academic Press. doi:DOI: 10.1016/B978-008045405-4.00065-3
Chopin, T., Troell, M., Reid, G., Knowler, D., Robinson, S., Buschmann, A., Pang, S. & Fang, J. (2010). Chapter 9 - integrated multi-trophic aquaculture. Proceedings of the OECD Workshop “Advancing the Aquaculture Agenda: Policies to Ensure a Sustainable Aquaculture Sector”, OECD Conference Centre, Paris, pp195-217
Chopin, T., Troell, M., Reid, G., Knowler, D., Robinson, S., Neori, A., Buschmann, A. & Pang, S. (2010b). Global Aquaculture Alliance. Available at: http://pdf.gaalliance.org/pdf/GAA-Chopin-Sept10.pdf
Chopin, T. (2011). IMTA- Upscaling an ecosystem approach to farming the sea. Aquaculture Europe 36 (4).
Chopin, T., Cooper, J.A., Reid, G., Cross, S. & Moore, C. (2012). Open-water integrated multi-trophic aquaculture: environmental biomitigation and economic diversification of fed aquaculture by extractive aquaculture. Reviews in Aquaculture 4: 209-220.
Chopin, T. (2014). Seaweeds: Top Mariculture Crop, Ecosystem Service Provider. Global Aquaculture Advocate, September/October Issue, page 54-55. Available online at: http://www2.unb.ca/chopinlab/articles/files/Chopin%202014%20GAA%20Seaweeds%20Top%20mariculture%20crop,%20ecosystem%20service%20provider%202.pdf
Cohen, B.I. (2012a). The Uncertain Future of Fraser River Sockeye- Volume 1- The Sockeye Fishery. Report available online at: www.cohencommission.ca
Cohen, B.I. (2012c). The Uncertain Future of Fraser River Sockeye- Volume 3- Recommendations-Summary-Process”. Report available online at: www.cohencommission.ca
Cross, S. (2004). Finfish-shellfish Integrated Aquaculture: Water Quality Interactions and the Implication for Integrated-Multi Trophic Aquaculture Policy Development. Bulletin of the Aquaculture Association of Canada.
Davis, M., Currey, J. & Hawk, S. et al. (2007). A qualitative study of rural primary care clinician views on remote monitoring technologies. The Journal of Rural Health 30: 69-78
De Casterle, B.D., Gastmans, C., Bryon, E. & Denier, Y. (2012). A guide for qualitative data analysis. International Journal of Nursing Studies 49: 360-371.

107
Dixit, A. & Pindyck, R. (1994). Investment Under Uncertainty. Princeton University Press: New Jersey.
De Winter, J.C.F. & Dodou, D. (2010). Fine-Point Likert Items: t test vs. Mann-Whitney-Wilcoxon. Practical Assessment Research & evaluation 15(11): 1-16.
DFO “Department of Fisheries and Oceans Canada” (2012). Aquaculture in Canada 2012-A Report on Aquaculture Sustainability”. Report available online at: http://www.dfo-mpo.gc.ca/aquaculture/lib-bib/asri-irda/pdf/DFO_2012_SRI_AQUACULTURE_ENG.pdf
DFO “Department of Fisheries and Oceans Canada” (2014). Current Valid Marine Finfish British Columbia Aquaculture License Holders. Available online at: http://www.pac.dfo-mpo.gc.ca/aquaculture/licence-permis/docs/finfish-pisciculture-eng.html
DFO “Department of Fisheries and Oceans Canada” (2014). Aquaculture Activities Regulations. Available online at: http://www.dfo-mpo.gc.ca/acts-lois/rules-reglements/rule-reglement06-eng.htm
DFO “Department of Fisheries and Oceans Canada. (2015). Aquaculture: Production Quantities and Values. Available online at: http://www.dfo-mpo.gc.ca/stats/aqua/aqua-prod-eng.htm
Doelle-Lahey (2014a). Independent Aquaculture Regulatory Review for Nova Scotia: Draft Version for Public Comment- July 3rd 2014”. Available online at: http://0-fs01.cito.gov.ns.ca.legcat.gov.ns.ca/deposit/b10672813.pdf
Doelle-Lahey (2014b). Independent Aquaculture Regulatory Review for Nova Scotia. Available online at: http://www.aquaculturereview.ca
FAO “Food and Agriculture Organization” (2001). The Economics of Conservation Agriculture. ISBN 92-4-104687-5. Available online at: http://www.fao.org/docrep/004/y2781e/y2781e00.htm#toc
FAO “Food and Agriculture Organization” (2001b). The Economics of Soil Productivity in Africa. Soils Bulletin (prepared by D. Knowler), FAO: Rome.
FAO “Food and Agriculture Organization”. (2012). The state of world fisheries and aquaculture. Report available online at http://www.fao.org/fishery/sofia/en
FAO “Food and Agriculture Organization”. (2014). National Aquaculture Sector Overview-Canada. Available online at: http://www.fao.org/fishery/countrysector/naso_canada/en

108
Faure, M. & Wibisana, A. (2013). Regulating Disasters, Climate Change and Environmental Harm: Lessons from the Indonesian Experience. Edward Elgar, Cheltenham, U.K.
Field, B.C. & Olewiler, N. (2011). Environmental Economics. 3rd ed. McGraw-Hill Ryerson.
Fischer, C. & Newell, R. (2004). Environmental and Technology Policies for Climate Change and Renewable Energy. Discussion Paper 04-05. Resources for the Future. Washington, DC., USA.
Flick, U. (Ed.). (2014). The SAGE handbook of qualitative data analysis. London: SAGE Publications Ltd. DOI: http://dx.doi.org.proxy.lib.sfu.ca/10.4135/9781446282243
Fudenberg, D. & Tirole, J. Preemption and Rent Equalization in the Adoption of New Technology. Review of Economic Studies 52: 383-401.
Globe Foundation (2010). British Columbia’s Green Economy- Securing the Workforce of Tomorrow. Available online at: http://globe.ca/wp-content/uploads/2012/10/globe_bc_green_economy_report_ii_final.pdf
Gonzalez, P. (2005). Analyzing the factors influencing clean technology adoption: a study of the Spanish pulp and paper industry. Business Strategy and the Environment 14: 20-37
Hall, B & Khan, B. (2002). New Economy Handbook. University of California at Berkeley.
Hargrave, B.T. (2003). Far-field Environmental Effects of Marine Finfish Aquaculture. In a Scientific Review of the Potential Environmental Effects of Aquaculture in Aquatic Ecosystems – Volume 1. Fisheries and Oceans Canada Website. Retrieved from: http://www.dfo-mpo.gc.ca/science/environmental-environnement/aquaculture/sok-edc/volume1/hargrave-eng.htm
Hermosilla, J. (2003). An Evolutionary Approach to the Process of Technology Diffusion and Standardization. Working Paper DO8-112-I. Centre for Environmental and Energy Studies, Madrid, Spain.
Irwin, K. (2015). Valuing Improvements to the Environmental Performance of Salmon Aquaculture in British Columbia: A Choice Modelling Approach. Master’s Thesis, Simon Fraser University. Available online at: https://theses.lib.sfu.ca/thesis/etd8983
Jacobson, M. (1998). Adoption Patterns and Characteristics of Faculty who Integrate Computer Teaching and Learning in Higher Education- Chapter Two. Doctoral Dissertation, University of Calgary. Available online at: http://people.ucalgary.ca/~dmjacobs/phd/diss/chapter_2.html#Innovators

109
Jaffe, A., Newell, R. & Stavins, R. (2003). Technological Change and the Environment. Handbook of Environmental Economics, Volume 1. Chapter 11. Elsevier Science. ***
Karshenas, M. & Stoneman, P. (1993). RAND Journal of Economics 24 (4): 503-528
Kerr, S. & Newell, R. (2003). Policy-Induced Technology Adoption: Evidence from the US Lead Phasedown. The Journal of Industrial Economics, Volume LI, 317-343
Knowler, D. & Bradshaw, B. (2007). Farmer’s Adoption of Conservation Agriculture: A Review and Synthesis of Recent Research. Food Policy 32: 25-48
Krkosek, M., Lewis, M.A. & Volpe, J.P. (2005). Transmission dynamics of parasitic sea lice from farm to wild salmon. Proceedings. Biological sciences / The Royal Society, 272 (1564), 689-696.
Koefoed, M. & Buckley, C. (2008). Clean Technology Transfer: a Case Study from the South African Metal Finishing Industry, 2000-2005. Hournal of Cleaner Production 16S1: S78-S84
Krysiak, F. (2011). Environmental Regulation, Technological Diversity, and the Dynamics of Technological Change. Journal of Economic Dynamics and Control 35: 528-544
Lander, T., Barrington, K., Robinson, S., MacDonald, B. & Martin, J. (2004). Dynamics of the Blue Mussel as an Extractive Organism in an Integrated Multi-Trophic Aquaculture System. Bulletin of the Aquaculture Association of Canada 104-3:
Lander, T. (2006). Integrated Aquaculture in New Brunswick: Influence of Salmon Farms on the Growth of Mytilus edulis. Masters Thesis presented to the University of New Brunswick.
Lanoie, P., Laurent-Lucchetti, J., Johnstone, N. & Ambec, S. (2007). Environmental Policy, Innovation and Performance: New Insights on the Porter Hypothesis. Working Paper GAEL, 2007-07. Institut National de la Recherche Agronomique, France. Available online at: http://www.grenoble.inra.fr/Docs/pub/A2007/gael2007-07.pdf
Loomis, J., Kent, P., Strange, L., Fausch, K. & A. Covich. (2000). Measuring the total economic value of restoring ecosystem services in an impaired river basin: results from a contingent valuation survey. Ecological Economics 33: 103-117
Lewis-Beck, M.S., Bryman, A. & Liao, T.F. (2004). Encyclopedia of Social Science Research Methods. London: SAGE Publications Ltd. DOI: http://dx.doi.org.proxy.lib.sfu.ca/10.4135/9781412950589

110
Mackrell, D., Kerr, D. & Von Hellens, L. (2009). A qualitative case study of the adoption and use of an agricultural decision support system in the Australian cotton industry: the socio-technical view. Decision Support Systems 47: 143-153
Mallat, N. (2007). Exploring consumer adoption of mobile payments- A qualitative study. Journal of Strategic Information Systems 16: 413-432
Maxwell, J. (2005). Qualitative Research Design, 2nd Edition. Sage.
Marine Harvest. (2014). Salmon Farming Industry Handbook 2014. Available online at: http://www.marineharvest.com/globalassets/investors/handbook/handbook-2014.pdf
McCracken, G. (1988). The Long Interview, Qualitative Research Methods Series, Sage.
Miles, M. & Huberman, A.M. (1994). Qualitative Data Analysis: An Expanded Sourcebook. Thousand Oaks, California: Sage.
Morton, A., Routledge, R.D., Peet, C., & Ladwig, A. (2004). Sea lice (Lepeophtheirus salmonis) infection rates on juvenile pink (Oncorhynchus gorbuscha) and chum (Oncorhynchus keta) salmon in the nearshore marine environment of British Columbia, Canada. Canadian Journal of Fisheries and Aquatic Sciences 61, 147-157
Montalvo, C. & Kemp, R. (2007). Cleaner technology diffusion: case studies, modeling and policy. Journal of Cleaner Production, 16S1, S1-S6
Neori, A. (2008). Essential role of seaweed cultivation in integrated multi-trophic aquaculture farms for global expansion of mariculture: an analysis. Journal of Applied Phycology, 20 (5), 567-570
OCAD “Office of the Commissioner for Aquaculture Development”. (2003). Achieving the Vision: Report of the Commissioner for Aquaculture Development. Available online at: http://www.dfo-mpo.gc.ca/aquaculture/ref/vision-eng.htm#tphp
PHAC “Public Health Agency of Canada” (2013). Definitions and Scoping Review of the Literature. Available online at: http://www.phac-aspc.gc.ca/publicat/2009/ActNowBC/section2-partie2-eng.php
POC “Parliament of Canada”. (2012). Closed Containment Salmon Aquaculture Report. Available online at: http://www.parl.gc.ca/HousePublications/Publication.aspx?DocId=5994887&Language=E&Mode=1&Parl=41&Ses=1&File=39
POC “Parliament of Canada”. (2013). Aquaculture in Canada. Available online at: http://www.parl.gc.ca/Content/LOP/ResearchPublications/2013-12-e.htm
111
POC “Parliament of Canada”. (2013b). Closed Containment Salmon Aquaculture: Report on the Standing Committee on Fisheries and Oceans. Available online at: http://www.parl.gc.ca/content/hoc/Committee/411/FOPO/Reports/RP5994887/foporp03/foporp03-e.pdf
POC “Parliament of Canada”. (2014). Proceedings of the Standing Senate Committee on Fisheries and Oceans. Issue 3- Evidence-February 25, 2014. Retrieved from: http://www.parl.gc.ca/content/sen/committee/412%5CPOFO/03EV-51220-E.HTM
Pizer, W., Harrington, W., Kopp, R., Morgens, R. & Shis, J.S. (2002). Technology Adoption and Aggregate Energy Efficiency. Discussion Paper 02-52 prepared for Resources for the Future.
Popp, D. (2010). Exploring Links between Innovation and Diffusion- Adoption of NOx control technologies at US coal fired power plants. Environmental Resource Economics 45: 319-352
Popp, D., Hafner, T. & Johnstone, N. (2011). Environmental policy bs. Public pressure: Innovation and diffusion of alternative bleaching technologies in the pulp industry. Research Policy, 40, 1253-1268
Price, M.H.H., Morton, A. & Reynolds, J.D. (2010). Evidence of farm-induced parasite infestations on wild juvenile salmon in multiple regions of coastal British Columbia, Canada. Canadian Journal of Fisheries and Aquatic Sciences, 67 (12), 1925-1932.
Qaim, M. (2005). “Agricultural Biotechnology Adoption in Developing Countries.” American Journal of Agricultural Economics 87(5): 1317–1324.
QSR (2015). “Qualitative Research Data Software | NVivo”. Retrieved from: http://www.qsrinternational.com/products.aspx
Requate, T. (2005). Dynamic Incentives by Environmental Policy Instruments- A Survey. Ecological Economics 54: 175-195
Rexhauser, S. & Rammer, C. (2014). Environmental Innovations and Firm Profitability: Unmasking the Porter Hypothesis. Environmental Resource Economics 57: 145-167
RIAS “Regulatory Impacts, Alternatives and Strategies”. (2011). A Policy and Business Case for a Federal Aquaculture Act. Prepared for the Canadian Aquaculture Industry Alliance.
RIAS “Regulatory Impacts, Alternatives and Strategies”. (2013). A Brief Primer on Government Subsidies: Overview of Methods and Sector Comparisons. Prepared for the Canadian Aquaculture Industry Alliance. Available online at: http://www.aquaculture.ca/files/documents/CAIA-Subsidies-Paper-Feb-14.pdf

112
Ridler, N., Wowchuk, M., Robinson, B., Barrington, K., Chopin, T., Robinson, S., et al. (2007). Integrated multi-trophic aquaculture (IMTA): a potential strategic choice for farmers. Aquaculture Economics & Management , 11 (1), 99-110.
Robinson, S. & Reid, G. (2014). Review of the Potential Near-and Far-Field Effects of the Organic Extractive Component of Integrated Multi-Trophic Aquaculture (IMTA) in Southwest New Brunswick with Emphasis on the Blue Mussel (Mytilus edulis). Canadian Science Advisory Secretariat (CSAS) Research Document 2014/026.
Rogers, E. (1995). Diffusion of Innovations. 4th ed. The Free Press, New York.
Statistics Canada (2013). Aquaculture Statistics. Catalogue no. 23-222-X. Available at: www.statscan.ca
Stavins, R. (2003). Handbook of Environmental Economics, Volume 1:Environmental Degradation and Institution Responses. Chapter 9. NORTH HOLLAND: Elsevier Science. ISBN: 978-0-444-50063-2
Stoneman P. (1981). Intra firm diffusion, Bayesian learning and profitability. Economic Journal 91:375-388.
Stoneman, P & Kwon, M.J. (1996). Technology Adoption and Firm Profitability. The Economic Journal 106: 952-962
Stoneman P, Battisti G. (1997). Intra-firm diffusion of new technologies: the neglected part of technology transfer. International Journal of Industrial Engineering 4(2): 270-282.
Stoneman, P & Battisti, G. (2000). The role of regulation, fiscal incentives and changes and changes in tastes in the diffusion of unleaded petrol. Oxford Economic Papers, 52, 326-356
Summers, L.H. (1987). Investment Incentives and the Discounting of Depreciation Allowances. In The Effects of Taxation on Capital Accumulation, ed. Martin Feldstein. Chicago, IL: Chicago University Press.
Tides Canada. (2013). Updates on Land-Based Closed-Containment Systems for Salmon. Presentation given by Steve Summerfelt. September 4-6 2013. Shepherdstown, WV, USA. Available online at: http://tidescanada.org/wp-content/uploads/files/salmon/workshop-sept-2013/D-2-2SummerfeltUpD-ateCloseD-ContainmentProD-uctionofSalmon.pdf
Thomas, J. & Harden, A. (2008). Methods for the thematic synthesis of qualitative research in systematic reviews. BMC Medical Research Methodology 8(1).

113
Troell, M., Halling, C., Nilsson, A., Buschmann, A. H., Kautsky, N., & Kautsky, L. (1997). Integrated marine cultivation of gracilaria chilensis (gracilariales, rhodophyta) and salmon cages for reduced environmental impact and increased economic output. Aquaculture, 156 (1-2), 45-61.
Wang, X., Olsen, L.M., Reitan, K.I., & Olsen, Y. (2012). Discharge of nutrient wastes from salmon farms: environmental effects, and potential for integrated multi-trophic aquaculture. Aquaculture Environment Interactions, 2(3): 267-283.
Wang, X., Andresen, K., Handa, A., Jensen, B., Reitan, K. & Olsen, Y. (2013). Chemical composition and release rate of waste discharge from an Atlantic salmon farm with an evaluation of IMTA feasibility. Aquaculture Environment Interactions 4: 147-162
Watershed Watch, Pacific Salmon Foundation, SOS Marine Conservation Foundation, David Suzuki Foundation. (2014). “Open Letter on Flawed DFO Marine Finfish Aquaculture Management Planning Process”. May 26, 2014. Available online at: http://www.watershed-watch.org/wordpress/wp-content/uploads/2014/05/AMACletter-May26_2014.pdf
Whitmarsh, D., Cook, E. and Black, K. (2006). “Searching for Sustainability in aquaculture: an investigation into the economic prospects for an integrated salmon-mussel production system”. Marine Policy, pp. 293-298.
Yip, W. (2012). Assessing the Willingness to Pay in the Pacific Northwest for Salmon Produced by Integrated Multi-Trophic Aquaculture. Master’s Thesis. Simon Fraser University, Burnaby, BC.
Zilberman, D., Khanna, M. & Lipper, L. (1997). Economics of new technologies for sustainable agriculture. Australian Journal of Agricultural and Resource Economics, 41 (1), 63 – 80

114
Appendix A. Salmon Farmer Questionnaire
Section 1- General Questions
1. Which regions of Canada does your company operate in?
2. How many tons of salmon do you produce, in Canada, on average per year?
3. How many tenures do your company have in total?
4. How many tenures do you have active at any one time?
5. Which factors influence this decision?
6. What type of products do you produce (fillets, whole-dressed fish, etc), and in which relative proportions?
7. Do you sell to wholesalers or directly to retailers?
8. What proportion of total production do you export, and where do you export to?
9. Are certain products reserved exclusively for export?
10. Who are your main competitors, and where are they located?
11. In your opinion, what is your main competitive advantage with respect to these competitors?

115
12. Do you find there are certain government policies that help increase your firm’s
ability to compete? (i.e. favourable taxation regime, etc.)
13. How important are the following factors in affecting your ability to compete?
Of No Importance Moderately Important
Very Important Don’t Know
Moratoriums Costs and time to obtain licenses
Regulatory regime Siting/stocking regulations
Fish Health regulations Environmental regulations
Transportation networks
14. Are there any other factors that were not mentioned above?
15. Regarding current environmental regulations, do you feel they are strong enough and effective in their ability to protect the quality of the marine environment? Please elaborate.
16. Do you perceive the regulatory framework surrounding salmon farming to be complex and difficult to work with, or simply and easy?
17. What changes to the current regulatory regime would you propose to make it easier for you to do business, while still meeting the environmental objectives set out by the government?

116
Section 2: Firm-specific questions on environmental performance
18. Please answer the following questions, and elaborate where appropriate.
Does your company… Yes No Have an environmental sustainability department? If yes, what types of projects does it normally conduct?
Have any environmental quality certifications? Engage in environmental Research & Development (R&D)? If so, what are your average R&D expenditures?
Have a written environmental policy? Conduct internal environmental audits? If so, how often? Engage in environmental accounting? Release environmental reports to the public? Have an environmental officer?
19. Has your company ever voluntarily adopted a technology to help reduce farming impact on the marine environment? (ie. Not prescribed by government). If so, please describe.
20. What process was used in assessing and deciding on the adoption of this new technology?
21. In general, how important do you think the following would be in making
decisions about adopting new environmental or ‘green’ technologies in your company, now or in the future?
Of no importance
Moderately Important
Very Important
Don’t Know
Concern about environmental impacts
Desire to have a greener image for marketing purposes
Public Pressure Anticipation of more stringent environmental regulations in near future
Expectation that technology may improve or become cheaper in future
Cost Savings

117
22. Were there any other considerations that were not mentioned above?
23. Do you plan on adopting any new environmentally friendly technologies in the future? If so, can you be specific?
24. When was the last time you invested in a major capital upgrade? Do you expect that investing in cleaner technology might be a possibility when existing equipment needs to be replaced in the future?
Section 3a: Environmental Policies (general)
In this section, I will begin by asking a few general questions on environmental policy,
before specifically inquiring about IMTA.
25. In your opinion, who should be primarily responsible for ensuring that the marine environment surrounding salmon farms is in good condition?
a) Salmon Farming Companies b) Federal/Provincial/Municipal Governments c) NGO’s (industry organizations, environmental groups, etc) d) Others (please specify) e) I’m not sure/I don’t know
26. If government regulatory agencies were to change how they address the
environmental impact of salmon farming by adopting new policies, how strongly would you support the following?
Strongly Oppose
Oppose Support Strongly support
Don’t Know/ Indifferent
Create stricter mandatory on-site environmental regulations for the salmon farming industry
Allow the salmon farming industry to develop more stringent voluntary environmental guidelines
Hold salmon farming companies financially responsible for their environmental impacts using green taxes or similar measures
Fund research to develop greener technologies that improve salmon farming’s environmental performance

118
Strongly Oppose
Oppose Support Strongly support
Don’t Know/ Indifferent
Provide financial incentives (e.g. tax credits) to salmon farming companies to adopt greener technologies that improve their environmental performance
Comments:
Section 3b. IMTA
27. Do you perceive nutrient waste from salmon farms to have negative impacts on the marine environment? If yes, how so?
28. In your opinion, how important is it for salmon farming companies to ensure that their operations reduce/minimize the release of nutrient wastes into the marine environment?
• Of No Importance ☐ • Moderately Important ☐ • Very Important ☐ • Don’t Know ☐
29. Have you ever heard of a technology called Integrated Multi-Trophic Aquaculture (IMTA)? If so, how did you hear about it?
30. Are you aware of other farmers in the industry who have already adopted it?
31. How well informed do you feel about IMTA?
• Not informed at all ☐ • Not very informed ☐ • Somewhat informed ☐ • Very well informed ☐
32. How well informed do you feel about its technical feasibility?
• Not informed at all ☐ • Not very informed ☐ • Somewhat informed ☐ • Very well informed ☐
33. Given what you know about IMTA, would you agree that it would be profitable to
adopt at present?

119
• Strongly Disagree ☐ • Disagree ☐ • Undecided ☐ • Agree ☐ • Strongly Agree ☐
34. Do you currently have any IMTA operations? If so…
a) When did you first adopt? b) Did you retrofit existing sites, or adopt IMTA at new sites only? c) What was your initial IMTA production, and did this change over time? d) If so, what is your current IMTA production? e) Do you plan on increasing production in the future? If so, which factors
might influence this?
35. If your company has not adopted IMTA… has your company ever considered adopting it? If yes…
a) When did you first consider adopting this technology?
b) Do you have plans to adopt IMTA in the near future? If so, what is your anticipated IMTA production?
c) If initial ventures are successful, would you consider increasing the scope of your IMTA operations?
d) In terms of siting, would you retrofit some of your current operations to IMTA, or would the IMTA sites be completely new sites?

120
36. Given that your company (or companies in general if speaking to non-farmer stakeholders) has not yet adopted IMTA, what would you say are the main reasons?
Of No Importance Moderately Important
Very Important Don’t Know
Lack of information about IMTA
Uncertainty about technical feasibility
Lack of managerial expertise, organizational capabilities, no related experience
Uncertainty about profitability Profitability assessed, and not high enough
Expectation that adoption costs will decrease in future
Switching costs too high Hard to access financing/loans
Comments:
37. Are there any other barriers that were not mentioned above?
38. What would have to change for IMTA to be attractive to your company?
a) Please describe. b) Profitability? If so, what level of profitability would IMTA have to have
compared to conventional monoculture, for your firm to consider adopting it?
c) What type of payback period on investment would IMTA have to have for it to be attractive to your company?

121
39. Do you envision this happening?
40. How important would the following policies be in affecting your decision whether to adopt IMTA in the future?
Of no importance
Moderately important
Very important Don’t know
New licenses granted only if IMTA used
Direct government subsidies to reduce investment costs of IMTA
Government technical assistance and knowledge transfer
Additional R&D tax credits for IMTA development and implementation
Corporate tax credits tied to IMTA production
Nutrient tax on salmon feed, with partial rebates to IMTA operations
Uniform nutrient tax instituted on salmon production, with IMTA taxed less
Hybrid tax/subsidy program, where taxes on nutrients are combined with subsidies for investments in IMTA
More stringent and diverse on-site performance standards
41. How do you think your firm would react towards IMTA adoption if your competitors here in Canada began adopting it?
42. What conditions are changing that might affect switching? Are these conditions changing over time?

122
43. How do you see IMTA in Canada in 20 years from now?
44. Do you have any further comments/questions regarding IMTA?
Section 4: Closed Containment Aquaculture
45. Have you ever heard of Closed Containment Aquaculture? If so, when and how did you first hear about it?
46. How well informed do you feel about CCA? • Not informed at all ☐ • Not very informed ☐ • Somewhat informed ☐ • Very well informed ☐
47. How well informed do you feel about its technical feasibility?
• Not informed at all ☐ • Not very informed ☐ • Somewhat informed ☐ • Very well informed ☐
48. Do you think investing in CCA would be profitable? Why or why not?
49. Has your company considered possibly investing in CCA facilities in the future? If yes, please describe.
50. Overall, what is your view on CCA, versus IMTA?

123
51. What would be your main reasons for considering investing in this technology, as opposed to IMTA?
Strongly Disagree
Somewhat Disagree
Somewhat Agree
Strongly Agree Don’t Know
CCA is more profitable than IMTA
CCA is more environmentally desirable than IMTA
CCA is more socially desirable than IMTA
52. Were there any other reasons that were not mentioned above?
53. What barriers does your firm face in adopting CCA technology?
54. Are these barriers changing over time? How so?
55. How do you see CCA in Canada in 20 years time?

124
Appendix B. Other Stakeholder Questionnaire
Section 1- General Questions
1. In your opinion, what is the main competitive advantage of Canadian salmon farming companies, with respect to their international competitors?
2. Do you find there are certain government policies that help increase the salmon aquaculture industry’s competitiveness in Canada? (i.e. favorable taxation regime, etc)
3. How important do you feel are the following factors in affecting their ability to
compete?
Of No Importance Moderately Important
Very Important Don’t Know
Moratoriums
Costs and time to obtain licenses
Regulatory regime
Siting/stocking regulations
Fish Health regulations
Environmental regulations
Transportation networks
4. Are there any other factors that were not mentioned above?
5. Do you perceive the regulatory framework surrounding salmon farming to be complex and difficult to work with, or simply and easy?

125
6. Regarding current environmental regulations, do you feel they are strong enough and effective in their ability to protect the quality of the marine environment? Please elaborate.
7. If government regulatory agencies were to change how they address the environmental impact of salmon farming by adopting new policies, how strongly would you support the following?
Strongly Oppose
Oppose Support Strongly support
Don’t Know/ Indifferent
Create stricter mandatory on-site environmental regulations for the salmon farming industry
Allow the salmon farming industry to develop more stringent voluntary environmental guidelines
Hold salmon farming companies financially responsible for their environmental impacts using green taxes or similar measures
Fund research to develop greener technologies that improve salmon farming’s environmental performance
Provide financial incentives (e.g. tax credits) to salmon farming companies to adopt greener technologies that improve their environmental performance
Comments:
8. What changes to the current regulatory regime would you propose to make it easier for them to do business, while still meeting the environmental objectives set out by the government?

126
9. In general, how important do you think the following would be for firms in making decisions about adopting new environmental or ‘green’ technologies, now or in the future?
Of no importance
Moderately Important
Very Important
Don’t Know
Concern about environmental impacts
Desire to have a greener image for marketing purposes
Public Pressure Anticipation of more stringent environmental regulations in near future
Expectation that technology may improve or become cheaper in future
Cost Savings
10. Were there any other considerations that were not mentioned above?
Section 2. IMTA
11. In your opinion, who should be primarily responsible for ensuring that the marine environment surrounding salmon farms is in good condition?
a. Salmon Farming Companies b. Federal/Provincial/Municipal Governments c. NGO’s (industry organizations, environmental groups, etc) d. Others (please specify) e. I’m not sure/I don’t know
12. Do you perceive nutrient waste from salmon farms to have negative impacts on
the marine environment? If yes, how so?
13. In your opinion, how important is it for salmon farming companies to ensure that their operations reduce/minimize the release of nutrient wastes into the marine environment?
• Of No Importance ☐ • Moderately Important ☐ • Very Important ☐ • Don’t Know ☐

127
14. Have you ever heard of a technology called Integrated Multi-Trophic Aquaculture (IMTA)? If so, how did you hear about it?
15. Are you aware of farmers in the industry who have already adopted it?
16. How well informed do you feel about IMTA? • Not informed at all ☐ • Not very informed ☐ • Somewhat informed ☐ • Very well informed ☐
17. How well informed do you feel about its technical feasibility?
• Not informed at all ☐ • Not very informed ☐ • Somewhat informed ☐ • Very well informed ☐
18. Given what you know about IMTA, would you agree that it would be profitable to
adopt at present? • Strongly Disagree ☐ • Disagree ☐ • Undecided ☐ • Agree ☐ • Strongly Agree ☐

128
19. Given that most companies have not yet adopted IMTA, what would you say are the main reasons?
Of No Importance
Moderately Important
Very Important
Don’t Know
Lack of information about IMTA
Uncertainty about technical feasibility
Lack of managerial expertise, organizational capabilities, no related experience
Uncertainty about profitability
Profitability assessed, and not high enough
Expectation that adoption costs will decrease in future
Switching costs too high Hard to access financing/loans
Comments:
20. Are there any other barriers that were not mentioned above?
21. What factors do you think would have to change for IMTA to be attractive to companies? a) Please describe.
b) Profitability? If so, what level of profitability do you think IMTA would have to have compared to conventional monoculture, for firms to consider adopting it?
22. What type of payback period on investment would IMTA have to have for it to be attractive to companies?

129
23. Do you envision this happening?
24. In your opinion, how important would the following policies be in affecting
decisions on whether or not to adopt IMTA in the future?
Of no importance
Moderately important
Very important Don’t know
New licenses granted only if IMTA used
Direct government subsidies to reduce investment costs of IMTA
Government technical assistance and knowledge transfer
Additional R&D tax credits for IMTA development and implementation
Corporate tax credits tied to IMTA production
Nutrient tax on salmon feed, with partial rebates to IMTA operations
Uniform nutrient tax instituted on salmon production, with IMTA taxed less
Hybrid tax/subsidy program, where taxes on nutrients are combined with subsidies for investments in IMTA
More stringent and diverse on-site performance standards
25. How do you think firms would react towards IMTA adoption if their competitors here in Canada began adopting it?

130
26. What conditions are changing that might affect switching? Are these conditions changing over time?
27. How do you see IMTA in Canada in 20 years from now?
28. Do you have any further comments/questions regarding IMTA?
Section 3: Closed Containment Aquaculture
29. Have you ever heard of Closed Containment Aquaculture? If so, when and how did you first hear about it?
30. How well informed do you feel about CCA? • Not informed at all ☐ • Not very informed ☐ • Somewhat informed ☐ • Very well informed ☐
31. How well informed do you feel about its technical feasibility? • Not informed at all ☐ • Not very informed ☐ • Somewhat informed ☐ • Very well informed ☐
32. Do you think investing in CCA would be profitable? Why or why not?
33. Overall, what is your view on CCA, versus IMTA?

131
34. What would be the main reasons for considering investing in this technology, as opposed to IMTA?
Strongly Disagree
Somewhat Disagree
Somewhat Agree
Strongly Agree Don’t Know
CCA is more profitable than IMTA
CCA is more environmentally desirable than IMTA
CCA is more socially desirable than IMTA
35. Were there any other reasons that were not mentioned above?
36. What barriers do you think firms face in adopting CCA technology?
37. Are these barriers changing over time? How so?
38. How do you see CCA in Canada in 20 years time?