Embed Size (px)
Citation preview

Assessing the ability of current and future Landsat missions to monitor cyanobacteria blooms using modeled spectra matching
Ryan Ford
Dr. Anthony Vodacek
Dr. John Schott
7/12/2017
1
Landsat 8 image of Oneida Lake
captured September 19, 2013

IFYGL- the frustration begins
IFYGL 1972-1973: NOAA Citation for mapping turbidity
using color aerial photography
Piech, K.R. and Schott, J.R.,
“Measurement of Lake Eutrophication from
small-scale color imagery during the
IFYGL”, presented to ISP Commission VII
Symposium, October 1974.

Skylab Photos: chlorophyll maps Lake Ontario
Piech, K.R. and Schott, J.R., “Atmospheric corrections
for satellite water quality studies”, Proceedings of the
SPIE, Vol. 57, pp. 84-89, August 1974.
We didn’t have a clue!!!

Skylab Photos: chlorophyll maps Lake Ontario
Piech, K.R. and Schott, J.R., “Atmospheric corrections
for satellite water quality studies”, Proceedings of the
SPIE, Vol. 57, pp. 84-89, August 1974.
We didn’t have a clue!!!
Flash ahead 40 years

Landsat 8 does water!!!!: We’ve been beating the drum
• Pahlevan, N., Schott, J.R., Franz, B.A., Zibordi, G., Markham, B., Bailey, S., Schaaf, C.B., Ondrusek, S.G., Strait, C.M., “Landsat 8 Remote Sensing Reflectance (Rrs) Products: Evaluations, Intercomparisons, and Enhancements”, Remote Sensing of Environment, Vol. 190, pp. 289-301, March 1, 2017.
• Concha, J.A., Schott, J.R., “Retrieval of Color Producing Agents in Case 2 Waters Using Landsat 8”, Remote Sensing of Environment, http://dx.doi.org/10.1016/j.rse.2016.03.018, April 13, 2016.
• Schott, J.R., Gerace, A., Woodcock, C.E., Wang, S., Zhu, Z., Wynne, R.H., Blinn, C.E., “The Impact of Improved Signal-to-Noise Ratios on Algorithm Performance: Case Studies for Landsat Class Instruments”, Remote Sensing of Environment, http://dx.doi.org/10.1016/j.rse.2016.04.015, May 13, 2016.
• Pahlevan, N., Lee, Z., Wei, J., Schaaf, C.B., Berk, A., Schott, J.R., “On Orbit Radiometric Characterization of OLI (Landsat-8) for Applications in Aquatic Remote Sensing”, Remote Sensing of Environment, 154, pp. 272-284, Nov. 2014.
• Gerace A.D, Schott J.R, Nevins R; “Increased potential to monitor water quality in the near-shore environment with Landsat’s next-generation satellite.” Journal of Applied Remote Sensing Vol 7; pp. 073558-073558. May 2013.
• Pahlevan, N.; Schott, J. R.; , "Leveraging EO-1 to Evaluate Capability of New Generation of Landsat Sensors for Coastal/Inland Water Studies," Selected Topics in Applied Earth Observations and Remote Sensing, IEEE Journal of , Vol.PP, no.99, pp.1-15, 2013.
• Pahlevan, N., Schott, J. R., “Characterizing the relative calibration of Landsat-7 (ETM+) visible bands with Terra (MODIS) over clear waters: The implications for monitoring water resources”. Remote Sensing of Environment, Vol. 125, pp167-180, October 2012.

Lake Erie Bloom 2011
Harmful Algal Blooms: a growing problem
A new challenge
'Do not drink, do not boil’ Toledo 2014
Cyanobacteria Blooms in the Finger Lakes
7
New York State Department of Environmental Conservation reported blooms in
the Finger Lakes from 2012 to 2016. Red coloring represents location of bloom
and not spatial extent.

Concentration Retrieval Process
6
2.) Look-Up-Table Generation
1.) Hydrolight Run Inputs:
Chlorophyll, CDOM-yellowing
organics, Suspended Materials,
& Phycocyanin
Retrieved Water Quality Component
Concentrations
4.)Matching Data to Look-Up-Table
Spectral Response
3.) Spectral Sampling
Atmospherically
Compensated
L8 Rrs

Modeling Result Reporting
• Unless otherwise noted, the modeled system being shown have 12 bit quantization and Landsat 8 Requirement SNR
9
L8 Requirement Noise
Based on requirement SNR levels from L8 Design Document
L8 Operational Noise
Based on pre-launch measured L8 SNR levels
Band 1 Band 2 Band 3 Band 4 Band 5
SNR Ltypical
130 130 100 90 90
SNR Lhigh
290 360 390 340 460
Band 1 Band 2 Band 3 Band 4 Band 5
SNR Ltypical
237 355 296 222 199
SNR Lhigh
605 1127 1213 945 1009

Landsat 8 Copycat Model: requirement SNR
13
• Landsat 8 bands with no added spectral coverage
• Landsat 8 quantization level (12 bit)
• Landsat 8 Noise, based on requirement SNR

Modeled Retrieval Error: Noise, Quantization and a Yellow band
12
Incr
easi
ng
Qu
anti
zati
on
Increasing Noise
Operational SNR Requirement SNR
8 Bit
12 Bit

Combined Bands Improvement
15
Less
Improvement
More
Improvement
18
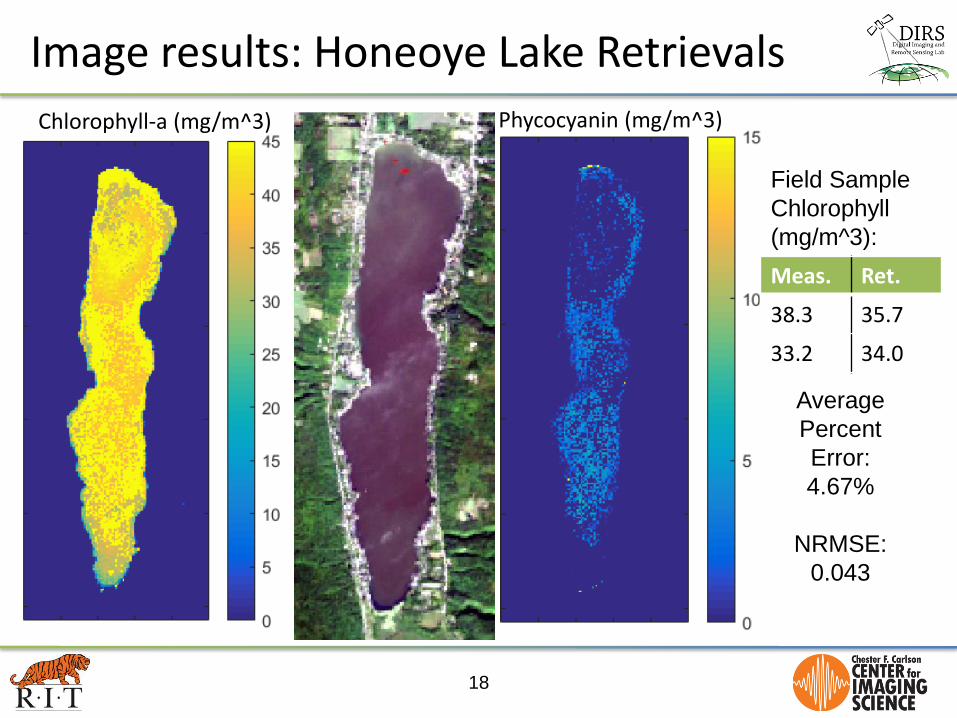
Chlorophyll-a (mg/m^3) Phycocyanin (mg/m^3)
Meas. Ret.
38.3 35.7
33.2 34.0
Field Sample
Chlorophyll
(mg/m^3):
Average
Percent
Error:
4.67%
NRMSE:
0.043
Image results: Honeoye Lake Retrievals

20
Chlorophyll-a (mg/m^3) Phycocyanin (mg/m^3)
Meas. Ret.
3.6 5
4.3 4.3
4.3 1.7
4.0 4.4
Field Sample
Chlorophyll
(mg/m^3):
Average
Percent
Error:
27.8%
NRMSE:
0.43
Image results: Owasco Lake Retrievals

Landsat Science
• 1972-73 Atmospheric compensation of MSS for USAF
• MSS for Gypsy Moth Walker, J.E., Schott, J.R., Gallagher, T.W., “An Investigation of Landsat
data as a base for developing a forest damage assessment system (FORDAS)”, Calspan Report YB-6128-M-1, prepared for USDA Forest Service, March 1978.
• LIDQA 1981-1985 (the Landsat 4&5 science team)
• 1992-3 The High Resolution Multispectral Stereo Imager (HRMSI)
• Landsat 7 Science team 1996-2001
• Resource 21
• Landsat Calibration Team 2001-
• LDCM-L8 Science team 2006-2011
• Landsat 2012-2017 Science team

Landsat: A History of Firsts
• MSS: First moderate resolution Space-based digital Multispectral
• TM: First less moderate resolution multispectral from space
• TM: First many band multispectral from space
• TM: First moderate resolution thermal
• Landsat Archive: First multi-decade open access calibrated human scale record of the planet
• Landsat 8: First very high radiometric resolution,
moderate spatial resolution sensor
16
Landsat 10???????????????
Continuity demands Firsts!

Landsat: A History of Firsts
• MSS: First moderate resolution Space-based digital Multispectral
• TM: First less moderate resolution multispectral from space
• TM: First many band multispectral from space
• TM: First moderate resolution thermal
• Landsat Archive: First multi-decade open access calibrated human scale record of the planet
• Landsat 8: First very high radiometric resolution,
moderate spatial resolution sensor
17
Landsat 10???????????????
Continuity demands Firsts!

18

Conclusion
Results are encouraging, but improvements can be made:
• Improving Model Design
– Increasing number of specific absorption spectra for test runs
– Remove production of non-physical combinations
• Refining Look-Up-Tables
- Determining how to best implement specific absorption variability
- Examining spectral matching interpolation and minimization algorithms
• Collecting Test Data
- Collect more reference data for 2017 Landsat 8 overpasses
21

Outline
Introduction Blooms in the Finger Lakes
Landsat 8
Methods Concentration Retrieval Algorithm
Modeling Retrieval Work
Results Modeled Retrieval Results
Preliminary Imagery Retrievals
Conclusion
20
CONCENTRATION RETRIEVAL ALGORITHM
21

Concentration Retrieval Process
22
1.) Hydrolight Run Generation
Specific
Absorption
Specific
Scattering
Concentration
Phase
Scattering
Phycocyanin (PC)
Chlorophyll – a (Chl)
Suspended Materials
(SM)
CDOM
Pure Water
Waterbody Components Component
Properties

Concentration Retrieval Process
6
2.) Look-Up-Table Generation
1.) Hydrolight Run Generation

Concentration Retrieval Process
6
2.) Look-Up-Table Generation
1.) Hydrolight Run Generation
Chl: 70 ug/L SM: 30 mg/L
CDOM: 1.2 1/m PC: 50 ug/L
Chl: 30 ug/L SM: 10 mg/L
CDOM: 0.5 1/m PC: 21 ug/L
Run 1857
Run 333

Concentration Retrieval Process
6
2.) Look-Up-Table Generation
1.) Hydrolight Run Generation Spectral Response
3.) Spectral Sampling

Concentration Retrieval Process
6
2.) Look-Up-Table Generation
1.) Hydrolight Run Generation Spectral Response
3.) Spectral Sampling

MODELING RETRIEVAL WORK
7
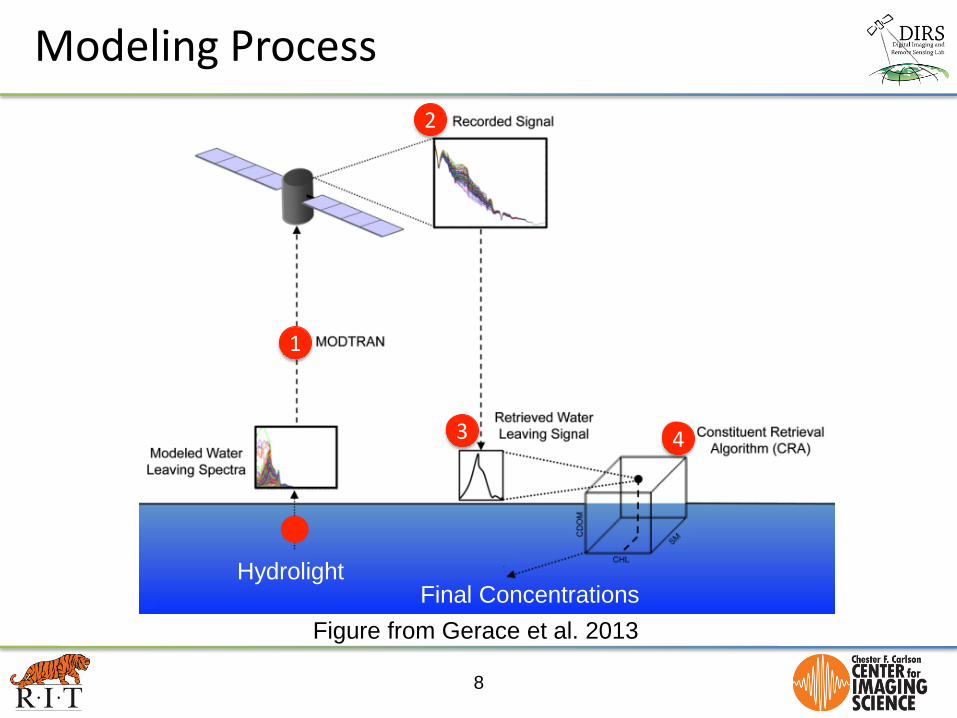
Modeling Process
8
Figure from Gerace et al. 2013
1
2
3 4
Hydrolight Final Concentrations

Modeling Process
8
Figure from Gerace et al. 2013
1
2
3 4
Hydrolight Final Concentrations

Modeling Process
8
Figure from Gerace et al. 2013
1
2
3 4
+
System Noise,
Quantization
Hydrolight Final Concentrations

Modeling Process
8
Figure from Gerace et al. 2013
1
2
3 4
Hydrolight Final Concentrations

Modeling Process
8
Figure from Gerace et al. 2013
1
2
3 4
Hydrolight Final Concentrations

MODELING RETRIEVAL RESULTS
9

Yellow Band Improvement
14
Less
Improvement
More
Improvement

Outlier Point
35

Outlier Point, With Yellow Band
36

Original Spectrum
37

Landsat 8 Spectrum
38

Landsat 8 and Added Bands Spectrum
39

20 nm Imaging Spectrometer Spectrum
40

10 nm Imaging Spectrometer Spectrum
41

Modeled Retrieval Error: Impact of a Yellow band
11
Higher
Error
Lower
Error

Red Edge Band Improvement
15
Less
Improvement
More
Improvement

PRELIMINARY IMAGERY RETRIEVALS
16

Honeoye Lake, October
45
DEC Bloom
Reported in Honeoye
Lake from:
August 21, 2015
To
October 9, 2015
Left image is from
Landsat 8
captured
September 16, 2015
Right image is from
Landsat 8
captured
October 11, 2015

Honeoye Lake Chl-a and PC
24

Long Pond and Cranberry Pond
47
Lake Ontario
Rochester, NY
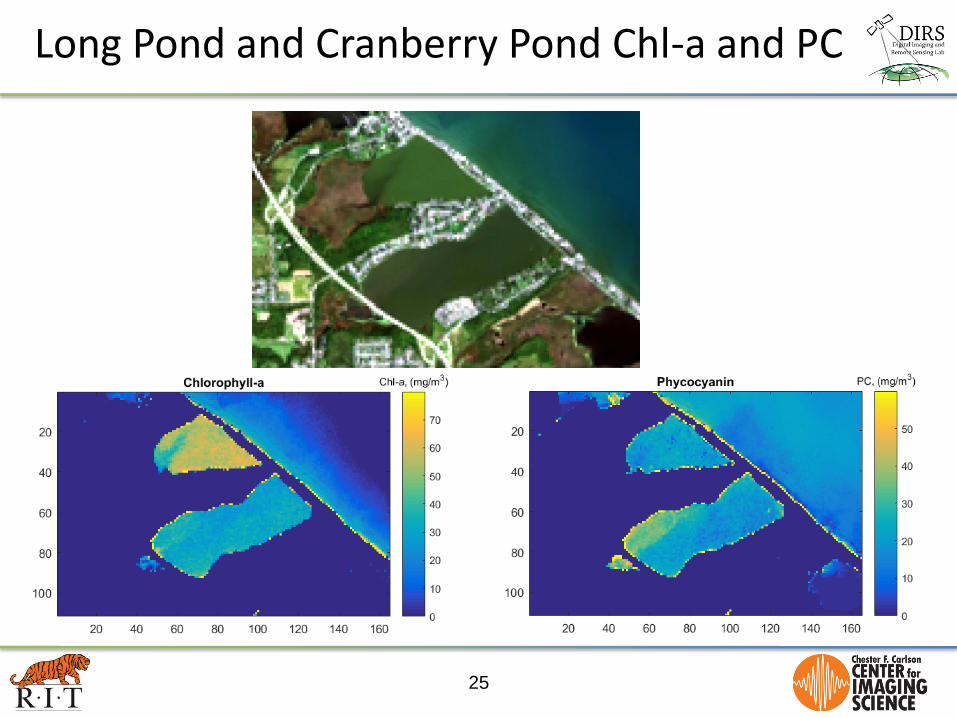
Long Pond and Cranberry Pond Chl-a and PC
25

Honeoye Lake Bloom, September 2016
17
Landsat 8 image of Honeoye Lake
September 27, 2016

Owasco Lake Bloom, September 2016
19
Landsat 8 image of Owasco Lake
September 20, 2016