Embed Size (px)
Citation preview
Assessing Mathematical Models of Influenza InfectionsUsing Features of the Immune ResponseHana M. Dobrovolny1,4, Micaela B. Reddy2, Mohamed A. Kamal2, Craig R. Rayner3,
Catherine A. A. Beauchemin4*
1 Department of Physics and Astronomy, Texas Christian University, Fort Worth, Texas, United States of America, 2 F. Hoffmann-La Roche Inc., Nutley, New Jersey, United
States of America, 3 Roche Products Pty Ltd. and Faculty of Pharmacy and Pharmaceutical Sciences, Monash University, Melbourne, Australia, 4 Department of Physics,
Ryerson University, Toronto, Ontario, Canada
Abstract
The role of the host immune response in determining the severity and duration of an influenza infection is still unclear. Inorder to identify severity factors and more accurately predict the course of an influenza infection within a human host, anunderstanding of the impact of host factors on the infection process is required. Despite the lack of sufficiently diverseexperimental data describing the time course of the various immune response components, published mathematicalmodels were constructed from limited human or animal data using various strategies and simplifying assumptions. Toassess the validity of these models, we assemble previously published experimental data of the dynamics and role ofcytotoxic T lymphocytes, antibodies, and interferon and determined qualitative key features of their effect that should becaptured by mathematical models. We test these existing models by confronting them with experimental data and find thatno single model agrees completely with the variety of influenza viral kinetics responses observed experimentally whenvarious immune response components are suppressed. Our analysis highlights the strong and weak points of eachmathematical model and highlights areas where additional experimental data could elucidate specific mechanisms,constrain model design, and complete our understanding of the immune response to influenza.
Citation: Dobrovolny HM, Reddy MB, Kamal MA, Rayner CR, Beauchemin CAA (2013) Assessing Mathematical Models of Influenza Infections Using Features of theImmune Response. PLoS ONE 8(2): e57088. doi:10.1371/journal.pone.0057088
Editor: Andrew J. Yates, Albert Einstein College of Medicine, United States of America
Received October 2, 2012; Accepted January 17, 2013; Published February 28, 2013
Copyright: � 2013 Dobrovolny et al. This is an open-access article distributed under the terms of the Creative Commons Attribution License, which permitsunrestricted use, distribution, and reproduction in any medium, provided the original author and source are credited.
Funding: This work was supported in part by a Discovery Grant from the Natural Sciences and Engineering Research Council of Canada (CAAB), with additionalsupport provided by F. Hoffmann-La Roche Ltd. The project was developed jointly by F. Hoffmann-La Roche Ltd and CAAB’s research group. However, F.Hoffmann-La Roche Ltd had no role in data collection and analysis. F. Hoffmann-La Roche Ltd was involved in the decision to publish and in the preparation of themanuscript.
Competing Interests: MBR, MAK & CRR are employed by the pharmaceutical company F. Hoffmann-La Roche Ltd. CAAB received a consultancy fee as part of aresearch contract with F. Hoffmann-La Roche Ltd, while HMD was supported in part by the research contract between CAAB and F. Hoffmann-La Roche Ltd. Thisdoes not alter the authors’ adherence to all the PLOS ONE policies on sharing data and materials.
* E-mail: [email protected]
Introduction
The Centers for Disease Control and Prevention estimate that
in the United States deaths related to influenza ranged from about
3,000 to 49,000 deaths per season from the 1976/77 to the 2006/
07 flu seasons [1]. While virologists, microbiologists, and clinicians
have studied the influenza virus and the illness it causes for many
years, it is only relatively recently that mathematical modelling has
been used to provide insight into influenza infections [2,3].
Application of mathematical modelling holds great promise and
the analysis of various experimental data has furthered our
understanding of influenza. Models have been used to quantita-
tively determine key influenza kinetic parameters such as the
duration of the eclipse phase and the viral clearance rate [4,5].
They have also been used to optimize antiviral therapy regimens,
better characterize antiviral efficacy, and predict the emergence of
drug resistance [5–8]. Mathematical models of within-host
influenza infections can provide unique and valuable insights,
but they must correctly capture the dynamics of the disease for full
utility.
One major obstacle to creating a biologically accurate model of
influenza infections has been the incorporation of a biologically
realistic immune response. An accurate model of the key players of
the immune response is essential to capture the range of dynamics
of influenza infections particularly since the immune response is
thought to play an important role in eliminating the infection [9–
11]. Immune memory or strength of the immune response is also
believed to play an important role in shaping the severity of an
influenza infection [12–16]. Unfortunately, study of the host
immune response to influenza suffers from a paucity of data
describing the dynamics of both the adaptive and innate immune
responses during infection. Data from human patients are typically
for few time points [17–20]. Animal experiments are sometimes
more comprehensive [11,21–25], capturing levels of various
cytokines/chemokines [11,21,25] and immune cells [22–24] at
several time points. However, the immune response in animals is
known to differ from that in humans [26–29], particularly in Balb/
c mice, a popular experimental model lacking functional
expression of Mx, an IFN-induced protein that induces an
antiviral state in cells [29,30]. Deficiencies in data limit the
formulation of a comprehensive, quantitative picture of the
immune response to influenza.
In this context, mathematical modelling can provide valuable
insights and help guide investigation. Already, several mathemat-
PLOS ONE | www.plosone.org 1 February 2013 | Volume 8 | Issue 2 | e57088
ical models for the course of an influenza infection within a host
have incorporated an immune response [2,4,22,23,31–36]. They
range from simple models that primarily aim to resolve the effects
of a few specific components of the host immune response using
simplifying assumptions [4,23,32–37] to complicated models with
many equations and parameters describing the detailed interac-
tions of immune response components [2,22,31]. Unfortunately,
since viral titer is often the only experimental quantity measured
over time, even adding a simple immune response with limited
additional parameters can be problematic as it becomes difficult to
ascertain biologically realistic parameters for the models [38].
Here, we amass previously published experimental and clinical
data on the time course and impact of various immune
components. These data are used to construct a picture of the
role of three key immune response components: antibodies (Abs),
cytotoxic T lymphocytes (CTLs), and interferon (IFN). We also
assemble a set of published mathematical models of influenza
infections that contain an explicit immune response. We confront
them with the experimental data to assess how well they reproduce
the time course of the immune response and the effect of
individual immune components on the viral titer. We quantita-
tively assess the relative contributions of Abs, CTLs, and IFN by
measuring their individual effect on various characteristics of the
influenza infection and we investigate the effect of antiviral
therapy in the presence and absence of an immune response. Our
analysis identifies key qualitative features of the immune response
to influenza that must be incorporated in mathematical models in
order for these models to serve as surrogates to experimental
investigation as valuable, credible influenza infection simulators
and predictors.
Results
Experimental evidence for the role of the immuneresponse
The course of an influenza infection within a host is typically
probed using viral titer time courses, sometimes supplemented by
symptom scores, cytokine concentration time courses, and rare
measurements of Ab levels on one or two days [18,20,39–42].
While this approach enables the identification of correlations
between immune factors and infection severity markers, it rarely
establishes causal relationships. Ideally, the characterization of the
role and efficacy of a specific immune response component would
follow an approach similar to that used for characterizing antiviral
efficacy: dose-ranging experiments in which increasing concentra-
tions of the antiviral are applied to isolate and quantify its effect on
the infection course. While such a procedure is virtually impossible
to perform for immune response components such as Abs or
CTLs, knock-out or suppression experiments in animals and the
occurrence of natural infections in immunocompromised patients
provide similar conditions. These types of studies provide
compelling evidence for the relative role and importance of the
host immune response in the control of influenza infections.
Clinical data. The infection of immunocompromised indi-
viduals provides a window into the course of the infection when
the immune response is severely attenuated. In many reported
cases of immunocompromised patients with influenza, virus was
shed for long periods of time, i.e., in some cases more than a year
[43–60], (Fig. 1). Underlying medical conditions, the influenza
viral strain, and antivirals used to treat immunocompromised
patients are given in Table 1.
The average duration of viral shedding for uncomplicated
seasonal influenza infections in healthy adults is *5 d [61]. In
contrast, immunocompromised patients shed virus for at least 14
d, with two reports of patients shedding virus for at least 18
months. Viral loads in the immunocompromised typically remain
high and fairly constant for the duration of the infection, despite
treatment with antivirals, indicating that the immune response is
an important component to clearing influenza infection in
humans. Unfortunately, the data presented in these reports do
not allow us to assess whether the lack of an immune response
leads directly to chronic infections or whether it causes a more
complex infection, such as an infection that spreads beyond the
upper respiratory tract [62,63] or one that includes a bacterial co-
infection [64,65], that is simply more difficult to clear even with
antiviral therapy.
Preclinical data. In animal models, the effect of individual
components of the immune response on the course and outcome
of the infection can be evaluated by down-regulating or
neutralizing a specific component of the immune response or its
activity. These studies use component-specific antisera [11,25],
genetic modification (knock-out) [13,66–69], or treatment with
toxins [70]. Unfortunately, these manipulations sometimes do not
fully remove the immune component [25,67,71] or removal of the
component also affects other components of the immune response
[11,72]. Additionally, the immune response in these animal
models might not be representative of that of a human host
[28,29]. Despite these shortcomings, experiments in animals can
help shape our understanding of the relative role of different
immune components. Published results of these experiments
conducted in mice (with the exception of Seo [13], which was
conducted in pigs) are assembled in Fig. 2 where graphs show the
viral titer time course for an influenza infection with a full immune
response or with one immune component disabled or destroyed.
We focused on published experimental data in which the
authors had disabled one or more of the following immune
responses: cytotoxic T lymphocytes (CTLs) which kill infected cells
[73,74]; antibodies (Abs) which bind and inactivate virus [75–77];
and interferon (IFN) which has many modes of action including
reducing the production of virus by infectious cells and establishing
an antiviral state in susceptible cells rendering them resistant to
infection [78–80].
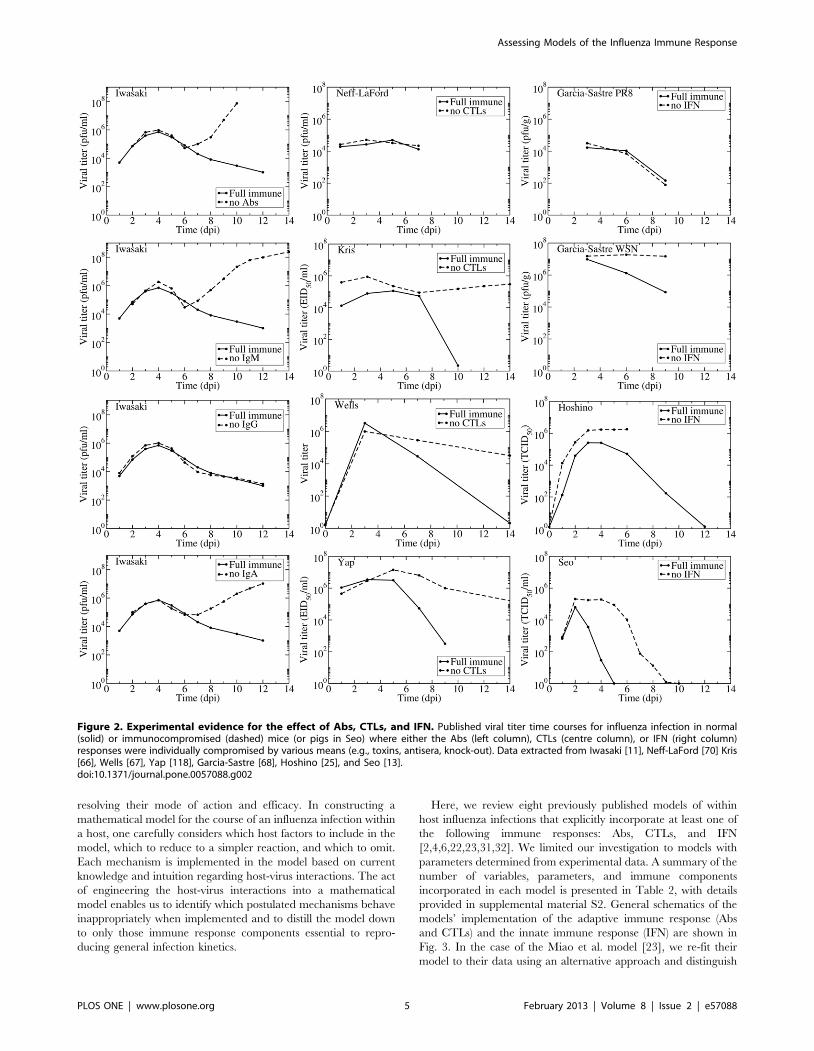
For Abs, we found only one experiment with complete viral
time courses with and without various Ab isotypes. Iwasaki et al.
used either antisera to disable individual Ab isotypes (IgM, IgG,
and IgA) or B-cell depleted mice to disable all Abs [11]. In
addition to the viral titers shown in Fig. 2, Iwasaki et al. measured
time courses of each Ab isotype and IFN levels, but not CTL
levels. The thorough measurements made in this remarkable
experiment clearly establish that the antisera depleted Abs below
detection level while leaving the IFN response unaffected (not
shown here but appearing in the original publication). The viral
titer time courses show that Abs, specifically IgA and IgM Abs,
begin affecting viral titer levels around 6 days post-infection (dpi).
IgG Abs appear to have no effect on the course of the infection. In
the presence and absence of an Ab response, the viral titer first
peaks around 4 dpi after which it decreases slightly. At 6 dpi the
effect of Abs becomes apparent — without Abs viral titer increases
rapidly from this point, but with Abs there is a continued decline
in viral titer. These experiments indicate Abs play a critical role in
terminating the infection although they do not significantly affect
the initial viral titer peak.
Several experiments have studied the role of CTLs in influenza
infections. Three of the experiments presented here (Kris, Wells,
and Yap) use nude mice, which have a deteriorated or absent
thymus [66,67,69]. The remaining experiment by Neff-LaFord et
al. used TCDD, a toxin that depletes CD8z T cells [70]. Neither
of these methods completely eliminates the CTL response; nude
Assessing Models of the Influenza Immune Response
PLOS ONE | www.plosone.org 2 February 2013 | Volume 8 | Issue 2 | e57088

mice have at least *1,000-fold lower CTL levels in their lungs
compared to normal mice [67] while the TCDD-treated mice
have CTL levels *15% that of untreated mice [71]. An additional
concern with these experiments is that the depletion of CTLs can
also affect the amount of IFN [11,72] since CTLs are in part
responsible for producing the IFN-c response [81]. It is also known
that nude mice have functionally impaired B cells [82] which
could lead to an inadequate Ab response in these mice. These
shortcomings could explain the wider variation in the predicted
role of CTLs. Neff-LaFord et al. found no significant difference in
viral titers between normal and CTL-depleted mice [70]. This
might be because TCDD treatment is not entirely effective at
disabling CTLs, or because data were only collected until 7 which
might be too early for CTLs to have significantly affected the viral
titer time course. The remaining three experiments suggest CTLs
begin to affect the viral titer time course anywhere between 5 to
8 dpi. In the absence of CTLs, all three experiments showed the
viral titer remaining elevated (but not growing as seen when
disabling Abs) for a long period of time. This suggests CTLs play a
role in the resolution of the infection but not in controlling viral
titer levels. These observations correspond with the immunocom-
promised patients discussed above who develop chronic influenza
infections with relatively constant viral titer levels.
Three experiments studied the effect of disabling IFN on the
course of an influenza infection. There are several types of
interferon: Type I interferons include IFN-a, IFN-b, and IFN-v
and type II interferons include IFN-c. The two types of IFN arise
from different genes [83], have different signalling pathways [84],
bind to different cell receptors [85] and lead to different antiviral
effects [86]. Mathematical models are not yet detailed enough to
differentiate between the different types of IFN, and the
experiments presented here appear to target both types of IFN,
and so we will not differentiate between the different types of IFN
for the remainder of the paper.
The three studies on the effect of IFN used different methods to
reduce or remove its effect. Garcıa-Sastre et al. used mice that had
a targeted disruption to the STAT1 gene and as such could not
respond to IFN, and performed the experiments with two different
influenza A (H1N1) viruses: A/Puerto Rico/8/34 (PR8) and A/
Wisconsin/33 (WSN) [68]. Hoshino et al. used an anti-IFN (type
not specified) serum to neutralize the IFN response in mice
infected with PR8 [25]. Rather than modifying the host response,
Seo et al. compared infection with a wild-type PR8 virus to that
with a recombinant PR8 virus made resistant to the antiviral
effects of IFN via substitution of aspartic (D) with glutamic (E) acid
at position 92 of NS1 (D98E) [13]. While Hoshino et al. showed
that IFN largely remained below detection level during their
experiment, it is not possible to confirm the degree of IFN
inhibition in the Garcia-Sastre et al. and Seo et al. experiments as
their approach aimed to suppress IFN activity rather than IFN
itself [87–89]. In the experiments by Hoshino et al. and Seo et al.,
IFN begins acting early in the infection (1–2 dpi), generally
Figure 1. Duration of viral shedding in immunocompromised patients. (Left) The reported duration of viral shedding for individualimmunocompromised patients infected with influenza as chronicled in the literature is indicated by bar length. Infection outcome is indicated (diedor recovered) when known, or labelled as unreported with ‘?’. (Right) Viral titer time courses of immunocompromised patients infected with influenza.Since all patients were treated with various courses of antivirals and given the prolonged shedding in these patients, recovery is most likely due tothe eventual success of antiviral therapy rather than to clearance of the infection by the limited host immune response.doi:10.1371/journal.pone.0057088.g001
Assessing Models of the Influenza Immune Response
PLOS ONE | www.plosone.org 3 February 2013 | Volume 8 | Issue 2 | e57088

reducing viral load and viral titer peak. This was not the case in the
two experiments by Garcia-Sastre et al. which measured no effect
on the control of a PR8 infection when the IFN response was
disabled, while more sustained titers were observed for WSN
infections in the absence of an IFN response. According to Garcia-
Sastre et al. the difference in the tissue tropism between the PR8 and
WSN strains is responsible for this difference, with PR8 spread
being limited by both tissue tropism and the IFN response and WSN
spread being limited only by the IFN response. Interestingly, both
Garcia-Sastre et al. and Hoshino et al. considered PR8 infections in
mice and reported lung homogenate titers, so differences in their
results are likely attributable to the different methods used to hinder
the IFN response. Overall, the data are not entirely consistent but
suggest that the presence of IFN decreases the viral load and that its
absence can lead to more sustained viral titer. However, the data
were too limited to show whether the absence of an IFN response
alone can lead to chronic infection.
Mathematical models to probe the role of the immuneresponse
Mathematical models are valuable tools in identifying the key
players of the immune response against an infection and in
Table 1. Details of infections of immunocompromised patients.
Paper Medical condition Strain Antiviral treatmenta
Anton [47] chronic lymphocytic leukemia A/pH1N1b ost, zvr
Baz [43] SCIDc (SCT)d A/H3N2 ost, amt, zvr
Boivin [48] chronic lymphoid leukemia A amt, rbv
Campanini [49] acute lymphoid leukemia A/H1N1 ost
Cohen-Daniel [51] acute monocytic leukemia (SCT) A/H3N2 ost
Couturier [52] (case 1) multiple myeloma (SCT) A/pH1N1 ost, zvr
Couturier [52] (case 2) multiple myeloma (SCT) A ost, zvr
CDC [50] (case 1) leukemia (SCT) A/pH1N1 ost
CDC [50] (case 2) leukemia (SCT) A/pH1N1 ost, rmt, zvr, rbv
Evans [60] Human immunodeficiency virus (HIV) A rmt
Gooskens [44] (case 1) SCID A/H3N2 ost
Gooskens [44] (case 2) Non-Hodgkin lymphoma (SCT) A/H3N2 ost
Gooskens [44] (case 3) Non-Hodgkin lymphoma A/H3N2 none
Gooskens [44] (case 4) Anaplastic large cell lymphoma (SCT) B none
Gooskens [44] (case 5) Non-Hodgkin lymphoma A/H3N2 none
Gooskens [44] (case 6) Non-Hodgkin lymphoma (SCT) A/H1N1 none
Gooskens [44] (case 7) Acute myelogenous leukemia (SCT) B none
Gooskens [44] (case 8) Acute myelogenous leukemia (SCT) A/H1N1 none
Gubareva [53] chronic myelocytic leukemia B rbv, zvr
Hill-Cawthorne [54] Hodgkin lymphoma (SCT) A/pH1N1 ost, zvr
Ison [55] (case 1) myelomonocytic leukemia (SCT) B ost, rbv
Ison [55] (case 2) chronic lymphocytic leukemia A/H3N2 ost, rmt, zvr
Klimov [56] (case 1) SCID (SCT) A/H3N2 amt
Klimov [56] (case 2) acute myelogenous leukemia (SCT) A/H3N2 amt
Mehta [57] (case 1) myelodysplastic syndrome (SCT) A/pH1N1 ost, pvr
Mehta [57] (case 2) acute myelogenous leukemia A/H1N1 ost, pvr, zvr
Pinsky [46] Wiskott-Aldrich syndrome (SCT) A/H1N1 unknown
Renaud [58] (case 1) acute myeloblastic leukemia (SCT) A/pH1N1 ost, pvr, rbv, rmt, zvr
Renaud [58] (case 2) acute myeloblastic leukemia (SCT) A/pH1N1 ost, rbv, rmt, zvr
Renaud [58] (case 3) chronic myeloblastic leukemia (SCT) A/pH1N1 ost
Renaud [58] (case 4) acute lymphoblastic leukemia A/pH1N1 ost, zvr
Renaud [58] (case 5) Hodgkin lymphoma A/pH1N1 ost, pvr, rbv, rmt
Renaud [58] (case 6) acute lymphoblastic leukemia (SCT) A/pH1N1 ost
van der Vries [59] chronic lymphocytic leukemia A/H1N1 ost, amt, zvr
Weinstock [45] acute lymphocytic leukemia A/H1N1 ost, amt, zvr, rmt
a Antiviral abbreviations are as follows: oseltamivir (ost), amantadine (amt), rimantadine (rmt), ribavarin (rbv), zanamivir (zvr), peramivir (pvr).b A/pH1N1: 2009 pandemic H1N1.c SCID: Severe combined immunodeficiency disease.d SCT: Stem cell transplant.doi:10.1371/journal.pone.0057088.t001
Assessing Models of the Influenza Immune Response
PLOS ONE | www.plosone.org 4 February 2013 | Volume 8 | Issue 2 | e57088
resolving their mode of action and efficacy. In constructing a
mathematical model for the course of an influenza infection within
a host, one carefully considers which host factors to include in the
model, which to reduce to a simpler reaction, and which to omit.
Each mechanism is implemented in the model based on current
knowledge and intuition regarding host-virus interactions. The act
of engineering the host-virus interactions into a mathematical
model enables us to identify which postulated mechanisms behave
inappropriately when implemented and to distill the model down
to only those immune response components essential to repro-
ducing general infection kinetics.
Here, we review eight previously published models of within
host influenza infections that explicitly incorporate at least one of
the following immune responses: Abs, CTLs, and IFN
[2,4,6,22,23,31,32]. We limited our investigation to models with
parameters determined from experimental data. A summary of the
number of variables, parameters, and immune components
incorporated in each model is presented in Table 2, with details
provided in supplemental material S2. General schematics of the
models’ implementation of the adaptive immune response (Abs
and CTLs) and the innate immune response (IFN) are shown in
Fig. 3. In the case of the Miao et al. model [23], we re-fit their
model to their data using an alternative approach and distinguish
Figure 2. Experimental evidence for the effect of Abs, CTLs, and IFN. Published viral titer time courses for influenza infection in normal(solid) or immunocompromised (dashed) mice (or pigs in Seo) where either the Abs (left column), CTLs (centre column), or IFN (right column)responses were individually compromised by various means (e.g., toxins, antisera, knock-out). Data extracted from Iwasaki [11], Neff-LaFord [70] Kris[66], Wells [67], Yap [118], Garcia-Sastre [68], Hoshino [25], and Seo [13].doi:10.1371/journal.pone.0057088.g002
Assessing Models of the Influenza Immune Response
PLOS ONE | www.plosone.org 5 February 2013 | Volume 8 | Issue 2 | e57088

these two fits of the same model as Miao split (our fit) and Miao
full (published). See the Methods section for details.
Each of these models can reproduce the experimental infection
kinetics against which they were originally validated. By perturb-
ing these models from their basic behaviour, we can test their
biological fidelity by determining whether in the presence of
immune suppression they reproduce the experimental kinetics
presented above. Fig. 4 presents the viral titer time course
predicted by each model under various conditions of immune
suppression while Fig. 5 explores the predicted effect of
suppressing Abs (second row), CTLs (third row), or IFN (fourth
row), individually, on the time course of viral titer and fraction of
infected and uninfected cells. To facilitate comparison of the
behaviour of the various models, all model parameters were scaled
so that in the presence of their full immune response, they produce
a viral titer time course that peaks at an arbitrary value of 1 (see
Methods for details). We assume the infection is symptomatic
during any period where the viral titer is above a value of 0.01 (1%
of the peak viral titer) as used previously by Dobrovolny et al.
[8,90], and this threshold is indicated by a dashed line in Fig. 5.
The models predict very different viral titer time courses when
immune responses are all disabled, ranging from chronic (Fig. 4,
Bocharov) or long-lasting (Fig. 4, Miao full) infections, to slowly
decaying (Fig. 4, Miao split) or very short-lived (Fig. 4, Baccam)
infections. In almost all cases, the infection is target-cell limited,
which means that the infection resolves because all cells have been
infected and have died (Fig. 5, left column). The exceptions are the
Bocharov model, which predicts a chronic infection, and the
Handel model, in which a small fraction of cells (*3%) are
preserved. The finite number of target cells in these models means
that viral growth will always be bounded with the upper limit on
the number of viruses given by Vmax~T0ptI , where T0 is the
initial number (or maximum number) of cells available for
infection, p is the production rate and tI is the average lifespan
of an infectious cell. Each target cell, once infected can only
produce a finite number of viral particles during its infectious
lifespan. As long as the number of target cells remains bounded,
which is the case in these models, virus will also remain bounded.
In the absence of an immune response, the viral titer time
course should resemble that seen in immunocompromised
patients, namely, sustained high viral titers that last for weeks or
even months, as discussed above. Instead, most of the mathemat-
ical models predict the infection will resolve without the aid of an
immune response within a week (Fig. 4). The exceptions are the
two Miao models, which produce long-lasting high viral titers, and
the Bocharov model, which predicts a true chronic infection. In
Miao full, the long-lasting infection is due to poor viral clearance
such that while the infection has resolved, the ineffective viral
clearance leads to high levels of lingering free virus. In Miao split,
it is due to the somewhat long average lifespan of infected cells
(*2 d). Unfortunately, neither of these mechanisms can cause the
weeks-long, sustained, high viral titers observed in immunocom-
promised patients. The Bocharov model seems to provide the best
representation of an infection in an immunocompromised patient
— the chronic infection persists because cell regeneration provides
an endless supply of susceptible cells that allow the infection to
persist. It is also important to note that completely disabling the
immune response in these models does not correspond to the
infection progression in the absence of an immune response.
Instead, it corresponds to an infection in which the immune
response components explicitly included in the model (e.g., IFN,
CTLs, Abs) have been disabled. For example, disabling Abs and
IFN in the Handel model, which does not explicitly include CTLs,
leaves the CTL response intact because the model implicitly takes
it into account via the remaining infection parameters of the model
(such as the lifespan of infected cells).
Going beyond the qualitative changes to the viral titer time
course brought about by Abs, CTLs, and IFN, Fig. 6 offers a
quantitative analysis of their relative contribution to decreasing
various measures related to the severity of the infection in a
patient. For example, we take the peak viral titer to be an
approximate measure of the degree of dissemination of the virus
within the patient with higher viral loads representing a more
disseminated infection. The duration of the symptomatic infection,
measured here as the time spent by the viral titer curve over a titer
of 0.01 (i.e., above 1% of its peak value, as used in [8,90]), gives a
measure of infection duration and helps distinguish short-lived
seasonal infections from more severe or chronic infections. The
area under the viral titer curve (AUC) is related to the total
amount of virus shedding, and so can be linked to the person-to-
person transmission rate of the infection [7,61,91]. Finally, the
fraction of dead cells at the end of the infection measures the
amount of epithelium destruction caused by the infection and can
be used to assess the severity of the infection. Together, these
measures provide an overview of the infection course which we use
to assess how effective various immune responses are in
modulating infection severity and patient outcomes. Fig. 6 presents
the percent increase in each severity measure that results from the
suppression of either Abs, CTLs, or IFN as determined from the
experimental data (bottom row) and from the mathematical
models (top row). The duration of experimental infections
presented in this figure depict a minimum percent increase
because the duration of infections cannot be measured exactly (see
supplemental material S1), but a minimum value can be estimated.
In addition to examining the models’ predictions of the infection
process in the absence of various immune components, we also
consider whether the models accurately replicate the time course
of the immune response itself. Fig. 7 compares the levels of Abs,
CTLs, and IFN over the course of an influenza infection observed
experimentally to those predicted by the mathematical models.
In the following sections, we’ll discuss the effect of Abs, CTLs,
and IFN, independently, in terms of their predicted kinetics and
respective significance in modulating infection severity according
to the various models.
Antibodies. In models that consider Abs (Bocharov, Hancio-
glu, Lee, Handel, Miao), the Abs act by binding to and removing
virus. The manner in which the generation and loss of Abs is
implemented, however, varies between models. In the Bocharov
model, Abs are produced by plasma cells whose formation is
determined by B cells and helper T cells. In the Hancioglu model,
Abs are produced by plasma cells that have been activated by the
presence of antigen presenting cells. In the Lee model, Abs are
produced by short-lived and long-lived plasma cells that have
differentiated from B cells. All of these models include decay of
Abs; the Bocharov and Hancioglu models also include loss of Abs
due to binding with virus. The Miao model uses actual Ab levels
from influenza-infected mice. The Handel model neglects Ab
decay and assumes Abs grow proportionally to both viral titer and
their own concentration, with the latter mechanism meant to
emulate clonal expansion of Ab-generating B cells, which are not
explicitly represented in the model.
The Ab time courses as predicted by each model are shown in
Fig. 7 (left column) along with experimentally determined Ab time
courses for comparison. It is interesting that several of the models
predict a much greater fold change in Abs over the course of the
infection than is actually observed experimentally [11,23]. Only
the Lee and Miao models match the *20-fold increase between
4–7 dpi that is seen in experiments. Abs in the Handel model
Assessing Models of the Influenza Immune Response
PLOS ONE | www.plosone.org 6 February 2013 | Volume 8 | Issue 2 | e57088

begin at very low levels and appear to be rising too slowly. Abs in
the Hancioglu and Bocharov models also begin at low levels, but
they rise abruptly around 3–4 dpi.
It is of particular interest to compare the predictions of the Miao
split and Miao full models. These models differ only in their fitting
procedure; the equations and Ab data are the same. However, the
two models predict vastly different effects for Ab removal on the
course and severity of influenza infection (Fig. 4, second row). In
fitting the Miao split model, we assumed there is no immune
response in the first days of the infection, since the data indicates
the immune response up to that point is small. The Miao full fit
includes the immune response over the entire time course. It is
clear that even if the immune response is small during that initial
time frame, this initial kinetics difference can have a significant
impact on the predicted later time course of the disease.
Despite differences in the Abs and viral kinetics predicted by the
various models, all the models are mostly consistent on the
predicted effect and importance of Abs in the control of the
infection. The models suggest Abs are the most important in
reducing the duration of the infection and viral titer AUC (Fig. 6,
right). The experimental data suggest that Abs substantially reduce
the peak viral titer and viral titer AUC, while IgM and IgG
antibodies shorten the duration of the infection. While most
models predict that removal of Abs has little effect on the initial
peak viral titer (Fig. 5, second row, left), consistent with
experimental data, the Handel model, not surprisingly, best
reproduces the Iwasaki data [11] because it was fit against this data
(Fig. 4). The Bocharov model predicts that removal of Abs results
in a chronic infection, a feature consistent with chronic infections
of immunocompromised patients, but does not produce the
increasing viral titers seen in the Iwasaki data [11] (Fig. 4).
Most of the models predict the removal of Abs has little effect on
the fraction of infected cells over the course of the infection (Fig. 5,
second row, centre), although the Handel model predicts the
number of infected cells will have two peaks in the absence of Abs.
Most of the models also predict Abs are not effective in protecting
the epithelium by decreasing the fraction of cells infected and
killed by the infection (Fig. 5, second row, right, and Fig. 6, right
column) with the exceptions again being the Handel and Bocharov
models. The Handel model predicts the removal of Abs will result
Figure 3. Mathematical models of the adaptive (top) and innate (bottom) immune responses to influenza. The adaptive immuneresponse typically includes Abs and CTLs. The generation of Abs and CTLs are represented with different simplifying assumptions, so the actualprocesses are not depicted here. All models reviewed here assume that Abs bind to and remove virus while CTLs cause the death of infectious cells.The innate immune response is represented by IFN. Since IFN has many antiviral effects in vivo, models have different implementations of IFN’s effect.Details of individual models are discussed in the text and in Supplement S2.doi:10.1371/journal.pone.0057088.g003
Assessing Models of the Influenza Immune Response
PLOS ONE | www.plosone.org 7 February 2013 | Volume 8 | Issue 2 | e57088

in *95% of susceptible cells being killed, whereas only *20% are
killed when Abs are present; this is because the rapid generation of
Abs greatly reduces the viral titer resulting in a less severe
infection. In the Bocharov model, whereas in the presence of Abs
the epithelium recovers and is fully regenerated, their absence
results in a chronic infection with continuous involvement of
*60% of the epithelium.
The results of our assessment of models incorporating Abs are
rather mixed. We find that while the Handel model most faithfully
reproduces the experimental predictions of viral titer time courses
in the presence and absence of Abs, it does not accurately capture
the dynamics of the Abs themselves. The Lee model provides a
better representation of the time course of Abs and the Miao
model uses experimentally measured Ab time courses, although
neither model properly replicates the effect of Abs on infection
kinetics.
Cytotoxic T lymphocytes. Models that incorporate CTLs
(Bocharov, Hancioglu, Lee, Miao) implement the action of CTLs
as binding to and removing infectious cells. Again, the implemen-
tation of the growth and decay of CTLs in different models causes
differences in the predicted dynamics. The Bocharov model
assumes that the growth rate of CTLs is proportional to the
population of antigen presenting macrophages and helper T cells.
The Hancioglu model assumes it is proportional to the population
of antigen presenting cells and other CTLs. In both models, CTLs
are removed either through binding with an infected cell or decay
at a constant rate. The Lee model assumes that activation,
proliferation, and decay of CTLs is proportional to availability of
mature dendritic cells, with no loss of CTLs due to binding with
infected cells. The Miao model uses data collected from influenza
infections of mice directly in their model rather than modelling
CTL kinetics (growth and decay) as an additional equation.
The CTL kinetics time course in Miao [23] indicates a sharp
rise of CTLs between 5–8 dpi with decay occurring in roughly
three stages: a sharp drop within *1–2 days followed by a slower
decay over the next *4–5 days and a much slower drop to pre-
infection levels over the next week (Fig. 7). A second experimen-
tally determined time course [24] shows a smaller change in CTLs,
with a rise in CTLs occurring between 7–10 dpi. Two of the
models, Hancioglu and Lee, predict the appearance of CTLs
somewhat earlier, around 4 dpi.
Despite differences in CTL and viral kinetics between models,
all consistently predict CTLs have little or no effect on the course
of the infection (Fig. 5, third row, and Fig. 6, centre column).
When effective, as in the Lee and Hancioglu models, they act to
mildly decrease infection duration and viral titer AUC. However,
removal of the action of CTLs in the models does not lead to
sustained, high viral titer or dramatically reduced viral clearance
in contrast with what is typically observed experimentally (Fig. 2,
centre column). While the models predict little change in the
severity of the infection when CTLs are removed, the experimen-
tal data suggest that CTLs can substantially reduce viral titer peak,
symptomatic duration and viral titer AUC. This discrepancy likely
arises because the experimental data against which these models
were fitted were insufficient to characterize both the Abs and
CTLs’ effects independently, causing the parameter fitting routines
to ascribe the effect of the combined Ab and CTL response to just
Abs. The relatively minor role for CTLs in the models may also be
due to the fact that CTLs rise to significant levels only late in the
infection process (6–8 dpi). Thus CTLs would not play a role in
arresting the infection, but instead would ensure it is cleared
effectively to prevent reinfection of newly regenerated epithelium
which, if re-infected, could fuel a chronic infection like those
established in immunocompromised patients. None of the models
predict the establishment of a chronic infection in the absence of
CTLs.
Interferon. The immune component that has the most
varied model implementations is IFN (Fig. 3). Although IFN is
known to have many antiviral effects [78–80,84], it is unclear
which effect has the most impact on the course of the infection and
should be included in a model. In the Bocharov model, IFN is
produced by IFN-secreting macrophages and disappears via
nonspecific clearance and absorption by target cells causing the
latter to become resistant to infection. This protection wanes over
time at a constant rate and these uninfected, protected cells
gradually become susceptible to infection once again. In the
Hancioglu model, IFN also confers a resistance to infection that
slowly decays over time. IFN in the Hancioglu model is produced
by both infected cells and antigen presenting cells and disappears
via absorption by uninfected cells and clearance at a constant rate.
In the Saenz model, IFN has a similar action but cells protected by
IFN first become partially resistant and can either become
permanently resistant or become infected. In the Saenz model,
Table 2. Summary of the models presented in this analysis.a
Model Nvar Npar Ndata Host Regen. Abs/CTL/IFN Other cells
Bocharov [2] 13 49 19 Human yes Abs/CTL/IFN Antigen-presenting macrophages, T and B helper cells,B cells, plasma cells, IFN-producing macrophages.
Baccam [4] 6 9 36 Human no IFN —
Hancioglu [31] 10 28 0b Human yes Abs/CTL/IFN Antigen-presenting macrophages, plasma cells.
Lee [22] 15 48 42 Mouse yes Abs/CTL Dendritic cells, naive and effector CD4z T cells, naiveCD8z T cells, naive and activated B cells, Long- andshort-lived plasma cells.
Handel [6] 6 8 50 Mouse yes Abs/IFN —
Miao [23]c 6 8 64 Mouse yes Abs/CTL —
Saenz [32]d 8 12 96 Horse no IFN —
Pawelek [37]d 5 11 90 Horse no IFN —
a Nvar (number of variables), Npar (number of parameters), Ndata (number of data points), Regen. (whether the model includes cell regeneration).b Model was not mathematically fit to data, but did have to conform to some general criteria.c We consider two different parameter sets for this model (Miao split and Miao full). The differences between these two models are described in Methods.d The Saenz and Pawelek models were fit to the same data.doi:10.1371/journal.pone.0057088.t002
Assessing Models of the Influenza Immune Response
PLOS ONE | www.plosone.org 8 February 2013 | Volume 8 | Issue 2 | e57088

Figure 4. Effects of the immune response on an influenza infection as predicted by mathematical models. The models summarized inTable 2 are used to predict the viral titer time course for influenza infections under various conditions of immune suppression (the ‘–’ sign indicatesthe component is suppressed). Viral titers for all models have been scaled to peak at 1.0 in the presence of the full immune response to facilitatecomparison.doi:10.1371/journal.pone.0057088.g004
Assessing Models of the Influenza Immune Response
PLOS ONE | www.plosone.org 9 February 2013 | Volume 8 | Issue 2 | e57088

IFN is produced by infected cells and by latently infected, partially
resistant cells and decays at a constant rate. The Pawelek model
was proposed as an improvement to the Saenz model and was fit
to the same data. In the Pawelek model, IFN is produced by
infected cells and causes target cells to become resistant to
infection. The resistance wanes over time and the resistant cells
will eventually become susceptible to infection. Additionally, IFN
stimulates production of natural killer (NK) cells which target and
kill infected cells. While NK cells are not explicitly included in the
model, their effect is assumed to be proportional to the amount of
IFN that stimulated their growth. In the Handel model, IFN grows
at a rate proportional to the viral load and decays at a constant
rate. IFN in the Handel model reduces the production rate of virus
by infectious cells, similar to the manner in which the action of
neuraminidase inhibitors is typically implemented in these models
[4,7,8,90]. In the Baccam model, IFN reduces the viral production
rate as in the Handel model, but also acts to lengthen the duration
of the eclipse phase in newly infected cells. IFN in the Baccam
model grows at a rate proportional to the number of infected cells
with a delay of half a day and decays at a constant rate.
IFN kinetics are somewhat consistent across experiments,
peaking typically around day 2–3 post-infection, except in [11]
where it peaks at 5 (Fig. 7, right column). With the exception of the
Bocharov model, the models generally agree with the experimental
Figure 5. Effect of suppressing Abs, CTLs, or IFN on an influenza infection as predicted by mathematical models. The effect ofsuppressing each immune component on the time course of the viral titer (left column), and on the fraction of infected (centre column) anduninfected (right column) cells during an influenza infection. The top row illustrates infection kinetics in the presence of a full immune response withsubsequent rows showing infection kinetics in the absence of Abs only (second row), CTLs only (third row), or IFN only (bottom row). The dashedlines indicate an approximate symptomatic threshold as defined in [8,90].doi:10.1371/journal.pone.0057088.g005
Assessing Models of the Influenza Immune Response
PLOS ONE | www.plosone.org 10 February 2013 | Volume 8 | Issue 2 | e57088

time course for IFN concentration. The Bocharov model predicts
a dramatic rise in IFN almost immediately upon infection, after
which IFN remains constant from 1–4 dpi until the infection
begins to resolve. And because the Bocharov model predicts IFN
levels remain constant over much of the infection, IFN does not
contribute in a measurable way to the infection dynamics of that
model.
The models (Bocharov, Hancioglu, Handel, Saenz, Pawelek,
Baccam) consistently predict IFN confers significant protection of
the respiratory tract. Suppressing the effect of IFN in the models
leads to far larger numbers of dead cells (Fig. 5, bottom right, and
Fig. 6, upper right), with the exception of the Baccam model in
which all cells are consumed irrespective of IFN levels. The effect
of IFN on the viral titer time course is mostly consistent across the
different models (Fig. 5, bottom left), with its absence leading to
viral titers peaking later and at higher levels resulting in a longer-
lasting, more severe infection with a higher viral titer AUC
(Handel, Saenz, Baccam, Pawelek). This is consistent with
Figure 6. Immune kinetics and its effect on disease severity. The percent increase in peak viral titer, symptom duration, AUC of viral titer, andproportion of dead cells when the effect of Abs (left), CTLs (centre), or IFN (right) is removed in various mathematical models (colour-coded) ofinfluenza infections (top row) or from experimental data (bottom row). Note that a negative percent increase for a given measure indicates a decreaseof that measure in the absence of that immune response.doi:10.1371/journal.pone.0057088.g006
Figure 7. Time course of Abs, CTLs, and IFN. The time courses predicted by models (top row) and experimentally determined time courses(bottom row) for Abs (left), CTLs (centre), and IFN (right). All data has been scaled to peak at 1.0. Experimental data are collected from mice unlessotherwise indicated.doi:10.1371/journal.pone.0057088.g007
Assessing Models of the Influenza Immune Response
PLOS ONE | www.plosone.org 11 February 2013 | Volume 8 | Issue 2 | e57088

experimental infections that examine the effect of IFN and predict
that absence of IFN leads to a higher viral titer peak, longer-lasting
infection with a larger AUC (Fig. 6, bottom right). The Pawelek
model depicts an interesting variation of these general dynamics;
while a lack of IFN increases the duration of symptomatic duration
of the infection (the time when viral titer is greater than 10{2), the
duration of the entire infection actually decreases in the presence
of IFN. The presence of IFN in this model causes a plateau in the
viral titer due to waning resistance causing low levels of virus to
linger. In the Hancioglu model, however, suppression of IFN
actually leads to a more subdued infection of shorter duration and
smaller viral titer AUC (Fig. 4). This is due to the protection
conferred to uninfected cells by IFN: as IFN levels decay and
protection wanes, these cells become available for infection at a
time when most susceptible cells have already been consumed. As
these cells progressively re-enter the depleted pool of susceptible
cells, they rekindle the infection, allowing it to go on a little longer.
Suppressing IFN in the Hancioglu model removes this partial
protection and allows the infection to proceed through all
susceptible cells without delay and resolve more rapidly. This
does not occur in the Saenz model because IFN protection in that
model does not wane.
The higher, delayed viral titer peak predicted by the models
when the action of IFN is suppressed is similar in the experimental
suppression experiments (Fig. 2, right column vs Fig. 5, bottom left
and Fig. 6, right column), but no model reproduces the longer-
lasting, sustained titers observed experimentally when IFN is
suppressed. Overall, the Handel, Saenz, Pawelek and Baccam
models all fare equivalently well when confronted with viral titer
data — they all display a higher viral titer peak and longer
infection duration in the absence of IFN, consistent with
experimental observations. If the extent of respiratory tract
damage could be measured in IFN suppression experiment, it
would be possible to test these models’ prediction regarding IFN’s
protective role.
Neuraminidase inhibitor treatmentAn important application of within host models of in vivo
infections is to evaluate and optimize antiviral therapies; models
can be used to extract the efficacy of antiviral treatment from
patient viral titer time courses or to simulate a broad range of
doses to determine the best treatment protocols prior to clinical
trials. Models of viral decay rates for chronic infections with the
human immunodeficiency virus (HIV) or the Hepatitis B and C
virus under antiviral therapy have provided key insights into the
kinetic parameters driving the infection and the efficacy of the
therapy [35,92,93].
Unfortunately, several factors prevent within host models from
playing a bigger role in antiviral therapy optimization for
influenza. One such factor is the acute, short-duration nature of
influenza infections. Viral titers from uncomplicated influenza
infections are detectable for no more than 4–8 d. Unless samples
are taken at least daily, one can at best hope to obtain 8 time
points which are often insufficient to characterize the widely varied
viral kinetics across individuals over that period. Another
important obstacle has been the absence of a valid within host
model to capture the kinetics of severe influenza infections
characterized by more sustained viral titers. Indeed, mathematical
models provide a reasonable fit to viral kinetics from acute,
uncomplicated influenza infections, but none can believably
reproduce the chronic infections observed in immunocompro-
mised patients or the longer lasting infections seen in children
and/or in patients infected by novel, pandemic strains. This
weakness is an issue since it is primarily these cases that will
require antiviral therapy, whereas therapy is not typically
administered in uncomplicated cases. A major obstacle to
developing such models is the lack of knowledge and factual,
quantitative evidence as to what factor(s) are responsible for the
more severe, longer-lasting infections. At this time, possible
culprits include cell tropism, lack of pre-existing immunity, and
hypercytokinemia. But the relative role of each of these factors has
not been elucidated.
Using the models described above, we can investigate the
prediction of each model regarding the efficacy of treatment with
neuraminidase inhibitor (NAI), both in the presence and absence
of the immune responses that are implemented in each model.
NAIs inhibit release of newly produced virus from the surface of
the infected cells that produced them. Since viral release is not
explicitly represented in any of the mathematical models surveyed
here, the action of NAIs in all models is implemented as a
reduction in the rate of virus production by infected cells [94,95],
such that: p?(1{e)p, where 0veƒ1 is the antiviral efficacy and
represents the fraction of inhibition achieved. Prior to initiation of
antiviral therapy e~0, and for simplicity it is instantaneously set to
the desired value and held constant thereafter for the remainder of
the infection. Note that antiviral efficacy, e, can be related to
physiological antiviral concentrations through use of a PD model
relating effect to concentration of drug in the plasma, for example,
an Emax model [96]. Patients typically seek treatment shortly after
symptom onset, which typically occurs 1–2 dpi [20,39]. Therefore,
in all models, with the exception of the Handel model, treatment is
initiated when the viral titer crosses the symptomatic threshold, i.e.
1% of the peak viral titer. In the Handel model, we initiate
treatment at 36 hpi because the initial viral titer in this model is
higher than the symptomatic threshold we defined. We use a drug
efficacy of e~0:98, as estimated for NAIs in previous modelling
efforts [4,7], and examine the effects of NAI treatment in the
presence of a full immune response as well as in the absence of
various immune responses.
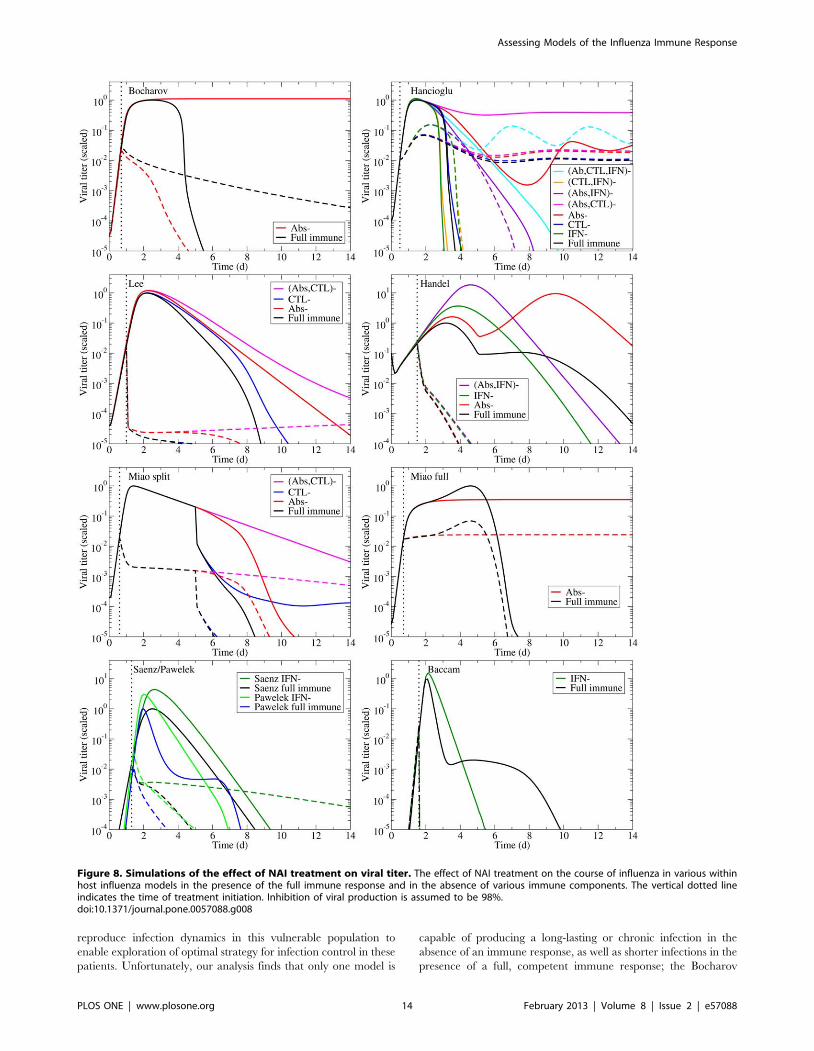
Most of the models predict treatment with NAIs results in a
rapid decay of the viral titer (Fig. 8), yielding a reduced viral titer
peak and a shorter infection. This behaviour is consistent with
what is typically observed in treated patients [39,97]. A glaring
exception is the Hancioglu model which predicts that although
NAIs will lower the peak viral titer, they will also increase the
duration of the infection because of the protective action of IFN.
When IFN therapy is applied in the Hancioglu model, it slows
infection progression such that IFN-protected cells lose their
resistance before the infection has been effectively cleared and
become infected. This coupled with target cell regeneration leads
to sustained infections in the presence of NAIs.
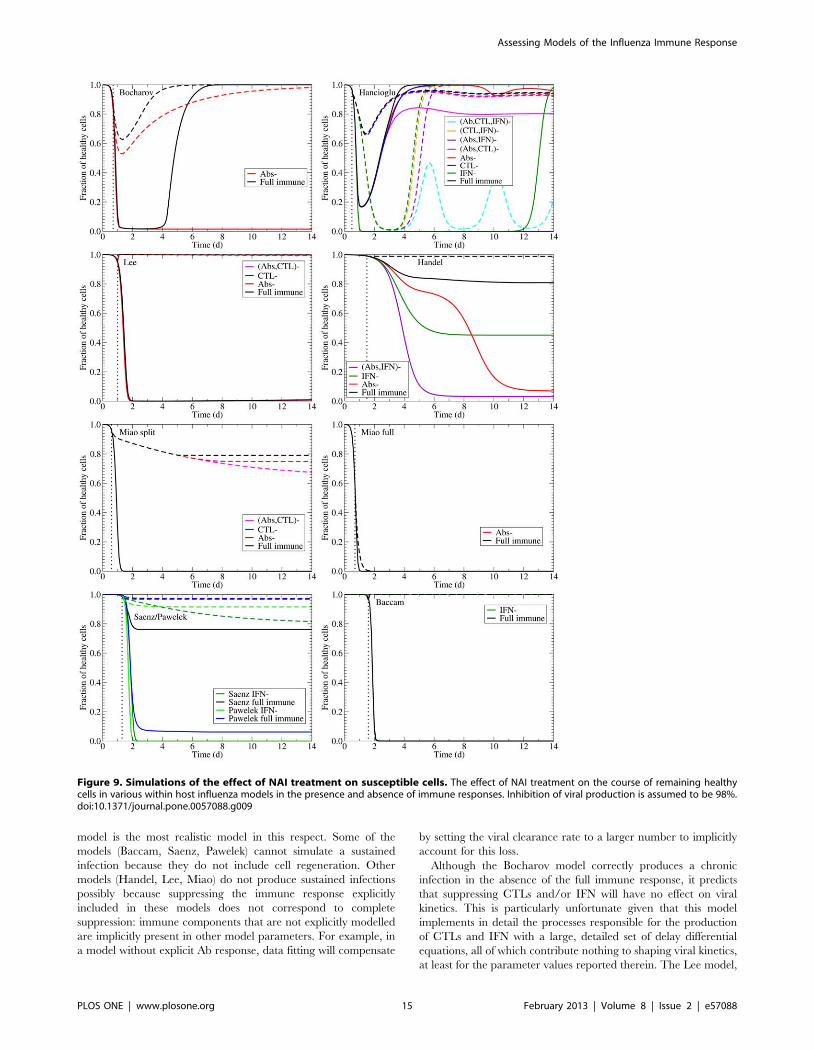
A further measure of a drug’s ability to minimize illness is the
degree to which it confers protection to susceptible cells and limits
damage. The effect of NAIs on the fraction of uninfected cells
(including those protected by IFN) untouched by the infection is
shown in Fig. 9 in the presence of the full immune response and in
the absence of various immune components. Most of the models
predict NAIs will provide significant protection of the epithelium
from damage. The most striking of these are the Baccam and Lee
models, which predict almost complete death of the epithelial layer
for untreated infection and almost complete protection with NAI
treatment. The exceptions are again the Hancioglu and Miao
models. The Hancioglu model predicts a longer-lasting infection
with NAI treatment that leads to greater cell death, while the Miao
model predicts a target cell limited infection even in the presence
of NAIs.
Assessing Models of the Influenza Immune Response
PLOS ONE | www.plosone.org 12 February 2013 | Volume 8 | Issue 2 | e57088
Discussion
Approach to assessing modelsMechanistic models are valuable tools in identifying the key
players of the immune response against an infection and in
resolving their mode of action and efficacy [98]. In constructing a
mathematical model for the course of an influenza infection within
a host, one carefully considers which host factors to include in the
model, which to reduce to a simpler reaction, and which to omit
[99]. Each mechanism is implemented in the model based on
current knowledge regarding host-virus interactions. The act of
engineering the host-virus interactions into a model enables us to
identify which postulated mechanisms behave inappropriately
when implemented [100] and to distill the model down to only
those immune response components that are essential to
reproducing general infection kinetics.
The approach used here was aimed at assessing strengths and
weaknesses of currently available models of influenza infection.
Models have two sources of error that must be considered,
parameters and structure [101]. One way to assess the adequacy of
a mechanistic model is to compare model predictions with
experimental data that were not used for estimating parameters
in a process called validation aimed at determining whether a
model can be appropriately used for its intended purpose
[102,103]. Regardless of how well model simulations match the
data used to derive the model parameters, if the model cannot
reproduce data from other experiments, then it can be concluded
that the model structure or parameters are inadequate. We use the
commonly used approach of visual inspection to qualitatively
determine the ability of the model to reproduce the shape of the
time course data of viral titers and immune response. The
mechanistic basis of a model that consistently reproduces the
general trend of the data under different conditions (e.g., whether
viral titer goes up or down or does not change in response to a
component of the immune response turning on or off) can be
viewed with more confidence than that of a model that agrees with
data only under certain conditions or that fits only a portion of the
data (e.g., viral titer in the first two days) perfectly.
Our purpose is to gain insight into the role the immune system
plays in influenza infections and to determine whether current
mathematical models of influenza infection are consistent with
available data to develop a predictive human model. Most of the
data used in the assessment were preclinical and while we cannot
expect human viral and immune kinetics to match preclinical data
exactly, the trends are expected to be similar. Likewise, one would
not expect a model developed from data for a given influenza
strain in a specific type of mouse to perfectly predict infection
dynamics in a different mouse type or for a different influenza
strain, but it should qualitatively capture key features of infection
kinetics. Therefore, we focus here qualitatively on whether an
immune response causes an expected outcome in the model,
instead of performing a quantitative comparison.
Implications of species differencesWe must be careful when extrapolating results from animals to
humans. Most of the preclinical data presented here comes from
mice, whose immune systems differ in some significant ways from
humans. Several mouse and human antibody classes differ [28,29],
particularly IgG antibodies, which appear to have evolved
independently in humans and mice [104] such that they have
different subclasses and functions. There are also differences in the
role of type I IFN [105,106]. In humans, type I IFN provides a
direct link between the innate and adaptive immune responses by
stimulating growth of Th1 cells. In mice, however, this signalling
pathway is not functional and growth of Th1 cells is stimulated by
Il-12 [106]. The time course and function of CTLs appears to be
similar in humans and mice for a primary infection [27]. In mice,
however, CTLs provide heterosubtypic immunity to infection,
which is not the case in humans who typically only have subtype-
specific immunity [107]. While these are important differences,
many of the models considered here do not include such specific
details. Current models are still trying to reproduce the general
features of influenza infection and the immune response. As
mathematical models become more detailed, these species
differences will need to be considered.
Of additional concern, mice are not natural hosts for influenza
and influenza viral strains sometimes need to be passaged several
times in mice before adapting to their new host [108], which leads
to changes in the RNA of the virus [109,110]. These viral genetic
changes can lead to changes in host immune response and viral
dynamics [108,110] making it difficult to extrapolate parameters
obtained from experiments in mice to dynamics in humans.
Limitations in available dataThe preclinical experimental data we have gathered provides a
general picture of the role of Abs, CTLs and IFN. Experiments in
which a specific component of the immune response is suppressed
offer important insight into the role of individual components of
the immune response. Although the data are limited, they suggest
that CTLs emerge late in a primary infection and contribute
mainly to clearing the infection; that Abs emerge sometime
between 4–6 dpi and play a significant role in the resolution of the
infection; and that IFN emerges early, disappears rapidly, and
typically reduces the peak viral titer. Unfortunately, the sparsity of
the data leaves an incomplete picture.
In many of the experiments, we do not know whether the
immune component was completely suppressed as it was not
measured. In some experiments, viral titer data are not sufficient
for ascertaining whether the full range of effects of the suppressed
immune component has been captured. In the case of Abs, we
found only one experimental study, and while the experiment itself
was thorough, corroborating data from similar experiments would
make a stronger case for the role of Abs.
Finally, some of the data are contradictory and need further
investigation. For example, the data from [68] show little to no
increase in the peak viral titer when IFN is removed, while data
from [25] and [13] show a clear change in viral titer peak. This
apparent discrepancy could be due to a number of factors,
including insufficient data in the face of inter-host variability; an
insufficient suppression of the full range of action of IFN when its
action is suppressed only via STAT1 disruption; or the variability
of the IFN response induced by different strains.
Limitations in model structuresDespite the sparse data and the limitations of animal models, we
gleaned a general picture of the role of various immune
components and could thus test the accuracy of mathematical
models that include an immune response to influenza. As was
done in experiments, we systematically turned off the effect of each
of the immune components in the models. While all the models
assessed here were originally fit to experimental data and thus
correctly reproduce some facet of influenza infections, our simple
test produced surprising, and sometimes unrealistic, predictions.
Primary influenza infections (e.g., with novel strains) typically
last longer than secondary infections due to the delayed or weak
adaptive immune response mounted against them [9,10]. Immu-
nocompromised patients can shed virus for weeks or even months
[43–60]. It is important that mathematical models be able to
Assessing Models of the Influenza Immune Response
PLOS ONE | www.plosone.org 13 February 2013 | Volume 8 | Issue 2 | e57088
reproduce infection dynamics in this vulnerable population to
enable exploration of optimal strategy for infection control in these
patients. Unfortunately, our analysis finds that only one model is
capable of producing a long-lasting or chronic infection in the
absence of an immune response, as well as shorter infections in the
presence of a full, competent immune response; the Bocharov
Figure 8. Simulations of the effect of NAI treatment on viral titer. The effect of NAI treatment on the course of influenza in various withinhost influenza models in the presence of the full immune response and in the absence of various immune components. The vertical dotted lineindicates the time of treatment initiation. Inhibition of viral production is assumed to be 98%.doi:10.1371/journal.pone.0057088.g008
Assessing Models of the Influenza Immune Response
PLOS ONE | www.plosone.org 14 February 2013 | Volume 8 | Issue 2 | e57088
model is the most realistic model in this respect. Some of the
models (Baccam, Saenz, Pawelek) cannot simulate a sustained
infection because they do not include cell regeneration. Other
models (Handel, Lee, Miao) do not produce sustained infections
possibly because suppressing the immune response explicitly
included in these models does not correspond to complete
suppression: immune components that are not explicitly modelled
are implicitly present in other model parameters. For example, in
a model without explicit Ab response, data fitting will compensate
by setting the viral clearance rate to a larger number to implicitly
account for this loss.
Although the Bocharov model correctly produces a chronic
infection in the absence of the full immune response, it predicts
that suppressing CTLs and/or IFN will have no effect on viral
kinetics. This is particularly unfortunate given that this model
implements in detail the processes responsible for the production
of CTLs and IFN with a large, detailed set of delay differential
equations, all of which contribute nothing to shaping viral kinetics,
at least for the parameter values reported therein. The Lee model,
Figure 9. Simulations of the effect of NAI treatment on susceptible cells. The effect of NAI treatment on the course of remaining healthycells in various within host influenza models in the presence and absence of immune responses. Inhibition of viral production is assumed to be 98%.doi:10.1371/journal.pone.0057088.g009
Assessing Models of the Influenza Immune Response
PLOS ONE | www.plosone.org 15 February 2013 | Volume 8 | Issue 2 | e57088

which is even more complex, also shows very little difference in
viral kinetics when CTLs and Abs are turned off, which suggests
that perhaps the most important elements driving the infection are
lost in all the detail. Other models show a more varied response
when various immune components are turned off. The Hancioglu
model in particular can produce a wide range of behaviours, from
short infections to chronic infections with oscillating viral titers.
Unfortunately, these titers do not reflect what we see in the
experimental data, particularly with regards to their implementa-
tion of IFN. In their model, removal of IFN actually increases the
duration of the infection, often turning short infections into
chronic infections.
The simpler models, in spite of the smaller number of
parameters and equations, can also show interesting dynamics
when immune components are turned on and off. The Pawelek,
Baccam and Handel models predict a bimodal viral titer in the
presence of IFN and a single peak in the absence of IFN.
Unfortunately, this behaviour, although sometimes seen in other
experiments [4,111], was not seen in available experimental data
presented herein.
There are some limitations to the models presented here. All the
models assume a homogeneous target cell population, at least
before IFN creates a second class of less susceptible or resistant
cells. Dobrovolny et al. [90] showed that the assumption of a
heterogeneous cell population could lead to sustained viral titers
under certain conditions. While their model did not include an
immune response, it would be valuable to understand the role of
the immune response under these different infection dynamics.
Another limitation in the models discussed here is that they do not
link viral titer to clinical outcomes. Recently Canini and Carrat
[112] developed a model of influenza infection that included an
explicit description of the innate host response and the relationship
to clinical symptoms. This model was based on a population
analysis of viral kinetics and symptom dynamics data in 44 patients
in placebo groups inoculated with H1N1 (A/Texas/91) influenza
that had virus-positive nasal wash samples. This model was not
included in our analysis because it was published after the work
here was completed. It seems likely that limited data may have
caused similar issues to those of the models described here. The
model was based on viral titers in nasal washes and composite
symptom scores; data on the immune response were not included
in the study. However, this work made an important step forward
in linking the viral titer and immune response to clinical
symptoms, and the addition of a drug effect would take it another
important step forward.
Recommendations for further experimentsThe ideal experiment for deducing the role of a particular
immune component requires comprehensive collection of data.
For example, Iwasaki et al. created mice with different immune
components knocked out (Abs and/or CTLs and/or IFN); they
infected the mice (and their normal counterparts) and measured
not only the viral titer, but also the fraction of dead cells, Abs and
IFN over time [11]. The only measurement that was missing was
CTLs. Viral titer from normal and knock-out animals show the
manner in which the immune component affects the infection time
course. Importantly, time course measurements of Abs, IFN, and
CTLs make it possible to verify that the immune component under
study was entirely eliminated, and that the other immune
components were not affected. Changes in viral titer can be
correlated with changes in the levels of specific immune
components.
Another experiment that would be helpful is one where the
‘‘dose’’ of a particular immune component could be controlled
and varied. In dose ranging experiments, usually performed for
antiviral drugs [5], different doses of Abs, CTLs, or IFN would be
applied to in vitro influenza infections and the time course of viral
titer be measured. These data can be used to test which
hypothesis, or mathematical implementation, for the role of Abs,
CTLs, or IFN best explains the infection dynamics. This type of
dose ranging experiment might be particularly useful in teasing out
the role of CTLs, which appear not to play a large role in primary
infections, but play a larger role in preventing or mediating a
secondary infection [15]. Experiments have shown that CTLs can
be effective at reducing viral loads if they appear early enough
during the infection [73], suggesting that it would be easier to
isolate their effect if studied in this context.
While the data presented here are a good start to these types of
experiments, a systematic set of experiments, with well-sampled,
complete time courses of all measured components, is needed to
help construct a model that correctly captures the dynamics of the
immune response. It is particularly important that the time course
be sampled frequently and for the full duration of the infection
(viral titer data from Seo et al. [13] is a good example), so that
biologically relevant parameters can be determined from the data.
There are practical limitations that must be considered in
designing such experiments. Frequent sampling of human subjects
might deter patients from participating in studies. It is difficult to
study viral and immune kinetics at the actual site of infection in
humans. Viral load is typically measured by collecting nasal
washes or nasal swab. We know, however, that viral kinetics of
nasal swabs differ from viral kinetics of tracheal aspirates [113].
The human immune response is typically measured by taking
blood samples, which is problematically invasive, but potentially
remedied by measuring levels of various immune components in
nasal wash [20]. It is unclear how levels of immune components in
serum or nasal wash are related to levels at the site of infection,
although antibody levels in serum and tracheobronchial secretions
are known to differ substantially [114,115]. For these reasons, it is
more practical to perform experimental studies in animal models.
Conclusions
In this paper, we examined preclinical and clinical studies of the
role of the immune response to formulate key features of an
immune response that should be captured by mathematical
models. We tested existing mathematical models that incorporate
an immune response to see if they qualitatively reproduce
important features of the immune response. An attempt to
validate the models using this general picture synthesized from
multiple types of data indicates that the models examined here fail
to accurately reproduce at least one aspect of the immune
response, even though the model parameter values are derived by
fitting experimental data. We hope this analysis will stimulate
more comprehensive experiments into the role of the immune
response in influenza infections and that the approach presented
here will be useful for building confidence in new models moving
forward.
Methods
Experimental dataLiterature for preclinical or clinical data on the role of the
immune response during an influenza infection was found by
searching the Pubmed and Web of Science databases using the
keywords ‘‘influenza’’ and one of ‘‘antibodies’’, ‘‘interferon’’, or
‘‘cytotoxic T lymphocytes’’ to find studies of the dynamics of these
key immune components during influenza infection. We examined
Assessing Models of the Influenza Immune Response
PLOS ONE | www.plosone.org 16 February 2013 | Volume 8 | Issue 2 | e57088

the search results for experimental studies that measured the levels
of Abs, CTLs or IFN during an influenza infection, or experiments
that measured viral titer when one of these responses was
suppressed. We extracted data from figures in those papers that
had data for three or more time points during the infection.
Table 3 lists the papers from which we extracted experimental
data, the figure from which data was extracted, and the type of
data extracted from each paper. We also searched the same two
databases using the keywords ‘‘influenza’’ and ‘‘immunocompro-
mised.’’ Table 1 is the resulting list of papers that report cases of
immunocompromised patients infected with influenza. Details of
their underlying medical conditions, the strain of influenza with
which they were infected, and the antivirals used to treat them are
tabulated. When possible, we extracted viral time course data for
immunocompromised patients. Unless otherwise noted, we used
Engauge Digitizer 4.1 [116] to extract the data.
Mathematical modelsWe searched the literature for in-host models of influenza that
incorporate at least one component of the immune response and
whose parameters were determined, at least in part, from
experimental data. We found eight models that fit our criteria:
Bocharov and Romanyukha [2], Hancioglu et al. [31], Lee et al.
[22], Handel et al. [6], Miao et al. [23], Saenz et al. [32], Pawelek
et al. [37] and Baccam et al. [4]. The models are summarized in
Table 2, and described in more detail in supplemental material S2,
which also contains model equations.
For each model, with one exception, we use the parameters
determined in the original paper. Miao et al. used two different
methods for fitting their model to their data. First, they included
the immune response from the start of the infection (the Overall
parameters in Table 2 of their paper). We refer to their model
using Overall parameters as the Miao full model. Second, they
explicitly assumed the immune response did not play a role during
the first 5 days of the infection by setting all parameters associated
with the immune response to zero for the first 5 days (the Early
and Adaptive parameters in Table 2 of their paper) [23]. Miao et
al. fitted their Early parameters using viral titer data up to day 5
post-infection and setting all immune response parameters to zero
(i.e., assuming the immune response up to that point is negligible).
They fitted their Adaptive parameters by using the viral titers from
day 5 onward leaving all parameters free. This resulted in two sets
of parameters: the Early parameters for infection kinetics prior to
day 5 and the Adaptive parameters representing the kinetics after
day 5.
It is possible parameters such as the rate of cell infection by virus
or the infectious cell lifespan change drastically as the immune
response emerges, perhaps through the action of cytokines which
are not explicitly represented in their model. The Early and
Adaptive parameters suggest the arrival of the immune response
leads to an increase in cell infection rate and in the infectious cell
lifespan, which is inconsistent with the action of immune-mediated
cytokines. Therefore, we developed an alternative fit that we refer
to as the Miao split model. The Miao split parameters were fit by
Table 4. Parameter values of the Miao split model using theMiao et al. model and data [23].
Description* Parameter Value
Infectivity of virions ba 2.5|10{6 mL?EID{150 ?d21
Target cell regeneration rate rE 1.2|10{7 d21
Death rate of infectious cells dE� 0.47 d21
Viral titer clearance rate cV 6.9 d21
Viral production rate by infectiouscells
pa 100EID50?mL21?d21 (fixed)
Initial number of susceptible cells Ep(0) 6.5|105
Initial virus concentration V (0) 1473EID50?mL21(fixed)
Killing rate of infectious cells by CTLs kE 5.6|10{5 d21
Removal rate of virions by IgG Abs kVG 3.0|10{6mL?(pg?d)21
Removal rate of virions by IgM Abs kVM 6.5 mL?(pg?d)21
*See supplemental material S2 for a description of this model.doi:10.1371/journal.pone.0057088.t004
Table 3. Summary of experimental data presented in this paper.
Paper Figure(s) Animal Straina Sampling site Type of data
Iwasaki [11] 1,7 mouse PR8 lung homogenates Viral titers with and without Abs
Neff-LaFord [70] 1 mouse HKx31 lung homogenates Viral titers with and without CTLs
Kris [66] 2 (lung) mouse PC73 lung homogenates Viral titers with and without CTLs
Wells [67] 2A mouse PC73 lung homogenates Viral titers with and without CTLs
Yap [69] 2 mouse WSN33 lung homogenates Viral titers with and without CTLs
Garcıa-Sastre [68] 1 mouse PR8,WSN33 lung homogenates Viral titers with and without IFN
Hoshino [25] 2 mouse PR8 lung homogenates Viral titers with and without IFN
Seo [13] 2a pig PR8 nasal swabs Viral titers with and without IFN
Iwasaki [11] 2 mouse PR8 tracheobronchial wash Time course of IFN and Abs
Miao [23] 2b,db mouse HKx31 lung homogenates Time course of Abs and CTLs
McLaren [24] 3 ferret PC73 lung wash Time course of CTLs
Fritz [20] 5 human TX91 nasal lavage Time course of IFN-c
Hoshino [25] 3b mouse PR8 lung homogenates Time course of IFN
a Full names of the viral strains are A/Puerto Rico/8/1934 (H1N1) (PR8), A/Hong Kong/X31 (H3N2) (HKx31), A/Port Chalmers/1/73 (H3N2) (PC73), A/Wisconsin/1933(H1N1) (WSN33), A/Texas/36/91 (H1N1) (TX91).b Data was not extracted from the paper, but was provided to us by Hongyu Miao.doi:10.1371/journal.pone.0057088.t003
Assessing Models of the Influenza Immune Response
PLOS ONE | www.plosone.org 17 February 2013 | Volume 8 | Issue 2 | e57088
using their viral titer data, but up to day 5 post-infection all
immune system parameters were set to zero (as was done for the
Miao et al. Early parameters), and from day 5 onward all infection
parameters were fixed and only the parameters associated with the
immune response varied freely. The new Miao split model
parameters are listed in Table 4.
In order to easily compare model predictions, all models have
been scaled so their viral titer in the presence of their full immune
response arbitrarily peaks at a value of 1. We chose to scale the
models in the presence of their full immune response because it is
in this condition that each model was fit against experimental data.
The scaling factors, aV , were calculated from the viral titer peak,
Vp, such that aV ~1=Vp for each model and were used to scale all
variables and parameters containing units of viral titer. For
example, model parameter pa in Table 4 which has units of
EID50/mL/day, would be scaled such that pa?pa:aV . All time
course data produced from a mathematical model and presented
herein are scaled in this manner. Note that although this scaling
changes how high the viral titer peaks, it does not change the
dynamical behaviour of the model or the shape of the curves.
Models were simulated using lsode for ordinary differential
equations or dde23 for delay differential equations in Octave 3.0.5
[117]. Individual immune components were turned off by setting
the parameter that controls their effect on cells or virus to zero.
For example, the effect of CTLs is often modelled using the term
{kCI in the differential equation for infected cells where C are
the CTLs, I the infected cells, and k the rate at which CTLs kill
infected cells. To determine the effect of turning off CTLs, we set
k~0, leaving the differential equation for CTLs untouched.
Acknowledgments
The authors would like to thank Hongyu Miao for providing the data
presented in [23].
Author Contributions
Conceived and designed the experiments: CAAB. Performed the
experiments: HMD. Analyzed the data: HMD CAAB. Wrote the paper:
HMD MBR MAK CRR CAAB.
References
1. CDC (2008) Inuenza activity–united states and worldwide, 2007-08 season.
Morb Mortal Wkly Rep 57: 692–697.
2. Bocharov GA, Romanyukha AA (1994) Mathematical model of antiviral
immune response III. Inuenza A virus infection. J Theor Biol 167: 323–360.
3. Beauchemin C, Samuel J, Tuszynski J (2005) A simple cellular automaton
model for inuenza A viral infections. J Theor Biol 232: 223–234.
4. Baccam P, Beauchemin C, Macken CA, Hayden FG, Perelson AS (2006)
Kinetics of inuenza A virus infection in humans. J Virol 80: 7590–7599.
5. Beauchemin CA, McSharry JJ, Drusano GL, Nguyen JT, Went GT, et al.
(2008) Modeling aman-tadine treatment of inuenza A virus in vitro. J Theor
Biol 254: 439–451.
6. Handel A, Jr IML, Antia R (2009) Antiviral resistance and the control of
pandemic inuenza: The roles of stochasticity, evolution and model details.
J Theor Biol 256: 117–125.
7. Handel A, Longini IM, Antia R (2007) Neuraminidase inhibitor resistance in
inuenza: Assessing the danger of its generation and spread. PLoS Comput Biol
3: 2456–2464.
8. Dobrovolny HM, Gieschke R, Davies BE, Jumbe NL, Beauchemin CAA
(2011) Neuraminidase inhibitors for treatment of human and avian strain
inuenza: A comparative study. J Theor Biol 269: 234–244.
9. Agrati C, Gioia C, Lalle E, Cimini E, Castilletti C, et al. (2010) Association of
profoundly impaired immune competence in H1N1v-infected patients with a
severe or fatal clinical course. J Infect Dis 202: 681–689.
10. Barber WH, Parker A Small J (1978) Local and systemic immunity to inuenza
infections in ferrets. Infect Immun 21: 221–228.
11. Iwasaki T, Nozima T (1977) The roles of interferon and neutralizing antibodies
and thymus dependence of interferon and antibody production. J Immunol
118: 256–263.
12. Hsieh SM, Chang SC (2006) Insufficient perforin expression in CD8+ T cells in
response to hemagglutinin from avian inuenza (H5N1) virus. J Immunol 176:
4530–4533.
13. Seo SH, Hoffmann E, Webster RG (2002) Lethal H5N1 inuenza viruses escape
host anti-viral cytokine responses. Nature Med 8: 950–954.
14. AzambujaM(2010) A parsimonious hypothesis to the cause of inuenza lethality
and its variations in 19181919 and 2009. Med Hypotheses 74: 681–684.
15. Doherty PC, Turner SJ, Webby RG, Thomas PG (2006) Inuenza and the
challenge for immunology. Nature Immunol 7: 449–454.
16. Frolov AF, Skripchenko GS, Shcherbinskaya AM, Vlasova AG, Rybakova TM
(1984) Peculiarities of inuenza infection caused by highly and poorly
immunogenic strains of inuenza virus. J Hyg Epidemiol Microbiol Immunol
29: 303–309.
17. Gentile DA, Doyle WJ, Fireman P, Skoner DP (2001) Effect of experimental
inuenza A infection on systemic immune and inammatory parameters in
allergic and nonallergic adult subjects. Ann Allergy Asthma Immunol 87: 496–
500.
18. Hayden FG, Fritz RS, Lobo MC, AlvordWG, Strober W, et al. (1998) Local
and systemic cytokine responses during experimental human inuenza A virus
infection. J Clin Invest 101: 643–649.
19. Kaiser L, Fritz RS, Straus SE, Gubareva L, Hayden FG (2001) Symptom
pathogenesis during acute inuenza: interleukin-6 and other cytokine responses.
J Med Virol 64: 262–268.
20. Fritz RS, Hayden FG, Calfee DP, Cass LMR, Peng AW, et al. (1999) Nasal
cytokine and chemokine response in experimental inuenza A virus infection:
Results of a placebo-controlled trial of intravenous zanamivir treatment. J Infect
Dis 180: 586–593.
21. Svitek N, Rudd PA, Obojes K, Pillet S, von Messling V (2008) Severe seasonal
inuenza in ferrets correlates with reduced interferon and increased IL-6
induction. Virol 376: 53–59.
22. Lee HY, Topham DJ, Park SY, Hollenbaugh J, Treanor J, et al. (2009)
Simulation and prediction of the adaptive immune response to inuenza A virus
infection. J Virol 83: 7151–7165.
23. Miao H, Hollenbaugh JA, Zand MS, Holden-Wiltse J, Mosmann TR, et al.
(2010) Quantifying the early immune response and adaptive immune response
kinetics in mice infected with inuenza A virus. J Virol 84: 6687–6698.
24. McLaren C, Butchko GM (1978) Regional T- and B-cell responses in inuenza-
infected ferrets. Infect Immun 22: 189–194.
25. Hoshino A, Takenaka H, Mizukoshi O, Imanishi J, Kishida T, et al. (1983)
Effect of anti-interferon serum of inuenza virus infection in mice. Antiviral Res
3: 59–65.
26. Vahlenkamp TW, Harder TC (2006) Inuenza virus infections in mammals.
Berl Munch Tierarztl Wochenschr 119: 123–131.
27. Renegar K (1992) Inuenza virus infections and immunity: a review of human
and animal models. Lab Anim Sci 42: 222–232.
28. Haley PJ (2003) Species differences in the structure and function of the immune
system. Toxicology 188: 49–71.
29. Mestas J, Hughes CCW (2004) Of mice and not men: Differences between
mouse and human immunology. J Immunol 172: 2731–2738.
30. Staeheli P, Haller O (1987) Interferon-induced Mx protein: a mediator of
cellular resistance to inuenza virus. Interferon 8: 1–23.
31. Hancioglu B, Swigon D, Clermont G (2007) A dynamical model of human
immune response to inuenza A virus infection. J Theor Biol 246: 70–86.
32. Saenz RA, Quinlivan M, Elton D, MacRae S, Blunden AS, et al. (2010)
Dynamics of inuenza virus infection and pathology. J Virol 84: 3974–3983.
33. Handel A, Longini IM, Antia R (2010) Towards a quantitative understanding
of the within-host dynamics of inuenza A infections. J R Soc Interface 7: 35–47.
34. Tridane A, Kuang Y (2010) Modeling the interaction of cytotoxic T
lymphocytes and inuenza virus infected epithelial cells. Math Biosci Eng 7:
176–189.
35. Nowak M, Bonhoeffer S, Hill A, Boehme R, Thomas H, et al. (1996) Viral
dynamics in hepatitis B viral infection. Proc Natl Acad Sci USA 93: 4398–
4402.
36. Chang DB, Young CS (2007) Simple scaling laws for inuenza A rise time,
duration, and severity. J Theor Biol 246: 621–635.
37. Pawelek KA, Huynh GT, Quinlivan M, Cullinane A, Rong L, et al. (2012)
Modeling within-host dynamics of inuenza virus infection including immune
responses. PLoS Comput Biol 8: e1002588.
38. Miao H, Xia X, Perelson AS, Wu H (2011) On identfablity of nonlinear ODE
models and applications in viral dynamics. SIAM Review 53: 3–39.
39. Hayden FG, Treanor JJ, Fritz RS, Lobo M, Betts RF, et al. (1999) Use of the
oral neuraminidase inhibitor oseltamivir in experimental human inuenza:
randomized controlled trials for prevention and treatment. JAMA 282: 1240–
1246.
40. Hung IFN, To KKW, Lin CKLCK, Chan JFW, Tse H, et al. (2010) Effect of
clinical and virological parameters on the level of neutralizing antibody against
pandemic inuenza A virus H1N1 2009. Clin Infect Dis 51: 274–279.
Assessing Models of the Influenza Immune Response
PLOS ONE | www.plosone.org 18 February 2013 | Volume 8 | Issue 2 | e57088
41. Hung IFN, To KKW, Lee CK, Lee KL, Chan K, et al. (2011) Convalescentplasma treatment reduced mortality in patients with severe pandemic inuenza
A (H1N1) 2009 virus infection. Clin Infect Dis 52: 447–456.
42. To KKW, Hung IFN, Li IWS, Lee KL, Koo CK, et al. (2010) Delayed
clearance of viral load and marked cytokine activation in severe cases ofpandemic H1N1 2009 inuenza virus infection. Clin Infect Dis 50: 850–859.
43. Baz M, Abed Y, McDonald J, Boivin G (2006) Characterization of multidrug-
resistant inuenza A/H3N2 viruses shed during 1 year by an immunocompro-mised child. Clin Infect Dis 43: 1555–1561.
44. Gooskens J, Jonges M, Claas ECJ, Meijer A, Kroes ACM (2009) Prolonged
inuenza virus infection during lymphocytopenia and frequent detection ofdrug-resistant viruses. J Infect Dis 199: 1435–1441.
45. Weinstock DM, Gubareva LV, Zuccotti G (2003) Prolonged shedding of
multidrug-resistant inuenza A virus in an immunocompromised patient. NewEng J Med 348: 867.
46. Pinsky BA, Mix S, Rowe J, Ikemoto S, Baron EJ (2010) Long-term shedding of
inuenza A virus in stool of immunocompromised child. Emerg Infect Dis 16:1165–67.
47. Anton A, Lopez-Iglesias AA, Tortola T, Ruiz-Camps I, Abrisqueta P, et al.
(2010) Selection and viral load kinetics of an oseltamivir-resistant pandemicinuenza A (H1N1) virus in an immuno-compromised patient during treatment
with neuraminidase inhibitors. Diag Microbiol Infect Dis 68: 214–219.
48. Boivin G, Goyette N, Bernatchez H (2002) Prolonged excretion of amantadine-
resistant inuenza A virus quasi species after cessation of antiviral therapy in animmunocompromised patient. Clin Infect Dis 34: e23–e25.
49. Campanini G, Piralla A, Rovida F, Puzelli S, Facchini M, et al. (2010) First
case in Italy of acquired resistance to oseltamivir in an immunocompromisedpatient with inuenza A/H1N1v infection. J Clin Virol 48: 220–222.
50. Englund J, Pergam S, Yager J, Mattson D, Whittington N, et al. (2009)
Oseltamivir-resistant novel inuenza A (H1N1) virus infection in twoimmunosuppressed patients seattle, washington, 2009. Morb Mortal Wkly
Rep 58: 893–895.
51. Cohen-Daniel L, Zakay-Rones Z, Resnick IB, Shapira MY, Dorozhko M, et al.(2009) Emer-gence of oseltamivir-resistant inuenza A/H3N2 virus with altered
hemagglutination pattern in a hematopoietic stem cell transplant recipient.J Clin Vir 44: 138–140.
52. Couturier BA, Bender JM, Schwarz MA, Pavia AT, Hanson KE, et al. (2010)
Oseltamivir-resistant inuenza A 2009 H1N1 virus in immunocompromised
patients. Inuenza and Other Respiratory Viruses 4: 199–204.
53. Gubareva LV, Matrosovich MN, Brenner MK, Bethell RC, Webster RG
(1998) Evidence for zanamivir resistance in an immunocompromised child
infected with inuenza B virus. J Infect Dis 178: 1257–1262.
54. Hill-Cawthorne GA, Schelenz S, Laws M, Dervisevic S (2010) Oseltamivir-resistant pandemic (H1N1) 2009 in patient with impaired immune system.
Emerg Infect Dis 16: 1185–1186.
55. Ison MG, Gubareva LV, Atmar RL, Treanor J, Hayden FG (2006) Recoveryof drug-resistant inuenza virus from immunocompromised patients: A case
series. J Infect Dis 193: 760–764.
56. Klimov AI, Rocha E, Hayden FG, Shult PA, Roumillat LF, et al. (1995)Prolonged shedding of amantadine-resistant inuenza A viruses by immunode-
ficient patients: Detection by polymerase chain reaction-restriction analysis.J Infect Dis 172: 1352–1355.
57. Mehta T, McGrath E, Bheemreddy S, Salimnia H, Abdel-Haq N, et al. (2010)
Detection of oseltamivir resistance during treatment of 2009 H1N1 inuenzavirus infection in immunocom-promised patients: Utility of cycle threshold
values of qualitative real-time reverse transcriptase PCR. J Clin Microbiol 48:
4326–4328.
58. Renaud C, Boudreault AA, Kuypers J, Lofy KH, Corey L, et al. (2011) H275Ymutant pandemic (H1N1) 2009 virus in immunocompromised patients. Emerg
Infect Dis 17: 653–660.
59. van der Vries E, van den Berg B, Schutten M (2008) Fatal oseltamivir-resistantinuenza viral infection. New Eng J Med 359: 1074.
60. Evans KD, Kline MW (1995) Prolonged inuenza A infection responsive to
rimantadine therapy in a human immunodeficiency virus-infected child.Pediatr Infect Dis J 14: 332–334.
61. Carrat F, Vergu E, Ferguson NM, Lemaitre M, Cauchemez S, et al. (2008)
Time lines of infection and disease in human inuenza: A review of volunteerchallenge studies. Am J Epidemiol 167: 775–785.
62. Kuiken T, Taubenberger JK (2008) Pathology of human inuenza revisited.
Vaccine 26: D59–D66.
63. Frankova V, Jirasek A, Tumova B (1977) Type A inuenza: Postmortem virusisolations from different organs in human lethal cases. Arch Virol 53: 265–268.
64. Ghattas C, Mossad S (2012) Fatal human metapneumovirus and inuenza B
virus coinfection in an allogeneic hematopoietic stem cell transplant recipient.Transpl Infect Dis 14: E41–E43.
65. Bal A, Suri V, Mishra B, Bhalla A, Agarwal R, et al. (2012) Pathology and
virology findings in cases of fatal inuenza A H1N1 virus infection in 20092010.Histopathology 60: 326–335.
66. Kris R, Yetter R, Cogliano R, Ramphal R, Small P (1988) Passive serum
antibody causes temporary recovery from inuenza virus infection of the nose,trachea and lung of nude mice. Immunol 63: 349–353.
67. Wells MA, Albrecht P, Ennis FA (1981) Recovery from a viral respiratory
infection: 1. inuenza pneumonia in normal and T-deficient mice. J Immunol
126: 1036–1041.
68. Garcıa-Sastre A, Durbin RK, Zheng H, Palese P, Gertner R, et al. (1998) Therole of interferon in inuenza virus tissue tropism. J Virol 72: 8550–8558.
69. Yap K, Braciale TJ, Ada GL (1979) Role of T-cell function in recovery frommurine inuenza infection. Cell Immunol 43: 341–351.
70. Neff-LaFord HD, Vorderstrasse BA, Lawrence BP (2003) Fewer CTL, notenhanced NK cells, are sufficient for viral clearance from the lungs of
immunocompromised mice. Cellul Immunol 226: 54–64.
71. Lawrence BP, Warren TK, Luong H (2000) Fewer T lymphocytes and
decreased pulmonary inuenza virus burden in mice exposed to 2,3,7,8-
tetrachlorodibenzo-p-dioxin (TCDD). J Toxicol Environ Health 61: 39–53.
72. Pantelouris EM, Pringle CR (1976) Interferon production in athymic nude
mice. J Gen Virol 32: 149–152.
73. Mbawuike IN, Zhang Y, Couch RB (2007) Control of mucosal virus infection
by inuenza nucleoprotein-specific CD8+ cytotoxic T lymphocytes. Resp Res 8:44–52.
74. Zweerink H, Skehel SCJ, Crumpton M, Askonas B (1977) Cytotoxic T cells killinuenza virus infected cells but do not distinguish between serologically distinct
type A viruses. Nature 267: 354–356.
75. Possee R, Schild G, Dimmock N (1982) Studies on the mechanism of
neutralization of inuenza virus by antibody: Evidence that neutralizaingantibody (anti-haemagglutinin) inactivates inuenza virus invivo by inhibiting
virion transcriptase activity. J Gen Virol 58: 373–386.
76. Taylor HP, Dimmock NJ (1985) Mechanisms of neutralization of inuenza virusby IgM. J Gen Virol 66: 903–907.
77. Taylor HP, Dimmock NJ (1985) Mechanism of neutralization of inuenza virusby secretory IgA is different from that of monomeric IgA or IgG. J Exp Med
161: 198–209.
78. Houglum JE (1983) Interferon: Mechanisms of action and clinical value. Drug
Reviews 2: 20–28.
79. Baglioni C (1979) Interferon-induced enzymatic activities and their role in the
antiviral state. Cell 17: 255–264.
80. Baglioni C, Nilsen T (1981) The action of interferon at the molecular level. Am
Sci 69: 392–399.
81. Epstein LB, Ammann AJ (1974) Evaluation of T lymphocyte effector function
in immunode- ficiency diseases: Abnormality in mitogen-stimulated interferonin patients with selective IgA deficiency. J Immunol 112: 617–626.
82. Giovanella BC, Hunter JT (1984) Use of the nude mouse in immunological
research. Methods Enzymol 108: 348–357.
83. Gray PW, Goeddel DV (1982) Structure of the human immune interferon
gene. Nature 298: 859–863.
84. Stark GR, Kerr IM, Williams BRG, Silverman RH, Schreiber RD (1998) How
cells respond to interferons. Ann Rev Biochem 67: 227–264.
85. Merlin G, Falcoff E, Aguet M (1985) 125I-labelled human interferons alpha,
beta and gamma: Comparative receptor-binding data. J Gen Virol 66: 1149–1152.
86. Muller U, Steinhoff U, Reis LL, Hemmi S, Pavlovic J, et al. (1994) Functional-role of type-I and type-II interferons in antiviral defense. Science 264: 1918–
1921.
87. Meraz MA, White JM, Sheehan KCF, Bach EA, Rodig SJ, et al. (1996)
Targeted disruption of the Stat1 gene in mice reveals unexpected physiologicspecificity in the JAKSTAT signaling pathway. Cell 84: 431–442.
88. Durbin JE, Hackenmiller R, Simon MC, Levy DE (1996) Targeted disruption
of the mouse Stat1 gene results in compromised innate immunity to viraldisease. Cell 84: 443–450.
89. Garcıa-Sastre A, Egorov A, Matassov D, Brandt S, Levy DE, et al. (1998)Inuenza A virus lacking the NS1 gene replicates in interferon-deficient systems.
Virol 252: 324–330.
90. Dobrovolny HM, Baron MJ, Gieschke R, Davies BE, Jumbe NL, et al. (2010)
Exploring cell tropism as a possible contributor to inuenza infection severity.PLoS ONE 5: e13811.
91. Ferguson NM, Cummings DA, Cauchemez S, Fraser C, Riley S, et al. (2005)Strategies for containing an emerging inuenza pandemic in Southeast Asia.
Nature 437: 209–214.
92. Neumann AU, Lam NP, Dahari H, Gretch DR, Wiley TE, et al. (1998)
Hepatitis C viral dynamics in vivo and the antiviral efficacy of interferon-atherapy. Science 282: 103–107.
93. Perelson AS, Neumann A, Markowitz M, Leonard J, Ho D (1996) HIV-1
dynamics in vivo: Virion clearance rate, infected cell life-span, and viralgeneration time. Science 271: 1582–1586.
94. Abed Y, Bourgault AM, Fenton RJ, Morley PJ, Gower D, et al. (2002)Characterization of 2 inuenza A(H3N2) clinical isolates with reduced
susceptibility to neuraminidase inhibitors due to mutations in the hemagglu-tinin gene. J Infect Dis 186: 1074–1080.
95. Gubareva LV, Kaiser L, Hayden FG (2000) Inuenza virus neuraminidaseinhibitors. Lancet 355: 827–835.
96. Holford N, Sheiner L (1981) Understanding the dose-effect relationship:
Clinical application of pharmacokinetic-pharmacodynamic models. ClinPharmacokinet 6: 429–453.
97. Lee N, Chan PKS, Hui DSC, Rainer TH, Wong E, et al. (2009) Viral loadsand duration of viral shedding in adult patients hospitalized with inuenza.
J Infect Dis 200: 492–500.
98. Narang V, Decraene J, Wong SY, Aiswarya BS, Wasem AR, et al. (2012)
Systems immunology: a survey of modeling formalisms, applications andsimulation tools. Immunologic Research 53: 251–265.
Assessing Models of the Influenza Immune Response
PLOS ONE | www.plosone.org 19 February 2013 | Volume 8 | Issue 2 | e57088
99. Robinson S (2008) Conceptual modelling for simulation part I: definition and
requirements. J Oper Res Soc 59: 278–290.
100. Craver CF (2006) When mechanistic models explain. Synthese 153: 355–376.
101. Balci O (1994) Validation, verification, and testing techniques throughout the
life cycle of a simulation study. Ann Oper Res 53: 121–173.
102. Tsang C (1991) The modeling process and model validation. Ground Water
29: 825–831.
103. Groesser SN, Schwaninger M (2012) Contributions to model validation:
hierarchy, process, and cessation. Sys Dyn Rev 28: 157–181.
104. Callard RE, Turner MW (1990) Cytokines and Ig switching: Evolutionary
divergence between mice and human. Immunol Today 11: 200–203.
105. Farrar JD, Smith JD, Murphy TL, Leung S, Stark GR, et al. (2000) Selective
loss of type I interferon-induced STAT4 activation caused by a minisatellite
insertion in mouse Stat2. Nature Immunol 1: 65–69.
106. Rogge L, DAmbrosio D, Biffi M, Penna G, Minetti LJ, et al. (1998) The role of
Stat4 in species- specific regulation of Th cell development by type I IFNs. J of
Immunol 161: 6567–6574.
107. Tamura S, Tanimoto T, Kurata T (2005) Mechanisms of broad cross-
protection provided by inuenza virus infection and their application to
vaccines. Jpn J Infect Dis 58: 195–207.
108. Narasaraju T, Sim M, Ng H, Phoon M, Shanker N, et al. (2009) Adaptation of
human inuenza H3N2 virus in a mouse pneumonitis model: insights into viral
virulence, tissue tropism and host pathogenesis. Microb Infect 11: 2–11.
109. Wu R, Zhang H, Yang K, Liang W, Xiong Z, et al. (2009) Multiple amino acid
substitutions are involved in the adaptation of H9N2 avian inuenza virus to
mice. Vet Microbiol 138: 85–91.
110. Koerner I, Matrosovich MN, Haller O, Staeheli P, Kochs G (2012) Altered
receptor specificity and fusion activity of the haemagglutinin contribute to highvirulence of a mouse-adapted inuenza A virus. J Gen Virol 93: 970–979.
111. Mitchell H, Levin D, Forrest S, Beauchemin CA, Tipper J, et al. (2011) Higher
level of replication efficiency of 2009 (H1N1) pandemic inuenza virus thanthose of seasonal and avian strains: Kinetics from epithelial cell culture and
computational modeling. J Virol 85: 1125–1135.112. Canini L, Carrat F (2011) Population modeling of inuenza A/H1N1 virus
kinetics and symptom dynamics. J Virol 85: 27642770.
113. Lee N, Chan PKS,Wong CK,Wong KT, Choi KW, et al. (2011) Viralclearance and inammatory response patterns in adults hospitalized for
pandemic 2009 inuenza A(H1N1) virus pneumonia. Antivir Ther 16: 237–247.114. Waldman RH, Mann JJ, Kasel JA (1968) Inuenza virus neutralizing antibody
in human respi- ratory secretions. J Immunol 100.115. Zahradnik JM, Kasel JA, Martin RR, Six HR, Cate TR (1983) Immune
responses in serum and respiratory secretions following vaccination with a live
cold-recombinant (CR35) and inactivated A/USSR/77 (H1N1) inuenza virusvaccine. J Med Virol 11: 277–285.
116. Mitchell M Engauge Digitizer. A free open-source software to extract datapoints from a graph image. Hosted on SourceForge at: http://digitizer.
sourceforge.net.
117. Eaton JW, et al. (2008) GNU Octave version 3.0.5. A free open-source softwarefor solving linear and nonlinear problems numerically, and for performing
other numerical experiments using a language that is mostly compatible withMatlab. Available at: http://www.octave.org/.
118. Yap K, Ada G (1978) Cytotoxic T cells in the lungs of mice infected with aninuenza A virus. Scand J Immunol 7: 73–80.
Assessing Models of the Influenza Immune Response
PLOS ONE | www.plosone.org 20 February 2013 | Volume 8 | Issue 2 | e57088