Embed Size (px)
Citation preview
Results from the RISCS project
Assessing impacts in terrestrial environments
6th CO2GeoNet Open Forum, May 9‐11 2011 – Venice, San Servolo Island 1
David Jones (CO2GeoNet/BGS) and the RISCS project team
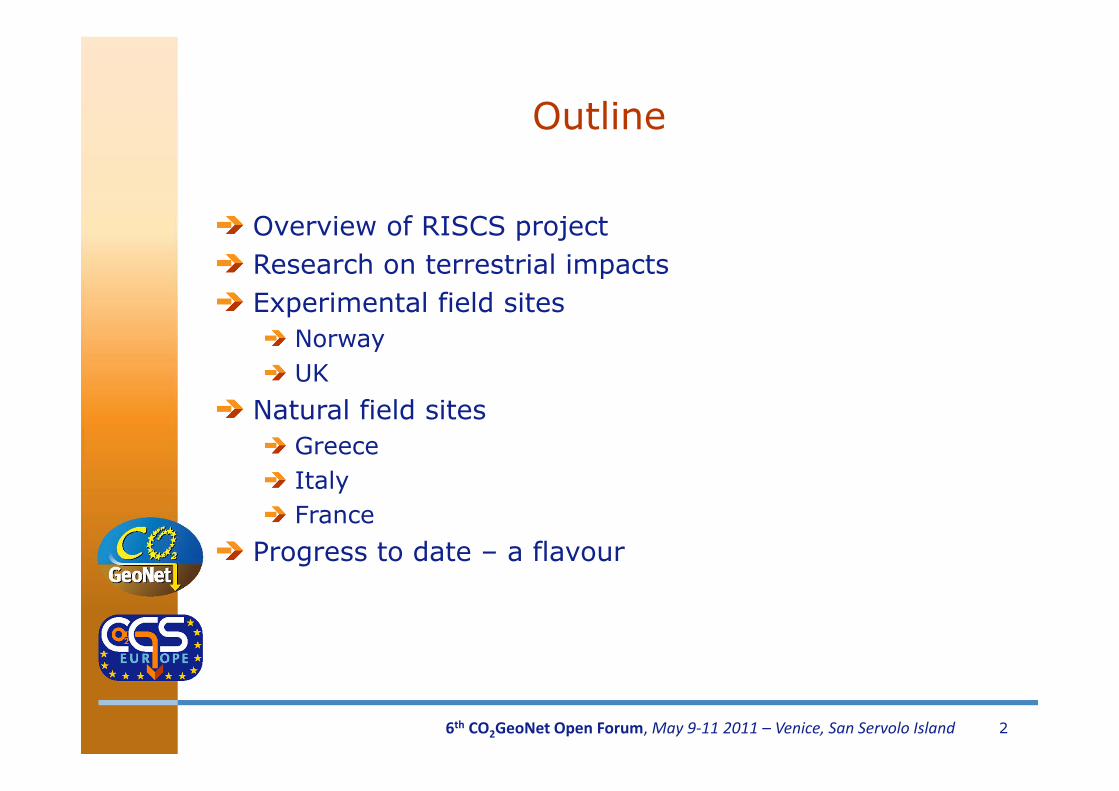
Outline
Overview of RISCS projectResearch on terrestrial impactsExperimental field sites
NorwayUK
Natural field sitesGreeceItalyFrance
Progress to date – a flavour
6th CO2GeoNet Open Forum, May 9‐11 2011 – Venice, San Servolo Island 2
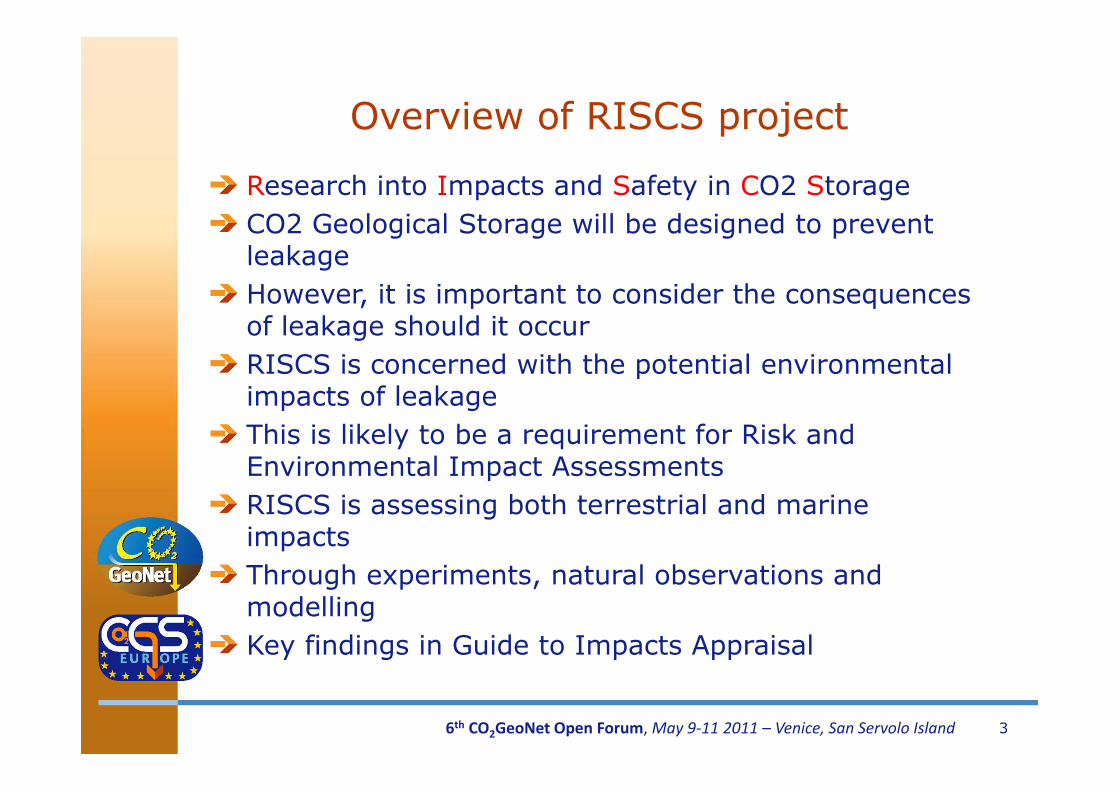
Overview of RISCS project
Research into Impacts and Safety in CO2 StorageCO2 Geological Storage will be designed to prevent leakageHowever, it is important to consider the consequences of leakage should it occurRISCS is concerned with the potential environmental impacts of leakageThis is likely to be a requirement for Risk and Environmental Impact AssessmentsRISCS is assessing both terrestrial and marine impactsThrough experiments, natural observations and modellingKey findings in Guide to Impacts Appraisal
6th CO2GeoNet Open Forum, May 9‐11 2011 – Venice, San Servolo Island 3
Overview of RISCS project
4 year FP7 project, fully funded (€5.3M) started January 201024 participants (UK, Greece, Netherlands, Italy, Norway, Sweden, France, Germany) + Australia, Canada, USA6 industrial participants (Enel, Statoil, Vattenfall, EoN, PPC, RWE) providing funding (c €200k each), research input and advice4 non-European participants (CO2CRC & Montana State, Regina, Stanford universities) in advisory role1 NGO (ZERO)CO2GeoNet (Primarily represented by NIVA, BRGM in addition to 6 participants)IEA-GHG – advice and help with dissemination
Terrestrial Impacts
Experimental injection sitesGrimsrud Farm, NorwayASGARD, UK
Greenhouse experimentsNorway
Natural field observationsFlorina, GreeceLatera and San Vittorino, ItalyMontmiral, France
Modelling of leakage scenarios using results
6th CO2GeoNet Open Forum, May 9‐11 2011 – Venice, San Servolo Island 5
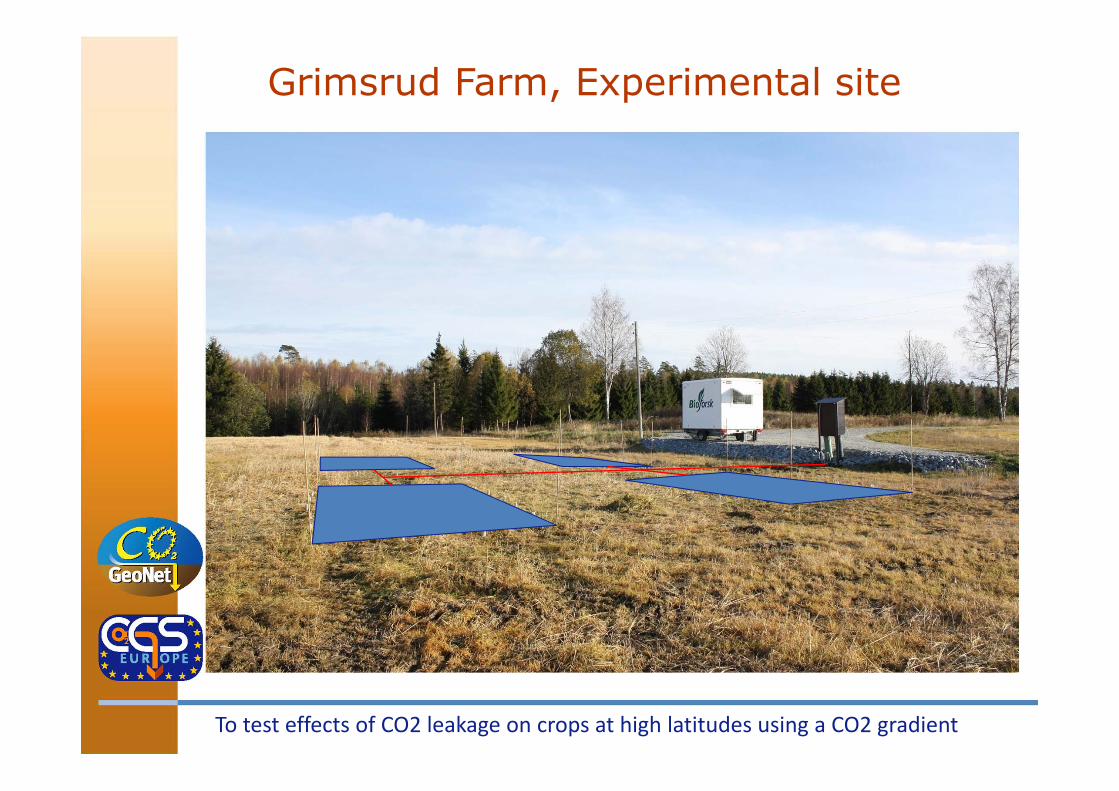
To test effects of CO2 leakage on crops at high latitudes using a CO2 gradient
Grimsrud Farm, Experimental site
Soil
Sand
40cm
85cmDepth
0cm
CO2
Gas supply pipe
CO2
CO2 gradient of leakage
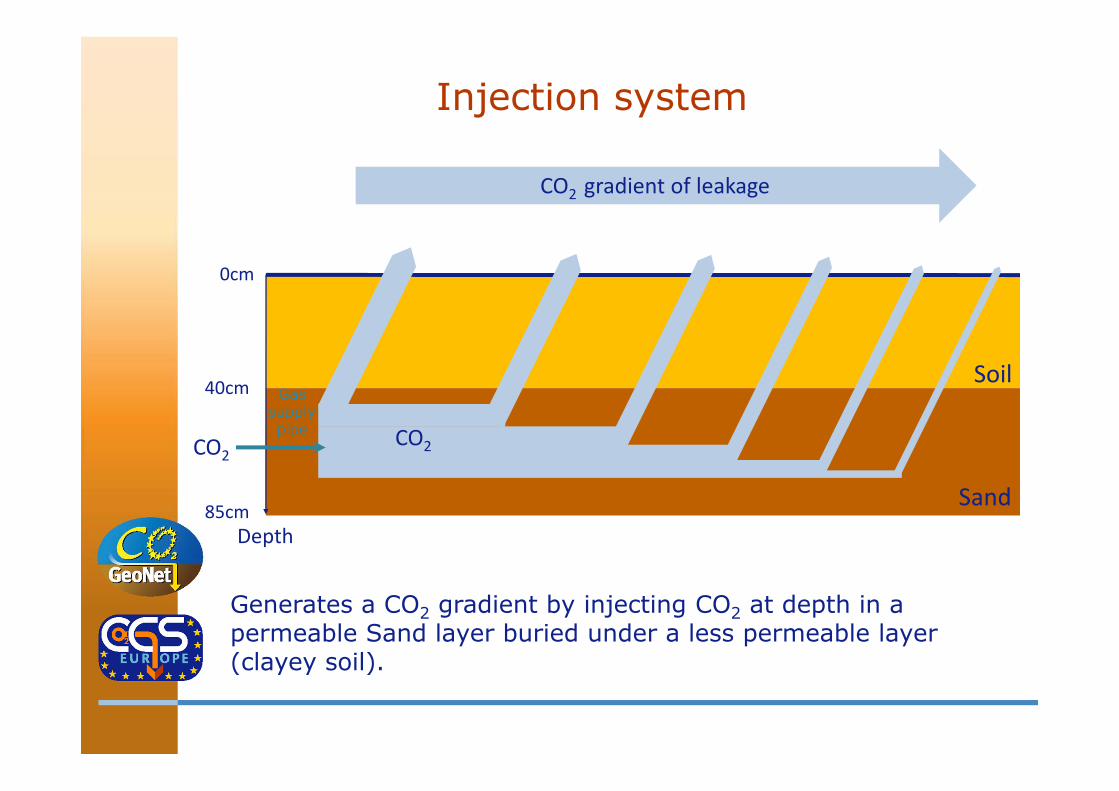
Generates a CO2 gradient by injecting CO2 at depth in a permeable Sand layer buried under a less permeable layer (clayey soil).
Injection system
Plot 1
Plot 3
Plot 2
Plot 4
475 cm
405cm
CO2
300cm
600 cm
Injection pipes
CO2
CO2
Gassed plot
Gassed plot Control plot
Control plot
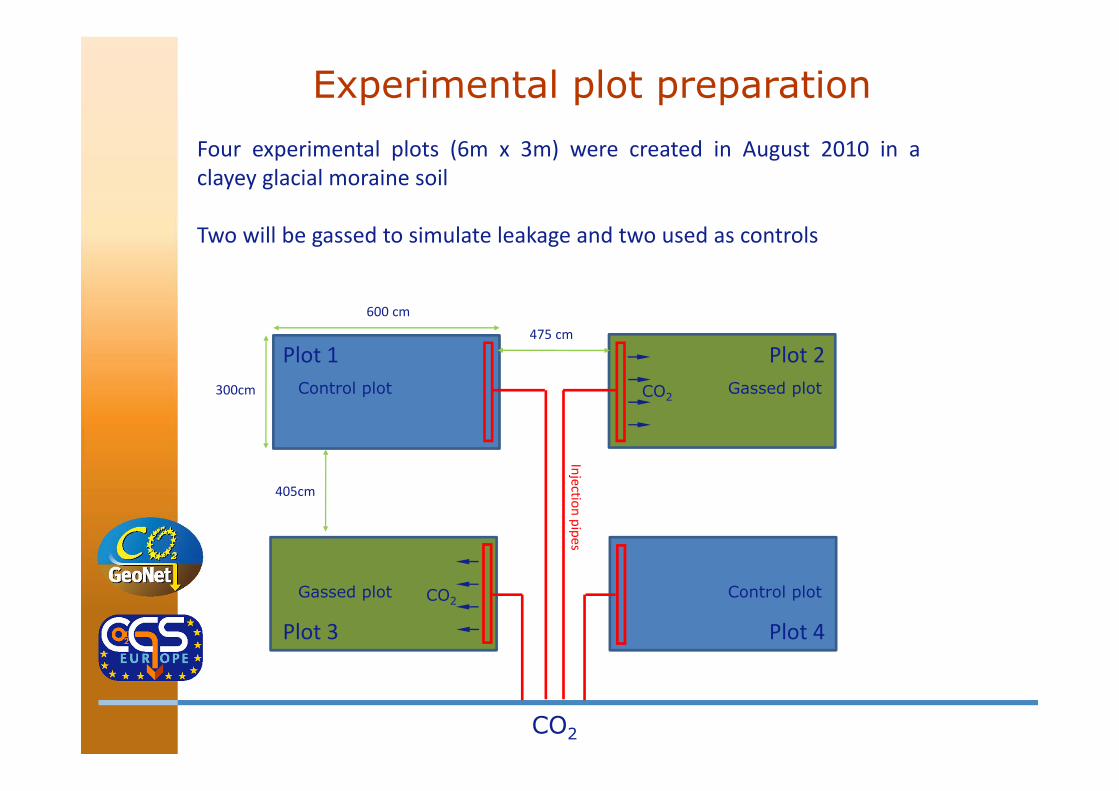
Four experimental plots (6m x 3m) were created in August 2010 in a clayey glacial moraine soil
Two will be gassed to simulate leakage and two used as controls
Experimental plot preparation
Atmospheric gas sample
for CO2 content and δ13C
Soil gas samples
Soil‐atmosphere CO2 flux
and δ13C (24h)
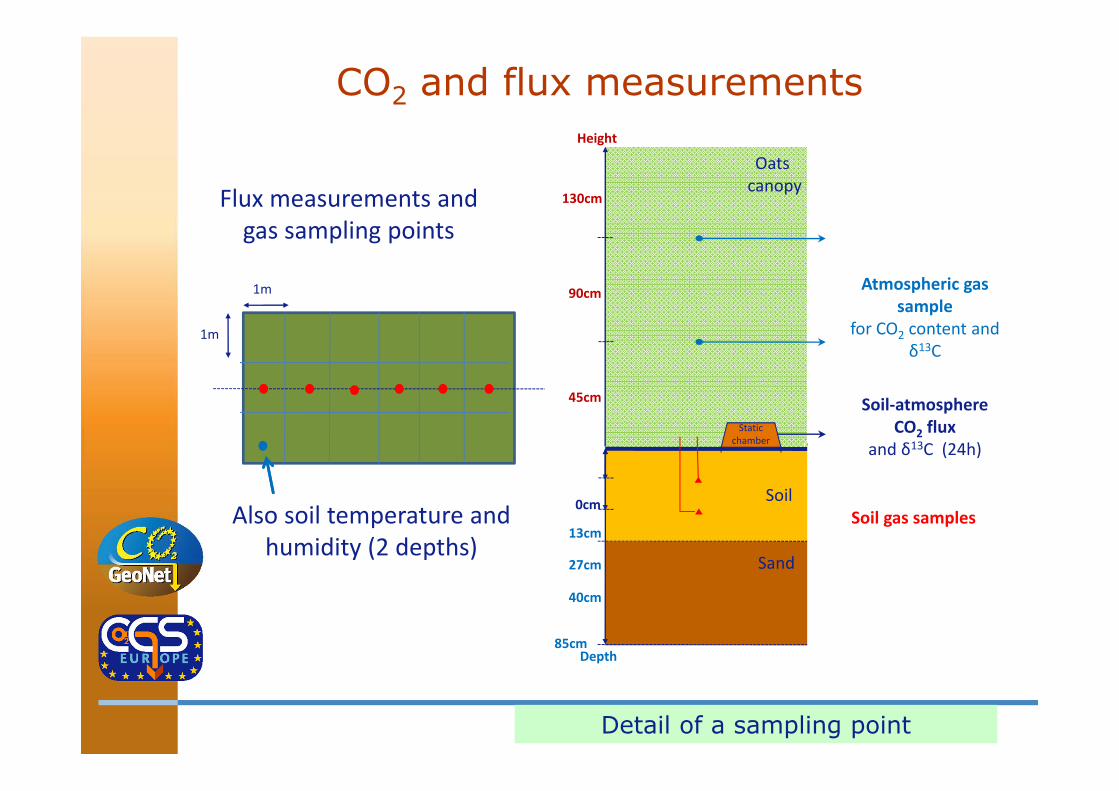
Flux measurements and gas sampling points
13cm
27cm
40cm
85cmDepth
Height
0cm
130cm
90cm
45cm
Soil
Sand
Oats canopy
Static chamber
1m
1m
Detail of a sampling point
Also soil temperature and humidity (2 depths)
CO2 and flux measurements
Progress and plans
Plots set up and tested in 2010Results showed a CO2 gradient, but only over a 3 mdistancePlots were sown with oats in May 2011Two plots will be gassed at 1 l.min-1 with natural gas (δ13C = -46‰)CO2 measurements (fluxes, concentration and δ13C) will last the whole growing seasonPlant yields, height, biomass, leaf nutrient and δ13CExperiment will be supplemented by greenhouse exposure experimentsData will be used for an eco-physiological model
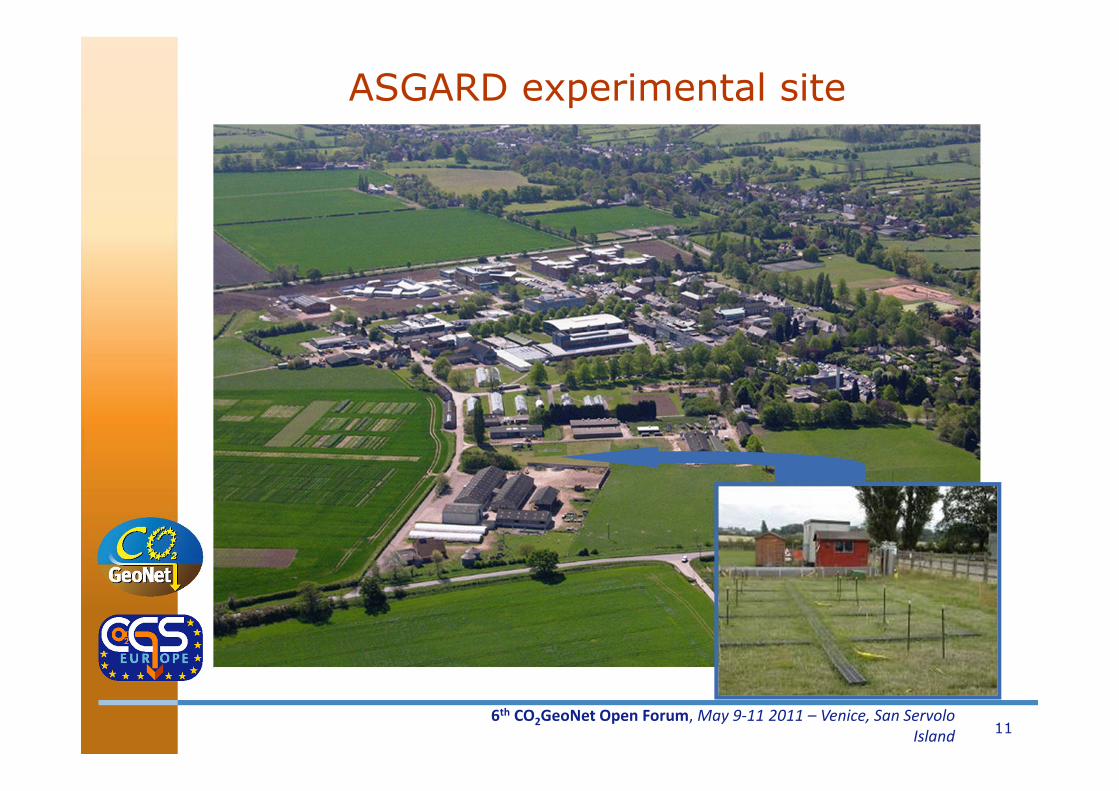
ASGARD experimental site
6th CO2GeoNet Open Forum, May 9‐11 2011 – Venice, San Servolo Island 11
16/05/2011
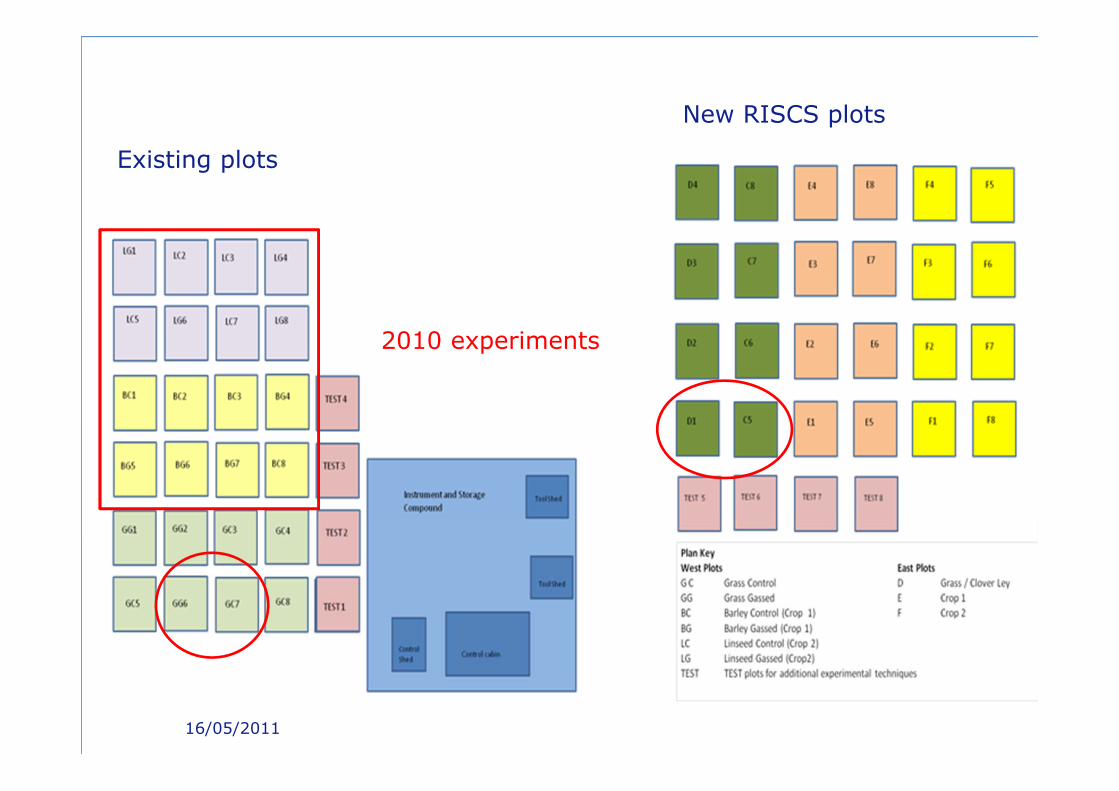
Existing plots
New RISCS plots
2010 experiments
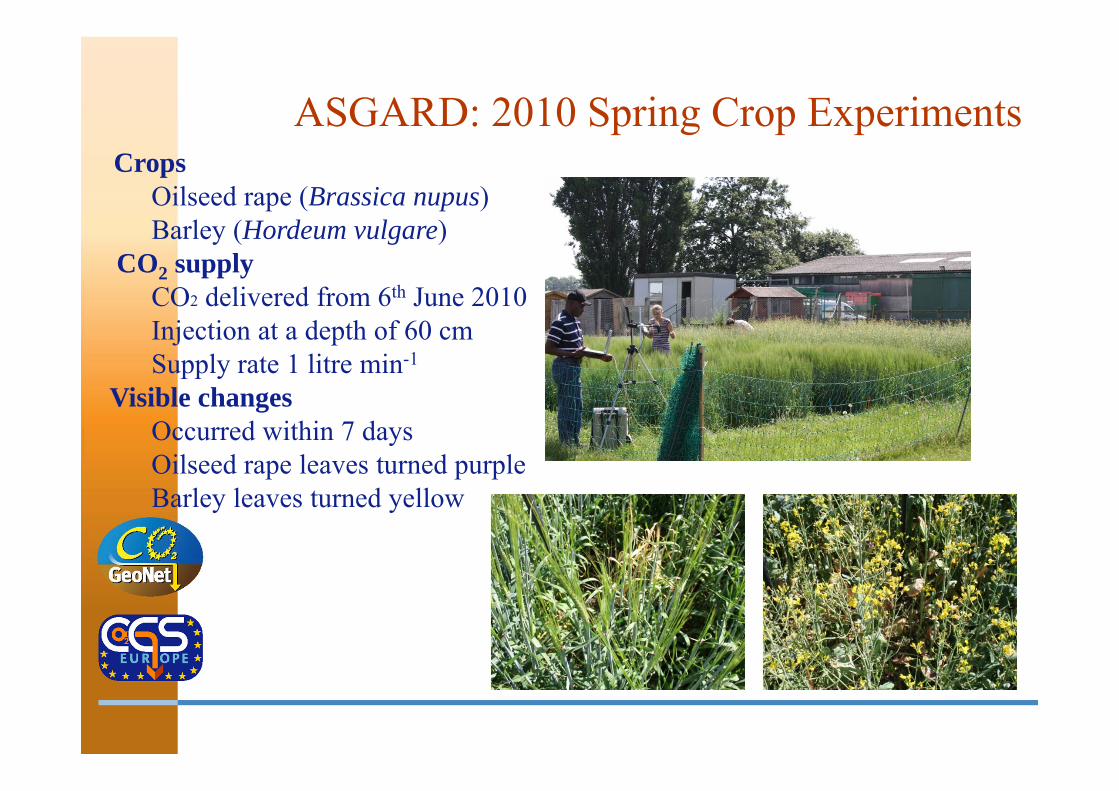
ASGARD: 2010 Spring Crop ExperimentsCrops
Oilseed rape (Brassica nupus)Barley (Hordeum vulgare)
CO2 supplyCO2 delivered from 6th June 2010Injection at a depth of 60 cmSupply rate 1 litre min-1
Visible changesOccurred within 7 days Oilseed rape leaves turned purpleBarley leaves turned yellow
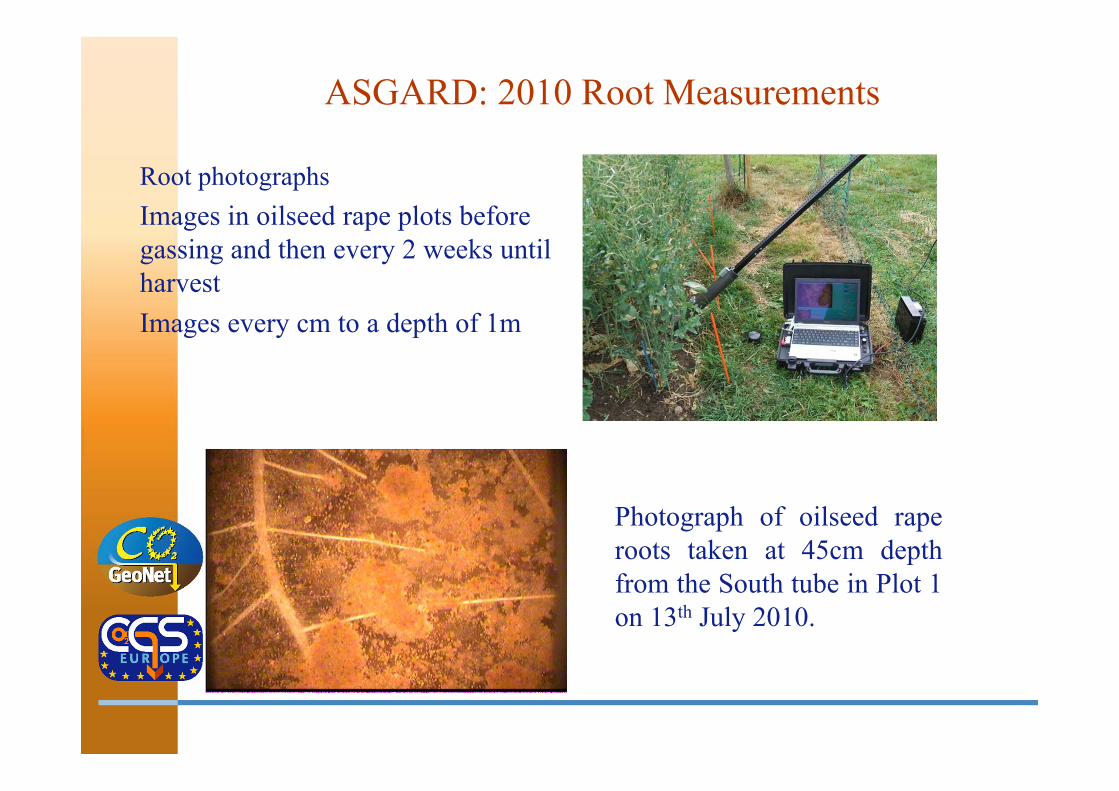
ASGARD: 2010 Root Measurements
Root photographs Images in oilseed rape plots before gassing and then every 2 weeks until harvestImages every cm to a depth of 1m
Photograph of oilseed raperoots taken at 45cm depthfrom the South tube in Plot 1on 13th July 2010.
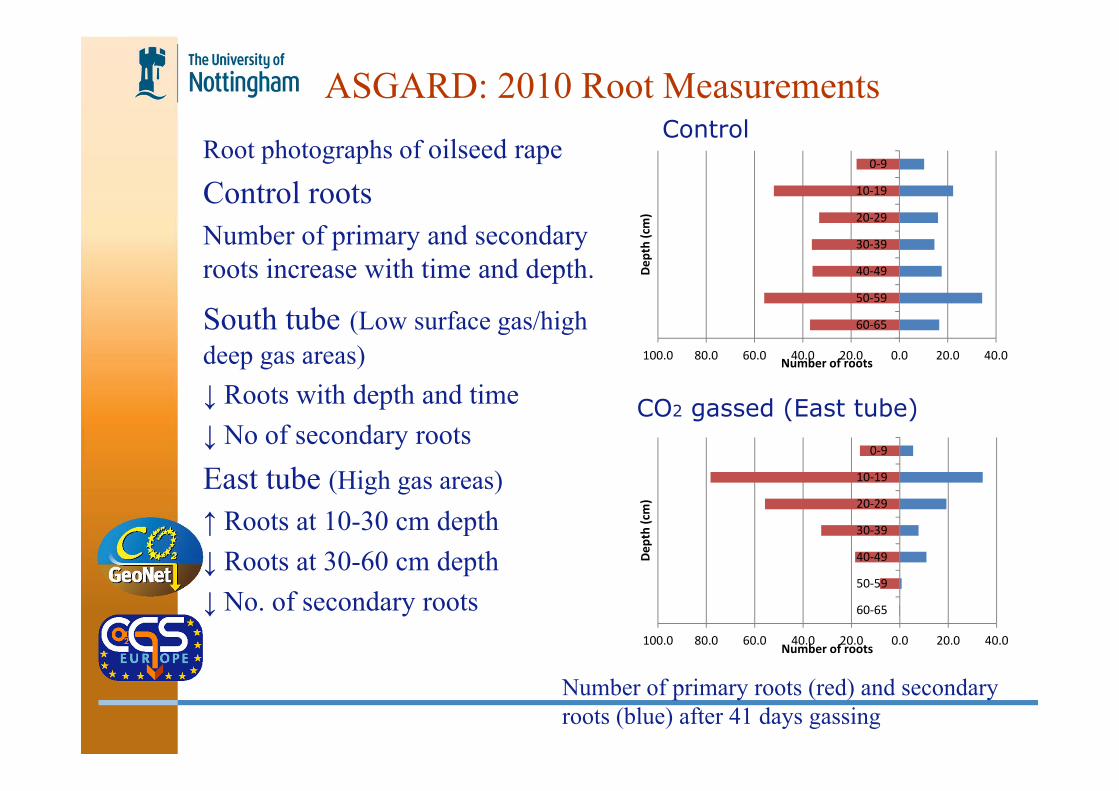
ASGARD: 2010 Root MeasurementsRoot photographs of oilseed rapeControl roots Number of primary and secondary roots increase with time and depth.
South tube (Low surface gas/high deep gas areas)↓ Roots with depth and time↓ No of secondary rootsEast tube (High gas areas)↑ Roots at 10-30 cm depth↓ Roots at 30-60 cm depth↓ No. of secondary roots
100.0 80.0 60.0 40.0 20.0 0.0 20.0 40.0
0‐9
10‐19
20‐29
30‐39
40‐49
50‐59
60‐65
Number of roots
Dep
th (cm)
100.0 80.0 60.0 40.0 20.0 0.0 20.0 40.0
0‐9
10‐19
20‐29
30‐39
40‐49
50‐59
60‐65
Number of rootsDep
th (cm)
Number of primary roots (red) and secondary roots (blue) after 41 days gassing
CO2 gassed (East tube)
Control
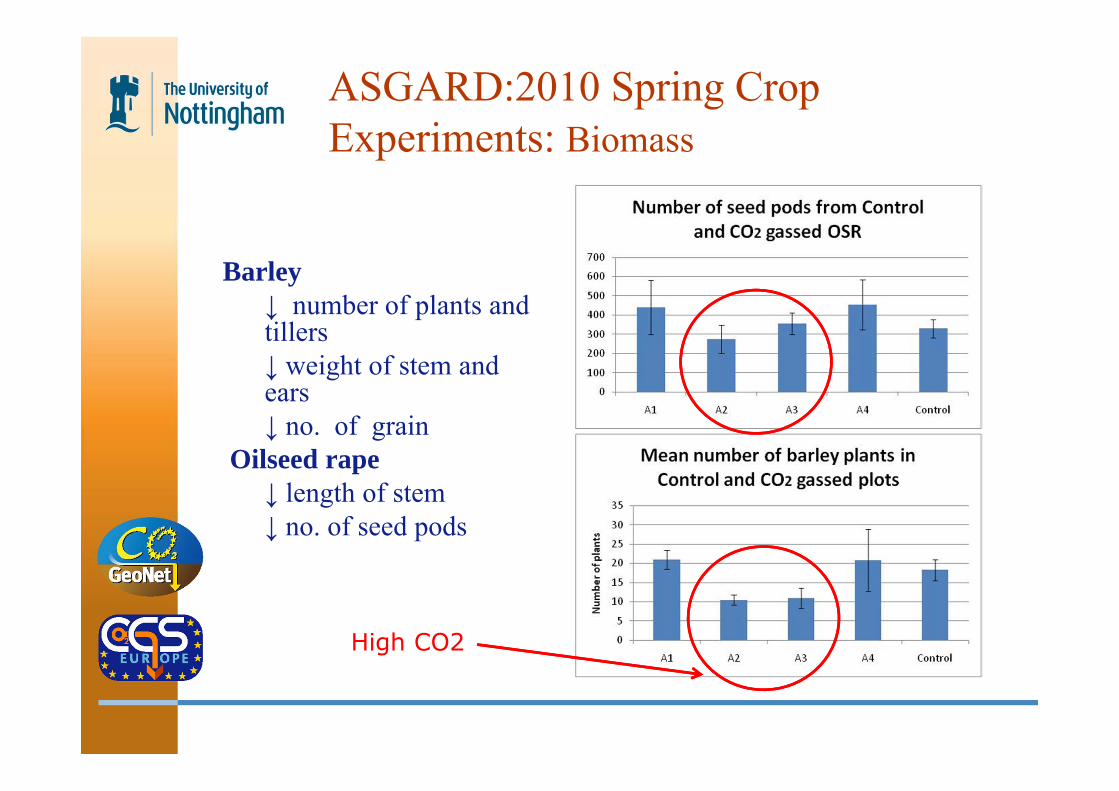
ASGARD:2010 Spring Crop Experiments: Biomass
Barley↓ number of plants and tillers↓ weight of stem and ears↓ no. of grain
Oilseed rape↓ length of stem↓ no. of seed pods
High CO2
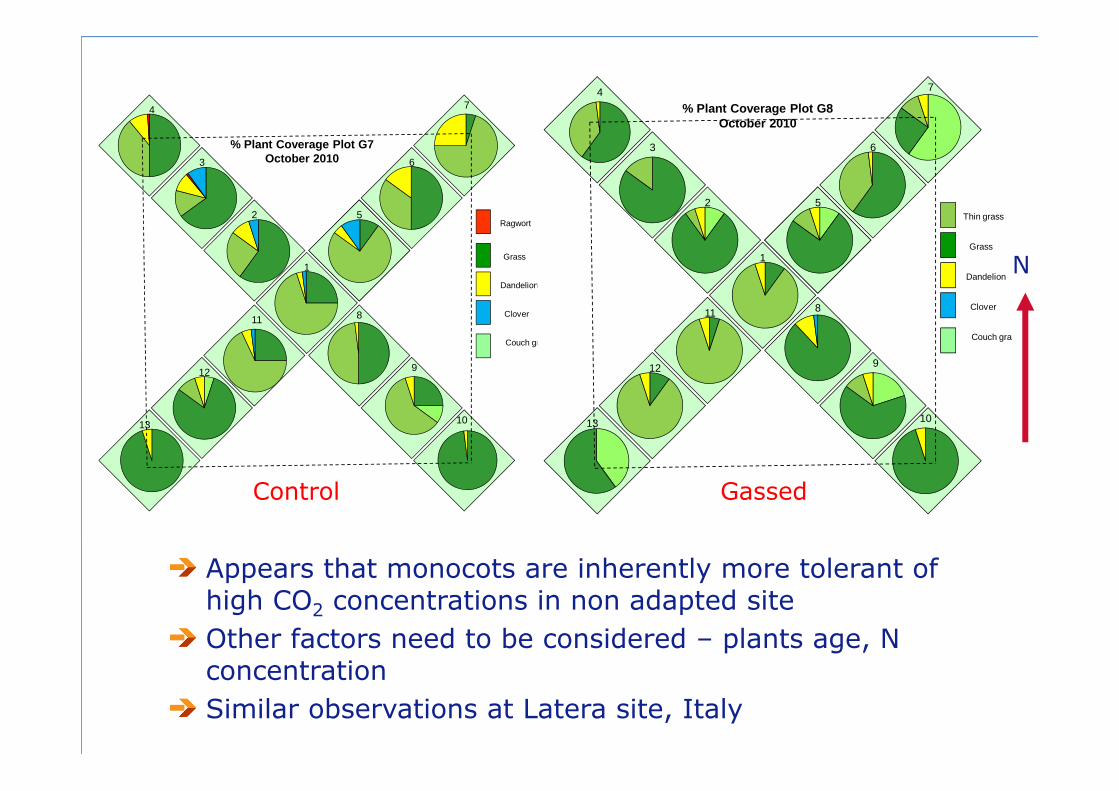
Appears that monocots are inherently more tolerant of high CO2 concentrations in non adapted siteOther factors need to be considered – plants age, N concentrationSimilar observations at Latera site, Italy
N1
2
3
4
5
6
7
8
9
10
11
12
13
% Plant Coverage Plot G7 October 2010
Grass
Dandelion
Clover
Couch grass
Ragwort
1
2
3
4
5
6
7
8
9
10
11
12
13
% Plant Coverage Plot G8 October 2010
Thin grass
Grass
Dandelion
Clover
Couch gras
GassedControl
6th CO2GeoNet Open Forum, May 9‐11 2011 – Venice, San Servolo Island 18
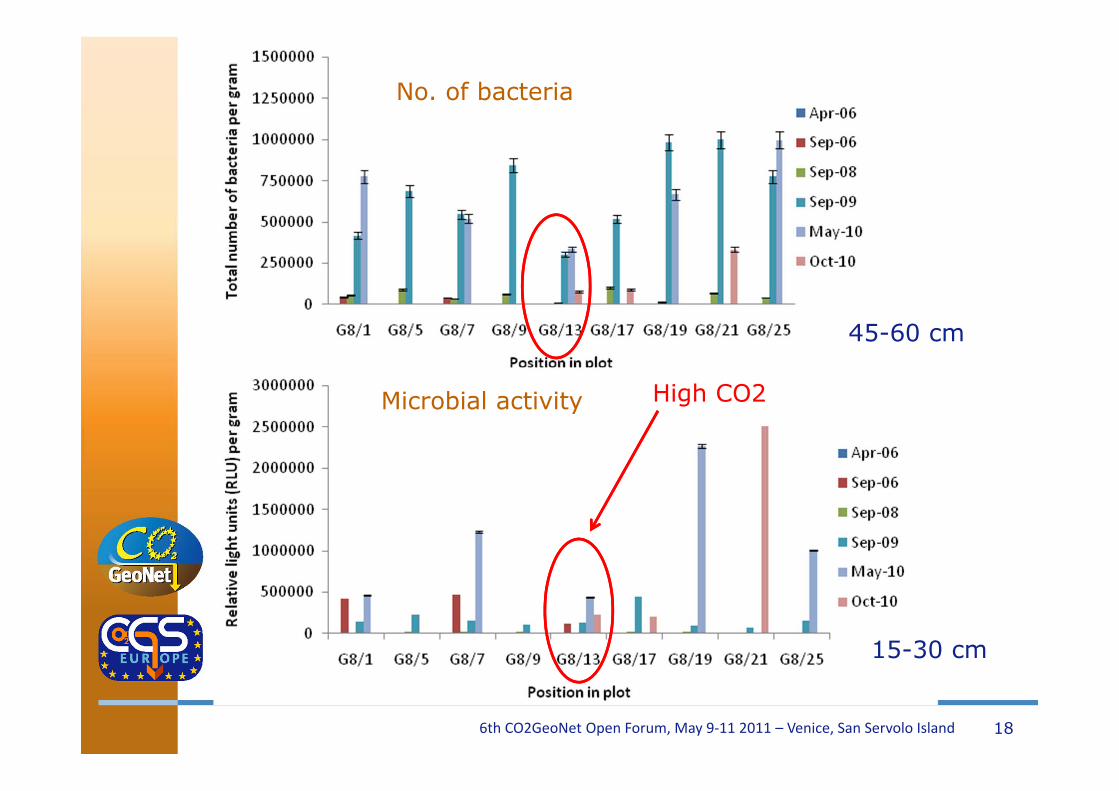
45-60 cm
15-30 cm
No. of bacteria
Microbial activity High CO2
19
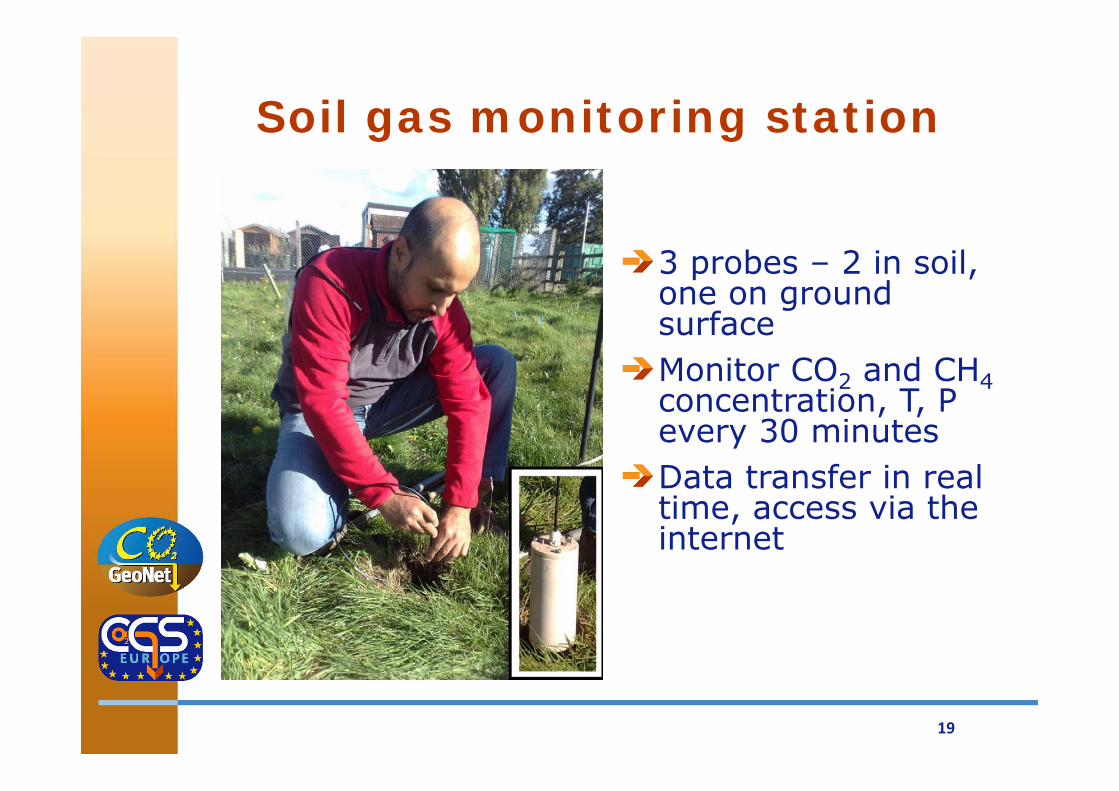
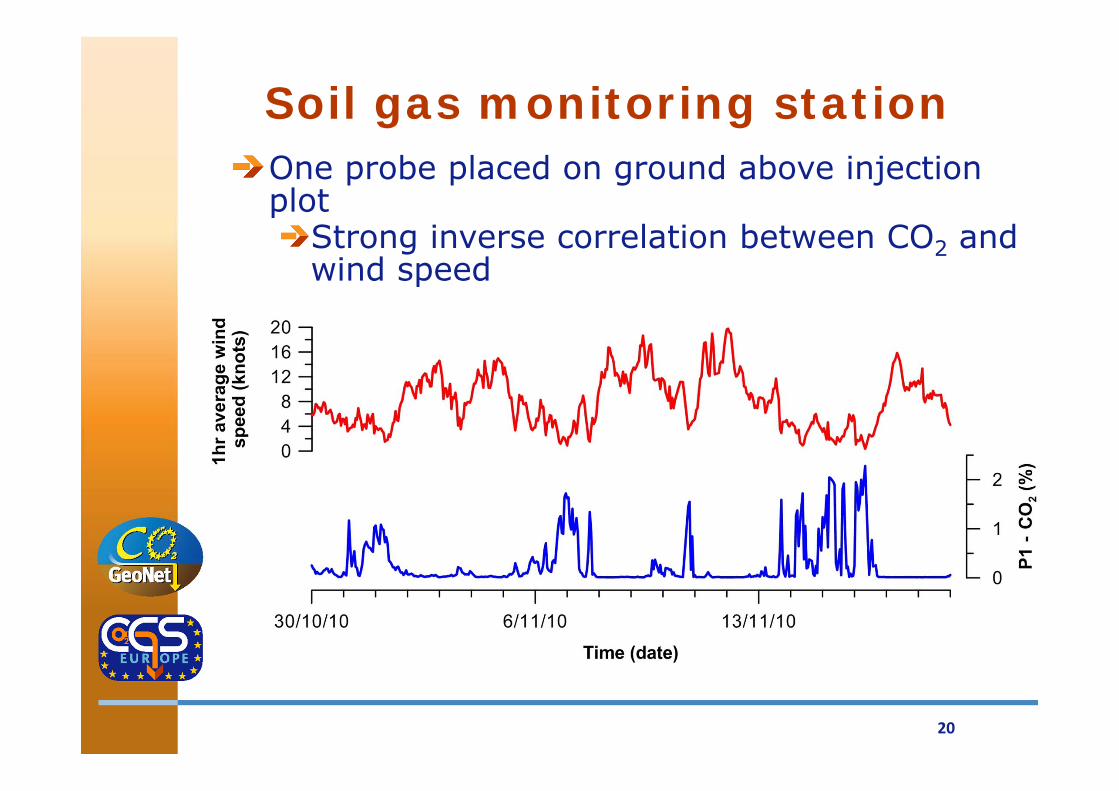
Soil gas monitoring station
3 probes – 2 in soil, one on ground surfaceMonitor CO2 and CH4concentration, T, P every 30 minutesData transfer in real time, access via the internet
20
Soil gas monitoring stationOne probe placed on ground above injection plot
Strong inverse correlation between CO2 and wind speed
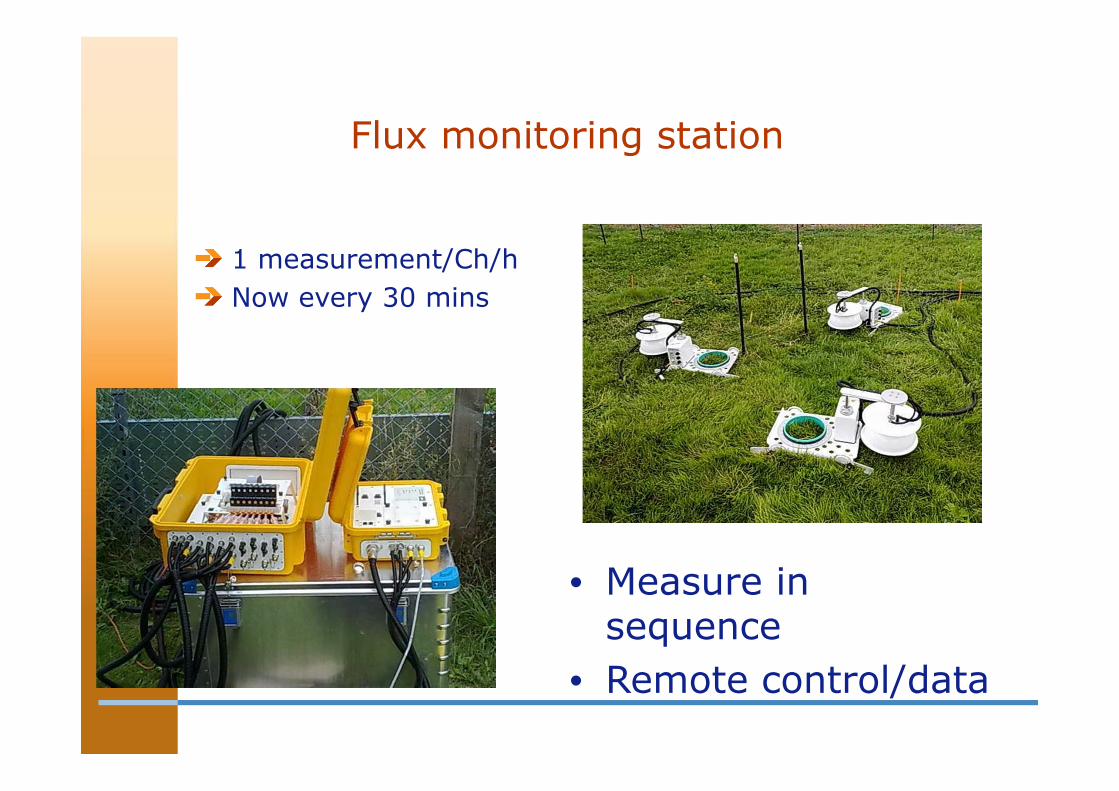
Flux monitoring station
1 measurement/Ch/hNow every 30 mins
• Measure in sequence
• Remote control/data
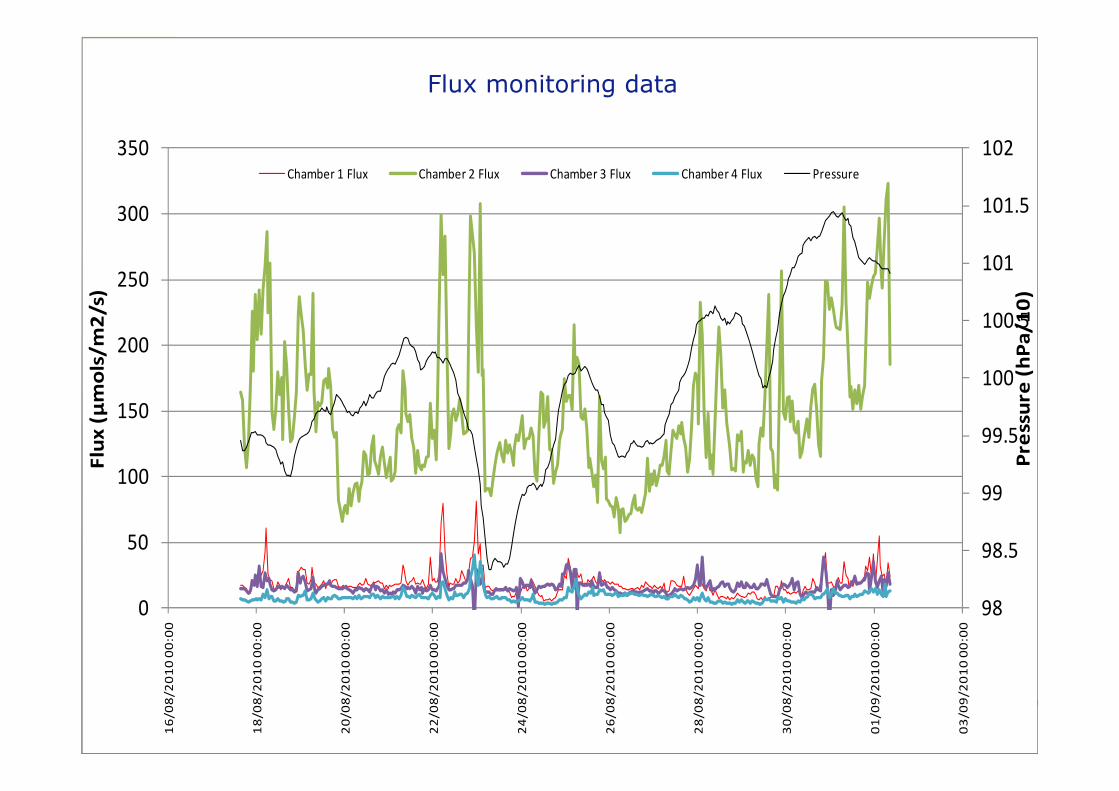
Flux chambers (data)
98
98.5
99
99.5
100
100.5
101
101.5
102
0
50
100
150
200
250
300
35016
/08/20
10 00:00
18/08/20
10 00:00
20/08/20
10 00:00
22/08/20
10 00:00
24/08/20
10 00:00
26/08/20
10 00:00
28/08/20
10 00:00
30/08/20
10 00:00
01/09/20
10 00:00
03/09/20
10 00:00
Pressure (h
Pa/10)
Flux
(µmols/m2/s)
Chamber 1 Flux Chamber 2 Flux Chamber 3 Flux Chamber 4 Flux Pressure
Flux monitoring data
Naturally leaking sites in southern Europe
Wide variety of flux ratesRange of time scales
Recent e.g. Florina well siteLong term (e.g. Latera, San Vittorino, Montmiral)
Different compositionsImpacts on:
Groundwater qualityUse of CO2-impacted water for irrigation (e.g. corn, wheat)Impact of gas on vegetation
Review of existing data, collection and analysis of groundwater samples, Florina
28
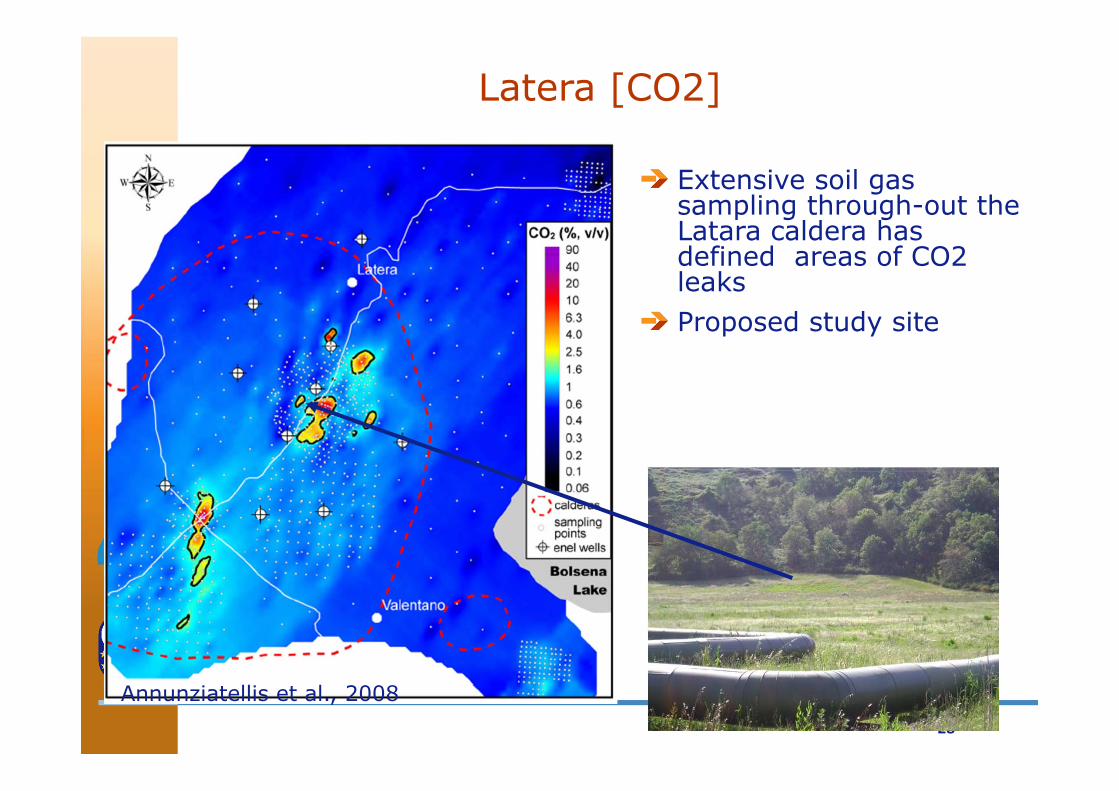
Latera [CO2]
Extensive soil gas sampling through-out the Latara caldera has defined areas of CO2 leaksProposed study site
Annunziatellis et al., 2008