Embed Size (px)
Citation preview
UNIVERSITY OF ZAMBIAINSTITUTE FOR HEALTH METRICS AND EVALUATIONUNIVERSITY OF WASHINGTON
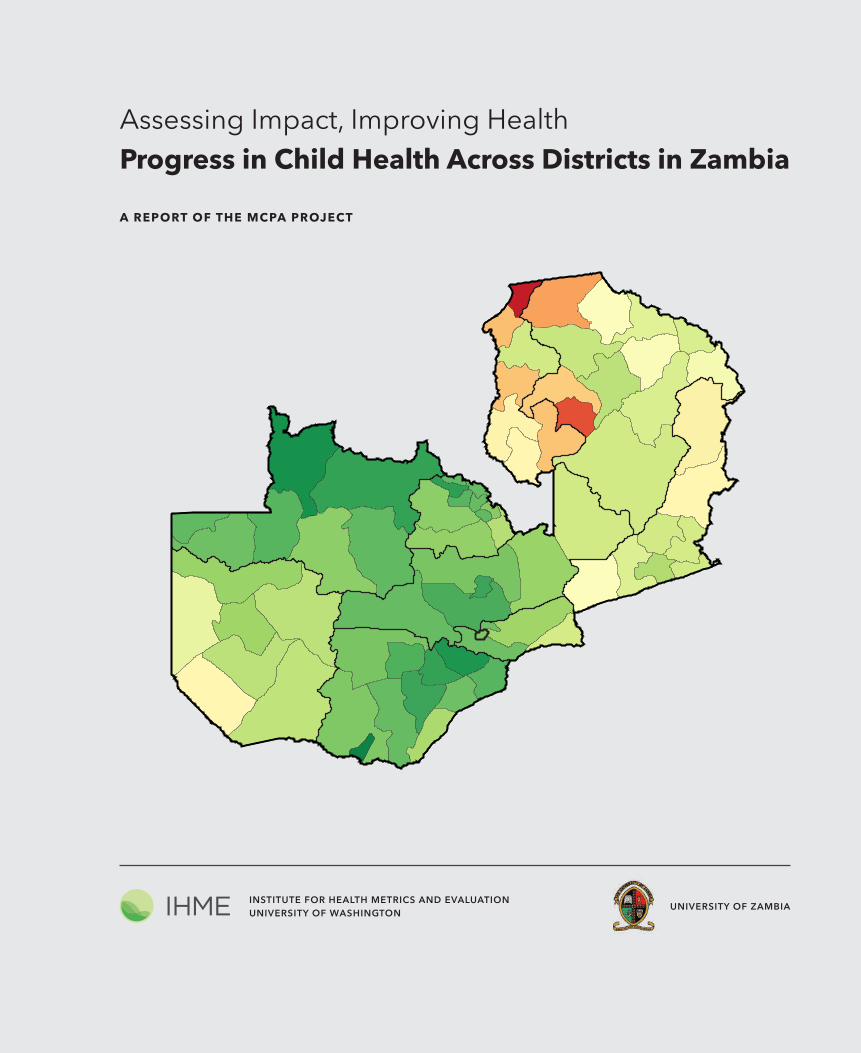
Assessing Impact, Improving HealthProgress in Child Health Across Districts in Zambia
A REPORT OF THE MCPA PROJECT
This report was prepared by the Institute for Health Metrics and Evaluation (IHME) and the Department of Economics at the University of Zambia (UNZA). This work is intended to provide in-formation on levels and trends in under-5 mortality and coverage of key child health interventions across districts in Zambia. The estimates may change following peer review. The contents of this publication may not be reproduced in whole or in part without permission from IHME.
Institute for Health Metrics and Evaluation2301 Fifth Ave., Suite 600Seattle, WA 98121USA
Telephone: +1-206-897-2800Fax: +1-206-897-2899Email: comms@healthmetricsandevaluation.orgwww.healthmetricsandevaluation.org
Printed in the United States© 2014 Institute for Health Metrics and Evaluation
1
TABLE OF CONTENTS
3 Acronyms
4 Termsanddefinitions
5 Executivesummary
6 Introduction
8 Mainfindings
12 Conclusionsandpolicyimplications
13 References
14 Annex1.OverviewoftheMCPAanalyticalapproachandmethods
15 Districtprofiles
17 Centralprovince
31 Copperbeltprovince
53 Easternprovince
71 Luapulaprovince
87 Lusakaprovince
97 Northernprovince
123 North-westernprovince
139 Southernprovince
163 Westernprovince
AssessingImpact,ImprovingHealthProgress in Child Health Across Districts in Zambia
A REPORT OF THE MCPA PROJECT
2
ABOUT IHME
ACKNOWLEDGMENTS
ABOUT THIS REPORT
The Institute for HealthMetrics and Evaluation (IHME) is anindependentglobalhealth researchcenterat theUniversityofWashington thatprovides rigorousandcomparablemea-surementoftheworld’smostimportanthealthproblemsandevaluates thestrategiesused toaddress them. IHMEmakesthisinformationfreelyavailablesothatpolicymakershavetheevidencetheyneedtomakeinformeddecisionsabouthowtoallocateresourcestobestimprovepopulationhealth.
To express interest in collaborating or request furtherinformationontheMalariaControlPolicyAssessment(MCPA)projectinZambia,pleasecontactIHMEat:
InstituteforHealthMetricsandEvaluation2301FifthAve.,Suite600Seattle,WA98121USA
Telephone:+1-206-897-2800Fax:+1-206-897-2899E-mail:comms@healthmetricsandevaluation.orgwww.healthmetricsandevaluation.org
Assessing Impact, Improving Health: Progress in Child Health Across Districts in Zambia provides the most up-to-date re-sultsfromtheMCPAprojectinZambia,includingdistrict-leveltrendsforarangeofindicatorsandtheimpactofmalariacon-trolandotherchildhealthinterventionsonunder-5mortality.Thisreportexpandsuponthe2011reportproducedbyIHMEand the University of Zambia (UNZA), Maternal and Child Health Intervention Coverage in Zambia: the Heterogeneous Picture.
TheMCPAprojectwasledbyEmmanuelaGakidouatIHMEandFelixMasiye atUNZA.Data collationwasprimarily con-
ductedbyPeterHangomaandPeterMulenga,researchersattheDepartmentofEconomicsatUNZA,andFrankKukungaattheCentralStatisticalOffice(CSO).Trendsinunder-5mortalitywereproducedbyLauraDwyer-Lindgrenat IHME,withcon-tributionsfromCaseyOlivesoftheUniversityofWashington.AtIHME,interventioncoverageanalyseswereconductedbyK.EllicottColson,withcontributions fromLauraDwyer-Lind-gren, Tom Achoki, Nancy Fullman, and Matthew Schneider(nowatUSAID).ThecausalattributionanalysiswasperformedbyMarieNgandK.EllicottColson.ThisreportwaswrittenbyNancyFullman,withcontributionsfromWilliamHeisel.
TheMCPAproject inZambia isacollaborationbetween theDepartmentofEconomicsatUNZAand IHMEat theUniver-sityofWashington.ThisprojecthasbenefitedgreatlyfromkeyinputsandsupportfromtheMinistryofHealth(MOH),theNa-tionalMalariaControlCentre(NMCC),CSO,andtheChurchesHealthAssociationofZambia(CHAZ),inZambia.Wearemostgratefultotheseorganizations,especiallyfortheirwillingnessto facilitate data access and provide crucial content knowl-edge.
We thank the MCPA Advisory Group, which consists ofinternationalandlocalstakeholderswhocontributedtowardrefining the project’s research concept and framework.WealsothanktheMalariaControlandEvaluationPartnership in
Africa(MACEPA)teaminZambiaforfacilitatingdataaccess.AtIHME,wewishtothankHeatherBonander,AnnieHaakenstad,andKelseyPierce formanaging theproject; PatriciaKiyonoformanaging theproductionof this report; BrianChildress, Adrienne Chew, and KateMuller for editorial support; andRyanDiazandAnnKumasaka forgraphicdesign.We thankSepoKusiyoatUNZA foradministrativesupportof theZam-bianMCPAteam.
Funding for this research came from the Bill &MelindaGatesFoundation.
3
Acronyms AIDS AcquiredimmunodeficiencysyndromeANC4 Antenatalcare,aminimumoffourvisitsBCG BacillusCalmette-GuérinvaccineCSO CentralStatisticalOfficeDPT3 Diphtheria-pertussis-tetanusvaccine(threedoses)GPR GaussianProcessRegressionHIV HumanimmunodeficiencyvirusIHME InstituteforHealthMetricsandEvaluationIPTp2 Intermittentpreventivetherapyinpregnancy,aminimumoftwodosesIRS IndoorresidualsprayingITN Insecticide-treatednetJICA JapanInternationalCooperationAgencyMCPA MalariaControlPolicyAssessmentMOH MinistryofHealthMSL MedicalStoresLimitedNMCC NationalMalariaControlCentrePCA PrincipalcomponentanalysisPMTCT Preventionofmother-to-childtransmissionofHIVSBA SkilledbirthattendanceUNZA UniversityofZambia
4
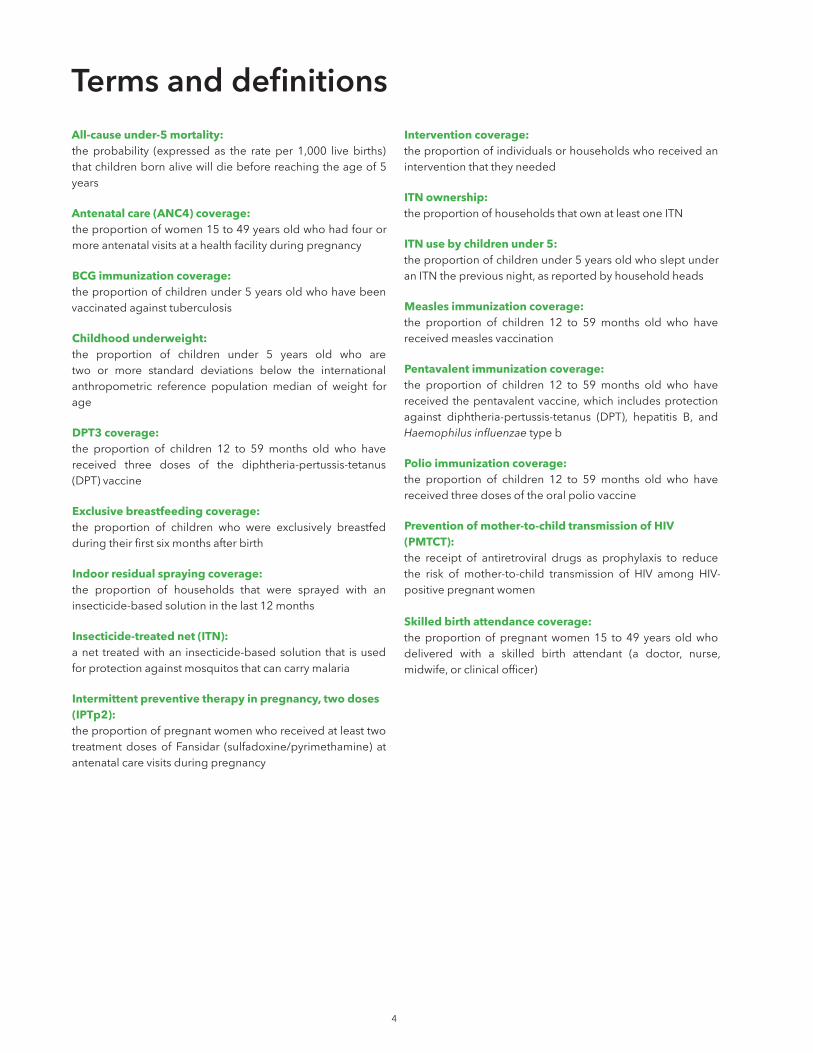
Terms and definitionsAll-cause under-5 mortality: theprobability (expressed as the rateper 1,000 livebirths)thatchildrenbornalivewilldiebeforereachingtheageof5years
Antenatal care (ANC4) coverage: theproportionofwomen15to49yearsoldwhohadfourormoreantenatalvisitsatahealthfacilityduringpregnancy
BCG immunization coverage: theproportionofchildrenunder5yearsoldwhohavebeenvaccinatedagainsttuberculosis
Childhood underweight: the proportion of children under 5 years old who aretwo or more standard deviations below the internationalanthropometric reference population median of weight forage
DPT3 coverage: the proportion of children 12 to 59 months old who havereceived three doses of the diphtheria-pertussis-tetanus(DPT)vaccine
Exclusive breastfeeding coverage: the proportion of children who were exclusively breastfedduringtheirfirstsixmonthsafterbirth
Indoor residual spraying coverage: the proportion of households that were sprayed with aninsecticide-basedsolutioninthelast12months
Insecticide-treated net (ITN): anet treatedwithan insecticide-basedsolutionthat isusedforprotectionagainstmosquitosthatcancarrymalaria
Intermittent preventive therapy in pregnancy, two doses (IPTp2): theproportionofpregnantwomenwhoreceivedatleasttwotreatmentdosesof Fansidar (sulfadoxine/pyrimethamine) atantenatalcarevisitsduringpregnancy
Intervention coverage: theproportionofindividualsorhouseholdswhoreceivedaninterventionthattheyneeded
ITN ownership: theproportionofhouseholdsthatownatleastoneITN
ITN use by children under 5: theproportionofchildrenunder5yearsoldwhosleptunderanITNthepreviousnight,asreportedbyhouseholdheads
Measles immunization coverage: the proportion of children 12 to 59 months old who havereceivedmeaslesvaccination
Pentavalent immunization coverage: the proportion of children 12 to 59 months old who havereceivedthepentavalentvaccine,which includesprotectionagainst diphtheria-pertussis-tetanus (DPT), hepatitis B, andHaemophilus influenzae typeb
Polio immunization coverage: the proportion of children 12 to 59 months old who havereceivedthreedosesoftheoralpoliovaccine
Prevention of mother-to-child transmission of HIV (PMTCT):the receipt of antiretroviral drugs as prophylaxis to reducethe risk of mother-to-child transmission of HIV among HIV-positivepregnantwomen
Skilled birth attendance coverage: theproportionofpregnantwomen15 to49yearsoldwhodelivered with a skilled birth attendant (a doctor, nurse,midwife,orclinicalofficer)
5
Executive summaryZambiahasseenremarkable improvement inchildhoodsur-vivaloverthepasttwodecades.Whilethescale-upofmalariacontrol interventionshasbeenproposedasoneof thebig-gestdriversbehindthatimprovement,littleresearchhasbeendoneonhowmuchof the reduction in childhoodmortalitymaybeattributedtomalariacontrolandhowmuchisthere-sult of improvements inother childhealth interventions.Toaddressthisknowledgegap,theUniversityofZambia(UNZA)and the Institute for Health Metrics and Evaluation (IHME)worked together on theMalaria Control Policy Assessment(MCPA) project. The goal ofMCPAwas to harness existingdatainZambiaanduserigorousstatisticalmethodstoquan-tify the impact of malaria control and other child healthinterventionsonunder-5mortalitytrendsacrossdistricts.
Wefoundthatbetween1990and2010,acombinationofrapidlyscaledupchildhealthinterventionscontributedtoanadditional11%ofdeclinesinunder-5mortalityacrossZambia.We lookedat thecombinedeffectof these interventionsbe-cause the scale-up in ownership of insecticide-treated nets(ITNs)anduseofindoorresidualspraying(IRS)coincidedwiththescale-upinthreeotherkeychildhealthinterventions:thepentavalentvaccine,exclusivebreastfeeding,andservicestohelppreventmother-to-child transmissionofHIV (PMTCT)athealthfacilities.Isolatingthespecificimpactofeachinterven-tion isnotpossible.Nevertheless, jointly, these interventionscontributedsignificantlytothereductionofunder-5mortalitythroughoutthecountry.
TheMCPAprojectinZambiaproduceddistrict-leveltrendsforkeychildhealthoutcomesandinterventionsfrom1990to2010.This is thefirst time thatannualestimates forunder-5mortalityandinterventioncoveragehavebeengeneratedatthedistrict level. In this report,districtprofilesdetail trendsin child health over time and benchmark the districts’ per-formance across indicators.With this information, local andnationalpolicymakersandhealthofficials can identify areasofsuccessfulhealthservicedeliveryanddetectearlysignsofdeclininginterventioncoverageorstalledprogress.
This report shows that Zambia is succeeding on severalfrontsinchildhealth.First,countrywidereductionsinunder-5mortalitywerealsoaccompaniedbyimprovementsinequity
acrossdistricts,assomeofthedistrictswiththehighestmor-talityratesin1990recordedsomeofthegreatestdeclinesby2010.Second,coverageofkeymalariacontrolinterventions,such as ITN ownership, increased dramatically inmany dis-tricts.Third,themajorityofdistrictsweresuccessfulinquicklyincreasing coverage of the pentavalent vaccine after its in-troduction in 2005. Finally, rates of exclusive breastfeedingmarkedly rose in most districts, reflecting the country’s in-vestments in improving child nutrition and breastfeedingpractices(WBTi2008).
ThesesuccesseswereaccompaniedbyconcerningtrendsforthreekeychildhealthinterventionsinZambia.First,mostdistrictssawadeclineinthe2000sinantenatalcare(ANC4),which is theproportionofpregnantwomen15 to49 yearsold who had four or more visits to a health facility duringpregnancy. This finding is particularlyworrisomegiven thatdistrictsgenerallyincreasedlevelsofANC4duringthe1990s.Second, coverage of polio immunization dropped in someof thedistricts that are consideredathigh risk forpolio im-portationfromneighboringcountries.Third,insomeareasofZambia, skilledbirthattendancedeclined tovery low levels.Targeting these areas for improvement shouldbe aprioritytoensurethatthecountry’sachievementsinchildhealthcon-tinueintothepresentdecade.
Withafocusondistricts,findingsfromtheMCPAprojectin Zambia provide side-by-side comparisons of health per-formanceover time, geography, and intervention type.Thechild health landscape is remarkably heterogeneous acrossdistricts,highlightingtheneedforcontinuousandtimelyas-sessmentofdistrict-leveltrends.Withregularlycollectedandanalyzed district health information, policymakers can havetheevidencebasetomaketargeted,data-drivendecisionsforachievinggreaterandmoreequitablehealthgainsinZambia.
6
IntroductionOver the past decade, Zambia’s child health and develop-ment landscape has been substantially reshaped by newprograms, interventions, and priorities, including extensivemalariacontrolprograms. Inorder to fullyunderstandwhathascontributedtoZambia’sprogress inunder-5mortality, itisimportanttocomprehensivelyaccountforalleffortstoim-provechildhealth.
TheMCPAprojectinZambiahadtwomainobjectives:1) Determine what proportion of the decline in all-cause
under-5 mortality in Zambia was attributable to thescale-upofmalariacontrolinterventions,whileaccountingfor a range of other key child health interventions andnon-healthfactors.
2) Assessthisimpactatthedistrictlevelbetween1990and2010.
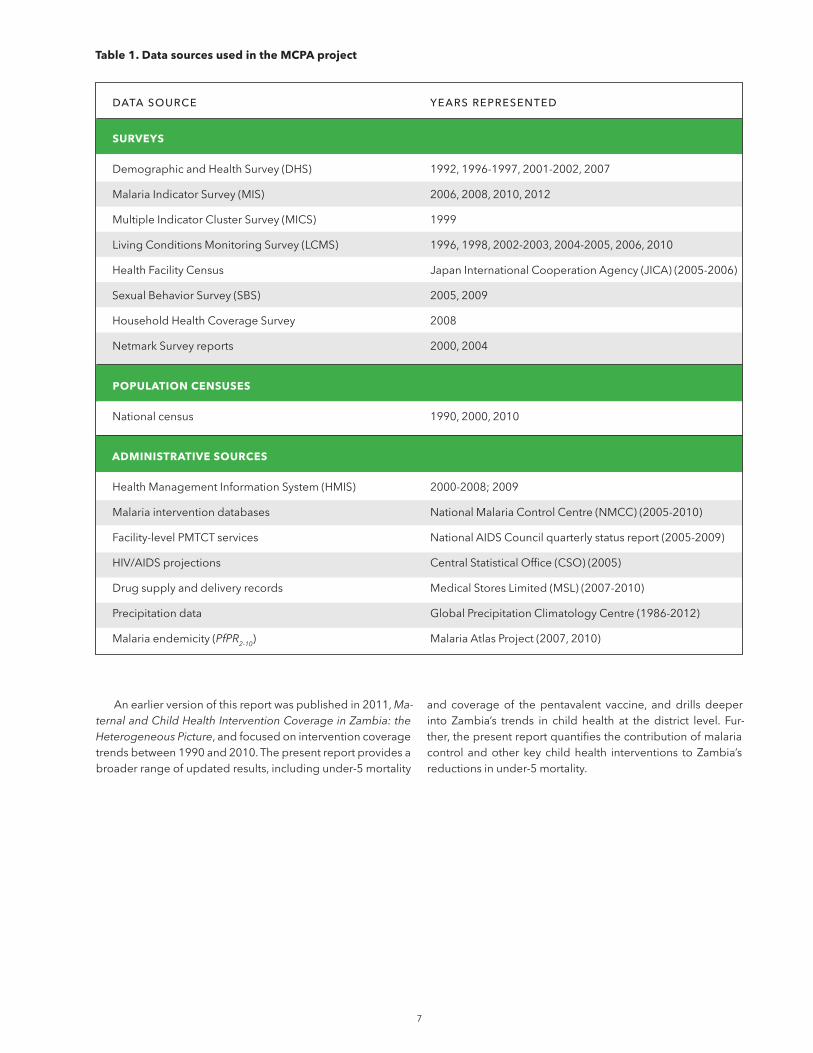
Inordertoachievetheseobjectives,annualestimatesofdistrict-level trends from 1990 to 2010 were systematicallygenerated foreachof the72districts inZambiaandacrossa range of key child health outcomes and interventions.Detaileddescriptionsofthefindingsforeachdistrictarepre-sented in this report.District-leveldatacanbedownloadedfrom IHME’s Global Health Data Exchange: http://ghdx.healthmetricsandevaluation.org/.
TheMCPAprojectsoughttouseallavailabledatasources,whicharepresentedinTable1.Theseanalysesaimedtomakefull useof thebest availabledata in Zambia. Provincial esti-matesof under-5mortality and intervention coveragewerepreviouslyavailable,butforthefirsttimedistrict-leveltrendswerederivedfromthesedatasourcesusingrobuststatisticalmethods.Annex1providesanoverviewoftheanalyticalap-proachusedtogeneratetheestimatesinthisreport.
BOX 1
MAIN FINDINGS FROM THE MCPA PROJECT IN ZAMBIA
Under-5mortalitysubstantiallydeclinedthroughoutZambiafrom1990to2010.Someofthegreatestprogresswasrecordedindistrictswiththehighestlevelsofunder-5mortalityin1990.
Coverage of malaria control interventions rapidly increased, especially between 2005 and 2010.ThesegainsincoveragewereobservedthroughoutZambia.
Atthesametimemalariainterventionswerescaledup,Zambiaalsosuccessfullyincreasedlevelsofcoverageforthreenon-malariachildhealthinterventions:thepentavalentvaccine,exclusivebreast-feeding,andtheavailabilityofPMTCTservicesathealthfacilities.
Together,theserapidlyscaledupinterventionswereresponsibleforan11%reductionintheunder-5mortalityratefrom2000to2010.SustaininghighcoverageoftheseinterventionsiscriticalforchildhealthinZambia.
Amidstthecountry’shealthsuccesses,someworrisometrendsemergedthatwarrantattention.Mostdistrictssawsharpdeclinesinantenatalcarevisitsduringthe2000s,andskilledbirthattendancefelltoverylowlevelsinseveralplaces.Othersexperiencedaminimalscale-upofthepentavalentvaccine,andsomeofthehigh-riskdistrictsforpolioimportationrecordeddropsinpolioimmunizationcov-erage.Addressingthesegapsinhealthserviceprovisioniscrucialtomaintainingthecountry’sgainsinchildhealth.
7
Table 1. Data sources used in the MCPA project
Anearlierversionofthisreportwaspublishedin2011,Ma-ternal and Child Health Intervention Coverage in Zambia: the Heterogeneous Picture,andfocusedoninterventioncoveragetrendsbetween1990and2010.Thepresentreportprovidesabroaderrangeofupdatedresults,includingunder-5mortality
and coverageof thepentavalent vaccine, anddrills deeperinto Zambia’s trends in child health at the district level. Fur-ther,thepresentreportquantifiesthecontributionofmalariacontrolandotherkeychildhealth interventions toZambia’sreductionsinunder-5mortality.
DATA SOURCE YEARS REPRESENTED
SURVEYS
DemographicandHealthSurvey(DHS) 1992,1996-1997,2001-2002,2007
MalariaIndicatorSurvey(MIS) 2006,2008,2010,2012
MultipleIndicatorClusterSurvey(MICS) 1999
LivingConditionsMonitoringSurvey(LCMS) 1996,1998,2002-2003,2004-2005,2006,2010
HealthFacilityCensus JapanInternationalCooperationAgency(JICA)(2005-2006)
SexualBehaviorSurvey(SBS) 2005,2009
HouseholdHealthCoverageSurvey 2008
NetmarkSurveyreports 2000,2004
POPULATION CENSUSES
Nationalcensus 1990,2000,2010
ADMINISTRATIVE SOURCES
HealthManagementInformationSystem(HMIS) 2000-2008;2009
Malariainterventiondatabases NationalMalariaControlCentre(NMCC)(2005-2010)
Facility-levelPMTCTservices NationalAIDSCouncilquarterlystatusreport(2005-2009)
HIV/AIDSprojections CentralStatisticalOffice(CSO)(2005)
Drugsupplyanddeliveryrecords MedicalStoresLimited(MSL)(2007-2010)
Precipitationdata GlobalPrecipitationClimatologyCentre(1986-2012)
Malariaendemicity(PfPR2-10) MalariaAtlasProject(2007,2010)
8
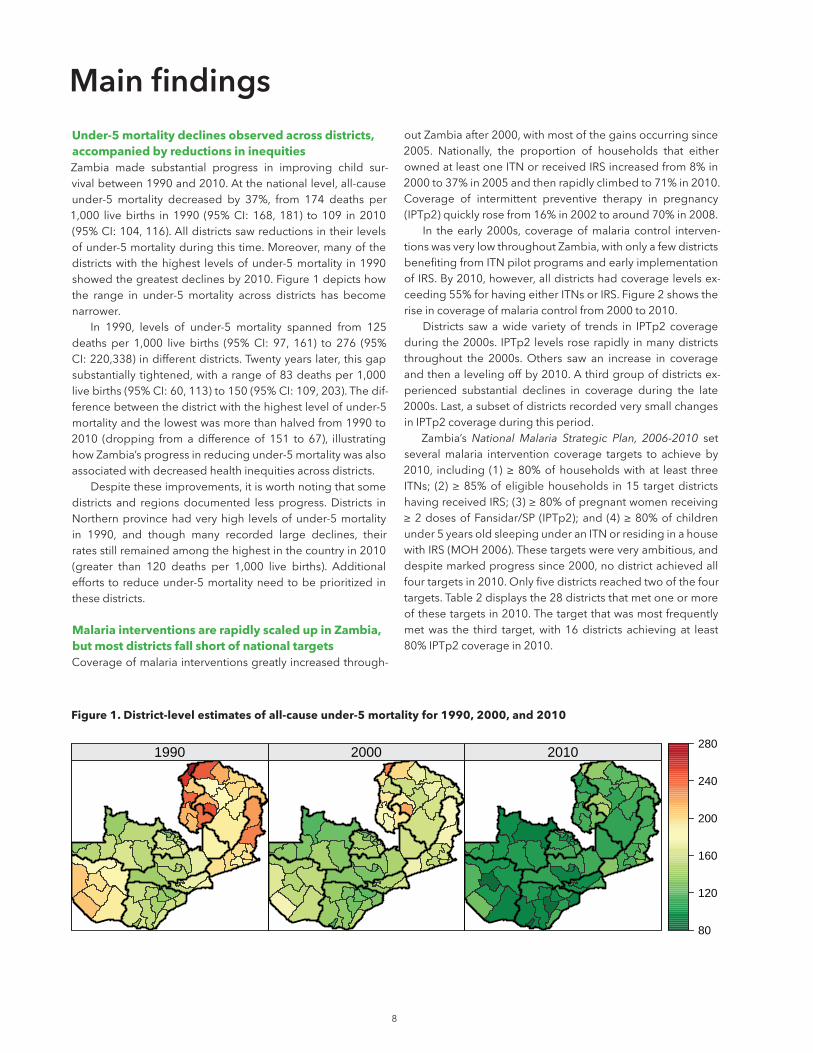
Main findingsUnder-5 mortality declines observed across districts, accompanied by reductions in inequities Zambia made substantial progress in improving child sur-vivalbetween1990and2010.Atthenationallevel,all-causeunder-5 mortality decreased by 37%, from 174 deaths per1,000 livebirths in1990 (95%CI: 168, 181) to109 in2010(95%CI:104,116).Alldistrictssawreductionsintheirlevelsofunder-5mortalityduringthistime.Moreover,manyofthedistrictswith thehighest levelsofunder-5mortality in1990showedthegreatestdeclinesby2010.Figure1depictshowthe range in under-5mortality across districts has becomenarrower.
In 1990, levels of under-5 mortality spanned from 125deaths per 1,000 live births (95%CI: 97, 161) to 276 (95%CI:220,338)indifferentdistricts.Twentyyearslater,thisgapsubstantiallytightened,witharangeof83deathsper1,000livebirths(95%CI:60,113)to150(95%CI:109,203).Thedif-ferencebetweenthedistrictwiththehighestlevelofunder-5mortalityandthelowestwasmorethanhalvedfrom1990to2010 (dropping fromadifferenceof 151 to 67), illustratinghowZambia’sprogressinreducingunder-5mortalitywasalsoassociatedwithdecreasedhealthinequitiesacrossdistricts.
Despitetheseimprovements,itisworthnotingthatsomedistricts and regionsdocumented lessprogress.Districts inNorthernprovincehadveryhigh levelsofunder-5mortalityin 1990, and though many recorded large declines, theirratesstillremainedamongthehighestinthecountryin2010(greater than 120 deaths per 1,000 live births). Additionalefforts toreduceunder-5mortalityneedtobeprioritized inthesedistricts.
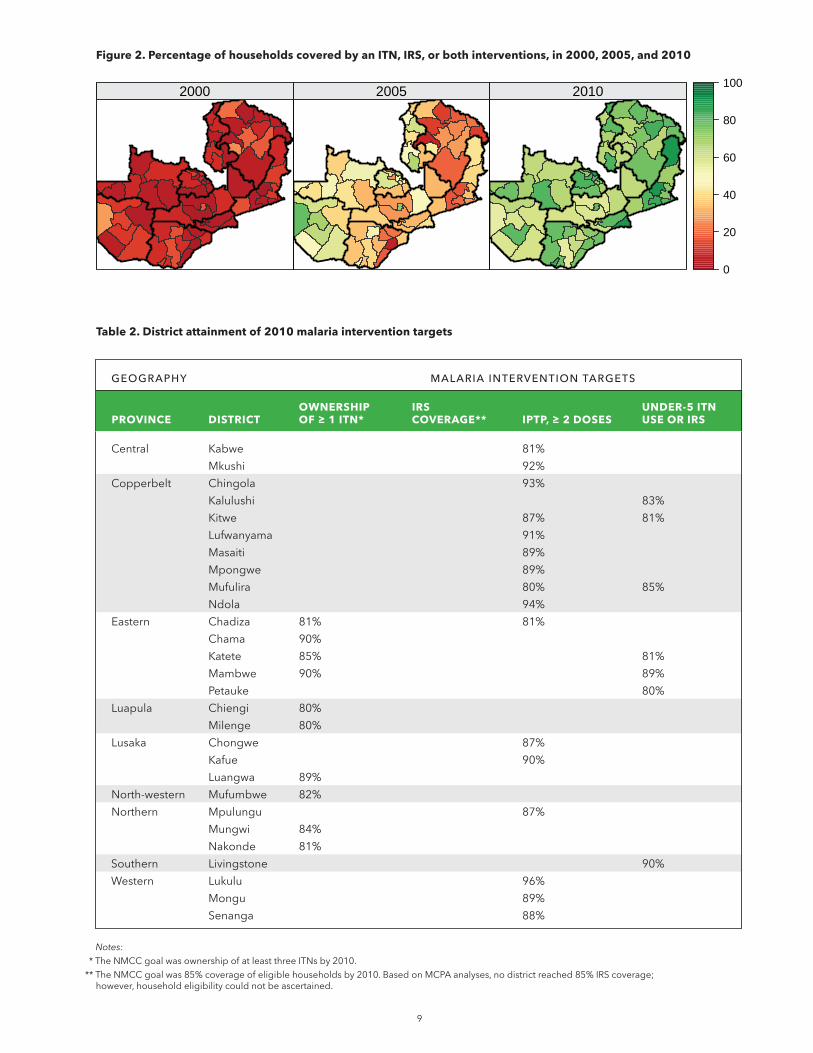
Malaria interventions are rapidly scaled up in Zambia, but most districts fall short of national targetsCoverageofmalariainterventionsgreatlyincreasedthrough-
outZambiaafter2000,withmostofthegainsoccurringsince2005. Nationally, the proportion of households that eitherownedatleastoneITNorreceivedIRSincreasedfrom8%in2000to37%in2005andthenrapidlyclimbedto71%in2010.Coverage of intermittent preventive therapy in pregnancy(IPTp2)quicklyrosefrom16%in2002toaround70%in2008.
In theearly2000s, coverageofmalaria control interven-tionswasverylowthroughoutZambia,withonlyafewdistrictsbenefitingfromITNpilotprogramsandearlyimplementationofIRS.By2010,however,alldistrictshadcoveragelevelsex-ceeding55%forhavingeitherITNsorIRS.Figure2showstheriseincoverageofmalariacontrolfrom2000to2010.
Districts sawawide varietyof trends in IPTp2 coverageduringthe2000s. IPTp2levelsroserapidly inmanydistrictsthroughout the 2000s.Others saw an increase in coverageandthenalevelingoffby2010.Athirdgroupofdistrictsex-perienced substantial declines in coverage during the late2000s.Last,asubsetofdistrictsrecordedverysmallchangesinIPTp2coverageduringthisperiod.
Zambia’sNational Malaria Strategic Plan, 2006-2010 setseveralmalaria intervention coverage targets to achieveby2010, including (1)≥80%ofhouseholdswithat least threeITNs; (2)≥85%ofeligiblehouseholds in15 targetdistrictshavingreceivedIRS;(3)≥80%ofpregnantwomenreceiving≥2dosesofFansidar/SP(IPTp2);and(4)≥80%ofchildrenunder5yearsoldsleepingunderanITNorresidinginahousewithIRS(MOH2006).Thesetargetswereveryambitious,anddespitemarkedprogresssince2000,nodistrictachievedallfourtargetsin2010.Onlyfivedistrictsreachedtwoofthefourtargets.Table2displaysthe28districtsthatmetoneormoreofthesetargetsin2010.Thetargetthatwasmostfrequentlymetwas the third target,with16districts achievingat least80%IPTp2coveragein2010.
Figure 1. District-level estimates of all-cause under-5 mortality for 1990, 2000, and 2010
1990 2000 2010
80
120
160
200
240
280
9
2000 2005 2010
0
20
40
60
80
100
Figure 2. Percentage of households covered by an ITN, IRS, or both interventions, in 2000, 2005, and 2010
GEOGRAPHY MALARIA INTERVENTION TARGETS
OWNERSHIP IRS UNDER-5 ITN PROVINCE DISTRICT OF ≥ 1 ITN* COVERAGE** IPTP, ≥ 2 DOSES USE OR IRS
Central Kabwe 81% Mkushi 92% Copperbelt Chingola 93% Kalulushi 83% Kitwe 87% 81% Lufwanyama 91% Masaiti 89% Mpongwe 89% Mufulira 80% 85% Ndola 94% Eastern Chadiza 81% 81% Chama 90% Katete 85% 81% Mambwe 90% 89% Petauke 80%Luapula Chiengi 80% Milenge 80% Lusaka Chongwe 87% Kafue 90% Luangwa 89% North-western Mufumbwe 82% Northern Mpulungu 87% Mungwi 84% Nakonde 81% Southern Livingstone 90%Western Lukulu 96% Mongu 89% Senanga 88%
Table 2. District attainment of 2010 malaria intervention targets
Notes:*TheNMCCgoalwasownershipofatleastthreeITNsby2010.**TheNMCCgoalwas85%coverageofeligiblehouseholdsby2010.BasedonMCPAanalyses,nodistrictreached85%IRScoverage; however,householdeligibilitycouldnotbeascertained.
1 0
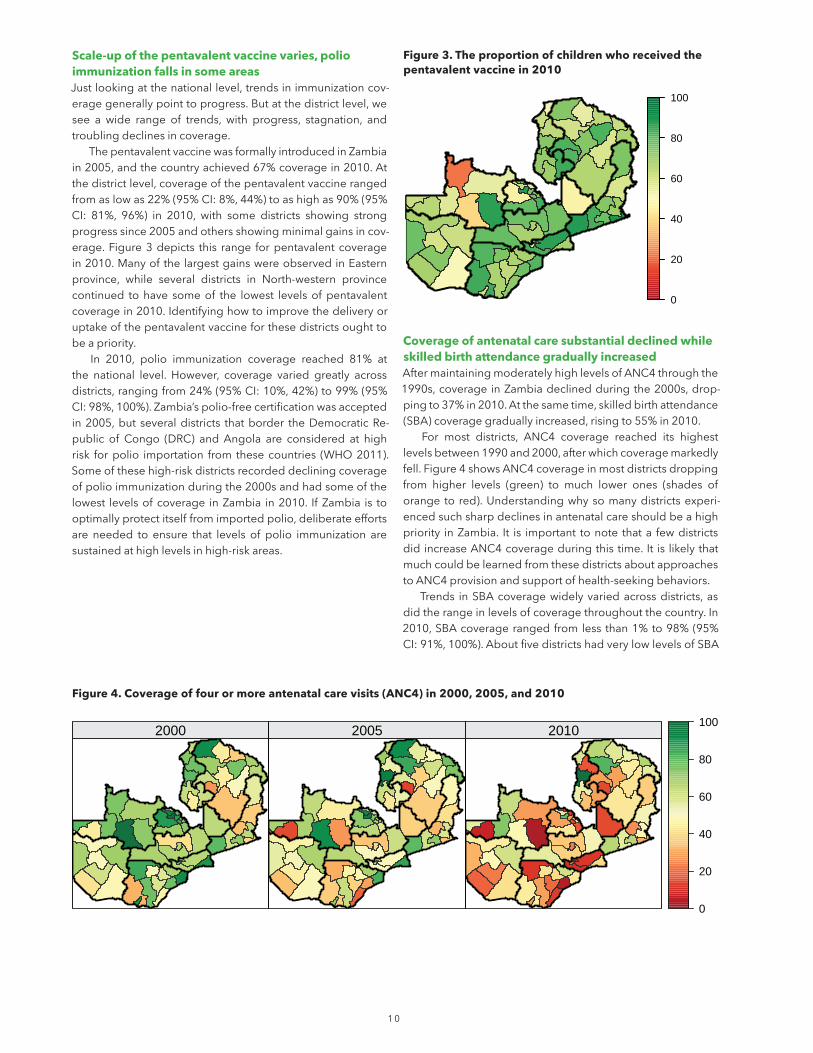
Scale-up of the pentavalent vaccine varies, polio immunization falls in some areasJustlookingatthenationallevel,trendsinimmunizationcov-eragegenerallypointtoprogress.Butatthedistrictlevel,wesee a wide range of trends, with progress, stagnation, andtroublingdeclinesincoverage.
ThepentavalentvaccinewasformallyintroducedinZambiain2005,andthecountryachieved67%coveragein2010.Atthedistrictlevel,coverageofthepentavalentvaccinerangedfromaslowas22%(95%CI:8%,44%)toashighas90%(95%CI: 81%, 96%) in 2010, with some districts showing strongprogresssince2005andothersshowingminimalgainsincov-erage.Figure3depicts this range forpentavalentcoveragein2010.ManyofthelargestgainswereobservedinEasternprovince, while several districts in North-western provincecontinued tohave someof the lowest levelsofpentavalentcoveragein2010.Identifyinghowtoimprovethedeliveryoruptakeofthepentavalentvaccineforthesedistrictsoughttobeapriority.
In 2010, polio immunization coverage reached 81% atthe national level. However, coverage varied greatly acrossdistricts,rangingfrom24%(95%CI:10%,42%)to99%(95%CI:98%,100%).Zambia’spolio-freecertificationwasacceptedin2005,but severaldistricts thatborder theDemocraticRe-public of Congo (DRC) andAngola are considered at highrisk forpolio importation from thesecountries (WHO2011).Someofthesehigh-riskdistrictsrecordeddecliningcoverageofpolioimmunizationduringthe2000sandhadsomeofthelowest levelsofcoverage inZambia in2010. IfZambia is tooptimallyprotectitselffromimportedpolio,deliberateeffortsare needed to ensure that levels of polio immunization aresustainedathighlevelsinhigh-riskareas.
Figure 3. The proportion of children who received the pentavalent vaccine in 2010
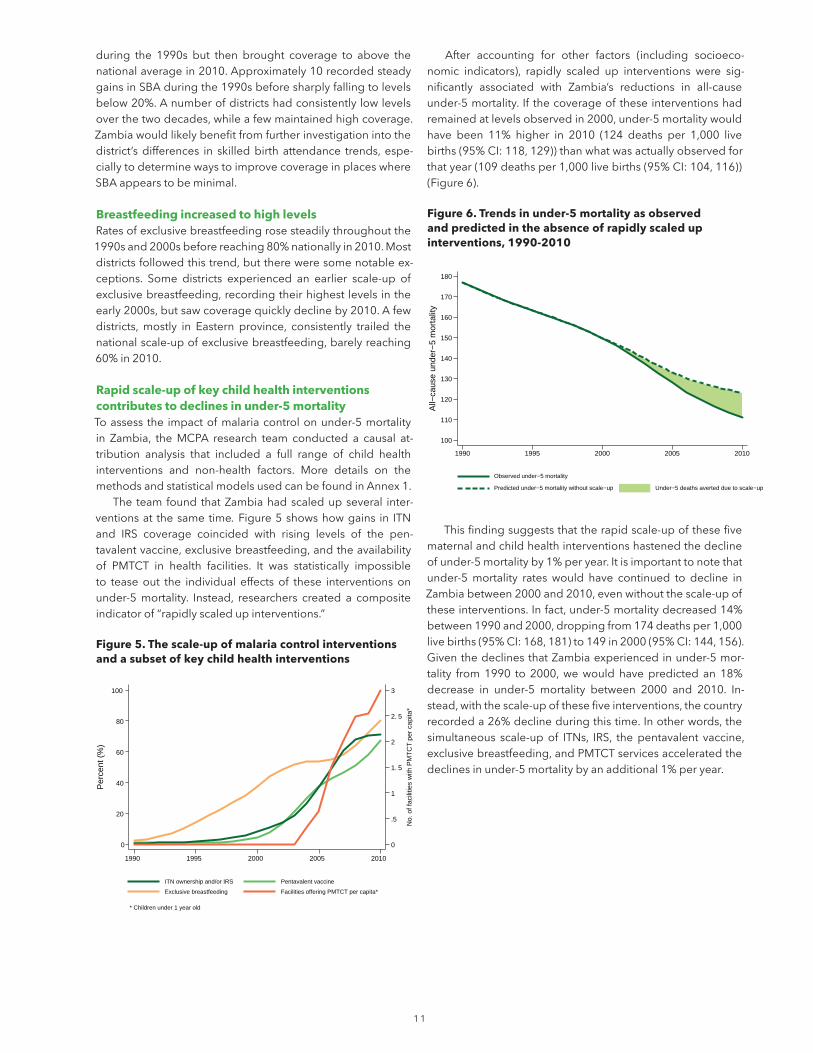
Coverage of antenatal care substantial declined while skilled birth attendance gradually increasedAftermaintainingmoderatelyhighlevelsofANC4throughthe1990s,coverageinZambiadeclinedduringthe2000s,drop-pingto37%in2010.Atthesametime,skilledbirthattendance(SBA)coveragegraduallyincreased,risingto55%in2010.
For most districts, ANC4 coverage reached its highestlevelsbetween1990and2000,afterwhichcoveragemarkedlyfell.Figure4showsANC4coverageinmostdistrictsdroppingfrom higher levels (green) to much lower ones (shades oforange to red).Understandingwhysomanydistrictsexperi-encedsuchsharpdeclinesinantenatalcareshouldbeahighpriority inZambia. It is important tonote thata fewdistrictsdidincreaseANC4coverageduringthistime.It is likelythatmuchcouldbelearnedfromthesedistrictsaboutapproachestoANC4provisionandsupportofhealth-seekingbehaviors.
Trends inSBAcoveragewidelyvariedacrossdistricts,asdidtherangeinlevelsofcoveragethroughoutthecountry.In2010,SBAcoveragerangedfromlessthan1%to98%(95%CI:91%,100%).AboutfivedistrictshadverylowlevelsofSBA
0
20
40
60
80
100
Figure 4. Coverage of four or more antenatal care visits (ANC4) in 2000, 2005, and 2010
2000 2005 2010
0
20
40
60
80
100
1 1
during the 1990s but then brought coverage to above thenationalaveragein2010.Approximately10recordedsteadygainsinSBAduringthe1990sbeforesharplyfallingtolevelsbelow20%.Anumberofdistrictshadconsistentlylowlevelsoverthetwodecades,whileafewmaintainedhighcoverage.Zambiawouldlikelybenefitfromfurtherinvestigationintothedistrict’sdifferences in skilledbirthattendance trends,espe-ciallytodeterminewaystoimprovecoverageinplaceswhereSBAappearstobeminimal.
Breastfeeding increased to high levelsRatesofexclusivebreastfeedingrosesteadilythroughoutthe1990sand2000sbeforereaching80%nationallyin2010.Mostdistrictsfollowedthistrend,butthereweresomenotableex-ceptions. Some districts experienced an earlier scale-up ofexclusivebreastfeeding,recordingtheirhighestlevelsintheearly2000s,butsawcoveragequicklydeclineby2010.Afewdistricts,mostly in Eastern province, consistently trailed thenationalscale-upofexclusivebreastfeeding,barelyreaching60%in2010.
Rapid scale-up of key child health interventions contributes to declines in under-5 mortalityToassess the impactofmalariacontrolonunder-5mortalityin Zambia, theMCPA research team conducted a causal at-tribution analysis that included a full range of child healthinterventions and non-health factors. More details on themethodsandstatisticalmodelsusedcanbefoundinAnnex1.
The teamfoundthatZambiahadscaledupseveral inter-ventionsat thesametime.Figure5showshowgains in ITNand IRS coverage coincided with rising levels of the pen-tavalentvaccine,exclusivebreastfeeding,andtheavailabilityof PMTCT in health facilities. It was statistically impossibleto teaseout the individual effects of these interventionsonunder-5mortality. Instead, researchers created a compositeindicatorof“rapidlyscaledupinterventions.”
Figure 5. The scale-up of malaria control interventions and a subset of key child health interventions
After accounting for other factors (including socioeco- nomic indicators), rapidly scaled up interventions were sig- nificantly associated with Zambia’s reductions in all-causeunder-5mortality. Ifthecoverageoftheseinterventionshadremainedatlevelsobservedin2000,under-5mortalitywouldhave been 11% higher in 2010 (124 deaths per 1,000 livebirths(95%CI:118,129))thanwhatwasactuallyobservedforthatyear(109deathsper1,000livebirths(95%CI:104,116))(Figure6).
Figure 6. Trends in under-5 mortality as observed and predicted in the absence of rapidly scaled up interventions, 1990-2010
Thisfindingsuggeststhattherapidscale-upofthesefivematernalandchildhealthinterventionshastenedthedeclineofunder-5mortalityby1%peryear.Itisimportanttonotethatunder-5mortality rateswould have continued to decline inZambiabetween2000and2010,evenwithoutthescale-upoftheseinterventions.Infact,under-5mortalitydecreased14%between1990and2000,droppingfrom174deathsper1,000livebirths(95%CI:168,181)to149in2000(95%CI:144,156).GiventhedeclinesthatZambiaexperiencedinunder-5mor-tality from1990 to 2000,wewouldhavepredicted an18%decrease in under-5 mortality between 2000 and 2010. In-stead,withthescale-upofthesefiveinterventions,thecountryrecordeda26%declineduringthistime.Inotherwords,thesimultaneous scale-upof ITNs, IRS, thepentavalent vaccine,exclusivebreastfeeding,andPMTCTservicesacceleratedthedeclinesinunder-5mortalitybyanadditional1%peryear.
0
.5
1
1. 5
2
2. 5
3
No.
of f
acili
ties
with
PM
TC
T p
er c
apita
*
0
20
40
60
80
100
Per
cent
(%
)
1990 1995 2000 2005 2010
ITN ownership and/or IRS Pentavalent vaccine
Exclusive breastfeeding Facilities offering PMTCT per capita*
* Children under 1 year old
100
110
120
130
140
150
160
170
180
All−
caus
e un
der−
5 m
orta
lity
1990 1995 2000 2005 2010
Observed under−5 mortality
Predicted under−5 mortality without scale−up Under−5 deaths averted due to scale−up
1 2
Between 1990 and 2010, the health landscape in Zambiamarkedlychanged,and for themostpart, thesechangesre-flect progress and service delivery success throughout thecountry.Under-5mortalitysubstantiallydecreasedat thena-tionallevel,andthegapbetweendistrictswiththehighestandlowest under-5 mortality substantially decreased. These de-clinesinunder-5mortalitycanbetiedtoZambia’ssuccessfulefforts in expanding coverage for a subset of child healthinterventions:ITNownership,IRS,thepentavalentvaccine,ex-clusivebreastfeeding,andtheavailabilityofPMTCTservices.These five interventions were rapidly scaled up during the2000sandjointlycontributedtoanadditional11%reductioninall-causeunder-5mortalityinZambiabeyondwhatwouldhavebeenexpectedbasedonthecountry’strendsinunder-5mortality during the 1990s. The scale-up ofmalaria controlhas been a key part of Zambia’s improved health serviceenvironment, and sustaining high levels of malaria controlinterventions, alongsideother life-saving interventions, is ofcriticalimportance.
Amidstthesesuccesses,IHMEandUNZAidentifiedsometroublingtrendsthatwarrantfurtherpolicyattention.Overall,theproportionofpregnantwomenwhosoughtat least fourantenatalcarevisitsdrasticallydecreasedbetween2000and2010.SeveraldistrictsrecordedlevelsofANC4below20%in2010,whichsuggeststhatavastmajorityofwomenintheseplaces do not receive optimal antenatal care during preg-nancy.Knowingthatantenatalcareservicesarecloselylinkedto bettermaternal and child health outcomes (WHO 2003),ZambiashouldaddressthesedecliningtrendsinANC4.
Immunizationratesremainedat leastmoderatelyhighatthenational level,butsomedistrictsshowedconcerningde-clinesforcertainvaccines,namelypolio,andfellbehindinthescale-upofthepentavalentvaccine.AnumberofdistrictsthatareconsideredatriskforpolioimportationfromtheDRCandAngola recorded recent declines in immunization coverage.Several districts showed minimal gains in coverage of the
pentavalentvaccine, fallingwellbelow thenationalaveragein2010.Prioritizingtheaccelerationofpentavalentcoverageindistricts laggingbehindthenationaltrendshouldbecon-sidered.
Zambia’snewmalariastrategicplanmapsoutanambitiousgoal towarda “malaria-freeZambia” (MOH2011), forwhichuniversal coverageof ITNsor IRS and increasing IPTp fromtwotothreedoses(IPTp2toIPTp3)arenewinterventiontar-getsfor2015.GiventhatfewerthanhalfofZambia’sdistrictsachievedatleastoneofthemalariainterventioncoveragetar-getsfor2010,thecountrymayneedtoconsiderstrategiestofurtherexpandandsustainhigher levelsofmalaria interven-tioncoverageinordertomeetits2015goals.
As demonstrated through the MCPA project in Zambia,nationaltrendscanmasksignificantdifferencesatthedistrictlevel.Thedistrictprofiles included in this reportprovidea data-drivenfoundationforbenchmarkingdistrictperformanceandtargetingareasfor improvement. It is importantforgov-ernments toprioritizemonitoringanddatagatheringat thedistrictleveltomakefutureanalysesmorerobustandtopro-videcriticalinputsfordecision-makingandpriority-settingbydistricthealthoffices.
TomaintainandfurtheracceleratethehealthgainsZambiahas made in child survival, continued efforts dedicated todeliveringa rangeofhealth interventions, includingmalariacontrol,areneeded.Theregularandtimelycollectionofdis-trict health datawill be crucial for guiding policy decisionsandresourceallocation.Thecountry’s investments innation-widesurveysservedasthecornerstonefortheanalysesinthisreport,and theyare likely to remainavital sourceofhealthdataalongsideZambia’shealthinformationsystems.Byusingitsdistrict-leveldataandfocusingonhealthgapsexperiencedby its districts, Zambia is in the position to further accel-erateprogress inchildhoodsurvivalandtopromotegreaterequalityinhealthattainmentthroughoutthecountry.
Conclusions and policy implications
1 3
ReferencesTheWorldBreastfeedingTrendsInitiative(WBTi).Zambia Country Assessment Report 2008.NationalFoodand NutritionCommission/IBFANAfrica,2008.Availableat:http://www.worldbreastfeedingtrends.org/report/WBTi-Zambian-2008.pdf[AccessedFebruary2014].
WorldHealthOrganization(WHO).Antenatal Care in Developing Countries: Promises, Achievements, and Missed Opportunities: an Analysis of Trends, Levels, and Differentials, 1990-2001.Geneva,Switzerland:WHO,2003.
WorldHealthOrganization(WHO).Annual Report of the WHO Country Office Zambia, 2011.Lusaka,Zambia:WHO,2011.
ZambiaMinistryofHealth(MOH).National Malaria Strategic Plan 2006–2011: A Road Map for RBM Impact in Zambia. Lusaka,Zambia:MOH,2006.
ZambiaMinistryofHealth(MOH).National Malaria Strategic Plan 2011–2015: Consolidating Malaria Gains for Impact. Lusaka,Zambia:MOH,2011.
1 4
Inordertocomprehensivelyassesstheimpactofmalariacon-trolonunder-5mortalityinadata-driven,systematicway,theMCPAresearchteam’smethodologicalframeworktookplaceinthreemainsteps:
(1) Collating data and generating source-specific esti-mates. TheMCPA research teambrought togetherabroadrange of data sources, including surveys, population cen-suses,andadministrativesources,togeneratesource-specificestimatesforall indicatorsof interest. Intotal,20householdsurveys,onehealthfacilitycensus,threepopulationcensuses,and two administrative sources (National Malaria ControlCentreindoorresidualsprayingdatabaseandfacilityPMTCTservicesfromtheNationalAIDSCouncil)wereincludedinthefinalanalysis.
(2) Estimating trends for 72 districts from 1990 to 2010. GiventherangeofdatatypesassembledfortheMCPAproject,statisticalmodelingapproacheshad tobeused inorder tosynthesizetheestimatesfromthesedifferentdatasourcesintoaunifiedtrend.Demographicmethodsforanalyzingbirthhis-torydatawerecombinedwithsmallareaestimationmodelingtogeneratedistrict-leveltrendsforall-causeunder-5mortality.Atwo-stepmethodinvolvingspatio-temporalsmoothingandGaussianProcessRegression(GPR)wasusedtoproducedis-trict-level trends for intervention coverage and non-healthindicators.
(3) Conducting causal attribution analyses. Many models and combinations of covariates were rigorously tested inorder to identify the most robust and valid model for as-sessing the relationship between declines in mortality andindividual health interventions and non-health indicators.Thetypesofmodelsthatwereexploredincludedsingle-andmultistage linearmodels, lasso, functionaldataanalysis,firstdifferences, differences-in-differences, structural equationsmodeling,andfactoranalysis.Themodelthatwasultimatelyselectedisalinearmodelwithbootstrapping,asitbetterac-countsforautocorrelationoveryearsanddistricts.Thelistofcovariatesthatwereexploredincludedrainfalllevels,fertility,birthspacing,maternaleducation,schoolattendanceamongteenagers,femaleheadshipofhouseholds,meanhouseholdsize, household sanitation, prevalence of improved sourcesofcookingfuel,prevalenceof improvedwall type inhomes,electricity, immunization coverage, and coverageofmalariaandmaternalandchildhealthinterventionsdescribedinthe
main text of this report. Covariates that were not includedbecauseof lackofdata availability include coverageofma-lariatreatmentforchildrenwithfever,coverageofantibiotictreatment for childrenwithpneumonia, coverageof oral re-hydration treatment for children with diarrhea, coverage ofpediatricHIV treatment,qualityofdistrict healthofficeman-agement, district health expenditures and health personnel,accesstohealthfacilities,malariatransmission intensityovertimeandbydistrict,andnutritionalinterventions.
The MCPA research team found that it was statisticallyimpossible to tease out the impact of malaria control in-terventions from other interventions that also experiencedlargegains incoverageduring the2000s. Instead,principalcomponentanalysis(PCA)wasusedtobundletheserapidlyscaled-up interventions—malaria control, exclusive breast-feeding,facilitiesofferingPMTCTperpopulationunder1yearold, and coverage of the pentavalent vaccine—into a com-positeindicator.Thefinalmodelestimatesthejointeffectoftheseinterventionsonunder-5mortality:
ln(₅q₀)іј = β0 + β1Scaledіј + β2SESіј + β3Undіј
+ β4SESіј * Scaledіј + β5SESіј * Undіј + β6ANC1іј
+ β7DPT3іј + β8Measіј + β9Yearі + μk[ ј] + εіј
The final model was a linear model with bootstrapping,whereforeachdistrict ј,provincek,andyear i, ln(₅q₀) isthenatural logarithm of the under-5mortality rate, β0 is the in-tercept, Scaled is the composite indicator for rapidly scaledup interventions,andSES is thecompositemeasure fornon-health factors. Und is the proportion of children who areunderweight,SES * Scaled isan interactionbetween thenon-healthfactorcompositemeasureandthecompositeindicatorforrapidlyscaledupinterventions,SES * Undisaninteractionbetween the non-health factor compositemeasure and theproportion of children who are underweight, ANC1 is cov-erageofoneantenatal care visit,DPT3 is coverageof threedosesofDPT,Meas iscoverageofonedoseof themeaslesvaccine,Yearisthecorrespondingyear,μk[ j]isarandomeffectonprovincektowhichj belongs,andεіј istheerrorterm.
Annex 1. Overview of the MCPA analytical approach and methods
1 5
District profiles Trackingtrendsinchildhealthoutcomesandinterventioncoverageatthedistrictlevelprovidestimely,useful,andactionableinformationtonationalandlocalpolicymakersinZambia.
Thedistrictprofilesareorderedalphabeticallywithineachprovince.Eachprofileprovidesa“childhealthbarometer”for2010,whichcomparesagivendistrict’sperformanceonkeychildhealthoutcomesandinterventionstothenationalaverageandtherangeobservedacrossdistricts.Further,eachprofiledetailstrendsobservedforeachgroupofinterventions:malariainterventions,immunizations,andothermaternalandchildhealthinterventions.
Thesedistrictprofilesaimtoprovideafoundationfromwhich localhealthofficialscanassesstheirdistricts’childhealthstatusandthentargethigh-priorityareasforimprovement.IndividualprofilescanbedownloadedfromIHME’sGlobalHealthDataExchange:http://ghdx.healthmetricsandevaluation.org/.