Embed Size (px)
Citation preview

Assessing Facility Capacity, Costs of Care, and Patient Perspectives
HEALTH SERVICE PROVISION IN ANDHRA PRADESH AND TELANGANA
CCESS,OTTLENECKS,OSTS, ANDQUITY
A B CE
PUBLIC HEALTH FOUNDATIONOF INDIA
INSTITUTE FOR HEALTH METRICS AND EVALUATIONUNIVERSITY OF WASHINGTON
CCESS,OTTLENECKS,OSTS, ANDQUITY
A B CE
5 Acronyms6 Termsanddefinitions8 Executivesummary11 Introduction13 ABCEprojectdesign18 MainfindingsHealth facility profiles Facility capacity and characteristics Patient perspectives Efficiency and costs48 Conclusionsandpolicyimplications54 Annex
HEALTH SERVICE PROVISION IN ANDHRA PRADESH AND TELANGANA
Table of Contents
Assessing Facility Capacity, Costs of Care, and Patient Perspectives
PUBLIC HEALTH FOUNDATIONOF INDIA
INSTITUTE FOR HEALTH METRICS AND EVALUATIONUNIVERSITY OF WASHINGTON

32
About IHME
About Public Health Foundation of India Collaborations
About this report
The Public Health Foundation of India (PHFI) is a public-private initiative to build institutional capacity in India for strengthening training, research, and policy development for public health in India. PHFI adopts a broad, integrative approach to public health, tailoring its endeavors to Indian conditions and bearing relevance to countries facing similar challenges and concerns. PHFI engages with various dimensions of public health that encompass promotive, preventive, and therapeutic services, many of which are often lost sight of in policy planning as well as in popular understanding.
The Institute for Health Metrics and Evaluation (IHME) is an independent global health research centre at the University of Washington that provides rigorous and comparable measurement of the world’s most important health problems and evaluates the strategies used to address them. IHME makes this information freely available so that policymakers have the evidence they need to make informed decisions about how to allocate resources to best improve population health.
This project has immensely benefitted from the key inputs and support from Dr. M. Jayaram, Dr. Rajan Shukla, and Dr. G.V.S. Murthy from the Indian Institute of Public Health, Hyderabad. Approvals and valuable support for this project were received from Andhra Pradesh and Telangana state government and district officials, which are gratefully acknowledged.
Assessing Facility Capacity, Costs of Care, and Patient Perspectives: Andhra Pradesh and Telangana provides a compre-hensive assessment of health facility performance in Andhra Pradesh and Telangana, including facility capacity for service delivery, efficiency of service delivery, and patient perspectives on the service they received. Findings presented in this report were produced through the ABCE project in Andhra Pradesh and Telangana, which aims to collate and generate the evidence base for improving the cost-effectiveness and equity of health systems. The ABCE project is funded through the Disease Control Priorities Network (DCPN), which is a multiyear grant from the Bill & Melinda Gates Foundation to comprehensively estimate the costs and cost-effectiveness of a range of health interventions and delivery platforms.
54
ABCE Access, Bottlenecks, Costs, and EquityAH Area hospitalANC Antenatal careANM Auxiliary nurse midwifeAPT Andhra Pradesh and TelanganaCHC Community health centreCI Confidence intervalDCPN Disease Control Priorities NetworkDEA Data envelopment analysisDOTS Directly observed therapy, short-courseDH District hospitalIHME Institute for Health Metrics and EvaluationIPHS Indian Public Health StandardsNCD Non-communicable diseaseOR Odds ratioPHC Primary health centrePHFI Public Health Foundation of IndiaSFA Stochastic frontier analysisSHC Sub health centreSTI Sexually transmitted infectionWHO World Health Organization
Acronyms Acknowledgments
We especially thank all of the health facilities and their staff in Andhra Pradesh and Telangana, who generously gave of their time and facilitated the sharing of facility data that made this study possible. We are also most appreciative of patients of the facilities who participated in this work, as they too were giving of their time and were willing to share their experiences with the field research team.
At PHFI, we wish to thank Rakhi Dandona and Lalit Dandona, who served as the principal investigators for the ABCE project in India. We also wish to thank Anil Kumar for guidance with data collection, management, and analysis. The quan-tity and quality of the data collected for the ABCE project in India is a direct reflection of the dedication of the field team. We thank the India field coordination team, which included Md. Akbar, G. Mushtaq Ahmed, and S.P. Ramgopal. We also recognize and thank Venkata Srinivas, Amit Kumar, Simi Chacko, Ranjana Kesarwani, Prem Kumar, Sagri Negi, and Sheetal Bishnoi for data management and coordination with field teams.
At IHME, we wish to thank Christopher Murray and Emmanuela Gakidou, who served as the principal investigators. We also recognize and thank staff at IHME: Roy Burstein, Alan Chen, Emily Dansereau, Katya Shackelford, Alexander Woldeab, Alexandra Wollum, and Nick Zyznieuski for managing survey programming, survey updates, data transfer, and ongoing verification at IHME during fieldwork. We are grateful to others who contributed to the project: Michael Hanlon, Santosh Kumar, Herbie Duber, Kelsey Bannon, Aubrey Levine, and Nancy Fullman. Finally, we thank those at IHME who supported publication management, editing, writing, and design.
This report was drafted by Marielle Gagnier, Lauren Hashiguchi, and Nikhila Kalra of IHME and Rakhi Dandona from PHFI.
Funding for this research comes from the Bill & Melinda Gates Foundation under the Disease Control Priorities Network (DCPN).
6
Table 1 defines the types of health facilities in Andhra Pradesh and Telangana; this report will refer to facilities according to these definitions.
Table1 Health facility types in Andhra Pradesh and Telangana1
1 Directorate General of Health Services, Ministry of Health & Family Welfare, and Government of India. Indian Public Health Standards (IPHS) Guidelines. New Delhi, India: Government of India, 2012.
7
T E R M S A N D D E F I N I T I O N S
DistrictHospital(DH)These facilities are the secondary referral level for a given district. Their objective is to provide comprehensive secondary health care services to the district’s population. DHs are sized according to the size of the district pop-ulation, so the number of beds varies from 75 to 500.
AreaHospital(AH)These facilities are sub-district/sub-divisional hospitals below the district and above the block-level hospitals (CHC). As First Referral Units, they provide emergency obstetrics care and neonatal care. These facilities serve populations of 500,000 to 600,000 people and have a bed count varying between 31 and 100 beds.
CommunityHealthCentre(CHC)These facilities constitute the secondary level of health care and were designed to provide referral as well as specialist health care to the rural population. They act as the block-level health administrative unit and as the gate-keeper for referrals to higher level facilities. Bed strength ranges up to 30 beds.
PrimaryHealthCentre(PHC)These facilities provide rural health services. PHCs serve as referral units for primary health care from Sub-Centres and refer cases to CHC and higher-order public hospitals. Depending on the needs of the region, PHCs may be upgraded to provide 24-hour emergency hospital care for a number of conditions. A typical PHC covers a popu-lation of 20,000 to 30,000 people and hosts about six beds.
SubHealthCentre(SHC)Along with PHCs, these facilities provide rural health care. SHCs typically provide outpatient care, which includes immunizations, and refer inpatient and deliveries to higher-level facilities.
Health facility types in Andhra Pradesh and Telangana
Terms and definitions
Definitions presented for key technical terms used in the report.
Constrainta factor that facilitates or hinders the provision of or access to health services. Constraints exist as both “supply-side,” or the capacity of a health facility to provide services, and “demand-side,” or patient-based factors that affect health-seeking behaviors (e.g., distance to the nearest health facility, perceived quality of care received by providers).
DataEnvelopmentAnalysis(DEA)an econometric analytic approach used to estimate the efficiency levels of health facilities.
Efficiencya measure that reflects the degree to which health facilities are maximizing the use of the resources available in producing services.
Facilitysamplingframethe list of health facilities from which the ABCE sample was drawn. This list was based on a 2011–2013 facility inventory published by the Andhra Pradesh and Telangana state government.
Inpatientvisita visit in which a patient has been admitted to a facility. An inpatient visit generally involves at least one night spent at the facility, but the metric of a visit does not reflect the duration of stay.
Inputstangible items that are needed to provide health services, including facility infrastructure and utilities, medical supplies and equipment, and personnel.
Outpatientvisita visit at which a patient receives care at a facility without being admitted.
Outputsvolumes of services provided, patients seen, and procedures conducted, including outpatient and inpatient care, laboratory and diagnostic tests, and medications.
Platforma channel or mechanism by which health services are delivered.
StochasticFrontierAnalysis(SFA)an econometric analytic approach used to estimate the efficiency levels of health facilities.

8
A B C E I N A N D H R A P R A D E S H A N D T E L A N G A N A
9
E X E C U T I V E S U M M A R Y
W
8
Executive summary
ith the aim of establishing universal health coverage, India’s national and state gov-ernments have invested significantly in expanding and strengthening the public
health care sector. This has included a particular com-mitment to extending its reach to rural populations and reducing disparities in access to care for marginalized groups. However, in order to realize this goal it is neces-sary for the country to critically consider the full range of factors that contribute to or hinder progress toward it.
Since its inception in 2011, the Access, Bottlenecks, Costs, and Equity (ABCE) project has sought to compre-hensively identify what and how components of health service provision – access to services, bottlenecks in delivery, costs of care, and equity in care received – affect health system performance in several countries. Through the ABCE project, multiple sources of data, including facility surveys and patient exit interviews, are linked together to provide a nuanced picture of how facility-based factors (supply-side) and patient perspec-tives (demand-side) influence optimal service delivery.
Led by the Public Health Foundation of India (PHFI) and the Institute for Health Metrics and Evaluation (IHME), the ABCE project in Andhra Pradesh and Telangana is uniquely positioned to inform the evidence base for un-derstanding the country’s drivers of health care access and costs of care. Derived from a state-representative sample of 98 facilities, the findings presented in this re-port provide governments, international agencies, and development partners alike with actionable information that can help identify areas of success and targets for im-proving health service provision.
The main topical areas covered in this report move from an assessment of facility-reported capacity for care, to quantifying the services actually provided by facilities and the efficiency with which they operate; tracking facil-ity expenditures and the costs associated with different types of service provision; and comparing patient per-spectives of the care they received across different types of facility. Further, we provide an in-depth examination
and comparison of facility-level outputs, efficiency, capac-ity, and patient experiences. It is with this information that we strive to provide the most relevant and actionable in-formation for health system programming and resource allocation in Andhra Pradesh and Telangana.
Facilitycapacityforserviceprovision
Whilemostfacilitiesreportprovidingkeyhealthservices,significantgapsincapacitywereidentifiedbetweenreportedand functionalcapacityforcare.
• Health facilities generally reported a high availability of a subset of key services. Services such as antenatal care, routine deliveries, pediatrics, general medicine, and emergency care were nearly universally available across facilities.
• Few facilities reported available services for non-com-municable diseases (NCDs). Low numbers of district hospitals reported providing psychiatry (50%), cardiol-ogy (25%), or chemotherapy (13%.)
• Basic medical equipment such as scales, stethoscopes, and blood pressure apparatus were widely available at all health facility levels, but laboratory equipment such as glucometers, blood chemistry analyzers, and incu-bators were less readily available. For example, only 67% of district hospitals had test strips for glucometers, dropping to 31% at the community health centre level. This shows limited capacity for testing throughout the health system, with particular implications for diagnos-ing and treating NCDs.
• Gaps also emerged with regard to imaging equipment. CT scans were available in 78% of district hospitals but in no area hospital.
• A service capacity gap emerged for the majority of health facilities across several types of services. Many facilities reported providing a given service but lacked full capacity to properly deliver it, for instance lacking
functional equipment or medications. For example, while almost all primary and community health centres reported providing routine delivery care, none were fully equipped to do so. This discordance has sub-stantial programmatic and policy implications for the health system in Andhra Pradesh and Telangana, high-lighting continued challenges in ensuring facilities have all the supplies they need to provide a full range of services.
Physicalinfrastructureofhealthfacilities hasimproved,butgapsintransportand communicationremain.
• Functional electricity was available at all hospitals, community health centres, and primary health centres. Eighty-one percent of sub health centres had elec-tricity, showing substantial improvement over figures from past studies.
• Access to piped water was generally high at district hospitals (100%), area hospitals (90%), community health centres (88%), and primary health centres (78%), but was limited at sub health centres (38%). Similarly, there was nearly universal availability (97%–100%) of flush toilets at all health facility types except sub health centres (56%). These figures reflects investments into improving physical infrastructure at health facilities, though discrepancies remain between high- and low-level facilities.
• There was relatively high access to some form of com-munication at community health centres (75% had access to phones and 75% to computers) and primary health centres (50% to phone and 81% to comput-ers). Just 31% of community health centres had access to an emergency vehicle and primary health centres did not have emergency transportation. Given that these types of facilities often play key referral functions, these findings have serious implications for coordinat-ing the care and transportation of patients.
Nursescomposedthemajorityofstaffathos-pitals,whileathealthcentrespara-medicalstaffoutnumberedbothdoctorsandnurses.
• In general, hospitals reported that they staff more nurses than doctors, and tend to employ slightly more
doctors and nurses than para- or non-medical person-nel. On the other hand, most primary health centres reported fewer or the same number of nurses as doc-tors, and overwhelmingly employ more para- and non-medical staff than nurses or doctors.
• As expected, the staff numbers were concentrated at district hospitals with an average of nearly 150 person-nel. Area hospitals had the second-highest number of personnel, but this was less than half of that at dis-trict hospitals, while health centres averaged between two and 30 staff. While some of this variation is a re-sult of service provision and population size, this also demonstrates relative shortages in human resources for health.
Facilityproductionofhealthservices
Whileoutpatientvisitsremainedsteadyovertime,therewereincreasesininpatientvisits.
• Between 2007 and 2011, most facility types expe-rienced relatively unchanged levels of outpatient visits, with a slight increase in visits observed for dis-trict hospitals. Outpatient visits accounted for the large majority of patients seen per staff member per day across all facility types. Inpatient visits increased for all facility types between 2007 and 2011.
Facilitiesshowedcapacityforlargerpatientvolumesgivenobservedresources.
• In generating estimates of facility-based efficiency, or the alignment of facility resources with the number of patients seen or services produced, we found a wide range of efficiency levels within and across facility types. The average efficiency score of district hospitals ranged from 28% to 71%, with a platform average of 61%. Area hospitals were between 37% and 87% effi-cient. Community health centres were between 24% and 79% efficient; four facilities were less than 50% ef-ficient and three facilities were 75% or more efficient. The range of efficiency scores was widest for primary health centres, from 23% to 82%, with 11 facilities at less than 50% efficient.

11
I N T R O D U C T I O N
10
A B C E I N A N D H R A P R A D E S H A N D T E L A N G A N A
• If they operated at optimal efficiency, district hospitals could provide 116,316 additional outpatient visits with the same inputs (including physical capital and per-sonnel), while primary health centres could produce 27,144 additional outpatient visits.
• These efficiency scores indicate that there is consid-erable room for health facilities to expand service production given their existing resources. Future work on pinpointing specific factors that heighten or hinder facility efficiency, and how efficiency is related to the quality of service provision, should be considered.
Costsofcare
Trendsinaveragefacilityspendingbetween2007and2011variedbetweenfacility types,thoughallplatformsrecordedhigherspendingin2011than2007.
• Spending on personnel accounted for the vast major-ity of annual spending across facility types. Compared to other facility types, area hospitals and primary health centres put a slightly greater proportion of their total expenditure toward personnel, while commu-nity health centres put the greatest proportion toward medical supplies.
Patientperspectives
Travelandwaittimeswereshorterfor patientsvisitinglower-levelfacilitiesthanhigher-levelones.
• Nearly all patients receiving care at sub health centres, and over 80% of patients at primary health centres, re-ported traveling less than 30 minutes to receive care. In contrast, more than half of patients at district hospi-tals had travel times of over 30 minutes, reflecting the greater distances people travel to receive specialist treatment from facilities of this type.
• More than two-thirds of patients waited less than 30 minutes to receive care across all facilities. Nearly all patients seeking care at sub health centres received care in less than 30 minutes.
Patientsgavehigherratingsofhealthcareprovidersthanfacilitycharacteristics.
• In general, patients receiving care from doctors re-ported relatively higher levels of satisfaction than those treated by nurses. Satisfaction with staff inter-actions, both for doctors and nurses, were lowest at community health centres and highest at primary and sub health centres.
• Facility characteristics, such as cleanliness and privacy, received generally low ratings from patients. Clean-liness at hospitals received particularly low marks. As with staff interactions, patient satisfaction with facility characteristics was higher at primary and sub health centres.
• Most patients received all drugs that they were pre-scribed during their visits. Proportions of patients receiving all prescribed drugs ranged from 81% of pa-tients at district hospitals to 95% at sub health centres.
• Longer wait times were associated with lower sat-isfaction ratings from patients, while receiving all prescribed drugs was associated with higher levels of patient satisfaction.
With its multidimensional assessment of health ser-vice provision, findings from the ABCE project in Andhra Pradesh and Telangana provide an in-depth examination of health facility capacity, costs of care, and how patients view their interactions with the health system. Andhra Pradesh and Telangana’s health provision landscape was markedly heterogeneous, and will likely continue to evolve over time. This highlights the need for continuous and timely assessment of health service delivery, which is critical for identifying areas of successful implementation and quickly responding to service disparities or faltering performance. Expanded analyses would also allow for an even clearer picture of the trends and drivers of facil-ity capacity, efficiencies, and costs of care. With regularly collected and analyzed data, capturing information from health facilities, recipients of care, policymakers, and program managers can yield the evidence base to make informed decisions for achieving optimal health system performance and the equitable provision of cost-effective interventions throughout Andhra Pradesh and Telangana.
Introduction
The performance of a country’s health sys-tem ultimately shapes the health outcomes experienced by its population, influencing the ease or difficulty with which individuals
can seek care and facilities can address their needs. At a time when international aid is plateauing1 and the gov-ernment of India has prioritized expanding many health programs,2,3 identifying health system efficiencies and promoting the delivery of cost-effective interventions has become increasingly important.
Assessing health system performance is crucial to opti-mal policymaking and resource allocation; however, due to the multidimensionality of health system functions,4
comprehensive and detailed assessment seldom occurs. Rigorously measuring what factors are contributing to or hindering health system performance – access to services, bottlenecks in service delivery, costs of care, and equity in service provision throughout a country – provides crucial information for improving service delivery and popula-tion health outcomes.
The Access, Bottlenecks, Costs, and Equity (ABCE) project was launched globally in 2011 to address these gaps in information. In addition to India, the multi-pronged, multi-partner ABCE project has taken place in seven other countries (Bangladesh, Colombia, Ghana, Kenya, Lebanon, Uganda, and Zambia). In India, the ABCE project was undertaken in six states – Andhra Pradesh and Telangana, Gujarat, Madhya Pradesh, Odisha, and Tamil Nadu.
The ABCE project, with the goal of rigorously assess-ing the drivers of health service delivery across a range
1 Institute for Health Metrics and Evaluation (IHME). Financing Global Health 2015: Development assistance steady on the path to new Global Goals. Seattle, WA: IHME, 2016. 2 Planning Commission Government of India. Eleventh Five Year Plan (2007-12). New Delhi, India: Government of India, 2007. 3 Planning Commission Government of India. Twelfth Five Year Plan (2012-17). New Delhi, India: Government of India, 2012. 4 Murray CJL, Frenk J. A Framework for Assessing the Performance of Health Systems. Bulletin of the World Health Organization. 2000; 78 (6): 717-731.
of settings and health systems, strives to answer these critical questions facing policymakers and health stake-holders in each country or state for public-sector health care service delivery:
• What health services are provided, and where are they available?
• What are the bottlenecks in provision of these services?
• How much does it cost to produce health services?• How efficient is provision of these health services?
Findings from each country’s ABCE work will pro-vide actionable data to inform their own policymaking processes and needs. Further, ongoing cross-country analyses will likely yield more global insights into health service delivery and costs of health care. These eight countries have been purposively selected for the overar-ching ABCE project as they capture the diversity of health system structures, composition of providers (public and private), and disease burden profiles. The ABCE project contributes to the global evidence base on the costs of and capacity for health service provision, aiming to de-velop data-driven and flexible policy tools that can be adapted to the particular demands of governments, de-velopment partners, and international agencies.
The Public Health Foundation of India (PHFI) and the Institute for Health Metrics and Evaluation (IHME) com-pose the core team for the ABCE project in India, and they received vital support and inputs from the state Ministry of Health and Family Welfare for data collection, analysis, and interpretation. The core team harnessed information from distinct but linkable sources of data, drawing from a state-representative sample of health facilities to cre-ate a large and fine-grained database of facility attributes, expenditure, and capacity, patient characteristics, and outcomes. By capturing the interactions between facility characteristics and patient perceptions of care, we have been able to piece together what factors drive or hin-der optimal and equitable service provision in rigorous, data-driven ways.

1312
A B C E P R OJ E C T D E S I G N
We focus on the facility because health facilities are the main points through which most individuals interact with the health system or receive care. Understanding the ca-pacities and efficiencies within and across different types of public-sector health facilities unveils the differences in health system performance at the level most critical to patients – the facility level. We believe this information is immensely valuable to governments and development partners, particularly for decisions on budget alloca-tions. By having data on what factors are related to high facility performance and improved health outcomes, pol-icymakers and development partners can then support evidence-driven proposals and fund the replication of these strategies at facilities throughout India.
The ABCE project in India has sought to generate the evidence base for improving the cost-effectiveness and equity of health service provision. In this report, we ex-amine facility capacity across platforms, as well as the efficiencies and costs associated with service provision for each type of facility. Based on patient exit interviews, we
consider the factors that affect patient perceptions of and experiences with the state’s health system. By considering a range of factors that influence health service delivery, we have constructed a nuanced understanding of what helps and hinders the receipt of health services through facilities in the states of Andhra Pradesh and Telangana.
The results discussed in this report are far from ex-haustive; rather, they align with identified priorities for health service provision and aim to answer questions about the costs of health care delivery in the respective state in India. This report provides an in-depth examina-tion of health facility capacity across different platforms, specifically covering topics on human resource capacity, facility-based infrastructure and equipment, health ser-vice availability, patient volume, facility-based efficiencies, costs associated with service provision, and demand-side factors of health service delivery as captured by patient exit interviews.
Table 2 defines the cornerstone concepts of the ABCE project: Access, Bottlenecks, Costs, and Equity.
AccessHealth services cannot benefit populations if they cannot be accessed; thus, measuring which elements are driving improved access to – or hindering contact with – health facilities is critical. Travel time to facilities, user fees, and cultural preferences are examples of factors that can affect access to health systems.
BottlenecksMere access to health facilities and the services they provide is not sufficient for the delivery of care to populations. People who seek health services may experience supply-side limitations, such as medicine stock-outs, that prevent the receipt of proper care upon arriving at a facility.
CostsHealth service costs can translate into very different financial burdens for consumers and providers of such care. Thus, the ABCE project measures these costs at several levels, quantifying what facilities spend to provide services.
EquityVarious factors influence how populations interact with a health system. The nature of these interactions either facilitate or obstruct access to health services. In addition to knowing the cost of scaling up a given set of ser-vices, it is necessary to understand costs of scale-up for specific populations and across population-related factors (e.g., distance to health facilities). The ABCE project aims to pinpoint which factors affect the access to and use of health services and to quantify how these factors manifest.
Access, Bottlenecks, Costs, and Equity
Table2 Access, Bottlenecks, Costs, and Equity
F
ABCE project design
or the ABCE project in India, we conducted primary data collection through a two-pronged approach:
1. A comprehensive facility survey administered to a rep-resentative sample of health facilities in select states in India (the ABCE Facility Survey)
2. Interviews with patients as they exited the sampled facilities
Here, we provide an overview of the ABCE survey de-sign and primary data collection mechanisms. All ABCE survey instruments are available online at http://www.healthdata.org/dcpn/india.
ABCEFacilitySurveyThrough the ABCE Facility Survey, direct data collec-
tion was conducted from a state-representative sample of health service platforms and captured information on the following indicators for the five fiscal years (running from April to March of the following year) prior to the survey:
• Inputs: the availability of tangible items that are needed to provide health services, including in-frastructure and utilities, medical supplies and equipment, pharmaceuticals, personnel, and non-medical services.
• Finances: expenses incurred, including spending on infrastructure and administration, medical supplies and equipment, pharmaceuticals including vaccines, and personnel. Facility funding from different sources (e.g., central and state governments) and revenue from service provision were also captured.
• Outputs: volume of services and procedures pro-duced, including outpatient and inpatient care, emergency care, and laboratory and diagnostic tests.
• Supply-sideconstraintsandbottlenecks: factors that affected the ease or difficulty with which patients received services they sought, including bed avail-ability, pharmaceutical availability and stockouts, cold-chain capacity, personnel availability, and service availability.
Table 3 provides more information on the specific indi-cators included in the ABCE Facility Survey.
A B C E I N A N D H R A P R A D E S H A N D T E L A N G A N A
1514
Table3 Modules included in the ABCE Facility Survey in India
SURVEY MODULE SURVEY CATEGORY KEY INDICATORS AND VARIABLES
Module1:Facilityfinances andinputs
Inputs Input funding sources, managing authority, and maintenance information
Availability and functionality of medical and non-medical equipment
Finances Salary/wages, benefits, and allowances
Total expenses for infrastructure and utilities; medical supplies and equipment; pharmaceuticals; administration and training; non-medical services, personnel (salaries and wages, benefits, allowances)
Performance and performance-based financing questions
Revenue User fees; total revenue and source
Personnel characteristics Total personnel by cadre
Funding sources of personnel
Health services provided and their staffing; administrative and support services and their staffing
Module2:Facilitymanagement anddirectobservation
Facility management and infrastructure characteristics
Characteristics of patient rooms; electricity, water, and sanitation
Facility meeting characteristics
Guideline observation
Direct observation Latitude, longitude, and elevation of facility. Facility hours, characteristics, and location; waiting and examination room characteristics
Module3:Lab-based consumables, equipment,andcapacity
Facility capacity Lab-based tests available
Medical consumables and equipment
Lab-based medical consumables and supplies available
Module4:Pharmaceuticals
Facility capacity Drug availability and stockout information
Module5:Generalmedicalconsumables,equipment,andcapacity
Medical consumables and equipment
Availability and functionality of medical furniture, equipment, and supplies
Inventory of procedures for sterilization, sharp items, and infectious waste
Inventory of personnel
Module6:Facilityoutputs
Facility capacity Fund and vehicle availability for referral and emergency referral
General service provision Inpatient care and visits; outpatient care and visits; emergency visits; home or outreach visits
Laboratory and diagnostic tests
Module7:Vaccines
Facility procedures for vaccine supply, delivery, and disposal
Source from vaccine obtained
Personnel administering vaccine
Procedures to review adverse events
Disposal of vaccines
Vaccine availability, storage, and output
Stock availability and stockouts of vaccines and syringes
Types and functionality of storage equipment for vaccines
Temperature chart history; vaccine inventory and vaccine outputs; vaccine outreach and home visits
Vaccine sessions planned and held
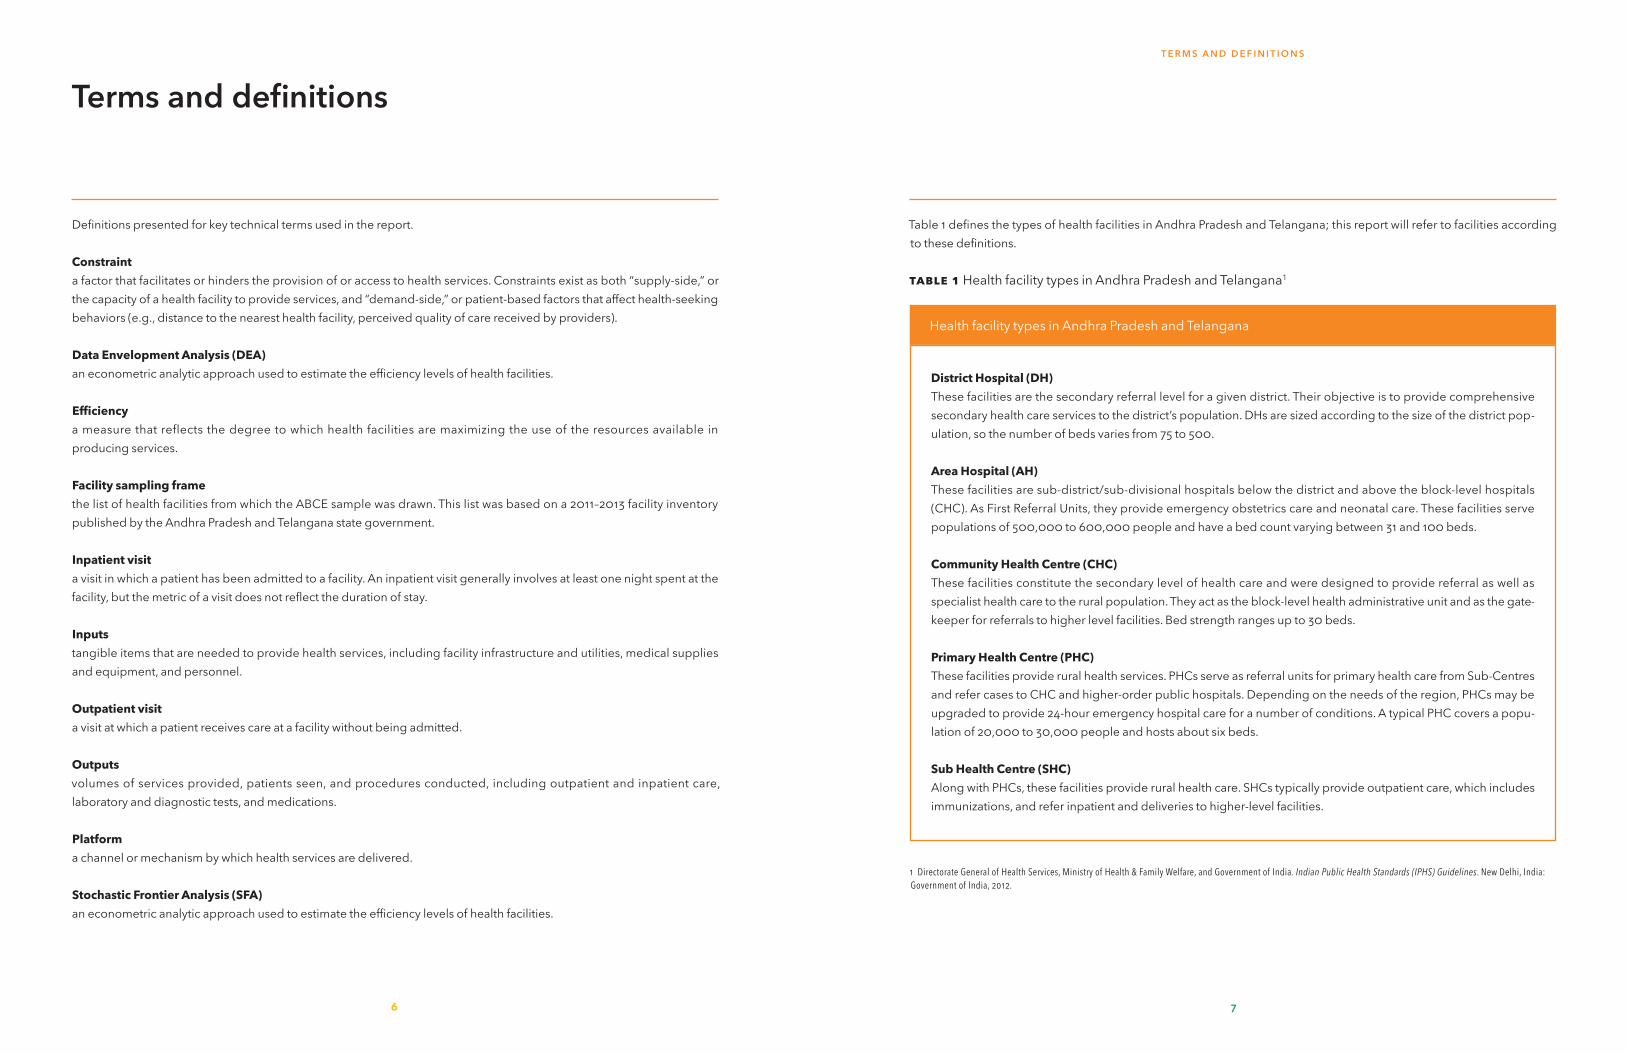
SampledesignA total of nine districts in Andhra Pradesh and Telan-
gana were selected for the ABCE survey (Figure 1). The districts were selected using three strata to maximize het-erogeneity: proportion of full immunization in children aged 12–23 months as an indicator of preventive health services; proportion of safe delivery (institutional delivery or home delivery assisted by skilled person) as an indi-cator of acute health services; and proportion of urban population as an indicator of overall development. The districts were grouped as high and low for urbanization based on median value, and into three equal groups as high, medium, and low for the safe delivery and full immu-nization indicators. Eight districts were selected randomly from each of the various combinations of indicators, and in addition the capital district was selected purposively.
Within each sampled district, we then sampled pub-lic sector health facilities at all levels of service based on the structure of the state health system (Figure 2). In each sampled district, one district hospital (DH); one area hos-pital (AH, from a total of two or three) for each sampled DH; two community health centres (CHC, from a total of two to five) for each sampled AH; two primary health centres (PHC, from a total of two to four) for each sam-pled CHC; and one sub centre (SHC, from a total or one to four) for each sampled PHC were randomly selected for the study.
Figure1Sampled districts in Andhra Pradesh and Telangana
Sampled districts are highlighted in green.
Figure2 Sampling strategy for health facilities in a district in the ABCE survey in India
Selected facilities are in blue; unselected facilities from the sampling frame are in grey.DH: District hospital; AH: Area hospital; CHC: Community health centre; PHC: Primary health centre; SHC: Sub health centre
A B C E P R OJ E C T D E S I G NA B C E I N A N D H R A P R A D E S H A N D T E L A N G A N A
1716
PatientexitinterviewsurveyA fixed number patients or attendants of patients were
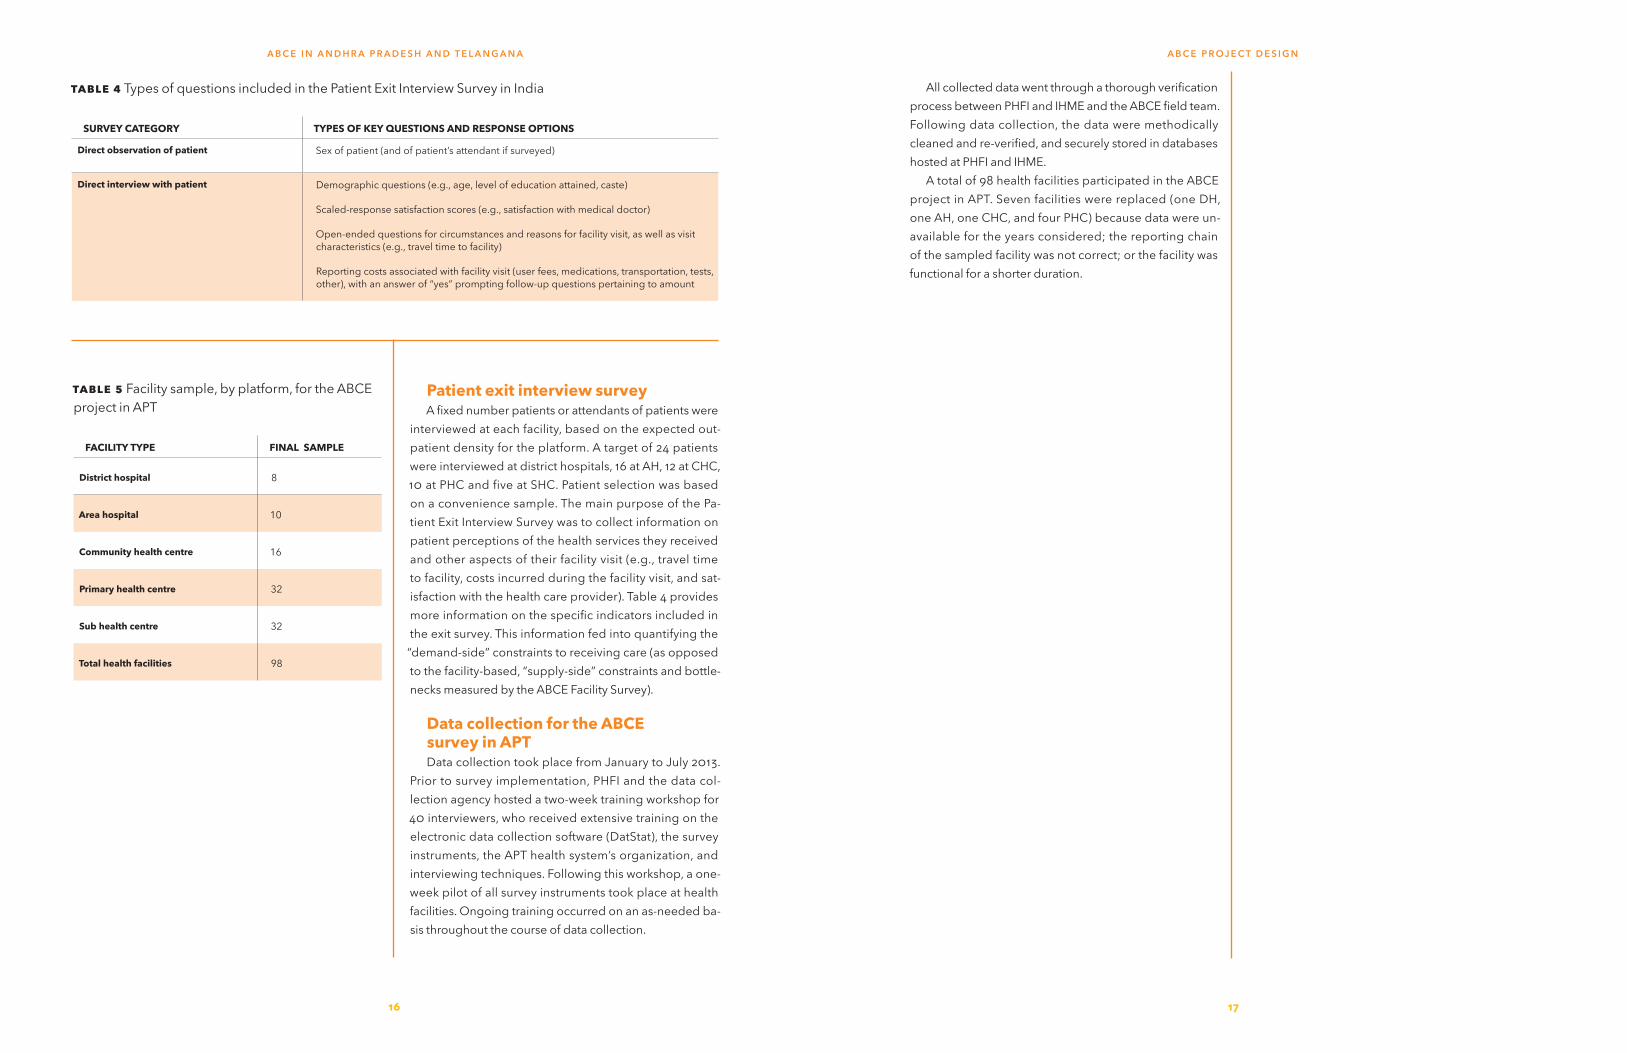
interviewed at each facility, based on the expected out-patient density for the platform. A target of 24 patients were interviewed at district hospitals, 16 at AH, 12 at CHC, 10 at PHC and five at SHC. Patient selection was based on a convenience sample. The main purpose of the Pa-tient Exit Interview Survey was to collect information on patient perceptions of the health services they received and other aspects of their facility visit (e.g., travel time to facility, costs incurred during the facility visit, and sat-isfaction with the health care provider). Table 4 provides more information on the specific indicators included in the exit survey. This information fed into quantifying the “demand-side” constraints to receiving care (as opposed to the facility-based, “supply-side” constraints and bottle-necks measured by the ABCE Facility Survey).
DatacollectionfortheABCE surveyinAPTData collection took place from January to July 2013.
Prior to survey implementation, PHFI and the data col-lection agency hosted a two-week training workshop for 40 interviewers, who received extensive training on the electronic data collection software (DatStat), the survey instruments, the APT health system’s organization, and interviewing techniques. Following this workshop, a one-week pilot of all survey instruments took place at health facilities. Ongoing training occurred on an as-needed ba-sis throughout the course of data collection.
Table4 Types of questions included in the Patient Exit Interview Survey in India
SURVEY CATEGORY TYPES OF KEY QUESTIONS AND RESPONSE OPTIONS
Directobservationofpatient Sex of patient (and of patient’s attendant if surveyed)
Directinterviewwithpatient Demographic questions (e.g., age, level of education attained, caste)
Scaled-response satisfaction scores (e.g., satisfaction with medical doctor)
Open-ended questions for circumstances and reasons for facility visit, as well as visit characteristics (e.g., travel time to facility)
Reporting costs associated with facility visit (user fees, medications, transportation, tests, other), with an answer of “yes” prompting follow-up questions pertaining to amount
Table5 Facility sample, by platform, for the ABCE project in APT
FACILITY TYPE FINAL SAMPLE
Districthospital 8
Areahospital 10
Communityhealthcentre 16
Primaryhealthcentre 32
Subhealthcentre 32
Totalhealthfacilities 98
A B C E I N A N D H R A P R A D E S H A N D T E L A N G A N A
All collected data went through a thorough verification process between PHFI and IHME and the ABCE field team. Following data collection, the data were methodically cleaned and re-verified, and securely stored in databases hosted at PHFI and IHME.
A total of 98 health facilities participated in the ABCE project in APT. Seven facilities were replaced (one DH, one AH, one CHC, and four PHC) because data were un-available for the years considered; the reporting chain of the sampled facility was not correct; or the facility was functional for a shorter duration.
A B C E P R OJ E C T D E S I G N

19
M A I N F I N D I N G S : H E A LT H FA C I L I T Y P R O F I L E S
18
Main findingsHealth facility profiles
The delivery of facility-based health ser-vices requires a complex combination of resources, ranging from personnel to phys-ical infrastructure, that vary in their relative
importance and cost to facilities. Determining what fac-tors support the provision of services at lower costs and higher levels of efficiency at health facilities is critical in-formation for policymakers to expand health system coverage and functions within constrained budgets.
Using the ABCE APT facility sample (Table 5), we analyzed five key drivers of health service provision at facilities:
• Facility-based resources (e.g., human resources, in-frastructure and equipment, and pharmaceuticals), which are often referred to as facility inputs.
• Patient volumes and services provided at facilities (e.g., outpatient visits, inpatient bed-days), which are also known as facility outputs.
• Patient-reported experiences, capturing “demand-side” factors of health service delivery.
• Facility alignment of resources and service production, which reflects efficiency.
• Facility expenditures and production costs for service delivery.
These components build upon each other to cre-ate a comprehensive understanding of health facilities in Andhra Pradesh and Telangana, highlighting areas of high performance and areas for improvement.
Facilitycapacityandcharacteristics
ServiceavailabilityAcross and within district hospitals, area hospitals, and
community health centres in APT (Table 6), several nota-ble findings emerged for facility-based health service provision. While fundamental services such as routine de-liveries, general medicine, pediatric care, and pharmacy
were nearly universally available, few facilities reported available services for non-communicable disease such as cardiology, psychiatry, and chemotherapy. District hos-pitals reported a wide range of services such as blood banks, surgical services, and emergency obstetrics. Area hospitals generally offered fewer services than district hospitals but reported high coverages of services like obstetrics services, antenatal care, and STI/HIV services.
HumanresourcesforhealthA facility’s staff size and composition directly affect
the types of services it provides. In general, a greater availability of health workers is related to higher service utilization and better health outcomes.1 India has a severe shortage of qualified health workers, and the workforce is concentrated in urban areas.2 The public health system has a shortage of both medical and paramedical per-sonnel. The number of primary and community health centres without adequate staff is substantially higher if high health-worker absenteeism is taken into consider-ation.3 The Indian Government is aware of the additional requirements and shortages in the availability of health workers for the future. The National Rural Health Mission, for instance, recommends a vastly strengthened infra-structure, with substantial increases in personnel at every tier of the public health system.4
Based on the ABCE sample, we found substantial het-erogeneity across facility types in APT by considering the total number of staff in the context of bed strength (i.e., number of beds in the facility) and patient load (Figure 3). Overall, the most common staff at district and area hospi-tals were nurses, while at lower levels, paramedical staff
1 Rao KD, Bhatnagar A, Berman P. So many, yet few: Human resources for health in India. Human Resources for Health. 2012; 10(19).2 Rao M, Rao KD, Kumar AK, Chatterjee M, Sundararaman T. Human resources for health in India. The Lancet. 2011; 377(9765): 587-98.3 Hammer J, Aiyar Y, Samji S. Understanding government failure in public health services. Economic and Political Weekly. 2007; 42: 4049–58.4 National Rural Health Mission. Ministry of Health and Family Welfare, Govern-ment of India. Mission Document (2005-2012). New Delhi, India: Government of India, 2005.
Table6 Availability of services in health facilities, by platform
DISTRICT HOSPITAL
AREA HOSPITAL
COMMUNITY HEALTH CENTRE
Surgical services 100% 100% 81%
Accident, trauma, and emergency 100% 100% 100%
Pediatric 100% 100% 100%
General anesthesiology 100% 100% 81%
Routine birth services 100% 100% 94%
Emergency obstetric services 100% 100% 88%
Antenatal care 100% 100% 100%
Immunization 100% 80% 50%
Internal/general medicine 100% 100% 100%
Cardiology 25% 50% 56%
Psychiatric 50% 40% 6%
Ophthalmology 100% 70% 50%
Dermatology 88% 40% 25%
Orthopedics 88% 70% 44%
Dentistry 100% 100% 75%
DOTS treatment 88% 90% 75%
STI/HIV 88% 90% 69%
Burns 75% 80% 69%
Chemotherapy 13% 20% NA
Alternative medicine 75% 40% 56%
Pharmacy 100% 100% 100%
Diagnostic medical 100% 100% 69%
Laboratory services 100% 100% 100%
Blood bank 88% 70% 6%
Mortuary 88% 70% 63%
Outreach services 25% 0% 0%
NA: Not applicable to this platform according to standards.
LOWEST AVAILABILITY HIGHEST AVAILABILITY
Note: All values represent the percentage of facilities, by platform, that reported offering a given service at least one day during a typical week.
outnumbered doctors and nurses. This is a reflection of the differential service offerings between higher- and lower-level facilities. Additionally, higher-level facilities tended to have a greater number of health personnel overall; while a degree of this variation is due to differ-ences in service provision and population size, some of this indicates relative shortages in human resources for health.
The volume of human resources across the platforms was on the expected lines with the greatest number of doctors, nurses, para-medical staff, and non-medical staff concentrated at the district hospitals, and the least at the sub-health centres. Area hospitals reported the second highest number of personnel; however, the to-tal personnel at these facilities was less than half of that reported by district hospitals. Community health centres maintained a smaller body of health workers, an aver-age total of 30, with most workers reported to be nurses and paramedical staff. Primary health centres reported, on average, 20 health workers in total, most of which were paramedical staff. Finally, sub-health centres re-ported two paramedical and non-medical personnel who perform immunizations, simple outpatient care, and community outreach.
NursestodoctorsratioThe ratio of number of nurses to number of doctors
is presented in Figure 4. A ratio greater than 1 indicates that nurses outnumber doctors; for instance, a ratio of 2 indicates that there are two nurses staffed for every one doctor. Alternatively, a ratio lower than 1 indicates that
0 50 100 150Number of Staff
Sub health centre
Primary health centre
Community health centre
Area hospital
District hospital
AP
Doctors Nurses
Para-medical staff Non-medical staff
Figure3 Composition of facility personnel, by platform

0 20 40 60 80
District Hospital Area Hospital
Community Health Centre Primary Health Centre
0 2 4 6
District Hospital Area Hospital
Community Health Centre Primary Health Centre
21
M A I N F I N D I N G S : H E A LT H FA C I L I T Y P R O F I L E S
20
doctors outnumber nurses; for instance, a ratio of 0.5 in-dicates there is one nurse staffed for every two doctors.
In general, district hospitals reported a high ratio, indi-cating that they staff more nurses than doctors. However, the ratio reported by various district hospitals ranged from 1.6 to 6. All area hospitals reported more nurses than doctors. There was heterogeneity among community health centres, with ratios ranging from 0.7 to 3.2. Finally, most primary health centres reported fewer or the same number of nurses staffed as doctors, though five facilities report ratios equal to or greater than 2.
Nursesanddoctorstoparamedical andnon-medicalstaffThe ratio of number of nurses and/or doctors to num-
ber of paramedical and/or non-medical staff in 2011 is presented in Figure 5. A ratio greater than 1 indicates that nurses and doctors outnumber paramedical and non-medical personnel; for instance, a ratio of 2 indicates that there are two nurses and/or doctors staffed for every one paramedical/non-medical staff. Alternatively, a ratio lower than 1 indicates that paramedical and/or non-medi-cal personnel outnumber nurses and/or doctors.
Most district and all area hospitals reported ratios greater than 1, with average ratios reported as 1.3 and 1.5, respectively. Community health centres reported an aver-age ratio of 1.0, with facilities reporting ratios that ranged
Figure4 Ratio of nurses to doctors by platform
Vertical bars represent the platform average ratio.
from 0.4 to 2.1. Notably, primary health centres over-whelmingly employ more paramedical and non-medical staff than doctors and nurses, with all facilities reporting a ratio less than 0.6.
BedstodoctorsratioThe ratio of number of beds to number of doctors in
2011 is presented in Figure 6. A ratio greater than 1 indi-cates that beds outnumber doctors; for instance, a ratio of 2 indicates that there are two beds for every one doc-tor staffed. Alternatively, a ratio lower than 1 indicates that doctors outnumber beds.
The average ratio of beds to doctors is highest in dis-trict hospitals (18.4), largely driven by one facility with few doctors staffed (ratio of 83.3). Area hospitals have an aver-age of 9.7 doctors per bed with a range from 4.8 to 23.3, while community health centres have an average of 7.1 with a range from 1.6 to 16.7. Primary health centres have an average ratio of beds to doctors of 3.2.
BedstonursesratioThe ratio of number of beds to number of nurses in
2011 is presented in Figure 7. A ratio greater than 1 indi-cates that beds outnumber nurses; for instance, a ratio of 2 indicates that there are two beds for every one nurse staffed. Alternatively, a ratio lower than 1 indicates that nurses outnumber beds.
Figure5 Ratio of nurses and doctors to para-medical and non-medical staff by platform
Vertical bars represent the platform average ratio.
Figure6 Ratio of beds to doctors by platform
Vertical bars represent the platform average ratio.
The average ratio of beds to nurses was similar for area hospitals (4.8) and community health centres (4.7), and only slightly higher than primary health centres (3.7) and distrcit hospitals (3.7). The ratio of beds to nurses was most heterogenous among community health cen-tres, ranging from 1.6 to 15.0. Conversely, the range of ratios for district hosptials was narrow (2.3 to 5.9).
In isolation, facility staffing numbers are less meaning-ful without considering a facility’s overall patient volume and production of specific services. For instance, if a fa-cility mostly offers services that do not require a doctor’s administration, failing to achieve the doctor staffing tar-get may be less important than having too few nurses. Further, some facilities may have much smaller patient volumes than others, and thus “achieving” staffing tar-gets could leave them with an excess of personnel given patient loads. While an overstaffed facility has a different set of challenges than an understaffed one, each reflects a poor alignment of facility resources and patient needs. To better understand bottlenecks in service delivery and areas to improve costs, it is important to assess a facili-ty’s capacity (inputs) in the context of its patient volume and services (outputs). We further explore these findings in the “Efficiency and costs” section. As part of the ABCE project in India, we compare levels of facility-based staffing with the production of different types of health services. In this report, we primarily focus on the deliv-
ery of health services by skilled medical personnel, which include doctors, nurses, and other paramedical staff. It is possible that non-medical staff also contribute to ser-vice provision, especially at lower levels of care, but the ABCE project in India is not currently positioned to ana-lyze these scenarios.
InfrastructureandequipmentHealth service provision depends on the availability of
adequate facility infrastructure, equipment, and supplies (physical capital). In this report, we focus on four essen-tial components of physical capital: power supply, water and sanitation, transportation, and medical equipment, with the latter composed of laboratory, imaging, and other medical equipment. Table 7 illustrates the range of physical capital, excluding medical equipment, available across platforms.
Power supplyAll hospitals, community health centres, and primary
health centres reported access to a functional electri-cal supply (Table 7). Among smaller facilities, 19% of sub-health centres lacked functional electricity. Across platforms, 57% of facilities with functional electricity also had a generator. No facilities reported solely relying on a generator for power.
Inadequate access to consistent electric power has
Figure7 Ratio of beds to nurses by platform
Vertical bars represent the platform average ratio.
0 20 40 60 80
District Hospital Area Hospital
Community Health Centre Primary Health Centre
A B C E I N A N D H R A P R A D E S H A N D T E L A N G A N A
District hospital
Community health centre
Area hospital
Primary health centre
District hospital
Community health centre
Area hospital
Primary health centre
District hospital
Community health centre
Area hospital
Primary health centre
District hospital
Community health centre
Area hospital
Primary health centre

2322
substantial implications for health service provision, par-ticularly for the effective storage of medications, vaccines, and blood samples. These results demonstrate an im-provement in the availability of electricity at the lowest platform level compared to 2005, when only 52.2% of sub-health centres had electric supply.5
WaterandsanitationDistrict hospitals had the highest availability of im-
proved water and sanitation sources, with 100% of these hospitals having functional piped water and sewer in-frastructure with flush toilets (Table 7). Generally, more facilities had sewer infrastructure than functional piped water. All area hospitals and community health centres along with 97% of primary health centres had sewer in-frastructure, while only 56% of sub-health centres had sewer infrastructure. Hand disinfectant was broadly available across platforms as a supplementary sanita-tion method. Access to piped water declined further down the health system, with most area hospitals (90%), community health centres (88%), and primary health cen-tres (78%) having piped water. The source of water for
5 Bajpai N, Dholakia RH, and Sachs JD. Scaling up Primary Health Services in Rural India: Public Investment Requirements and Health Sector Reform, Case Studies of Andhra Pradesh and Karnataka. New York: Centre on Globalization and Sustainable Development; 2008. Centre on Globalization and Sustainable Development Working Paper Series, No. 33.
sub-health centres was mostly piped water (38%) and boreholes (32%). Among all facilities, 45% reported a severe shortage of water at some point during the year. These findings show a mixture of notable gains and ongo-ing needs for facility-based water sources and sanitation practices among primary care facilities.
TransportationandcomputersFacility-based transportation and modes of commu-
nication varied across platforms (Table 7). In general, the availability of a vehicle, irrespective of its emergency capabilities, substantially decreased down the levels of health platforms. The primary health centres did not have emergency transportation, which means trans-ferring patients under emergency circumstances from these facilities could be fraught with delays and possible complications. The availability of a functional computer was seen in 89% of the district hospitals and 100% of the area hospitals.
EquipmentFor three main types of facility equipment – medical,
lab, and imaging – clear differences emerge across levels of health service provision, with Table 8 summarizing the availability of functional equipment by platform.
We used WHO’s Service Availability and Readiness As-sessment (SARA) survey as our guideline for what types of
Table8Availability of functional equipment, by platform
DISTRICT HOSPITAL
AREA HOSPITAL
COMMUNITY HEALTH CENTRE
PRIMARY HEALTH CENTRE
SUB-HEALTH CENTRE
Medicalequipment
Wheelchair 100% 100% 100% 91% NA
Adult scale 100% 90% 100% 97% 100%
Child scale 100% 100% 94% 78% 56%
Blood pressure apparatus 100% 90% 100% 100% 97%
Stethoscope 100% 100% 100% 100% 100%
Light source 100% 100% 100% 91% 63%
Labequipment
Glucometer 89% 60% 56% 47% NA
Test strips for glucometer 67% 30% 31% 38% NA
Hematologic counter 44% 50% 50% 34% NA
Blood chemistry analyzer 44% 10% 0% 3% NA
Incubator 78% 30% 13% 3% NA
Centrifuge 100% 100% 75% 53% NA
Microscope 100% 100% 94% 78% NA
Slides 100% 100% 100% 97% 75%
Slide covers 89% 90% 94% 81% 34%
Imagingequipment
X-ray 100% 100% 69% NA NA
ECG 89% 100% 25% NA NA
Ultrasound 100% 90% 21% NA NA
CT scan 78% 0% NA NA NA
NA: Not applicable to this platform according to standards.
LOWEST AVAILABILITY HIGHEST AVAILABILITY
Note: Availability of a particular piece of equipment was determined based on facility ownership on the day of visit. Data on the number of items present in a facility were not collected. All values represent the percentage of facilities, by platform, that had a given piece of equipment.
M A I N F I N D I N G S : H E A LT H FA C I L I T Y P R O F I L E SA B C E I N A N D H R A P R A D E S H A N D T E L A N G A N A
Table7 Availability of physical capital, by platform
DISTRICT HOSPITAL
AREA HOSPITAL
COMMUNITY HEALTH CENTRE
PRIMARY HEALTH CENTRE
SUB HEALTH CENTRE
Functionalelectricity 100% 100% 100% 100% 81%
Pipedwater 100% 90% 88% 78% 38%
Flushtoilet 100% 100% 100% 97% 56%
Handdisinfectant 78% 100% 94% 84% 75%
Anyfour-wheelvehicle 89% 90% 38% NA NA
Emergencyfour-wheelvehicle 78% 80% 31% NA NA
Landlinephone 13% 20% 75% 50% NA
Computer 89% 100% 75% 81% NA
NA: Not applicable to this platform according to standards.
Note: Values represent the percentage of facilities, by platform, that had a given type of physical capital
LOWEST AVAILABILITY HIGHEST AVAILABILITY
25
M A I N F I N D I N G S : H E A LT H FA C I L I T Y P R O F I L E S
24
equipment should be available in hospitals and primary care facilities.6 Table 8 illustrates the distribution of SARA scores across platforms. In general, hospitals had greater availability of medical equipment, and notable defi-cits in essential equipment availability were found in the lower levels of care. Lacking scales and blood pressure cuffs can severely limit the collection of important patient clinical data. Microscopes and corresponding compo-nents were most prevalent among all facilities, including primary health centres, but additional testing capacity was generally limited, even among district hospitals. For instance, 44% of district hospitals and 10% of area hos-pitals had a blood chemistry analyzer. While 60% of area hospitals had a functional glucometer, only 30% had test strips for the glucometer; this trend was evident across
6 World Health Organization (WHO). Service Availability and Readiness Assessment (SARA) Survey: Core Questionnaire. Geneva, Switzerland: WHO, 2013.
all platforms, indicating limited capacity for addressing non-communicable diseases (NCDs). District and area hospitals had good availability of imaging equipment, with the notable exception of CT scans, which were avail-able in 78% of district hospitals and no area hospitals. Community health centres had poor availability of essen-tial imaging equipment.
Overall, these findings demonstrate gradual improve-ments in equipping health facilities with basic medical equipment in APT, as well as the continued challenge of ensuring that these facilities carry the supplies they need to provide a full range of services. Measuring the avail-ability of individual pieces of equipment sheds light on specific deficits, but assessing a health facility’s full stock of necessary or recommended equipment provides a
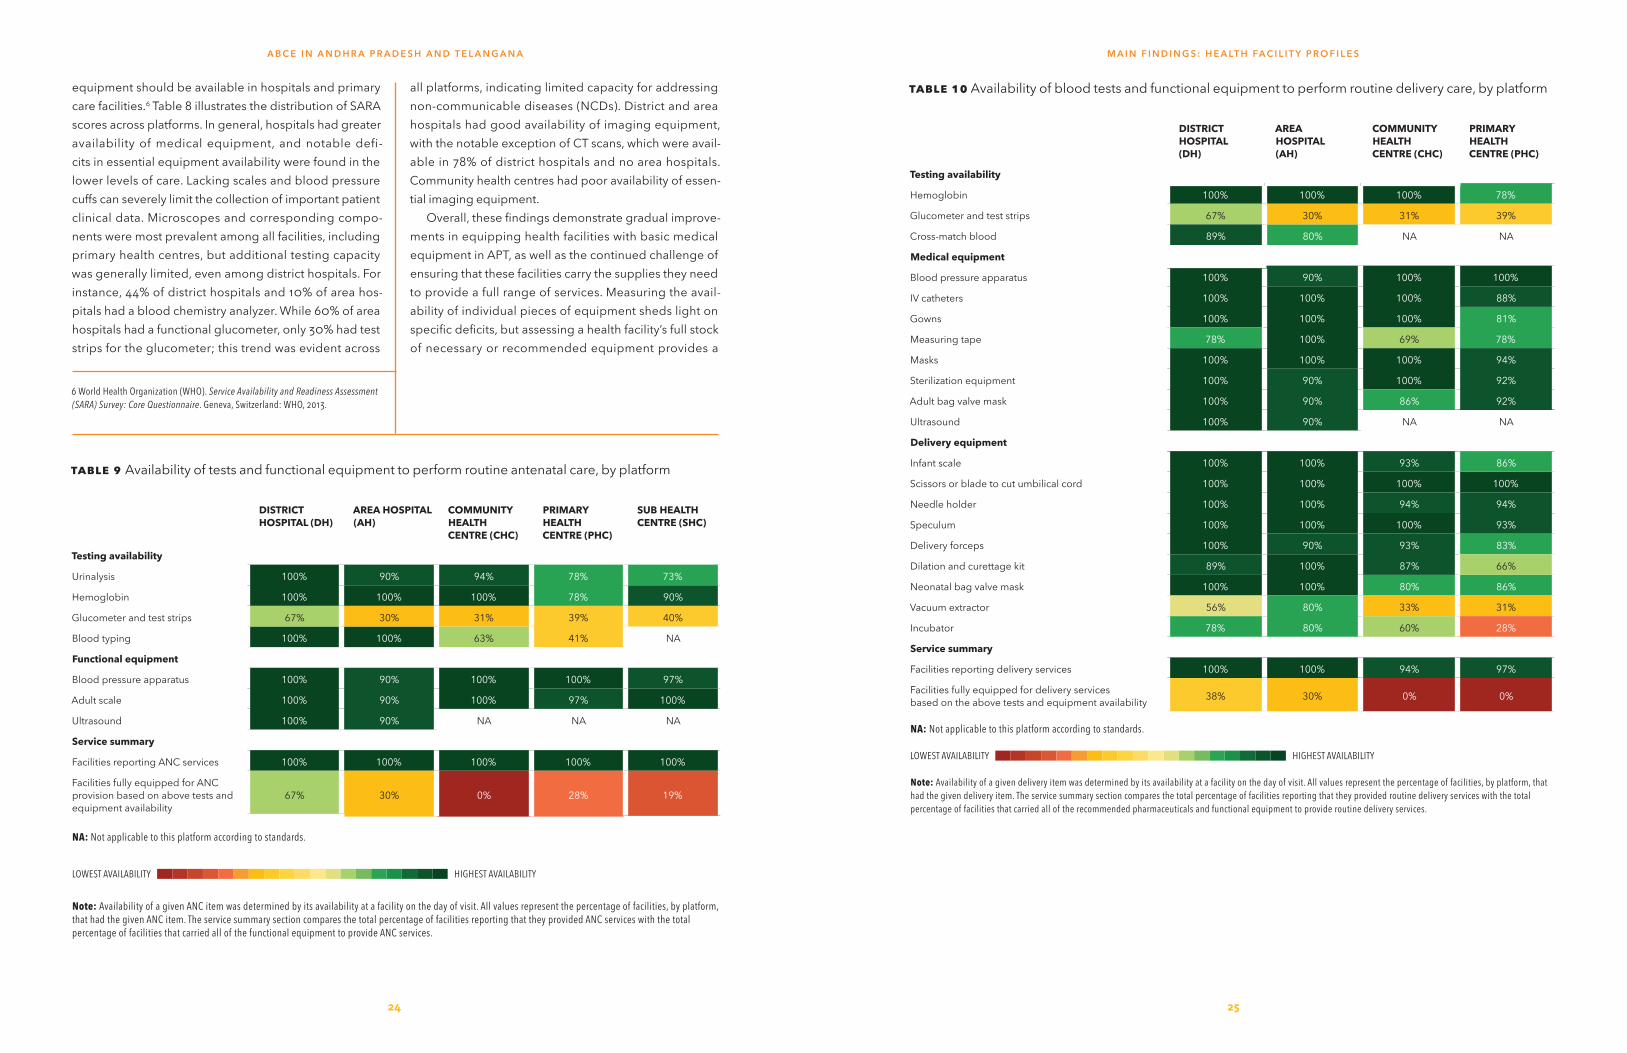
Table9Availability of tests and functional equipment to perform routine antenatal care, by platform
DISTRICT HOSPITAL(DH)
AREA HOSPITAL (AH)
COMMUNITY HEALTH CENTRE(CHC)
PRIMARY HEALTH CENTRE(PHC)
SUB HEALTH CENTRE(SHC)
Testingavailability
Urinalysis 100% 90% 94% 78% 73%
Hemoglobin 100% 100% 100% 78% 90%
Glucometer and test strips 67% 30% 31% 39% 40%
Blood typing 100% 100% 63% 41% NA
Functionalequipment
Blood pressure apparatus 100% 90% 100% 100% 97%
Adult scale 100% 90% 100% 97% 100%
Ultrasound 100% 90% NA NA NA
Servicesummary
Facilities reporting ANC services 100% 100% 100% 100% 100%
Facilities fully equipped for ANC provision based on above tests and equipment availability
67% 30% 0% 28% 19%
NA: Not applicable to this platform according to standards.
LOWEST AVAILABILITY HIGHEST AVAILABILITY
Note: Availability of a given ANC item was determined by its availability at a facility on the day of visit. All values represent the percentage of facilities, by platform, that had the given ANC item. The service summary section compares the total percentage of facilities reporting that they provided ANC services with the total percentage of facilities that carried all of the functional equipment to provide ANC services.
Table10 Availability of blood tests and functional equipment to perform routine delivery care, by platform
DISTRICT HOSPITAL (DH)
AREA HOSPITAL (AH)
COMMUNITY HEALTH CENTRE(CHC)
PRIMARY HEALTH CENTRE(PHC)
Testingavailability
Hemoglobin 100% 100% 100% 78%
Glucometer and test strips 67% 30% 31% 39%
Cross-match blood 89% 80% NA NA
Medicalequipment
Blood pressure apparatus 100% 90% 100% 100%
IV catheters 100% 100% 100% 88%
Gowns 100% 100% 100% 81%
Measuring tape 78% 100% 69% 78%
Masks 100% 100% 100% 94%
Sterilization equipment 100% 90% 100% 92%
Adult bag valve mask 100% 90% 86% 92%
Ultrasound 100% 90% NA NA
Deliveryequipment
Infant scale 100% 100% 93% 86%
Scissors or blade to cut umbilical cord 100% 100% 100% 100%
Needle holder 100% 100% 94% 94%
Speculum 100% 100% 100% 93%
Delivery forceps 100% 90% 93% 83%
Dilation and curettage kit 89% 100% 87% 66%
Neonatal bag valve mask 100% 100% 80% 86%
Vacuum extractor 56% 80% 33% 31%
Incubator 78% 80% 60% 28%
Servicesummary
Facilities reporting delivery services 100% 100% 94% 97%
Facilities fully equipped for delivery services based on the above tests and equipment availability 38% 30% 0% 0%
NA: Not applicable to this platform according to standards.
LOWEST AVAILABILITY HIGHEST AVAILABILITY
Note: Availability of a given delivery item was determined by its availability at a facility on the day of visit. All values represent the percentage of facilities, by platform, that had the given delivery item. The service summary section compares the total percentage of facilities reporting that they provided routine delivery services with the total percentage of facilities that carried all of the recommended pharmaceuticals and functional equipment to provide routine delivery services.
A B C E I N A N D H R A P R A D E S H A N D T E L A N G A N A

Table11Availability of blood tests and functional equipment to perform general surgery, by platform
DISTRICT HOSPITAL (DH)
AREA HOSPITAL (AH)
COMMUNITY HEALTH CENTRE (CHC)
PRIMARY HEALTH CENTRE (PHC)
Testingavailability
Hemoglobin 100% 100% 100% 78%
Cross-match blood 89% 80% NA NA
Medicalequipment
Blood pressure apparatus 100% 90% 100% 100%
IV catheters 100% 100% 100% 88%
Sterilization equipment 100% 90% 88% 72%
Gowns 100% 100% 100% 81%
Masks 100% 100% 100% 94%
Adult bag valve mask 100% 90% 75% 72%
Surgicalequipment
Surgical scissors/blade 100% 100% 94% 91%
Thermometer 100% 90% 88% 78%
General anesthesia equipment 100% 100% 56% 19%
Scalpel 89% 100% 69% 56%
Suction apparatus 100% 100% 81% 28%
Retractor 100% 100% 81% 69%
Nasogastric tube 89% 90% 69% 47%
Blood storage unit/refrigerator 89% 100% 50% NA
Intubation equipment 100% 80% 50% 28%
Servicesummary
Facilities reporting general surgery services 89% 100% 81% 50%
Facilities fully equipped for general surgery services based on the above tests and equipment availability 88% 60% 13% 6%
NA: Not applicable to this platform according to standards.
LOWEST AVAILABILITY HIGHEST AVAILABILITY
Note: Availability of a given surgery item was determined by its availability at a facility on the day of visit. All values represent the percentage of facilities, by platform, that had the given surgery item. The service summary section compares the total percentage of facilities reporting that they provided general surgery services with the total percentage of facilities that carried all of the recommended functional equipment to provide general surgery services.
Table12 Availability of laboratory tests, by platform
DISTRICT HOSPITAL (DH)
AREA HOSPITAL (AH)
COMMUNITY HEALTH CENTRE(CHC)
PRIMARY HEALTH CENTRE(PHC)
Blood typing 100% 100% 63% 41%
Cross-match blood 89% 80% NA NA
Complete blood count 89% 80% 50% 16%
Hemoglobin 100% 100% 100% 78%
HIV 100% 100% 94% 66%
Liver function 67% 30% 13% NA
Malaria 100% 90% 94% 84%
Renal function 56% 20% 13% 3%
Serum electrolytes 22% 0% 0% NA
Spinal fluid test 33% 0% 6% NA
Syphilis 100% 90% 50% NA
Tuberculosis skin 100% 100% 94% 44%
Urinalysis 100% 90% 94% 78%
NA: Not applicable to this platform according to standards.
LOWEST AVAILABILITY HIGHEST AVAILABILITY
Note: Availability of a given test was determined by its availability at a facility on the day of visit. All values represent the percentage of facilities, by platform, that had the given test.
more precise understanding of a facility’s service capacity.
FocusonserviceprovisionFor the production of any given health service, a
health facility requires a complex combination of the ba-sic infrastructure, equipment, and pharmaceuticals, with personnel who are adequately trained to administer nec-essary clinical assessments, tests, and medications. Thus, it is important to consider this intersection of facility re-sources to best understand facility capacity for care. In this report, we further examined facility capacity for a subset of specific services – antenatal care, delivery, gen-eral surgery, and laboratory testing. For these analyses of service provision, we only included facilities that re-ported providing the specific service, excluding facilities that were potentially supposed to provide a given service but did not report providing it in the ABCE Facility Sur-vey. Thus, our findings reflect more of a service capacity “ceiling” across platforms, as we are not reporting on the
facilities that likely should provide a given service but have indicated otherwise on the ABCE Facility Survey.
AntenatalcareservicesIn APT, according to the National Family Health Sur-
vey-4, 76% of women had at least four antenatal care (ANC) visits during their last pregnancy.7 While this level of coverage is noteworthy, it neither reflects what services were actually provided nor the quality of care received. Through the ABCE Facility Survey, we estimated what pro-portion of facilities stocked the range of tests and medical equipment to conduct a routine ANC visit. It is important to note that this list was not exhaustive but represented a number of relevant supplies necessary for the provision of ANC.
The availability of tests and functional equipment for
7 International Institute for Population Sciences (IIPS). National Family Health Survey (NFHS-4), 2015-2016: Andhra Pradesh Factsheet. Mumbai, India: IIPS, 2016.
M A I N F I N D I N G S : H E A LT H FA C I L I T Y P R O F I L E SA B C E I N A N D H R A P R A D E S H A N D T E L A N G A N A
2726

2928
Figure8 Number of outpatient visits, by platform
Note: Each line represents outpatient visits for an individual facility, with the bold line depicting the average for the platform. Scales are different for each platform.
010
0000
2000
0030
0000
4000
00V
isits
2007 2008 2009 2010 2011
OP visits by facility OP visits average
AH
050
000
1000
0015
0000
Vis
its
2007 2008 2009 2010 2011
OP visits by facility OP visits average
CHC0
2000
040
000
6000
080
000
Vis
its
2007 2008 2009 2010 2011
OP visits by facility OP visits average
PHC
020
0040
0060
0080
00V
isits
2007 2008 2009 2010 2011
OP visits by facility OP visits average
SHC
ANC is presented in Table 9. While all facilities in this survey reported providing ANC services, many were not adequately supplied for care. There was a lack of glucom-eter and test strips across all platforms. Primary health centres and sub-centres lacked many essential tests.
Across the levels of care, we found a widening gap be-tween facility-reported capacity for ANC provision and the fraction of the facilities fully equipped to deliver ANC care. This service-capacity gap meant that many facilities, from district hospitals to the lower levels of care, reported providing ANC but then lacked at least one piece of func-tional equipment needed to optimally address the range of patient needs during an ANC visit. Lack of simple tests or material for tests (such as glucometer and test strips or blood pressure apparatus) prevented most facilities from being listed as fully equipped to provide ANC services.
Figure9 Number of inpatient visits (excluding deliveries), by platform
Note: Each line represents inpatient visits for an individual facility, with the bold line depicting the average for the platform. Scales are different for each platform.
050
0010
000
1500
020
000
2500
0V
isits
2007 2008 2009 2010 2011
IP visits by facility IP visits average
AH
050
0010
000
1500
0V
isits
2007 2008 2009 2010 2011
IP visits by facility IP visits average
CHC
020
000
4000
060
000
Vis
its
2007 2008 2009 2010 2011
IP visits by facility IP visits average
DH
010
0020
0030
00V
isits
2007 2008 2009 2010 2011
IP visits by facility IP visits average
PHC
These findings do not suggest that these platforms are entirely unable to provide adequate ANC services; it sim-ply means that the vast majority of facilities did not have the recommended diagnostics and medical equipment for ANC.
DeliverycareservicesWhile 92% of deliveries in APT are in a health facility,
only 38% of deliveries are in public facilities.8 Availabil-ity of essential equipment is necessary for providing high-quality delivery care; these results are presented in Table 10. Availability was generally highest in district hospitals, declining at lower levels. While most commu-
8 International Institute for Population Sciences (IIPS). National Family Health Survey (NFHS-4), 2015-2016: Andhra Pradesh Factsheet. Mumbai, India: IIPS, 2016.
M A I N F I N D I N G S : H E A LT H FA C I L I T Y P R O F I L E SA B C E I N A N D H R A P R A D E S H A N D T E L A N G A N A
5000
010
0000
1500
0020
0000
2500
0030
0000
Vis
its
2007 2008 2009 2010 2011
Facilities Average
DH
050
000
1000
0015
0000
Vis
its
2007 2008 2009 2010 2011
OP visits by facility OP visits average
CHC

3130
Figure10 Number of deliveries, by platform
Note: Each line represents deliveries visits for an individual facility, with the bold line depicting the average for the platform. Scales are different for each platform.
nity health centres and primary health centres offered routine delivery services, none had all essential tests and equipment available. Only one-third of district and area hospitals were fully equipped. Notably, nearly half of dis-trict hospitals lacked vacuum extractors.
This finding is cause for concern, as not having access to adequate delivery equipment can affect both maternal and neonatal outcomes at all levels of care.9,10 Again, we found a substantial gap between the proportion of facil-
9 Nyamtema AS, Urassa DP, van Roosmalen J. Maternal health interventions in resource limited countries: a systematic review of packages, impacts and factors for change. BMC Pregnancy and Childbirth. 2011; 11(30).10 Wall SN, Lee ACC, Carlo W, Goldenberg R, Niermeyer S, Darmstadt GL, et al. Re-ducing intrapartum-related neonatal deaths in low- and middle-income countries
— what works? Seminars in Perinatology. 2010; 34: 395–407.
Figure11 Number of immunization doses administered, by platform
Note: Each line represents immunization doses for an individual facility, with the bold line depicting the average for the platform. Scales are different for each platform.
050
010
0015
0020
0025
00D
eliv
erie
s
2007 2008 2009 2010 2011
Deliveries by facility Deliveries average
AH
050
010
0015
0020
0025
00D
eliv
erie
s
2007 2008 2009 2010 2011
Deliveries by facility Deliveries average
CHC
1000
2000
3000
4000
5000
Del
iver
ies
2007 2008 2009 2010 2011
Deliveries by facility Deliveries average
DH
010
020
030
040
0D
eliv
erie
s
2007 2008 2009 2010 2011
Deliveries by facility Deliveries average
PHC
050
000
1000
0015
0000
2000
00D
oses
adm
inis
tere
d
2007 2008 2009 2010 2011
Immunization doses by facility Immunization doses average
AH
020
000
4000
060
000
8000
0D
oses
adm
inis
tere
d
2007 2008 2009 2010 2011
Immunization doses by facility Immunization doses average
CHC
050
0010
000
1500
020
000
Dos
es a
dmin
iste
red
2007 2008 2009 2010 2011
Immunization doses by facility Immunization doses average
DH
020
000
4000
060
000
Dos
es a
dmin
iste
red
2007 2008 2009 2010 2011
Immunization doses by facility Immunization doses average
PHC
010
0020
0030
0040
00D
oses
adm
inis
tere
d
2007 2008 2009 2010 2011
Immunization doses by facility Immunization doses average
SHC
ities, across platforms, that reported providing routine delivery services and those that were fully equipped for their provision.
GeneralsurgeryservicesAvailability of essential tests and equipment for gen-
eral surgery services is presented in Table 11. At least 80% of area and district hospitals had each of the es-sential items; availability was substantially lower in community health centres and primary health centres. Generally, medical equipment was mostly available across all platforms (at least 72%), while there are large gaps in availability for testing and surgical equipment. Few primary health centres reported equipment for gen-
M A I N F I N D I N G S : H E A LT H FA C I L I T Y P R O F I L E SA B C E I N A N D H R A P R A D E S H A N D T E L A N G A N A

3332
Table13 Characteristics of patients interviewed after receiving care at facilities
DH AH CHC PHC SHC TOTAL
Totalpatientsample 278 199 250 318 153 1198
Women 41% 49% 46% 48% 69% 49%
Patient’sagegroup(years)
<16 11% 15% 10% 10% 5% 10%
16–29 25% 22% 16% 15% 31% 21%
30–39 17% 15% 16% 14% 19% 16%
40–49 17% 15% 19% 16% 12% 16%
>50 30% 33% 38% 44% 32% 36%
Scheduledcaste/Scheduledtribe 21% 18% 23% 20% 20% 20%
Otherbackwardcaste 60% 66% 62% 63% 58% 62%
Educationattainment
None 37% 44% 54% 60% 50% 49%
Classes 1 to 5 20% 17% 17% 17% 12% 17%
Classes 6 to 9 14% 14% 12% 10% 16% 13%
Class 10 or higher 30% 26% 18% 13% 22% 21%
DH: District hospital; AH: Area hospital; CHC: Community health centre; PHC: Primary health centre; SHC: Sub health centre
Note: Educational attainment refers to the patient’s level of education or the attendant’s educational attainment if the interviewed patient was younger than 18 years old.
Figure12 Patient travel times to facilities, by platform
0 20 40 60 80 100Percent (%)
SHC
PHC
CHC
AH
DH
< 30 min. > 30 min.
eral anesthesia. It is also crucial to consider the human resources available to perform surgical procedures, as assembling an adequate surgical team is likely to affect patient outcomes. Given the nature of documentation of human resources in the records, such data could not be captured, but future work on assessing surgical capacity at health facilities should collect this information.
LaboratorytestingThe availability of laboratory tests is presented in Table
12. While all district hospitals, area hospitals, and commu-nity health centres offer laboratory services, there were gaps in test availability. Serum electrolyte tests, useful as part of a metabolic panel and to measure symptoms of heart disease and high blood pressure, were not present at any area hospitals or community health centres, and were available at only 22% of district hospitals. Renal func-tion, liver function, and spinal fluid tests were also rare among facilities below district hospitals. Most facilities were equipped to test for malaria, HIV, and tuberculosis, though availability of these test were lower at primary health centres.
FacilityoutputsMeasuring a facility’s patient volume and the number
of services delivered, which are known as outputs, is crit-ical to understanding how facility resources align with patient demand for care. Figure 8 illustrates the trends in average outpatient volume across platforms and over time. In general, most platforms experienced relatively unchanged levels of outpatient visits over five fiscal years, with slight increases for district hospitals. Patient volume was similar between district (average of 144,069–178,024 visits per year) and area hospitals (average of 142,930–163,587 visits per year). Two district hospitals reported a slight decrease in outpatient visits over the five years of observation. Primary health centres reported more than 10 times more outpatient visits (average of 23,195–26,026 visits per year) than sub-health centres (average of 1,459–1,708 visits per year).
Inpatient visits generally entail more service demands than outpatient visits, including ongoing occupancy of facility resources such as beds. The reported number of inpatient visits (other than deliveries) by year are pre-sented in Figure 9. Over time, the average number of
DH: District hospital; AH: Area hospital; CHC: Community health centre; PHC: Primary health centre; SHC: Sub health centre
Figure13 Patient wait times at facilities, by platform
0 20 40 60 80 100Percent (%)
SHC
PHC
CHC
AH
DH
< 30 min. > 30 min.
DH: District hospital; AH: Area hospital; CHC: Community health centre; PHC: Primary health centre; SHC: Sub health centre
Figure14 Patient scores of facilities, by platform
0 20 40 60 80 100Percent (%)
SHC
PHC
CHC
AH
DH
<6 6-78-9 10
DH: District hospital; AH: Area hospital; CHC: Community health centre; PHC: Primary health centre; SHC: Sub health centre
Note: Facility ratings were reported along a scale of 0 to 10, with 0 as the worst facility possible and 10 as the best facility possible.
inpatient visits has increased for all platforms. District hospitals provided care for an average of 17,871–26,945 inpatient visits per fiscal year, while area hospitals pro-vided care for about half as many patients (an average of 9,739–11,386 visits per year). Community health centres provided, on average, between 3,287 and 4,633 inpatient visits per year. Primary health centres reported substan-tially fewer inpatient visits (on average 431–623 visits per year), with seven facilities reporting at least 1,000 inpa-tient visits in any year. It is important to note that the ABCE Facility Survey did not capture information on the length of inpatient stays, which is a key indicator to monitor and include in future work.
The reported number of deliveries, by platform and over time, is presented in Figure 10. District hospitals re-ported an average between 1,671 and 2,343 deliveries in each year of observation, which his slightly higher than area hospitals (an average of 1,082–1,299 deliveries per year). While many hospitals experienced an increase in the number of deliveries over time, several hospitals re-ported decreasing numbers over time. Community health centres reported an annual average number of deliveries
M A I N F I N D I N G S : H E A LT H FA C I L I T Y P R O F I L E SA B C E I N A N D H R A P R A D E S H A N D T E L A N G A N A

3534
Table14Proportion of patients satisfied with facility visit indicators, by platform
DISTRICT HOSPITAL
AREA HOSPITAL
COMMUNITY HEALTH CENTRE
PRIMARY HEALTH CENTRE
SUB HEALTH CENTRE
Staffinteractions
Nurse/ANM
Medical provider respectfulness 57% 70% 51% 76% 95%
Clarity of provider explanations 66% 67% 63% 79% 93%
Time to ask questions 65% 67% 57% 78% 95%
Doctor
Medical provider respectfulness 68% 75% 65% 85% NA
Clarity of provider explanations 74% 76% 64% 91% NA
Time to ask questions 67% 70% 61% 87% NA
Facilitycharacteristics
Cleanliness 33% 31% 39% 48% 61%
Privacy 45% 35% 24% 40% 52%
NA: Results not applicable.
LOWEST AVAILABILITY HIGHEST AVAILABILITY
between 362 and 413. Very few deliveries were reported in primary health centres (an average of 62–71 deliveries per year). The ratio of deliveries to inpatient visits is higher among the lower platforms.
ImmunizationThe number of immunization doses administered over
time, by platform, is presented in Figure 11. Generally, the average number of doses administered remained stable over the five fiscal years. Unlike trends for outpatient vis-its, inpatient visits, and deliveries, the district hospitals reported far fewer immunization doses administered (annual averages between 9,104 and 10,105) than area hospitals (annual averages between 49,463 and 57,441) and community health centres (annual averages between 31,057 and 37,673). Facilities at the PHC and SHC level are central to immunization delivery; primary health centres reported an average of 7,829–10,366 doses per year while sub health centres reported an average of 753–866 doses per year.
PatientperspectivesA facility’s availability of and capacity to deliver ser-
vices is only half of the health care provision equation; the other half depends upon patients seeking those health services. Many factors can affect patients’ decisions to seek care, ranging from associated visit costs to how pa-tients view the care they receive. These “demand-side” constraints can be more quantifiable (e.g., distance from facility) or intangible (e.g., perceived respectfulness of the health care provider), but each can have the same im-pact on whether patients seek care at particular facilities or have contact with the health system at all.
Using data collected from the Patient Exit Interview Surveys, we examined the characteristics of patients who presented at health facilities and their perspectives on
Figure15Availability of prescribed drugs at facility, by platform
0 20 40 60 80 100Percent (%)
SHC
PHC
CHC
AH
DH
Got none/some of the drugs Got all prescribed drugs
DH: District hospital; AH: Area hospital; CHC: Community health centre; PHC: Primary health centre; SHC: Sub health centre
FemaleMale
>=40 years16-39 years
Other castesBackwards caste
Any schoolingNo schooling
Not given all prescribed drugsGiven all prescribed drugs
Wait time <30 minWait time >=30 min
PHCCHC
AHDH
0 1 2 3Odds Ratio
Figure16Determinants of satisfaction with doctors
Dotted vertical line represents an odds ratio of 1. Black points represent the reference groups, which all carry an odds ratio of 1. Compared to the referent category, significant odds ratios and 95% confidence intervals are represented with blue points and horizontal lines, respectively. Odds ratios that are not significant are represented by green points, and their 95% confidence intervals with a green horizontal line. Any confidence intervals with an upper bound above 3 were truncated for ease of interpretation.
DH: District hospital; AH: Area hospital; CHC: Community health centre; PHC: Primary health centre
the care they received. Table 13 provides an overview of the interviewed patients (n=1,198) or their attendants at public facilities. A little over half the patients were men, and with no education. One-fifth of patients were younger than 16 years of age. Across platforms, patient compo-sition was generally comparable. However, patients seeking care at district and area hospitals tended to be more educated than those seeking care at lower-level fa-cilities. The majority of patients at sub-health centres were women (69%).
TravelandwaittimesThe amount of time patients spend traveling to facili-
ties and then waiting for services can substantially affect their care-seeking behaviors. Among the patients who were interviewed, we found that travel time to a facility for
M A I N F I N D I N G S : H E A LT H FA C I L I T Y P R O F I L E SA B C E I N A N D H R A P R A D E S H A N D T E L A N G A N A
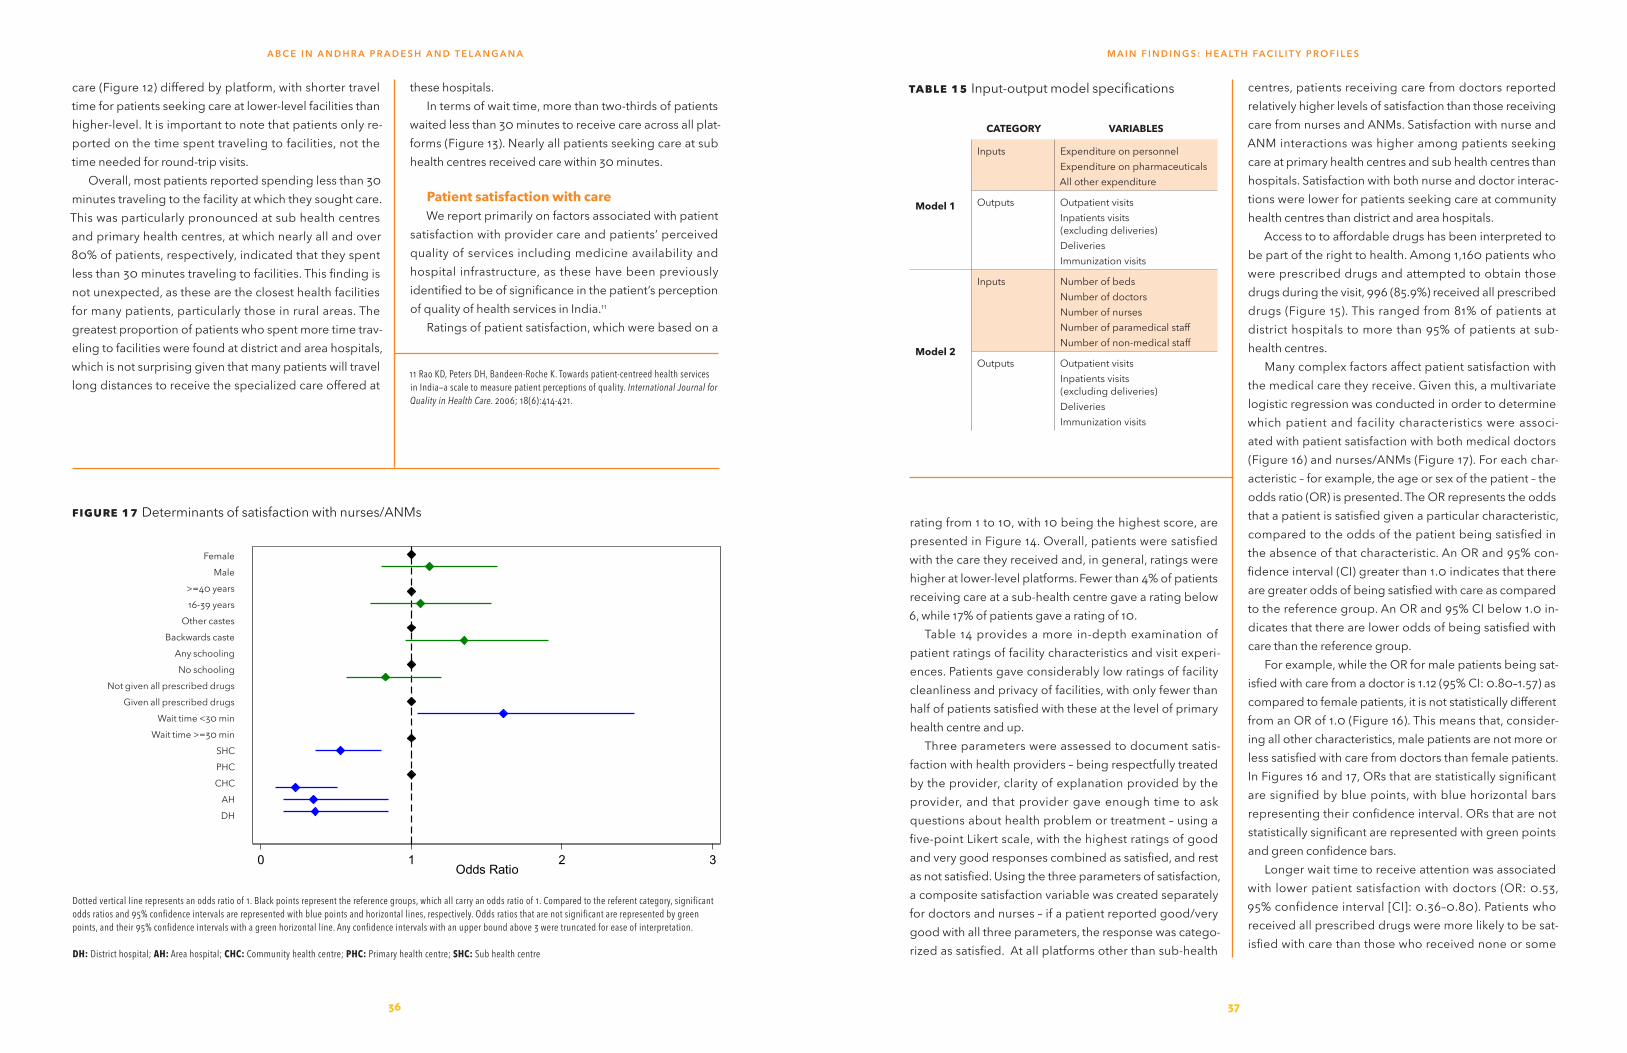
3736
care (Figure 12) differed by platform, with shorter travel time for patients seeking care at lower-level facilities than higher-level. It is important to note that patients only re-ported on the time spent traveling to facilities, not the time needed for round-trip visits.
Overall, most patients reported spending less than 30 minutes traveling to the facility at which they sought care. This was particularly pronounced at sub health centres and primary health centres, at which nearly all and over 80% of patients, respectively, indicated that they spent less than 30 minutes traveling to facilities. This finding is not unexpected, as these are the closest health facilities for many patients, particularly those in rural areas. The greatest proportion of patients who spent more time trav-eling to facilities were found at district and area hospitals, which is not surprising given that many patients will travel long distances to receive the specialized care offered at
FemaleMale
>=40 years16-39 years
Other castesBackwards caste
Any schoolingNo schooling
Not given all prescribed drugsGiven all prescribed drugs
Wait time <30 minWait time >=30 min
SHCPHCCHC
AHDH
0 1 2 3Odds Ratio
Figure17Determinants of satisfaction with nurses/ANMs
Dotted vertical line represents an odds ratio of 1. Black points represent the reference groups, which all carry an odds ratio of 1. Compared to the referent category, significant odds ratios and 95% confidence intervals are represented with blue points and horizontal lines, respectively. Odds ratios that are not significant are represented by green points, and their 95% confidence intervals with a green horizontal line. Any confidence intervals with an upper bound above 3 were truncated for ease of interpretation.
DH: District hospital; AH: Area hospital; CHC: Community health centre; PHC: Primary health centre; SHC: Sub health centre
these hospitals.In terms of wait time, more than two-thirds of patients
waited less than 30 minutes to receive care across all plat-forms (Figure 13). Nearly all patients seeking care at sub health centres received care within 30 minutes.
PatientsatisfactionwithcareWe report primarily on factors associated with patient
satisfaction with provider care and patients’ perceived quality of services including medicine availability and hospital infrastructure, as these have been previously identified to be of significance in the patient’s perception of quality of health services in India.11
Ratings of patient satisfaction, which were based on a
11 Rao KD, Peters DH, Bandeen-Roche K. Towards patient-centreed health services in India—a scale to measure patient perceptions of quality. International Journal for Quality in Health Care. 2006; 18(6):414-421.
Table15Input-output model specifications
CATEGORY VARIABLES
Model 1
Inputs Expenditure on personnelExpenditure on pharmaceuticalsAll other expenditure
Outputs Outpatient visitsInpatients visits (excluding deliveries)DeliveriesImmunization visits
Model 2
Inputs Number of bedsNumber of doctorsNumber of nursesNumber of paramedical staffNumber of non-medical staff
Outputs Outpatient visitsInpatients visits (excluding deliveries)DeliveriesImmunization visits
rating from 1 to 10, with 10 being the highest score, are presented in Figure 14. Overall, patients were satisfied with the care they received and, in general, ratings were higher at lower-level platforms. Fewer than 4% of patients receiving care at a sub-health centre gave a rating below 6, while 17% of patients gave a rating of 10.
Table 14 provides a more in-depth examination of patient ratings of facility characteristics and visit experi-ences. Patients gave considerably low ratings of facility cleanliness and privacy of facilities, with only fewer than half of patients satisfied with these at the level of primary health centre and up.
Three parameters were assessed to document satis-faction with health providers – being respectfully treated by the provider, clarity of explanation provided by the provider, and that provider gave enough time to ask questions about health problem or treatment – using a five-point Likert scale, with the highest ratings of good and very good responses combined as satisfied, and rest as not satisfied. Using the three parameters of satisfaction, a composite satisfaction variable was created separately for doctors and nurses – if a patient reported good/very good with all three parameters, the response was catego-rized as satisfied. At all platforms other than sub-health
centres, patients receiving care from doctors reported relatively higher levels of satisfaction than those receiving care from nurses and ANMs. Satisfaction with nurse and ANM interactions was higher among patients seeking care at primary health centres and sub health centres than hospitals. Satisfaction with both nurse and doctor interac-tions were lower for patients seeking care at community health centres than district and area hospitals.
Access to to affordable drugs has been interpreted to be part of the right to health. Among 1,160 patients who were prescribed drugs and attempted to obtain those drugs during the visit, 996 (85.9%) received all prescribed drugs (Figure 15). This ranged from 81% of patients at district hospitals to more than 95% of patients at sub-health centres.
Many complex factors affect patient satisfaction with the medical care they receive. Given this, a multivariate logistic regression was conducted in order to determine which patient and facility characteristics were associ-ated with patient satisfaction with both medical doctors (Figure 16) and nurses/ANMs (Figure 17). For each char-acteristic – for example, the age or sex of the patient – the odds ratio (OR) is presented. The OR represents the odds that a patient is satisfied given a particular characteristic, compared to the odds of the patient being satisfied in the absence of that characteristic. An OR and 95% con-fidence interval (CI) greater than 1.0 indicates that there are greater odds of being satisfied with care as compared to the reference group. An OR and 95% CI below 1.0 in-dicates that there are lower odds of being satisfied with care than the reference group.
For example, while the OR for male patients being sat-isfied with care from a doctor is 1.12 (95% CI: 0.80–1.57) as compared to female patients, it is not statistically different from an OR of 1.0 (Figure 16). This means that, consider-ing all other characteristics, male patients are not more or less satisfied with care from doctors than female patients. In Figures 16 and 17, ORs that are statistically significant are signified by blue points, with blue horizontal bars representing their confidence interval. ORs that are not statistically significant are represented with green points and green confidence bars.
Longer wait time to receive attention was associated with lower patient satisfaction with doctors (OR: 0.53, 95% confidence interval [CI]: 0.36–0.80). Patients who received all prescribed drugs were more likely to be sat-isfied with care than those who received none or some
M A I N F I N D I N G S : H E A LT H FA C I L I T Y P R O F I L E SA B C E I N A N D H R A P R A D E S H A N D T E L A N G A N A

3938
Table16Average and range of inputs and outputs, by platform. INR denotes Indian Rupees.
DISTRICT HOSPITAL
AREA HOSPITAL
COMMUNITY HEALTH CENTRE
PRIMARY HEALTH CENTRE
Inputs
Personnel expenditure (INR) 49,230,395
(10,745,212–152,830,688)
24,358,433
(5,257,840–91,644,776)
6,260,759
(1,724,198– 14,196,109)
3,547,308
(812,954– 11,163,012)
Pharmaceutical expenditure (INR) 6,858,420
(1,754,404– 43,038,936)
2,525,449
(1,152,646– 7,138,705)
892,576
(185,054– 3,527,169)
345,357
(58,103– 1,154,362)
Other expenditure (INR) 16,672,097
(560,431– 97,932,792)
1,624,009
(235,904– 5,526,153)
840,145
(35,852– 3,764,388)
287,224
(18,493– 1,618,994)
Number of beds 256
(100–500)
110
(100–140)
40
(13–60)
4
(0–8)
Number of doctors 21
(6–49)
13
(3–21)
6
(3–12)
2
(0–4)
Number of nurses 62
(18–108)
24
(10–36)
8
(1–16)
2
(0–5)
Number of paramedical staff 35
(17–59)
16
(4–32)
11
(2–23)
16
(4–54)
Number of non-medical staff 39
(13–87)
13
(2–31)
5
(1–11)
2
(0–6)
Outputs
Outpatient visits 169,685
(34,888–338,059)
151,279
(69,387–328,518)
61,098
(4,323–145,114)
29,763
(6,487–86,142)
Inpatient visits (excluding deliv-eries)
24,239
(6,048–64,662)
10,518
(2,838–23,208)
3,922
(380–9,653)
588
(0–2,734)
Deliveries 1,959
(684–4,453)
1,145
(234–2,506)
385
(0–2,565)
79
(0–364)
Immunization doses 8,469
(2,290–17,722)
53,382
(1,724–172,726)
38,950
(478–71,763)
11,175
(0–64,979)
Figure18Outpatient load per staff by platform
DH: District hospital; AH: Area hospital; CHC: Community health centre; PHC: Primary health centre
Note: each line represents an individual facility, with the bolded line depicting the average for the platform. Scales are different for each platform type.
of the drugs (OR: 1.61, 95% CI: 1.04–2.48). Compared to patients seeking care at primary health centres, patients were less satisfied with doctors at community health cen-tres (OR: 0.23, 95% CI: 0.10–0.51), area hospitals (OR: 0.35, 95% CI: 0.15–0.85), and district hospitals (OR: 0.36, 95% CI: 0.15–0.85).
Considering all selected patient and facility character-istics, wait time and platform were significantly associated with satisfaction with nurses/ANMs. Patients who had a longer wait time at the facility were less satisfied (OR: 0.45, 95% CI: 0.26–0.76). Compared to sub health centres, there were lower odds of a patient being satisfied with
nurses/ANMs at primary health centres (OR: 0.18, 95% CI: 0.07–0.44), community health centres (OR: 0.07, 95% CI: 0.02–0.18), area hospitals (OR: 0.10, 95% CI: 0.02–0.32), and district hospitals (OR: 0.11, 95% CI: 0.04–0.33).
EfficiencyandcostsThe costs of health service provision and the efficiency
with which care is delivered by health facilities go hand-in-hand. An efficient health facility uses resources well, producing a high volume of patient visits and services without straining its resources. Conversely, an inefficient health facility is one where the use of resources is not
maximized, leaving usable beds empty or medical staff seeing very few patients per day. We present technical efficiency analysis for district hospitals, area hospitals, community health centres and primary health centres.
AnalyticalapproachAn ensemble model approach was used to quantify
technical efficiency in health facilities, combining results from two approaches – the restricted versions of Data Envelopment Analysis (rDEA) and Stochastic Distance
Function (rSDF).12 Based on this analysis, an efficiency score was estimated for each facility, capturing a facility’s use of its resources. Relating the outputs to inputs, the rDEA and rSDF approaches compute efficiency scores ranging from 0% to 100%, with a score of 100% indicat-ing that a facility achieved the highest level of production relative to all facilities in that platform.
12 Di Giorgio L, Flaxman AD, Moses MW, Fullman N, Hanlon M, Conner RO, et al. Efficiency of Health Care Production in Low-Resource Settings: A Monte-Carlo Simulation to Compare the Performance of Data Envelopment Analysis, Stochastic Distance Functions, and an Ensemble Model. PLOS ONE. 2016; 11(2): e0150570.
M A I N F I N D I N G S : H E A LT H FA C I L I T Y P R O F I L E SA B C E I N A N D H R A P R A D E S H A N D T E L A N G A N A

4140
Figure19 Inpatient load per staff by platform
DH: District hospital; AH: Area hospital; CHC: Community health centre; PHC: Primary health centre
Note: each line represents an individual facility, with the bolded line depicting the average for the platform. Scales are different for each platform type.
Figure20Deliveries per staff by platform
DH: District hospital; AH: Area hospital; CHC: Community health centre; PHC: Primary health centre
Note: each line represents an individual facility, with the bolded line depicting the average for the platform. Scales are different for each platform type.
M A I N F I N D I N G S : H E A LT H FA C I L I T Y P R O F I L E SA B C E I N A N D H R A P R A D E S H A N D T E L A N G A N A
This approach assesses the relationship between in-puts and outputs to estimate an efficiency score for each facility. Recognizing that each type of input requires a different amount of facility resources (e.g., on average, an inpatient visit uses more resources and more com-plex types of equipment and services than an outpatient visit), we applied weight restrictions to rescale each fa-cility’s mixture of inputs and outputs. The incorporation of additional weight restrictions is widely used in order to improve the discrimination of the models. Weight re-strictions are most commonly based upon the judgment about the importance of individual inputs and outputs, or
reflect cost or price considerations. The resulting ensem-ble efficiency scores were averaged over five years and between the two input models.
For these models, service provision was categorized into outpatient visits, inpatient visits, delivery, and immu-nization. Two input-output specifications were used, with the inputs being different in the two models. The inputs and outputs are listed in Table 15. The detailed data uti-lized for this analysis are documented in the annex. The average and range of inputs and outputs for the variables are presented in Table 16.
It is important to note that data availability on the in-puts and output indicators varied across the facilities and platforms, with more non-availability for PHCs. Facilities with five years of missing data for any input or output vari-able were dropped from analysis. In addition, the data were smoothed where necessary based on the trends seen in inputs or outputs for that facility.
To further illustrate the production of outputs per in-puts – in this case, staff – a simple ratio of outpatient visits (Figure 18), inpatient visits (Figure 19), deliveries (Figure 20), and immunization doses (Figure 21) per staff are pre-
sented. District hospitals produced an average of 3,139 outpatient visits per staff, though the ratio ranged greatly. The average ratio was 2,407 visits per staff for area hospi-tals, 2,073 for community hospitals, and 1,394 for primary health centres. This gradient was similar for inpatient vis-its, with district hospitals providing 279 inpatient visits per staff, area hospitals providing 178, community health centres providing 156, and primary health centres pro-viding 31. The range of inpatient visits per staff was low for primary health centres, where inpatient visits are rare. Overall, as expected, outpatient visits accounted for the

4342
Figure21 Immunizations per staff per day by platform
DH: District hospital; AH: Area hospital; CHC: Community health centre; PHC: Primary health centre
Note: each line represents an individual facility, with the bolded line depicting the average for the platform. Scales are different for each platform type.
Table17District-wise efficiency scores (%), by platform
DISTRICT/PLATFORM
DISTRICT HOSPITAL
AREA HOSPITAL
COMMUNITY HEALTH CENTRE PRIMARY HEALTH CENTRE
1 1 2 1 2 1 2 3 4
AndhraPradesh
District 1 71 75 60 74 69 64 53 76
District 2 71 87 79 58 82 75 62 49
District 3 28 37 24 46 38 46
District 4 71 54 53 23 35 38 52
District 8 66 72 30 50 57 51 38 26
Telangana
District 5 66 72 54
District 6 50 60 26 29 31
District 7 70 63 75 76 36 60
District 9 71 62 59 55
White cells were either dropped from analysis due to data availability, or there were no more facilities to sample of that platform. For District 5, there were no facilities to sample below AH.
Figure22Range of efficiency scores across platforms
Note: Each circle represents the five-year facility average efficiency score; IQR refers to intra-quartile range. 20
4060
8010
0
District Hospital Area Hospital
Community Health Centre Primary Health Centre
M A I N F I N D I N G S : H E A LT H FA C I L I T Y P R O F I L E SA B C E I N A N D H R A P R A D E S H A N D T E L A N G A N A
overwhelmingly large majority of the patients seen per staff per day across the platforms.
Fewer deliveries were performed per staff than other services, with an average of 31 deliveries per staff in dis-trict hospitals, 20 per staff in area hospitals, 14 per staff in community health centres, and four per staff in primary health centres. A different pattern emerged for immuni-zation doses: 1,272 doses were administered per staff in community health centres, 837 per staff in area hospitals, 557 per staff in primary health centres, and 207 per staff in district hospitals.
EfficiencyresultsUsing the five fiscal years of data to estimate the effi-
ciency scores for all facilities, two main findings emerged. First, efficiency scores were relatively low across all health facilities, with 64.9% being the highest mean across platforms. Second, the range between the facil-ities with highest and lowest efficiency scores was quite large within platforms, suggesting that a substantial per-formance gap may exist between the average facility and facilities with the highest efficiency scores. Figure 22 depicts this range of facility efficiency scores across plat-forms for APT.
District hospital
Community health centre
Area hospital
Primary health centre
DistricthospitalMean: 61.3Median: 67.5IQR: 57.8-70.8
PrimaryhealthcentreMean: 49.6Median: 51.0IQR: 36.0-61.5
AreahospitalMean: 64.9Median: 66.8IQR: 59.5-72.0
CommunityhealthcentreMean: 54.3Median: 55.8IQR: 46.0-73.5

Figure24 Average total and type of expenditure, by platform, 2007–2011
050
100
Exp
endi
ture
in 1
00,0
00 R
upee
s2007 2008 2009 2010 2011
District Hospitals
Personnel
Pharmaceuticals and consumables Other
COMMUNITY HEALTH CENTRES
020
4060
Exp
endi
ture
in 1
00,0
00 R
upee
s
2007 2008 2009 2010 2011
District Hospitals
Personnel
Pharmaceuticals and consumables Other
PRIMARY HEALTH CENTRES
010
020
030
040
0E
xpen
ditu
re in
100
,000
Rup
ees
2007 2008 2009 2010 2011
Area Hospitals
Personnel
Pharmaceuticals and consumables Other
AREA HOSPITALS
020
040
060
080
01,
000
Exp
endi
ture
in 1
00,0
00 R
upee
s
2007 2008 2009 2010 2011
District Hospitals
Personnel
Pharmaceuticals and consumables Other
DISTRICT HOSPITALS
44
Table18 Average annual cost in INR, by district and platform, last fiscal year. INR denotes Indian Rupees.
DISTRICT DISTRICT HOSPITAL
AREA HOSPITAL
COMMUNITY HEALTH CENTRE
PRIMARY HEALTH CENTRE
AndhraPradesh
District 1 46,871,096 53,261,192 11,358,760 5,063,364
District 2 84,172,424 43,671,020 13,085,874 5,764,821
District 3 97,074,352 26,360,026 12,232,964 8,834,275
District 4 21,368,628 10,628,410 5,658,938
District 8 125,833,816 47,033,808
Telangana
District 5 189,286,192 13,155,454 9,995,043 5,182,676
District 6 80,054,728 28,779,546 12,843,085 6,885,115
District 7 202,479,888 14,318,990 10,559,072 5,539,970
District 9 26,582,862 97,807,664 7,278,418 2,661,053
Figure23Observed and estimated additional visits that could be produced given observed facility resources
M A I N F I N D I N G S : H E A LT H FA C I L I T Y P R O F I L E SA B C E I N A N D H R A P R A D E S H A N D T E L A N G A N A
The five-year average efficiency of district hospi-tals ranged from 28% to 71%, with a platform average of 61%. Area hospitals were between 37% and 87% efficient. Community health centres were between 24% and 79% efficient; four facilities were less than 50% efficient and three facilities were 75% or more efficient. The range of efficiency scores was widest for primary health centres, from 23% to 82%, with 11 facilities at less than 50% efficient.
Efficiency by district is presented in Table 17. There is variation in facility efficiency both between and within dis-tricts. All community health centres and primary health centres in District 3 and District 6 were similarly less than 50% efficient; however, the area hospital in District 6 was 60% efficient while the area hospital in District 3 was only
37% efficient. While one primary health centre in District 2 was 82% efficient, another was only 49% efficient.
Given observed levels of facility-based resources (beds and personnel), it would appear that many facilities had the capacity to handle much larger patient volumes than they reported. Figure 23 displays this gap in poten-tial efficiency performance across platforms, depicting the possible gains in total service provision that could be achieved if every facility in the ABCE sample operated at optimal efficiency.
We found that all types of facilities could expand their outputs substantially given their observed resources. Based on our analyses, the highest level of care, district hospitals, had the greatest potential for increasing service
45
Primary health centre
Community health centre
Area hospital
District hospital
Primary health centre
Community health centre
Area hospital
District hospital
Primary health centre
Community health centre
Area hospital
District hospital
Primary health centre
Community health centre
Area hospital
District hospital
Immunization doses

4746
A B C E I N A N D H R A P R A D E S H A N D T E L A N G A N A
inate, why a given facility scores higher than another, or what levels of efficiency are truly ideal. It is conceivable that always operating at full capacity could actually have negative effects on service provision, such as longer wait times, high rates of staff burnout and turnover, and com-promised quality of care. These factors, as well as less tangible characteristics such as facility management, are all important drivers of health service provision, and fu-ture work should also assess these factors alongside measures of efficiency.
CostsofcareTotal expenditure, by district and platform, is pre-
sented in Table 18. In terms of annual total expenditures, trends in average facility spending varied by platform be-tween 2007 and 2011 (Figure 24). All platforms recorded slightly higher levels of average expenditures in 2011 than in 2007, which appeared to be driven by increased spending on medical supplies and personnel. Figure 25 shows the average composition of expenditure types across platforms for 2011. Notably, area hospitals and PHCs spent a slightly greater proportion of their total ex-penditures on personnel than other platforms. On the other hand, expenditures on medical supplies were the most at CHCs with other expenditure being more in the district hospitals for the largest proportion of private facil-ities’ total spending.
provision without expanding current resources. Overall, based on our estimation of efficiency, a large portion of APT health facilities could increase the volume of patients seen and services provided with the resources available to them.
On average, district hospitals could provide 116,316 additional outpatient visits with the same inputs, while primary health centres could see 27,144 additional out-patient visits. Community health centres could administer an average of 30,502 additional immunization doses with the same inputs if all facilities were efficient.
At the same time, many reports and policy documents emphasize that pronounced deficiencies in human re-sources for health exist across India in the public sector health system, such that “significant [human resources for health] will be required to meet the demand” for health services.13 Our results suggest otherwise, as most facilities in the ABCE sample had the potential to bolster service production given their reported staffing of skilled person-nel and physical capital.
These findings provide a data-driven understanding of facility capacity and how health facilities have used their resources in APT; at the same time, they are not without limitations. Efficiency scores quantify the relationship be-tween what a facility has and what it produces, but these measures do not fully explain where inefficiencies orig-
13 Rao M, Rao KD, Kumar AK, Chatterjee M, Sundararaman T. Human resources for health in India. The Lancet. 2011; 377(9765): 587-98.
Figure25 Average percentage of expenditure type, by platform, in 2011
0 20 40 60 80 100Percent of Total Expenditure
Primary Health Centre
Community Health Centre
Area Hospital
District Hospital
Personnel
Pharmaceuticals and consumables
Other
Primary health centre
Community health centre
Area hospital
District hospital

48
C O N C L U S I O N S A N D P O L I C Y I M P L I C AT I O N S
49
Conclusions and policy implications
To achieve its mission to “expand the reach of health care and establishing universal health coverage,”1 India has strived over the past 10 years to expand and strengthen the public
sector of health care, with a focus on reaching rural areas. The country recognizes disparities and has sought to en-act policies and implement programs to expand access to essential and special services for marginalized groups. Our findings show that these goals are ambitious but at-tainable, if the country focuses on rigorously measuring health facility performance and costs of services across and within levels of care, and if it can align the different dimensions of health service provision to support optimal health system performance.
FacilitycapacityforserviceprovisionOptimal health service delivery, one of the key build-
ing blocks of the health system,2 is linked to facility capacity to deliver the services needed by individuals and additionally render adequate demand for services. With the appropriate balance of skilled staff and supplies to of-fer essential and special health services, a health system has the foundation needed to deliver quality, equitable health services.3,4
The availability of a subset of services (e.g., birth attendance, antenatal care, general medicine, and labo-ratory services) was generally reasonable across facility types in Andhra Pradesh and Telangana as relevant to that platform. This broad access reflects an expansion of these services throughout the state. However, there were disparities in availability of services offered between high- and lower-level platforms, namely, DOTS and HIV
1 Planning Commission Government of India. Twelfth Five Year Plan (2012-17). New Delhi, India: Government of India, 2012. 2 World Health Organization (WHO). Everybody’s Business: Strengthening health systems to improve health outcomes: WHO’s Framework for Action. Geneva, Swit-zerland: WHO, 2007.3 Balarajan, Y, Selveraj, S, Subramanian, SV. Health care and equity in India. The Lancet. 2011; 377: 505-515. 4 Rao M, Rao KD, Kumar AK, Chatterjee M, Sundararaman T. Human resources for health in India. The Lancet. 2011; 377(9765): 587-98.
treatment, and immunization services were less avail-able at community health centres. High-level facilities are tasked with providing secondary care, but also offer essential services. However, many of these facilities were not adequately supplied to provide such services. Within these states, not all district hospitals (88%) reported pro-viding DOTS treatment for tuberculosis and STI treatment, both of which are considered essential services.
Chronic diseases (e.g., cardiovascular diseases, men-tal health disorders, diabetes, and cancer) and injuries, which are the leading causes of death and disability in India, are projected to increase in their contribution to the burden of disease during the next 25 years.5,6,7 Much of the care for chronic diseases and injuries is provided in the private sector and can be very expensive. These study findings also document notably lacking NCD-re-lated services from all levels of care, including cardiology, psychiatry, and chemotherapy. Only 25% of the district hospitals provide cardiology services, and only 50% re-port providing psychiatric care. Such gaps in the health system will exacerbate disparities by not dealing ap-propriately with NCDs while continuing to endeavor to eliminate major infectious diseases like tuberculosis, HIV, and malaria, or to reduce neonatal and infant mortality. Furthermore, there also is a paucity of essential equip-ment for NCD services, including glucometer/test strips and blood chemistry analyzers. Functional ultrasound ma-chines were present at all district hospitals and most area hospitals (90%). Furthermore, though functional CT scans are considered essential, they were not available at any area hospital. These findings support the need for imme-
5 GBD 2015 Mortality and Causes of Death Collaborators. Global, regional, and national life expectancy, all-cause mortality, and cause-specific mortality for 249 causes of death, 1980–2015: a systematic analysis for the Global Burden of Disease Study 2015. The Lancet. 2016; 388:1459–1544. 6 Patel V, Chatterji S, Chisholm D, Ebrahim S, Gopalakrishna, G, Mathers C et al. Chronic diseases and injuries in India. The Lancet. 2011; 377: 413-28.7 GBD 2015 DALYs and HALE Collaborators. Global, regional, and national disability-adjusted life-years (DALYs) for 315 diseases and injuries and healthy life expectancy (HALE), 1990–2015: a systematic analysis for the Global Burden of Disease Study 2015. The Lancet. 2016 Oct 7; 388:1603–1658.
diate action to scale up interventions for chronic diseases through improved public health and primary health care systems that are essential for the implementation of cost-effective interventions.
India has a severe shortage of human resources for health. It has a shortage of qualified health workers and the workforce is concentrated in urban areas. In the con-text of a shortage of qualified health personnel at all levels of the health system, but especially rural areas,8,9,10 results reveal disparate staffing patterns between fa-cilities. Hospitals employ a large number of staff. At the lower, community levels, paramedical staff including nurses and ANMs provide the majority of care to patients (based on reported staffing). These staffing patterns are not unexpected, as this is the hierarchy of care. How-ever, nurses do not have much authority or say within the health system, and the resources to train them are still inadequate. A call has been made to the govern-ment to urgently address the issues of human resources through a comprehensive national policy for human resources to achieve universal health care in India. How-ever, it should be noted that despite the shortfall in human resources, the study findings suggest suboptimal efficiency in production of services with the given level of human resources.
InfrastructureandequipmentAdequate operational equipment and infrastructure
are essential for the functioning of a facility, which af-fects the efficiency of service provision. In these states, all facilities but sub-health centres had access to a func-tioning electricity. Furthermore, no facilities reported being solely dependent on a generator. This means that the quality of health services is elevated across the states, with more reliable storage of medications, vaccines, and laboratory samples.
Most surveyed facility types except for sub-health centres reported flush toilets. However, access to piped water was more variable. While all district hospitals, 90% of area hospitals, and 88% of community health centres reported having piped water, fewer than 78% of primary
8 Planning Commission Government of India. Twelfth Five Year Plan (2012-17). New Delhi, India: Government of India, 2012. 9 Hazarika I. Health Workforce in India: Assessment of Availability, Production and Distribution. WHO South East Asia Journal of Public Health. 2013; 2(2): 106-112. 10 Rao M, Rao KD, Kumar AK, Chatterjee M, Sundararaman T. Human resources for health in India. The Lancet. 2011; 377(9765): 587-98.
health centres and 38% of sub-health centres reported having this resource. India’s Twelfth Five Year Plan recog-nizes the necessity of access to clean water and sanitation in the control of disease, and states that increased re-source allocation to ensure this from the public health sector is necessary.11 Despite findings that indicate low-er-level facilities have less access to water and sanitation, the study found that many facilities did have these essen-tial resources, likely reflecting India’s commitment12,13 to upgrade all facilities so they meet Indian Public Health Standards.
Based on WHO equipment guidelines,14 district hospi-tals generally reported high availability of basic medical equipment and equipment to perform routine delivery care. However, they, and all other lower health facilities, reported depressed availability of basic lab equipment. Few facilities across all platforms reported being fully equipped for delivery services, though 94% to 100% of facilities reported providing delivery services. Sim-ilarly, few facilities (fewer than 67% DHs and 30% for all other facility types) across all platforms reported being fully equipped for antenatal care services, though all fa-cilities reported providing these services. Equipment for blood tests and functional equipment to perform general surgery were highest at district hospitals. At least 80% of area and district hospitals had each of the essential items for these services, but availability was consider-ably less at lower-level health facilities. There are large gaps in equipment and testing availability across all platforms; improving availability of these items could im-prove the quality of care provided. This is especially true for essential medical equipment to diagnose and treat non-communicable conditions.
FacilityproductionofhealthservicesOverall, the number of outpatient visits by year and
platform was stable over the five years of observation. District hospitals have slightly increased their volume of visits. Outpatient visits were considerably lower at the lower health facilities. The volume of inpatient visits and
11 Planning Commission Government of India. Twelfth Five Year Plan (2012-17). New Delhi, India: Government of India, 2012. 12 Planning Commission Government of India. Eleventh Five Year Plan (2007-12). New Delhi, India: Government of India, 2007. 13 Planning Commission Government of India. Twelfth Five Year Plan (2012-17). New Delhi, India: Government of India, 2012. 14 World Health Organization (WHO). Service Availability and Readiness Assess-ment (SARA) Reference Manual. Geneva, Switzerland: WHO, 2015.

50 51
C O N C L U S I O N S A N D P O L I C Y I M P L I C AT I O N S
deliveries increased over the five years of observation for all platforms. The highest volumes of visits were held by district hospitals, followed by area hospitals. Facility ex-penditure is dominated by personnel costs – accounting for, on average, at least 70% of total costs.
Efficiency scores reflect the relationship between facility-based resources and the facility’s total patient volume each year. Average efficiency scores by platform ranged from 49.6% to 64.9%, indicating patient volume could substantially increase with the observed levels of resources and expenditure. Within each platform, there is great variation in the efficiency of health facilities be-tween and within districts. With this information, we estimated that facilities could substantially increase the number of patients seen and services provided based on their observed levels of medical personnel and resources in 2011. As India seeks to strengthen public-sector care to reduce the heavy burden of out-of-pocket expendi-tures,15,16 stakeholders may seek to increase efficiency by providing more services while maintaining personnel, ca-pacity (beds), and expenditure.
Further use of these results requires considering ef-ficiency in the context of several other factors, including quality of care provided, demand for care, and expedi-ency with which patients are seen.
The policy implications of these efficiency results are both numerous and diverse, and they should be viewed with a few caveats. A given facility’s efficiency score cap-tures the relationship between observed patient volume and facility-based resources, but it does not reflect the expediency with which patients are seen, the optimal provision of services,, demand for the care received, and equity in provision of services to serve those who are dis-advantaged.17. These are all critical components of health service delivery, and they should be thoroughly consid-ered alongside measures of efficiency. On the other hand, quantifying facility-based levels of efficiency provides a data-driven, rather than strictly anecdotal, understand-ing of how much APT health facilities could potentially expand service provision without necessarily increasing personnel or bed capacity in parallel.
15 Planning Commission Government of India. Twelfth Five Year Plan (2012-17). New Delhi, India: Government of India, 2012. 16 Kumar AKS, Chen LC, Choudhury M, Ganju S, Mahajan V, Sinha A et al. Financing health care for all: challenges and opportunities. The Lancet. 2011; 377: 668-79. 17 UNICEF. Narrowing the gaps: The power of investing in the poorest children. New York, NY: UNICEF, 2017
CostsofcareAverage facility expenditure per year differed sub-
stantially across platforms. We were unable to estimate the costs of care by type of services (such as outpatients, inpatients, deliveries, immunization, etc.) or by type of disease/condition (such as TB, diabetes, etc.) as such data are not readily available at the facilities. Estimating such costs of care and identifying differences in patient costs across the type of platforms is critical for isolating areas to improve cost-effectiveness and expand less costly ser-vices, especially for hard-to-reach populations.
Nevertheless, these results on expenditures offer in-sights into each state’s health financing landscape, a key component to health system performance in terms of cost to facilities and service production. While these costs do not reflect the quality of care received or the specific services provided for each visit, they can enable a compelling comparison of overall health care expenses across states within India. Future studies should aim to capture information on the quality of services provided, as it is a critical indicator of the likely impact of care on patient outcomes.
PatientperspectivesPatient satisfaction is an important indicator of pa-
tient perception of the quality of services provided by the health care sector.18,19 Evaluation of services by pa-tients is important for purposes of monitoring, increasing accountability, recognizing good performance, and adapting patient-centric services, and for utilization of services and compliance to treatment. This report ex-amined patient perspectives at public facilities; a major strength of this study is that patient satisfaction was as-sessed across the various levels of public sector health care in both the states.
The public health system in India was designed as a referral hierarchical system to provide a continuum of health care, and as a consequence of this, failure at one level can impact the chain of care at another lev-el.20 Although various government initiatives have led to
18 Mpinga EK, Chastonay P. Satisfaction of patients: a right to health indicator? Health Policy. 2011; 100(2-3):144-150.19 Baltussen RM, Yé Y, Haddad S, Sauerborn RS. Perceived quality of care of prima-ry health care services in Burkina Faso. Health Policy Plan. 2002; 17: 42-48.20 National Health Mission, Ministry of Health and Family Welfare, Government of India. Framework for Implementation National Health Mission (2012-2017). New Delhi, India: Government of India, 2012.
improved basic service delivery at primary care health facilities over the last few years, still a large number of patients directly visit higher-level facilities, leading to overcrowding of those facilities,21 which impacts quality of care as it stretches facility resources in terms of both infrastructure and staff. In addition, the persistent short-age of medical staff in public facilities only aggravates the crowded condition at these facilities.22
Findings indicate that patients were generally satisfied with the care they received, and ratings and satisfaction were highest at the lowest levels of care. Overall, patients who rated interactions with doctors reported relatively higher levels of satisfaction about respectfulness, clar-ity, and time than those receiving care from nurses and ANMs. However, most were not satisfied with the clean-liness of or privacy at the facility. Holding other factors constant, patients with wait times longer than 30 minutes to see health providers were less satisfied with care from either doctors or nurses/ANMs.
In general, patients experienced short travel time to the facility and short wait times at the health facility. Wait time to see the health provider and type of platform at which care was sought were significantly associated with the level of patient satisfaction. Most patients travelled fewer than 30 minutes to receive care, with patients at lower-level facilities reporting the shortest wait times.
Finally, fewer than 20% of patients at district and area hospitals, and community health centres, reported being unable to acquire prescribed drugs. At primary health centres and sub-health centres, fewer than 10% of patients reported that they were unable to receive prescribed drugs. Though these levels are encouraging, ensuring that all patients may obtain prescribed medi-cations at the time of their visit should be a priority, as it facilitates adherence and continuity of care.23,24,25
With the developmental priorities for the government of India clearly highlighting the need to increase user participation in health care service delivery for better ac-
21 Bajpai V. The Challenges Confronting Public Hospitals in India, Their Origins, and Possible Solutions. Advances in Public Health 2014; 2014: 27.22 Rao M, Rao KD, Kumar AK, Chatterjee M, Sundararaman T. Human resources for health in India. The Lancet. 2011; 377(9765): 587-98.23 Grover A, Citro B. India: Access to affordable drugs and the right to health. The Lancet. 2011; 377: 976-977.24 World Health Organization (WHO). Equitable access to essential medicines: a framework for collective action. Geneva, Switzerland: WHO, 2004.25 Reddy, KS, Patel V, Jha P, Paul VK, Kumar AK, Dandona, L. Towards achievement of universal health care in India by 2020: a call to action. The Lancet. 2011: 377: 1154.
countability,26 understanding how patients perceive the quality of the existing public health services encompass-ing various dimensions of care such as time to receive medical attention and staff behavior could contribute to developing strategies to improve performance and utili-zation of the public health system.27
HealthinformationsystemThis study was dependent on the data availability at
the facilities for the various inputs and outputs. Because of the vast extent of data that were collected for five fi-nancial years across the facilities, there are several lessons regarding the common bottlenecks within the health in-formation system, both at the facility level and at the state level. In general, there is weak staff capacity for data cap-ture and data management and use (interpretation or planning) at all levels. No system of regular review of data at the facility level that could guide planning or improve-ment of service provision was observed.
It is not possible to assess the outputs by disease/con-dition other than for deliveries, as data are not captured or collated by disease groups at the facilities. At the high-er-level facilities, collation of data on patients seen at the facilities was not readily available, and it was not possible to assess the level of duplication of patients across the departments. Furthermore, documentation of patients as a new patient or a follow-up patient was neither standard-ized nor practiced across most health facilities. Therefore, data interpretation is possible only in terms of number of visits and not in terms of number of patients.
Data were either incomplete or inaccurate at some fa-cilities for expenditure, patient-related outputs, and staff numbers. In general, the expenditure documentation had the most bottlenecks with these data available across various sources for a given facility. For example, it is not possible to document the expenditures at a given facility without procuring relevant data from the facility, a higher level of facility (block level), district health society, and at times from the state. The most limited capacity was to capture the expenditure on drugs, medical consumables, and supplies.
26 Planning Commission, Government of India. Faster, sustainable and more inclusive growth: An approach to the Twelfth Five Year Plan. New Delhi, India: Government of India, 2012.27 World Health Organization (WHO). Global Health Observatory Data Repository. Geneva, Switzerland: WHO, 2016.
A B C E I N A N D H R A P R A D E S H A N D T E L A N G A N A

5352
A B C E I N A N D H R A P R A D E S H A N D T E L A N G A N A
SummaryThe ABCE project was designed to provide policymak-
ers and funders with new insights into health systems and to drive improvements. We hope these findings will not only prove useful to policymaking in the two states, but will also inform broader efforts to mitigate factors that im-pede the equitable access or delivery of health services in India. It is with this type of information that the individual building blocks of health system performance, and their critical interaction with each other, can be strengthened. More efforts like the ABCE project in India are needed to continue many of the position trends highlighted in this report and overcome the identified gaps. Analyses that take into account a broader set of the state’s facilities, including private facilities, may offer an even clearer pic-ture of levels and trends in capacity, efficiency, and cost. Continued monitoring of the strength and efficiency of service provision is critical for optimal health system per-formance and the equitable provision of cost-effective interventions throughout the states and in India.

5554
FACILITY INFORMATION INPUTS(BEDS&STAFF) OUTPUTS EXPENDITURE
District Platform Facility Year Beds Doctors Nurses Para-medical Non-medical Outpatient Inpatient Vaccinations Births PersonnelInfrastructure+Utilities
Medical supplies+ pharmaceuticals
Administrationandtraining Non-medical
1 DH 1 2008 100 11 23 42 13 96,116 20,905 5,072 1,528 25,227,144 807,384 1,954,193 28,211 400,745
1 DH 1 2009 100 15 18 43 13 100,064 20,511 4,536 1,181 28,538,480 903,912 1,957,788 51,788 224,353
1 DH 1 2010 100 12 30 42 13 123,973 19,767 3,832 812 35,756,104 901,851 29,804,130 30,906 463,880
1 DH 1 2011 100 11 29 40 13 116,069 20,676 3,839 999 39,633,488 1,192,556 5,421,093 55,982 567,976
1 AH 1 2007 100 11 22 20 7 147,398 15,103 5,426 1,726 12,299,214 701,050 1,941,617 107,132 719,750
1 AH 1 2008 100 10 22 21 7 171,312 16,774 6,382 1,935 15,155,077 767,470 1,956,892 41,855 1,250,628
1 AH 1 2009 100 11 22 20 7 182,240 16,855 5,398 1,630 22,448,450 664,101 2,342,732 94,046 1,805,901
1 AH 1 2010 100 12 22 23 7 161,266 15,155 5,448 1,566 34,832,744 473,448 3,556,179 31,901 1,934,084
1 AH 1 2011 100 12 22 23 7 192,313 14,847 5,377 1,911 42,828,676 821,400 4,906,364 63,975 4,640,777
1 CHC 1 2007 30 3 6 5 4 16,050 1,461 53,305 214 2,375,792 23,896 434,250 3,768 8,188
1 CHC 1 2008 30 3 5 7 4 26,551 2,542 50,025 202 3,337,247 28,645 500,000 5,212 2,105
1 CHC 1 2009 30 4 6 8 4 34,047 3,154 50,966 158 4,601,648 53,501 535,896 14,330 5,727
1 CHC 1 2010 30 5 5 8 4 42,799 3,134 71,432 139 5,913,658 63,135 746,232 42,477 2,208
1 CHC 1 2011 30 5 6 9 4 25,987 3,058 59,293 197 7,097,071 248,198 1,383,203 51,398 42,563
1 PHC 1 2007 4 2 3 11 2 41,334 425 31 15 2,066,407 22,182 240,061 16,633 12,116
1 PHC 1 2008 4 2 4 10 1 40,894 472 80 38 2,260,496 20,759 257,623 20,200 13,100
1 PHC 1 2009 4 2 4 9 2 41,288 786 69 47 2,923,131 20,083 250,165 20,085 15,950
1 PHC 1 2010 4 1 4 8 2 51,695 1,398 57 34 2,840,710 19,283 215,305 22,275 29,784
1 PHC 1 2011 4 0 4 5 2 52,576 1,201 49 29 2,783,856 19,683 338,945 26,320 52,790
1 PHC 2 2007 6 1 1 50 4 56,173 573 13,848 121 1,750,388 108,947 288,684 154,741 130,641
1 PHC 2 2008 6 1 1 53 4 53,909 701 14,573 144 2,821,530 94,447 309,183 118,625 47,000
1 PHC 2 2009 6 1 0 53 4 54,148 526 16,724 146 2,873,565 94,597 332,492 99,490 88,500
1 PHC 2 2010 6 1 1 53 3 59,771 481 14,737 108 3,810,561 78,570 163,445 70,000 99,080
1 PHC 2 2011 6 1 1 54 2 63,320 817 11,963 122 4,922,720 72,447 422,033 206,303 126,700
1 CHC 2 2007 15 5 5 20 3 81,175 1,502 45,849 275 6,209,196 60,742 313,836 11,350 2,150
1 CHC 2 2008 15 6 6 20 3 57,723 1,874 27,995 342 7,253,052 60,972 336,652 10,540 3,032
1 CHC 2 2009 15 6 6 21 3 63,550 1,762 33,099 316 10,303,458 63,304 218,851 12,015 4,180
1 CHC 2 2010 15 5 5 22 3 73,490 1,936 41,631 270 10,494,324 71,209 200,214 14,250 5,000
1 CHC 2 2011 15 5 6 23 3 50,918 1,226 36,303 215 13,272,456 81,592 519,096 14,942 7,000
Annex:Facility-specific data utilized for the efficiency analysis. Please note that data may be missing for some years across the facilities based on availability of data.DH: District hospital; AH: Area hospital; CHC: Community health centre; PHC: Primary health centre

5756
FACILITY INFORMATION INPUTS(BEDS&STAFF) OUTPUTS EXPENDITURE
District Platform Facility Year Beds Doctors Nurses Para-medical Non-medical Outpatient Inpatient Vaccinations Births PersonnelInfrastructure+Utilities
Medical supplies+ pharmaceuticals
Administrationandtraining Non-medical
1 PHC 3 2007 5 2 1 38 4 42,106 524 35,619 88 1,732,356 89,735 237,474 17,914 136,455
1 PHC 3 2008 5 2 1 36 4 43,974 427 1,146 77 2,610,380 102,948 254,132 25,104 311,461
1 PHC 3 2009 5 2 1 40 4 49,447 511 46,752 23 3,754,712 45,978 155,687 2,000 193,490
1 PHC 3 2010 5 2 1 42 4 45,122 519 35,740 56 4,337,530 88,984 218,672 7,852 302,412
1 PHC 3 2011 5 2 1 42 4 32,517 733 20,056 45 5,988,213 53,362 367,260 10,945 231,102
1 PHC 4 2007 5 1 1 43 2 56,509 2,327 6,476 82 1,053,020 42,647 295,117 85,611 0
1 PHC 4 2008 5 2 1 44 2 56,134 1,200 6,896 101 1,660,100 41,304 316,268 81,448 98,099
1 PHC 4 2009 5 2 3 43 4 80,671 2,267 6,797 112 1,951,258 40,697 234,679 74,350 77,625
1 PHC 4 2010 5 2 3 45 4 83,630 2,407 6,334 99 2,971,698 41,107 239,954 57,978 178,916
1 PHC 4 2011 5 2 3 44 4 86,142 2,734 6,561 72 3,915,490 40,547 400,195 176,468 98,075
2 DH 1 2007 300 21 83 30 18 257,387 31,554 5,634 2,368 37,001,436 1,933,149 6,360,362 74,774 176,154
2 DH 1 2008 300 32 86 27 13 219,709 33,392 6,804 2,431 48,083,316 1,316,264 5,836,233 54,664 550,550
2 DH 1 2009 300 29 82 26 21 222,785 33,872 5,477 2,390 46,685,196 3,630,014 6,300,638 60,000 1,705,374
2 DH 1 2010 300 28 83 24 14 230,765 32,797 5,845 2,380 58,272,516 1,382,670 6,596,454 25,000 1,282,695
2 DH 1 2011 300 30 78 24 17 232,910 31,331 6,395 2,503 65,346,228 2,702,821 13,879,202 59,166 2,185,004
2 AH 1 2007 100 8 14 17 6 230,324 11,089 132,824 1,717 7,182,566 230,601 1,925,000 55,145 0
2 AH 1 2008 100 17 29 19 6 219,463 11,608 134,508 1,619 18,048,626 211,076 1,940,000 24,828 0
2 AH 1 2009 100 15 27 16 6 269,739 12,740 134,882 1,835 37,493,680 257,023 2,314,198 48,975 0
2 AH 1 2010 100 16 35 14 6 204,651 13,015 112,791 1,701 29,469,684 265,050 3,084,560 69,302 0
2 AH 1 2011 100 15 36 14 6 223,539 13,927 128,061 2,506 36,105,452 311,098 7,138,705 115,765 0
2 CHC 1 2007 50 4 6 10 5 122,334 7,432 68,066 415 4,179,094 380,239 789,000 67,159 146,922
2 CHC 1 2008 50 3 6 10 5 104,717 8,337 51,164 455 5,126,924 391,506 828,000 74,164 345,679
2 CHC 1 2009 50 3 6 10 4 135,086 9,653 66,658 519 6,114,623 273,593 1,178,554 75,969 418,986
2 CHC 1 2010 50 3 6 9 5 129,927 8,462 62,736 423 7,684,884 1,030,877 1,880,284 91,146 444,578
2 CHC 1 2011 50 3 6 10 5 99,811 7,686 53,365 394 9,150,620 997,093 3,527,169 93,569 472,040
2 PHC 1 2007 0 1 1 5 1 32,568 606 25,636 298 1,457,416 17,418 332,296 1,074 0
2 PHC 1 2008 0 1 1 6 1 33,216 780 26,463 329 1,641,844 17,779 356,452 1,362 0
2 PHC 1 2009 0 1 1 4 1 36,236 1,097 28,399 273 1,949,900 34,178 134,734 3,486 0
2 PHC 1 2010 0 1 1 5 1 33,617 1,664 26,027 224 3,053,314 26,194 326,440 3,300 0
2 PHC 1 2011 0 1 1 5 1 30,956 1,067 24,514 364 3,798,048 98,215 577,992 58,470 0
2 PHC 2 2007 6 1 1 16 3 72,234 1,220 62,108 50 2,717,842 129,650 332,296 600 2,000
2 PHC 2 2008 6 1 1 15 3 61,869 1,341 50,587 57 3,965,798 132,171 356,452 700 2,100
2 PHC 2 2009 6 2 1 17 3 70,221 1,372 53,508 54 5,695,892 131,287 464,756 750 2,200
2 PHC 2 2010 6 1 1 17 3 81,306 1,828 64,979 60 7,419,416 124,495 766,580 0 248,207
2 PHC 2 2011 6 2 1 17 2 76,741 1,553 63,828 58 7,857,094 133,311 1,154,362 0 356,310
2 CHC 2 2007 40 6 7 10 7 70,636 2,781 49,446 204 3,879,576 145,013 429,000 13,682 11,391
2 CHC 2 2008 40 10 7 10 10 75,370 2,985 52,608 257 4,753,012 208,776 495,000 18,291 15,888
2 CHC 2 2009 40 12 7 10 8 85,811 3,822 64,868 249 5,762,432 167,057 627,616 23,000 25,000
2 CHC 2 2010 40 10 8 9 8 87,902 3,694 66,838 225 7,277,580 318,361 1,007,156 24,891 81,342

5958
FACILITY INFORMATION INPUTS(BEDS&STAFF) OUTPUTS EXPENDITURE
District Platform Facility Year Beds Doctors Nurses Para-medical Non-medical Outpatient Inpatient Vaccinations Births PersonnelInfrastructure+Utilities
Medical supplies+ pharmaceuticals
Administrationandtraining Non-medical
2 CHC 2 2011 40 12 8 9 8 67,240 3,039 57,713 185 8,974,848 327,850 2,314,898 25,495 288,167
2 PHC 3 2007 6 1 1 6 1 37,256 983 3,909 46 1,683,888 83,269 345,555 3,566 255
2 PHC 3 2008 6 1 1 6 1 33,577 1,063 4,038 65 1,714,920 88,129 370,020 27,386 1
2 PHC 3 2009 6 1 1 6 1 31,763 865 4,106 52 2,316,048 87,829 216,967 76,121 1
2 PHC 3 2010 6 1 1 5 1 27,597 1,032 4,153 61 2,879,688 92,220 430,431 110,090 0
2 PHC 3 2011 6 1 1 5 1 18,215 994 3,730 66 3,335,604 96,880 948,834 124,010 0
2 PHC 4 2007 4 3 1 5 0 6,487 166 1,885 12 1,210,572 157,050 58,103 13,316 0
2 PHC 4 2008 4 2 1 7 0 6,612 169 1,610 12 1,957,896 156,625 61,268 23,996 0
2 PHC 4 2009 4 2 1 8 0 8,094 330 1,596 12 3,305,448 160,238 95,602 2,368 0
2 PHC 4 2010 4 2 1 8 0 7,797 380 1,639 15 3,534,516 156,321 172,503 2,845 0
2 PHC 4 2011 4 3 1 7 0 10,355 603 1,606 12 3,930,108 154,936 372,771 3,520 58,820
3 DH 1 2007 250 36 103 51 41 34,888 19,446 2,641 1,786 45,713,992 8,732,327 4,820,512 483,001 1,479,163
3 DH 1 2008 250 35 97 56 43 66,566 18,003 2,686 1,868 50,237,096 9,065,897 4,858,194 1,004,021 1,344,387
3 DH 1 2009 250 34 88 58 49 66,190 17,670 2,639 1,755 55,345,384 8,225,704 4,465,486 1,758,403 2,649,289
3 DH 1 2010 250 36 105 58 46 91,680 21,703 2,296 2,588 67,580,856 8,892,572 3,787,082 1,094,640 3,922,772
3 DH 1 2011 250 49 108 59 48 106,781 21,865 2,290 2,904 73,741,400 9,172,054 6,766,970 852,074 6,541,858
3 AH 1 2007 100 14 28 15 11 74,809 4,900 2,493 885 15,478,292 1,008,589 1,444,909 42,522 262,590
3 AH 1 2008 100 14 29 15 11 73,127 4,495 4,034 702 15,784,310 1,287,233 1,952,389 22,479 265,100
3 AH 1 2009 100 14 29 18 11 69,387 4,361 3,853 503 16,987,894 1,540,722 1,152,646 33,898 283,000
3 AH 1 2010 100 15 30 19 11 75,950 5,338 3,449 367 17,557,652 1,659,052 1,300,921 22,371 397,960
3 AH 1 2011 100 15 30 19 11 69,653 4,875 3,617 516 21,485,638 2,017,294 2,292,742 28,562 535,790
3 CHC 1 2007 50 3 7 11 8 42,376 1,126 734 139 3,342,192 307,226 630,807 27,333 23,330
3 CHC 1 2008 50 7 10 10 7 39,748 1,006 478 263 6,607,524 410,784 825,526 29,565 145,270
3 CHC 1 2009 50 5 11 11 8 50,866 1,956 898 399 6,988,032 368,618 708,541 29,186 343,480
3 CHC 1 2010 50 6 11 11 8 57,057 2,167 1,426 444 8,196,432 325,643 658,729 16,772 333,200
3 CHC 1 2011 50 4 12 12 9 44,102 2,187 1,940 447 12,194,124 442,125 1,121,380 81,868 232,470
3 PHC 1 2007 5 1 1 12 2 15,720 206 539 34 2,642,643 155,341 217,529 12,400 0
3 PHC 1 2008 5 1 1 9 2 16,668 284 434 26 2,830,223 79,516 232,919 94,600 0
3 PHC 1 2009 5 1 1 9 2 19,082 209 414 41 2,894,293 56,240 201,285 280,727 0
3 PHC 1 2010 5 1 1 9 2 21,848 287 402 40 3,818,567 54,803 363,172 249,096 0
3 PHC 1 2011 5 1 1 10 2 26,295 237 390 17 4,519,341 49,941 485,960 410,536 0
3 PHC 2 2007 4 1 1 19 5 36,249 116 556 37 4,786,178 70,020 432,064 8,744 0
3 PHC 2 2008 4 1 1 17 5 43,863 110 574 27 6,719,201 67,090 489,472 32,877 44,400
3 PHC 2 2009 4 1 1 19 6 34,350 151 617 39 7,748,056 50,415 321,600 4,412 0
3 PHC 2 2010 4 1 1 18 5 50,762 494 504 32 9,106,558 38,420 562,136 5,264 80,000
3 PHC 2 2011 4 1 1 19 5 32,852 754 598 29 11,163,012 92,892 850,986 14,331 81,550
3 CHC 2 2007 50 8 11 10 11 107,056 2,958 34,597 638 4,896,102 1,134,202 787,500 300,879 383,570
3 CHC 2 2008 50 8 11 10 11 112,392 4,029 33,557 647 5,554,191 1,109,175 825,000 55,942 354,878
3 CHC 2 2009 50 8 11 10 10 109,917 4,399 35,545 420 6,134,570 1,014,666 877,408 131,217 412,000
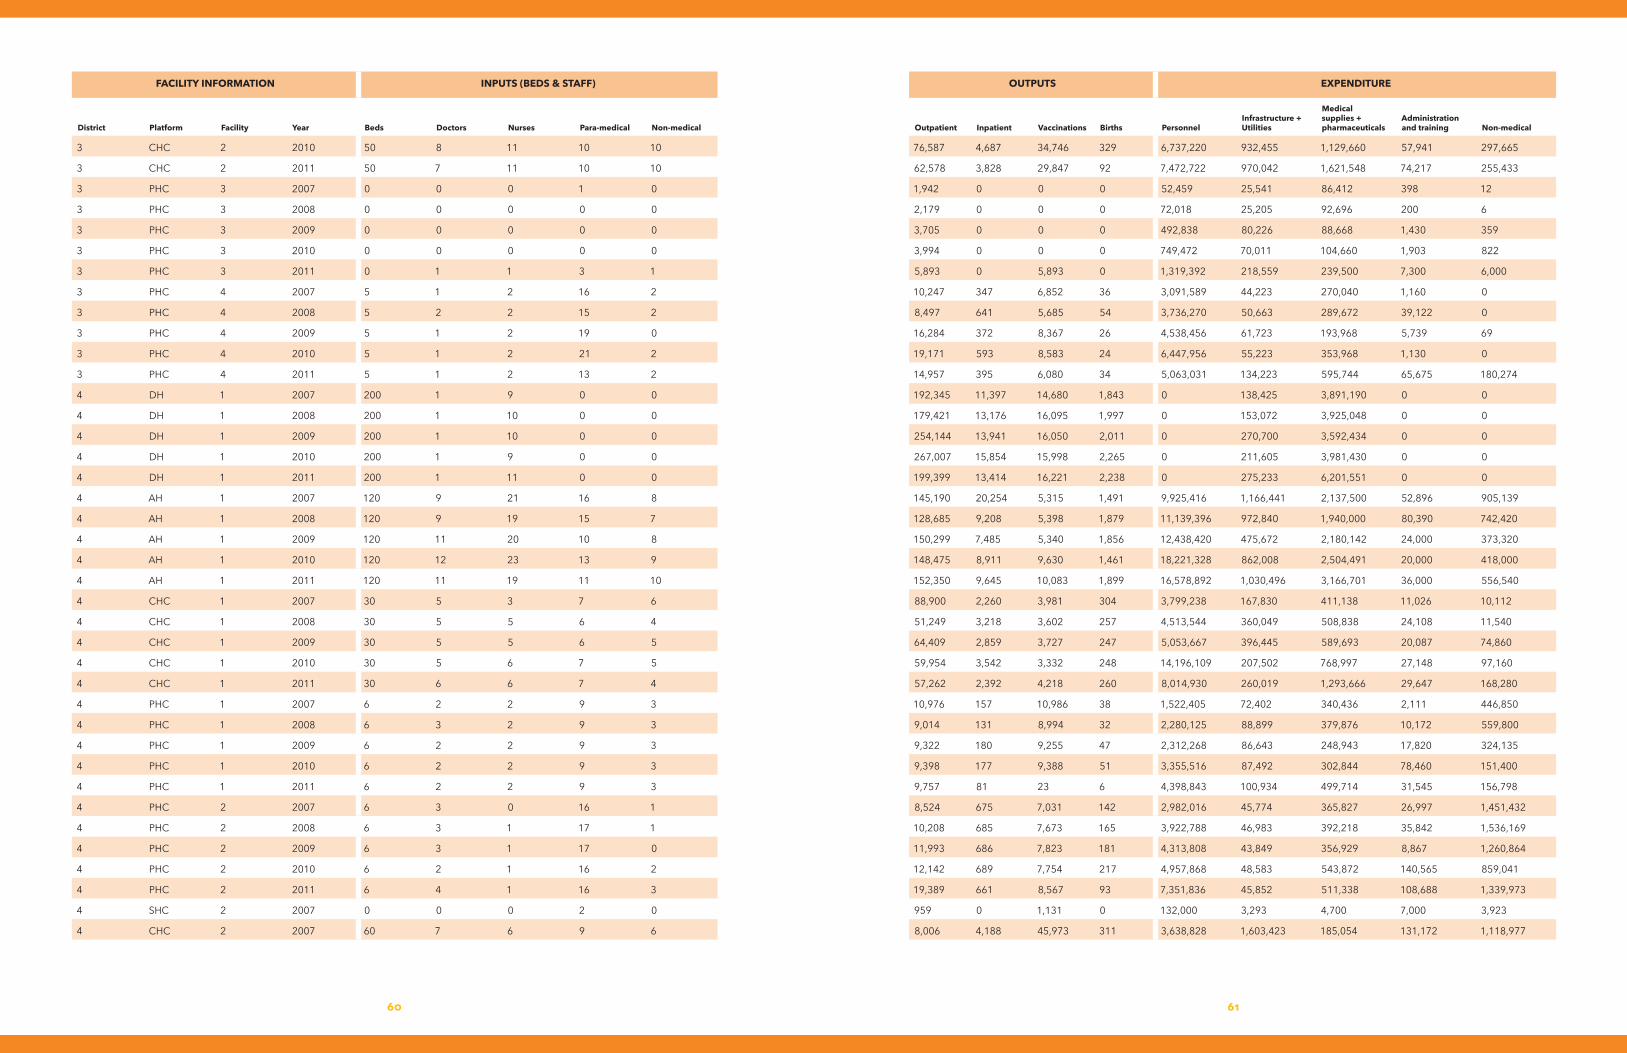
6160
FACILITY INFORMATION INPUTS(BEDS&STAFF) OUTPUTS EXPENDITURE
District Platform Facility Year Beds Doctors Nurses Para-medical Non-medical Outpatient Inpatient Vaccinations Births PersonnelInfrastructure+Utilities
Medical supplies+ pharmaceuticals
Administrationandtraining Non-medical
3 CHC 2 2010 50 8 11 10 10 76,587 4,687 34,746 329 6,737,220 932,455 1,129,660 57,941 297,665
3 CHC 2 2011 50 7 11 10 10 62,578 3,828 29,847 92 7,472,722 970,042 1,621,548 74,217 255,433
3 PHC 3 2007 0 0 0 1 0 1,942 0 0 0 52,459 25,541 86,412 398 12
3 PHC 3 2008 0 0 0 0 0 2,179 0 0 0 72,018 25,205 92,696 200 6
3 PHC 3 2009 0 0 0 0 0 3,705 0 0 0 492,838 80,226 88,668 1,430 359
3 PHC 3 2010 0 0 0 0 0 3,994 0 0 0 749,472 70,011 104,660 1,903 822
3 PHC 3 2011 0 1 1 3 1 5,893 0 5,893 0 1,319,392 218,559 239,500 7,300 6,000
3 PHC 4 2007 5 1 2 16 2 10,247 347 6,852 36 3,091,589 44,223 270,040 1,160 0
3 PHC 4 2008 5 2 2 15 2 8,497 641 5,685 54 3,736,270 50,663 289,672 39,122 0
3 PHC 4 2009 5 1 2 19 0 16,284 372 8,367 26 4,538,456 61,723 193,968 5,739 69
3 PHC 4 2010 5 1 2 21 2 19,171 593 8,583 24 6,447,956 55,223 353,968 1,130 0
3 PHC 4 2011 5 1 2 13 2 14,957 395 6,080 34 5,063,031 134,223 595,744 65,675 180,274
4 DH 1 2007 200 1 9 0 0 192,345 11,397 14,680 1,843 0 138,425 3,891,190 0 0
4 DH 1 2008 200 1 10 0 0 179,421 13,176 16,095 1,997 0 153,072 3,925,048 0 0
4 DH 1 2009 200 1 10 0 0 254,144 13,941 16,050 2,011 0 270,700 3,592,434 0 0
4 DH 1 2010 200 1 9 0 0 267,007 15,854 15,998 2,265 0 211,605 3,981,430 0 0
4 DH 1 2011 200 1 11 0 0 199,399 13,414 16,221 2,238 0 275,233 6,201,551 0 0
4 AH 1 2007 120 9 21 16 8 145,190 20,254 5,315 1,491 9,925,416 1,166,441 2,137,500 52,896 905,139
4 AH 1 2008 120 9 19 15 7 128,685 9,208 5,398 1,879 11,139,396 972,840 1,940,000 80,390 742,420
4 AH 1 2009 120 11 20 10 8 150,299 7,485 5,340 1,856 12,438,420 475,672 2,180,142 24,000 373,320
4 AH 1 2010 120 12 23 13 9 148,475 8,911 9,630 1,461 18,221,328 862,008 2,504,491 20,000 418,000
4 AH 1 2011 120 11 19 11 10 152,350 9,645 10,083 1,899 16,578,892 1,030,496 3,166,701 36,000 556,540
4 CHC 1 2007 30 5 3 7 6 88,900 2,260 3,981 304 3,799,238 167,830 411,138 11,026 10,112
4 CHC 1 2008 30 5 5 6 4 51,249 3,218 3,602 257 4,513,544 360,049 508,838 24,108 11,540
4 CHC 1 2009 30 5 5 6 5 64,409 2,859 3,727 247 5,053,667 396,445 589,693 20,087 74,860
4 CHC 1 2010 30 5 6 7 5 59,954 3,542 3,332 248 14,196,109 207,502 768,997 27,148 97,160
4 CHC 1 2011 30 6 6 7 4 57,262 2,392 4,218 260 8,014,930 260,019 1,293,666 29,647 168,280
4 PHC 1 2007 6 2 2 9 3 10,976 157 10,986 38 1,522,405 72,402 340,436 2,111 446,850
4 PHC 1 2008 6 3 2 9 3 9,014 131 8,994 32 2,280,125 88,899 379,876 10,172 559,800
4 PHC 1 2009 6 2 2 9 3 9,322 180 9,255 47 2,312,268 86,643 248,943 17,820 324,135
4 PHC 1 2010 6 2 2 9 3 9,398 177 9,388 51 3,355,516 87,492 302,844 78,460 151,400
4 PHC 1 2011 6 2 2 9 3 9,757 81 23 6 4,398,843 100,934 499,714 31,545 156,798
4 PHC 2 2007 6 3 0 16 1 8,524 675 7,031 142 2,982,016 45,774 365,827 26,997 1,451,432
4 PHC 2 2008 6 3 1 17 1 10,208 685 7,673 165 3,922,788 46,983 392,218 35,842 1,536,169
4 PHC 2 2009 6 3 1 17 0 11,993 686 7,823 181 4,313,808 43,849 356,929 8,867 1,260,864
4 PHC 2 2010 6 2 1 16 2 12,142 689 7,754 217 4,957,868 48,583 543,872 140,565 859,041
4 PHC 2 2011 6 4 1 16 3 19,389 661 8,567 93 7,351,836 45,852 511,338 108,688 1,339,973
4 SHC 2 2007 0 0 0 2 0 959 0 1,131 0 132,000 3,293 4,700 7,000 3,923
4 CHC 2 2007 60 7 6 9 6 8,006 4,188 45,973 311 3,638,828 1,603,423 185,054 131,172 1,118,977
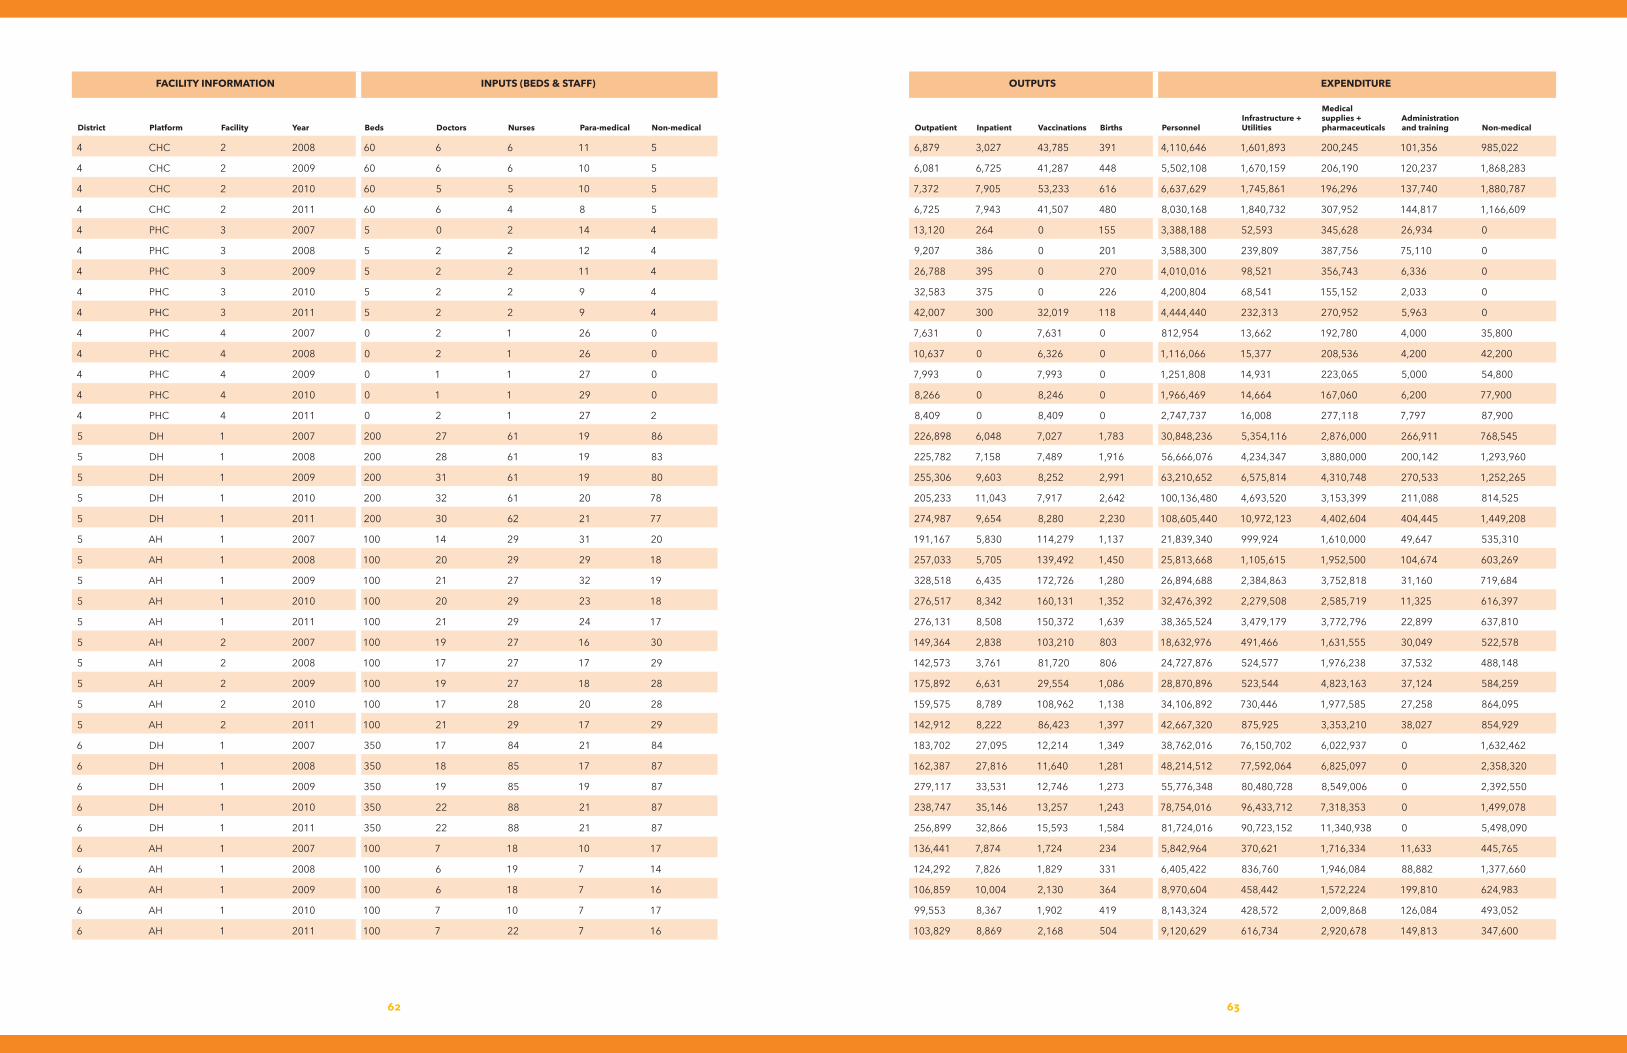
6362
FACILITY INFORMATION INPUTS(BEDS&STAFF) OUTPUTS EXPENDITURE
District Platform Facility Year Beds Doctors Nurses Para-medical Non-medical Outpatient Inpatient Vaccinations Births PersonnelInfrastructure+Utilities
Medical supplies+ pharmaceuticals
Administrationandtraining Non-medical
4 CHC 2 2008 60 6 6 11 5 6,879 3,027 43,785 391 4,110,646 1,601,893 200,245 101,356 985,022
4 CHC 2 2009 60 6 6 10 5 6,081 6,725 41,287 448 5,502,108 1,670,159 206,190 120,237 1,868,283
4 CHC 2 2010 60 5 5 10 5 7,372 7,905 53,233 616 6,637,629 1,745,861 196,296 137,740 1,880,787
4 CHC 2 2011 60 6 4 8 5 6,725 7,943 41,507 480 8,030,168 1,840,732 307,952 144,817 1,166,609
4 PHC 3 2007 5 0 2 14 4 13,120 264 0 155 3,388,188 52,593 345,628 26,934 0
4 PHC 3 2008 5 2 2 12 4 9,207 386 0 201 3,588,300 239,809 387,756 75,110 0
4 PHC 3 2009 5 2 2 11 4 26,788 395 0 270 4,010,016 98,521 356,743 6,336 0
4 PHC 3 2010 5 2 2 9 4 32,583 375 0 226 4,200,804 68,541 155,152 2,033 0
4 PHC 3 2011 5 2 2 9 4 42,007 300 32,019 118 4,444,440 232,313 270,952 5,963 0
4 PHC 4 2007 0 2 1 26 0 7,631 0 7,631 0 812,954 13,662 192,780 4,000 35,800
4 PHC 4 2008 0 2 1 26 0 10,637 0 6,326 0 1,116,066 15,377 208,536 4,200 42,200
4 PHC 4 2009 0 1 1 27 0 7,993 0 7,993 0 1,251,808 14,931 223,065 5,000 54,800
4 PHC 4 2010 0 1 1 29 0 8,266 0 8,246 0 1,966,469 14,664 167,060 6,200 77,900
4 PHC 4 2011 0 2 1 27 2 8,409 0 8,409 0 2,747,737 16,008 277,118 7,797 87,900
5 DH 1 2007 200 27 61 19 86 226,898 6,048 7,027 1,783 30,848,236 5,354,116 2,876,000 266,911 768,545
5 DH 1 2008 200 28 61 19 83 225,782 7,158 7,489 1,916 56,666,076 4,234,347 3,880,000 200,142 1,293,960
5 DH 1 2009 200 31 61 19 80 255,306 9,603 8,252 2,991 63,210,652 6,575,814 4,310,748 270,533 1,252,265
5 DH 1 2010 200 32 61 20 78 205,233 11,043 7,917 2,642 100,136,480 4,693,520 3,153,399 211,088 814,525
5 DH 1 2011 200 30 62 21 77 274,987 9,654 8,280 2,230 108,605,440 10,972,123 4,402,604 404,445 1,449,208
5 AH 1 2007 100 14 29 31 20 191,167 5,830 114,279 1,137 21,839,340 999,924 1,610,000 49,647 535,310
5 AH 1 2008 100 20 29 29 18 257,033 5,705 139,492 1,450 25,813,668 1,105,615 1,952,500 104,674 603,269
5 AH 1 2009 100 21 27 32 19 328,518 6,435 172,726 1,280 26,894,688 2,384,863 3,752,818 31,160 719,684
5 AH 1 2010 100 20 29 23 18 276,517 8,342 160,131 1,352 32,476,392 2,279,508 2,585,719 11,325 616,397
5 AH 1 2011 100 21 29 24 17 276,131 8,508 150,372 1,639 38,365,524 3,479,179 3,772,796 22,899 637,810
5 AH 2 2007 100 19 27 16 30 149,364 2,838 103,210 803 18,632,976 491,466 1,631,555 30,049 522,578
5 AH 2 2008 100 17 27 17 29 142,573 3,761 81,720 806 24,727,876 524,577 1,976,238 37,532 488,148
5 AH 2 2009 100 19 27 18 28 175,892 6,631 29,554 1,086 28,870,896 523,544 4,823,163 37,124 584,259
5 AH 2 2010 100 17 28 20 28 159,575 8,789 108,962 1,138 34,106,892 730,446 1,977,585 27,258 864,095
5 AH 2 2011 100 21 29 17 29 142,912 8,222 86,423 1,397 42,667,320 875,925 3,353,210 38,027 854,929
6 DH 1 2007 350 17 84 21 84 183,702 27,095 12,214 1,349 38,762,016 76,150,702 6,022,937 0 1,632,462
6 DH 1 2008 350 18 85 17 87 162,387 27,816 11,640 1,281 48,214,512 77,592,064 6,825,097 0 2,358,320
6 DH 1 2009 350 19 85 19 87 279,117 33,531 12,746 1,273 55,776,348 80,480,728 8,549,006 0 2,392,550
6 DH 1 2010 350 22 88 21 87 238,747 35,146 13,257 1,243 78,754,016 96,433,712 7,318,353 0 1,499,078
6 DH 1 2011 350 22 88 21 87 256,899 32,866 15,593 1,584 81,724,016 90,723,152 11,340,938 0 5,498,090
6 AH 1 2007 100 7 18 10 17 136,441 7,874 1,724 234 5,842,964 370,621 1,716,334 11,633 445,765
6 AH 1 2008 100 6 19 7 14 124,292 7,826 1,829 331 6,405,422 836,760 1,946,084 88,882 1,377,660
6 AH 1 2009 100 6 18 7 16 106,859 10,004 2,130 364 8,970,604 458,442 1,572,224 199,810 624,983
6 AH 1 2010 100 7 10 7 17 99,553 8,367 1,902 419 8,143,324 428,572 2,009,868 126,084 493,052
6 AH 1 2011 100 7 22 7 16 103,829 8,869 2,168 504 9,120,629 616,734 2,920,678 149,813 347,600
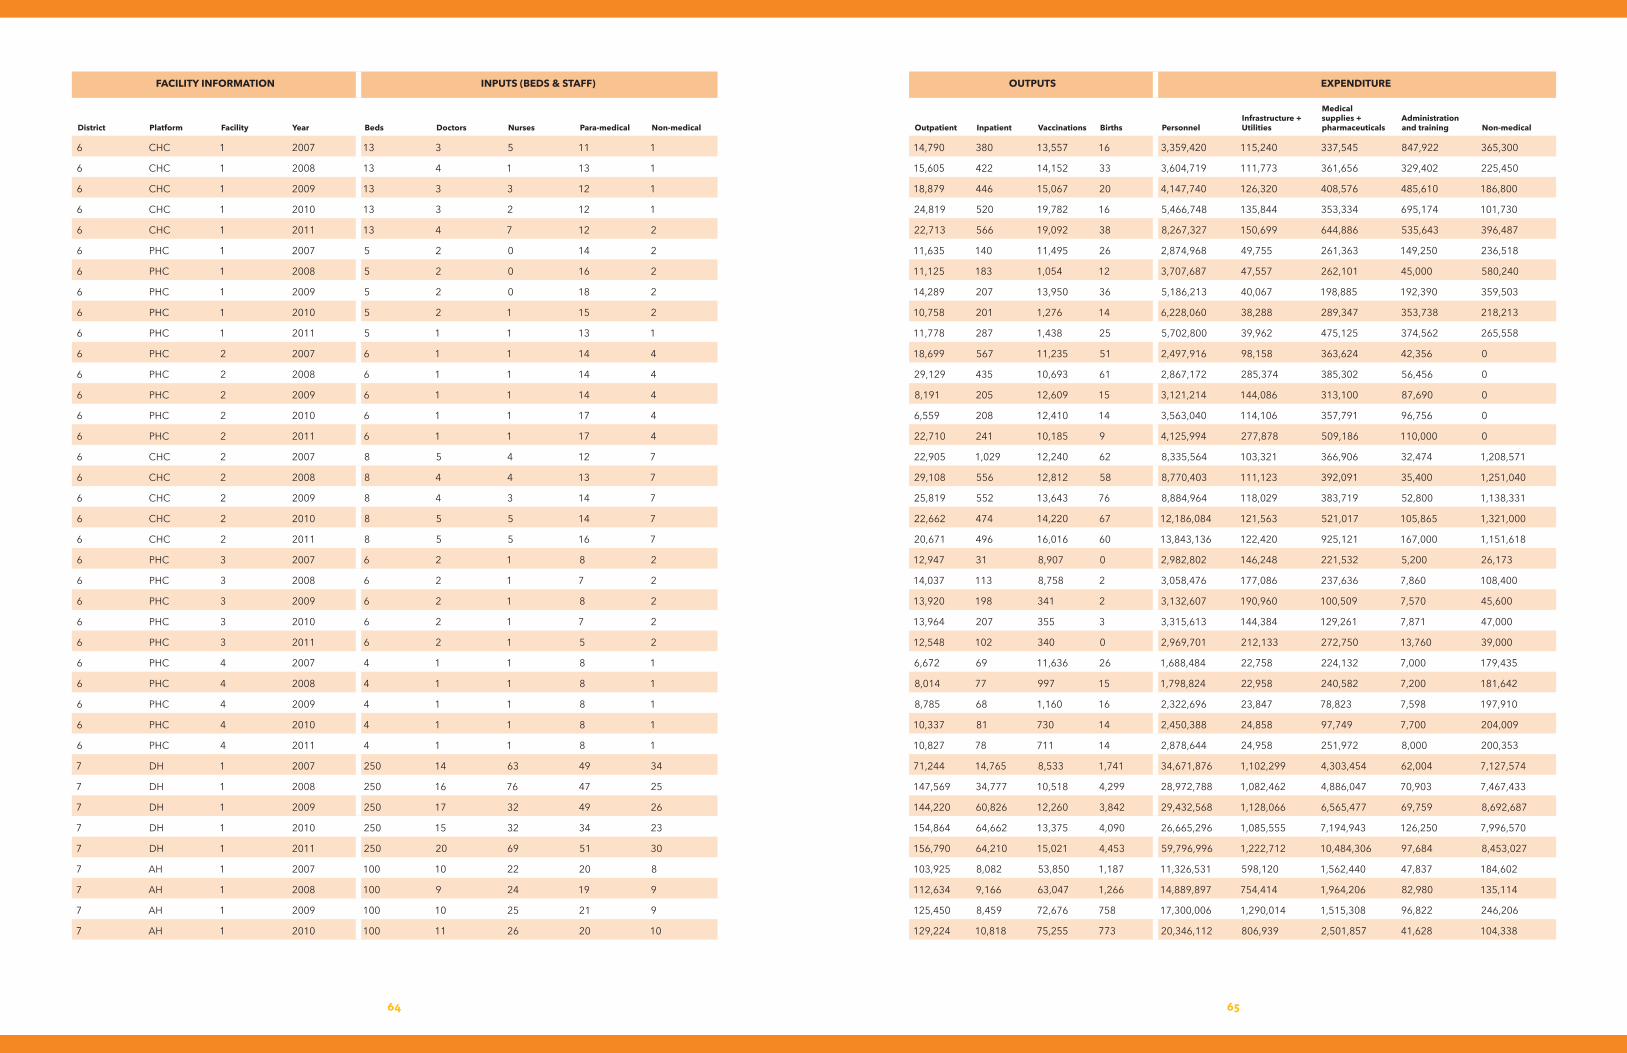
6564
FACILITY INFORMATION INPUTS(BEDS&STAFF) OUTPUTS EXPENDITURE
District Platform Facility Year Beds Doctors Nurses Para-medical Non-medical Outpatient Inpatient Vaccinations Births PersonnelInfrastructure+Utilities
Medical supplies+ pharmaceuticals
Administrationandtraining Non-medical
6 CHC 1 2007 13 3 5 11 1 14,790 380 13,557 16 3,359,420 115,240 337,545 847,922 365,300
6 CHC 1 2008 13 4 1 13 1 15,605 422 14,152 33 3,604,719 111,773 361,656 329,402 225,450
6 CHC 1 2009 13 3 3 12 1 18,879 446 15,067 20 4,147,740 126,320 408,576 485,610 186,800
6 CHC 1 2010 13 3 2 12 1 24,819 520 19,782 16 5,466,748 135,844 353,334 695,174 101,730
6 CHC 1 2011 13 4 7 12 2 22,713 566 19,092 38 8,267,327 150,699 644,886 535,643 396,487
6 PHC 1 2007 5 2 0 14 2 11,635 140 11,495 26 2,874,968 49,755 261,363 149,250 236,518
6 PHC 1 2008 5 2 0 16 2 11,125 183 1,054 12 3,707,687 47,557 262,101 45,000 580,240
6 PHC 1 2009 5 2 0 18 2 14,289 207 13,950 36 5,186,213 40,067 198,885 192,390 359,503
6 PHC 1 2010 5 2 1 15 2 10,758 201 1,276 14 6,228,060 38,288 289,347 353,738 218,213
6 PHC 1 2011 5 1 1 13 1 11,778 287 1,438 25 5,702,800 39,962 475,125 374,562 265,558
6 PHC 2 2007 6 1 1 14 4 18,699 567 11,235 51 2,497,916 98,158 363,624 42,356 0
6 PHC 2 2008 6 1 1 14 4 29,129 435 10,693 61 2,867,172 285,374 385,302 56,456 0
6 PHC 2 2009 6 1 1 14 4 8,191 205 12,609 15 3,121,214 144,086 313,100 87,690 0
6 PHC 2 2010 6 1 1 17 4 6,559 208 12,410 14 3,563,040 114,106 357,791 96,756 0
6 PHC 2 2011 6 1 1 17 4 22,710 241 10,185 9 4,125,994 277,878 509,186 110,000 0
6 CHC 2 2007 8 5 4 12 7 22,905 1,029 12,240 62 8,335,564 103,321 366,906 32,474 1,208,571
6 CHC 2 2008 8 4 4 13 7 29,108 556 12,812 58 8,770,403 111,123 392,091 35,400 1,251,040
6 CHC 2 2009 8 4 3 14 7 25,819 552 13,643 76 8,884,964 118,029 383,719 52,800 1,138,331
6 CHC 2 2010 8 5 5 14 7 22,662 474 14,220 67 12,186,084 121,563 521,017 105,865 1,321,000
6 CHC 2 2011 8 5 5 16 7 20,671 496 16,016 60 13,843,136 122,420 925,121 167,000 1,151,618
6 PHC 3 2007 6 2 1 8 2 12,947 31 8,907 0 2,982,802 146,248 221,532 5,200 26,173
6 PHC 3 2008 6 2 1 7 2 14,037 113 8,758 2 3,058,476 177,086 237,636 7,860 108,400
6 PHC 3 2009 6 2 1 8 2 13,920 198 341 2 3,132,607 190,960 100,509 7,570 45,600
6 PHC 3 2010 6 2 1 7 2 13,964 207 355 3 3,315,613 144,384 129,261 7,871 47,000
6 PHC 3 2011 6 2 1 5 2 12,548 102 340 0 2,969,701 212,133 272,750 13,760 39,000
6 PHC 4 2007 4 1 1 8 1 6,672 69 11,636 26 1,688,484 22,758 224,132 7,000 179,435
6 PHC 4 2008 4 1 1 8 1 8,014 77 997 15 1,798,824 22,958 240,582 7,200 181,642
6 PHC 4 2009 4 1 1 8 1 8,785 68 1,160 16 2,322,696 23,847 78,823 7,598 197,910
6 PHC 4 2010 4 1 1 8 1 10,337 81 730 14 2,450,388 24,858 97,749 7,700 204,009
6 PHC 4 2011 4 1 1 8 1 10,827 78 711 14 2,878,644 24,958 251,972 8,000 200,353
7 DH 1 2007 250 14 63 49 34 71,244 14,765 8,533 1,741 34,671,876 1,102,299 4,303,454 62,004 7,127,574
7 DH 1 2008 250 16 76 47 25 147,569 34,777 10,518 4,299 28,972,788 1,082,462 4,886,047 70,903 7,467,433
7 DH 1 2009 250 17 32 49 26 144,220 60,826 12,260 3,842 29,432,568 1,128,066 6,565,477 69,759 8,692,687
7 DH 1 2010 250 15 32 34 23 154,864 64,662 13,375 4,090 26,665,296 1,085,555 7,194,943 126,250 7,996,570
7 DH 1 2011 250 20 69 51 30 156,790 64,210 15,021 4,453 59,796,996 1,222,712 10,484,306 97,684 8,453,027
7 AH 1 2007 100 10 22 20 8 103,925 8,082 53,850 1,187 11,326,531 598,120 1,562,440 47,837 184,602
7 AH 1 2008 100 9 24 19 9 112,634 9,166 63,047 1,266 14,889,897 754,414 1,964,206 82,980 135,114
7 AH 1 2009 100 10 25 21 9 125,450 8,459 72,676 758 17,300,006 1,290,014 1,515,308 96,822 246,206
7 AH 1 2010 100 11 26 20 10 129,224 10,818 75,255 773 20,346,112 806,939 2,501,857 41,628 104,338
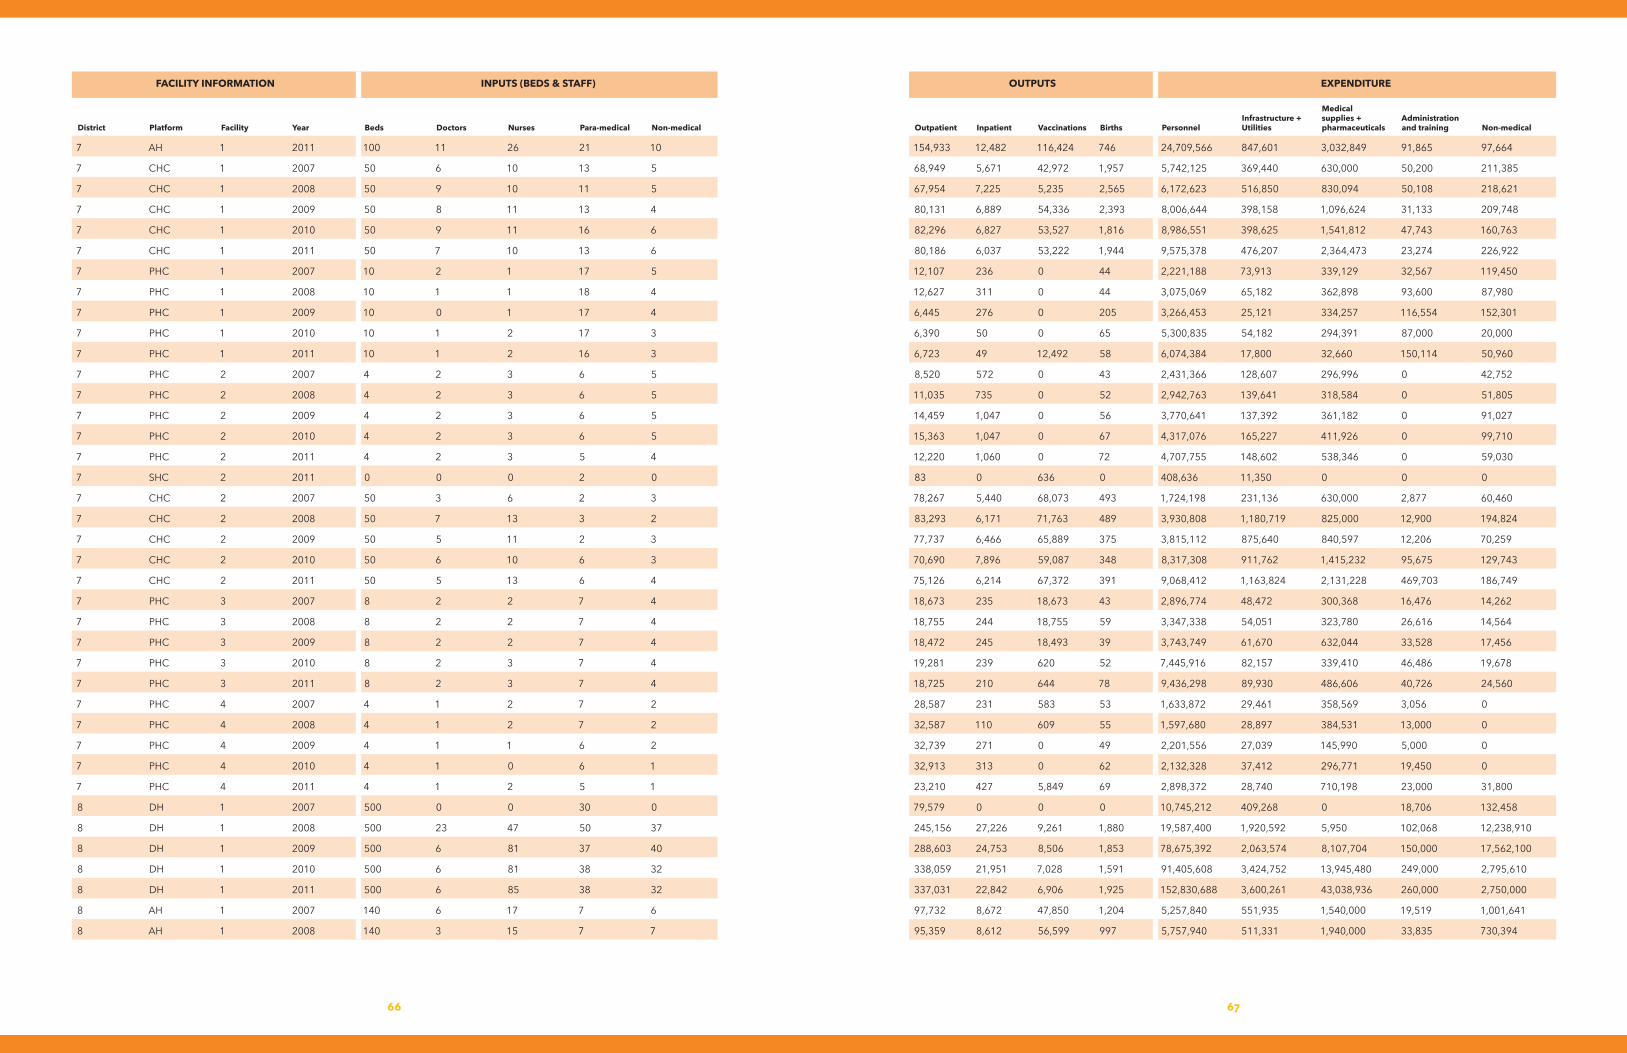
6766
FACILITY INFORMATION INPUTS(BEDS&STAFF) OUTPUTS EXPENDITURE
District Platform Facility Year Beds Doctors Nurses Para-medical Non-medical Outpatient Inpatient Vaccinations Births PersonnelInfrastructure+Utilities
Medical supplies+ pharmaceuticals
Administrationandtraining Non-medical
7 AH 1 2011 100 11 26 21 10 154,933 12,482 116,424 746 24,709,566 847,601 3,032,849 91,865 97,664
7 CHC 1 2007 50 6 10 13 5 68,949 5,671 42,972 1,957 5,742,125 369,440 630,000 50,200 211,385
7 CHC 1 2008 50 9 10 11 5 67,954 7,225 5,235 2,565 6,172,623 516,850 830,094 50,108 218,621
7 CHC 1 2009 50 8 11 13 4 80,131 6,889 54,336 2,393 8,006,644 398,158 1,096,624 31,133 209,748
7 CHC 1 2010 50 9 11 16 6 82,296 6,827 53,527 1,816 8,986,551 398,625 1,541,812 47,743 160,763
7 CHC 1 2011 50 7 10 13 6 80,186 6,037 53,222 1,944 9,575,378 476,207 2,364,473 23,274 226,922
7 PHC 1 2007 10 2 1 17 5 12,107 236 0 44 2,221,188 73,913 339,129 32,567 119,450
7 PHC 1 2008 10 1 1 18 4 12,627 311 0 44 3,075,069 65,182 362,898 93,600 87,980
7 PHC 1 2009 10 0 1 17 4 6,445 276 0 205 3,266,453 25,121 334,257 116,554 152,301
7 PHC 1 2010 10 1 2 17 3 6,390 50 0 65 5,300,835 54,182 294,391 87,000 20,000
7 PHC 1 2011 10 1 2 16 3 6,723 49 12,492 58 6,074,384 17,800 32,660 150,114 50,960
7 PHC 2 2007 4 2 3 6 5 8,520 572 0 43 2,431,366 128,607 296,996 0 42,752
7 PHC 2 2008 4 2 3 6 5 11,035 735 0 52 2,942,763 139,641 318,584 0 51,805
7 PHC 2 2009 4 2 3 6 5 14,459 1,047 0 56 3,770,641 137,392 361,182 0 91,027
7 PHC 2 2010 4 2 3 6 5 15,363 1,047 0 67 4,317,076 165,227 411,926 0 99,710
7 PHC 2 2011 4 2 3 5 4 12,220 1,060 0 72 4,707,755 148,602 538,346 0 59,030
7 SHC 2 2011 0 0 0 2 0 83 0 636 0 408,636 11,350 0 0 0
7 CHC 2 2007 50 3 6 2 3 78,267 5,440 68,073 493 1,724,198 231,136 630,000 2,877 60,460
7 CHC 2 2008 50 7 13 3 2 83,293 6,171 71,763 489 3,930,808 1,180,719 825,000 12,900 194,824
7 CHC 2 2009 50 5 11 2 3 77,737 6,466 65,889 375 3,815,112 875,640 840,597 12,206 70,259
7 CHC 2 2010 50 6 10 6 3 70,690 7,896 59,087 348 8,317,308 911,762 1,415,232 95,675 129,743
7 CHC 2 2011 50 5 13 6 4 75,126 6,214 67,372 391 9,068,412 1,163,824 2,131,228 469,703 186,749
7 PHC 3 2007 8 2 2 7 4 18,673 235 18,673 43 2,896,774 48,472 300,368 16,476 14,262
7 PHC 3 2008 8 2 2 7 4 18,755 244 18,755 59 3,347,338 54,051 323,780 26,616 14,564
7 PHC 3 2009 8 2 2 7 4 18,472 245 18,493 39 3,743,749 61,670 632,044 33,528 17,456
7 PHC 3 2010 8 2 3 7 4 19,281 239 620 52 7,445,916 82,157 339,410 46,486 19,678
7 PHC 3 2011 8 2 3 7 4 18,725 210 644 78 9,436,298 89,930 486,606 40,726 24,560
7 PHC 4 2007 4 1 2 7 2 28,587 231 583 53 1,633,872 29,461 358,569 3,056 0
7 PHC 4 2008 4 1 2 7 2 32,587 110 609 55 1,597,680 28,897 384,531 13,000 0
7 PHC 4 2009 4 1 1 6 2 32,739 271 0 49 2,201,556 27,039 145,990 5,000 0
7 PHC 4 2010 4 1 0 6 1 32,913 313 0 62 2,132,328 37,412 296,771 19,450 0
7 PHC 4 2011 4 1 2 5 1 23,210 427 5,849 69 2,898,372 28,740 710,198 23,000 31,800
8 DH 1 2007 500 0 0 30 0 79,579 0 0 0 10,745,212 409,268 0 18,706 132,458
8 DH 1 2008 500 23 47 50 37 245,156 27,226 9,261 1,880 19,587,400 1,920,592 5,950 102,068 12,238,910
8 DH 1 2009 500 6 81 37 40 288,603 24,753 8,506 1,853 78,675,392 2,063,574 8,107,704 150,000 17,562,100
8 DH 1 2010 500 6 81 38 32 338,059 21,951 7,028 1,591 91,405,608 3,424,752 13,945,480 249,000 2,795,610
8 DH 1 2011 500 6 85 38 32 337,031 22,842 6,906 1,925 152,830,688 3,600,261 43,038,936 260,000 2,750,000
8 AH 1 2007 140 6 17 7 6 97,732 8,672 47,850 1,204 5,257,840 551,935 1,540,000 19,519 1,001,641
8 AH 1 2008 140 3 15 7 7 95,359 8,612 56,599 997 5,757,940 511,331 1,940,000 33,835 730,394

6968
FACILITY INFORMATION INPUTS(BEDS&STAFF) OUTPUTS EXPENDITURE
District Platform Facility Year Beds Doctors Nurses Para-medical Non-medical Outpatient Inpatient Vaccinations Births PersonnelInfrastructure+Utilities
Medical supplies+ pharmaceuticals
Administrationandtraining Non-medical
8 AH 1 2009 140 7 13 4 3 88,415 8,718 54,986 916 7,864,382 592,941 2,686,093 76,269 756,997
8 AH 1 2010 140 6 14 4 2 97,841 11,912 74,813 1,386 9,503,596 824,004 2,057,392 53,232 772,477
8 AH 1 2011 140 6 12 4 2 92,987 9,739 57,910 1,583 7,768,393 898,333 4,830,641 130,590 691,034
8 CHC 1 2007 50 4 3 5 4 6,388 2,269 25,861 32 4,041,740 208,995 630,000 67,758 136,580
8 CHC 1 2008 50 5 2 5 4 6,066 2,553 21,957 80 4,091,184 193,669 825,000 31,446 51,230
8 CHC 1 2009 50 6 2 5 4 4,323 3,190 27,797 196 4,541,983 765,771 960,131 53,773 209,254
8 CHC 1 2010 50 7 12 5 4 7,532 4,075 28,583 350 5,137,211 257,338 942,124 35,386 87,303
8 CHC 1 2011 50 8 11 5 4 9,410 3,987 33,036 97 6,108,626 337,222 2,016,007 32,084 163,390
8 PHC 1 2007 4 1 2 7 1 28,904 128 14,942 128 2,839,327 28,865 221,532 169,303 23,450
8 PHC 1 2008 4 1 2 7 1 28,871 84 14,983 85 2,512,207 158,401 237,636 109,983 29,050
8 PHC 1 2009 4 1 2 7 1 21,479 64 15,294 64 3,433,418 18,169 186,192 124,936 47,000
8 PHC 1 2010 4 1 1 7 1 21,413 115 18,522 115 4,187,743 27,769 127,866 118,777 47,350
8 PHC 1 2011 4 1 2 7 1 25,691 134 22,345 134 4,859,387 18,419 295,370 22,548 54,700
8 PHC 2 2007 4 2 1 13 4 34,578 1,680 16,908 240 2,725,798 90,407 319,372 20,156 221,961
8 PHC 2 2008 4 2 1 13 4 34,019 1,356 17,058 255 3,047,795 97,021 366,429 13,612 384,225
8 PHC 2 2009 4 2 1 14 4 34,409 1,449 17,065 243 3,775,428 85,921 252,752 15,220 436,660
8 PHC 2 2010 4 2 1 13 5 36,407 1,812 17,661 250 4,199,527 93,454 235,139 21,800 304,440
8 PHC 2 2011 4 2 1 14 5 42,815 2,282 18,632 234 4,964,395 101,107 501,959 33,021 347,785
8 CHC 2 2007 60 8 12 13 11 143,140 4,416 61,373 30 6,379,424 357,537 835,890 141,745 248,953
8 CHC 2 2008 60 6 13 15 10 145,114 3,985 67,075 12 6,489,356 312,444 1,018,641 156,901 162,720
8 CHC 2 2009 60 6 14 16 9 141,236 4,899 62,060 44 6,511,316 329,323 1,386,651 289,628 280,832
8 CHC 2 2010 60 7 15 15 9 106,682 6,344 54,238 69 10,265,867 387,664 1,329,424 240,675 365,360
8 CHC 2 2011 60 5 16 16 9 99,058 4,492 54,079 135 8,779,498 357,942 2,719,005 243,005 361,364
8 PHC 3 2007 6 1 1 11 3 16,179 169 9,808 51 4,398,120 103,598 258,557 9,370 907
8 PHC 3 2008 6 3 1 11 3 15,096 196 9,788 49 5,664,780 116,754 274,718 3,115 1,500
8 PHC 3 2009 6 3 1 10 4 21,179 244 9,658 64 5,886,506 120,647 195,109 9,045 2,660
8 PHC 3 2010 6 3 1 10 4 27,035 429 9,499 49 6,268,373 122,812 330,532 7,294 2,917
8 PHC 3 2011 6 2 1 10 4 25,771 470 10,135 45 6,380,490 106,796 634,272 7,170 4,000
8 PHC 4 2007 4 2 1 16 2 14,509 311 9,202 162 1,950,058 129,049 256,631 0 495,241
8 PHC 4 2008 4 2 1 15 2 10,122 336 10,186 162 1,963,678 149,837 275,723 0 614,212
8 PHC 4 2009 4 2 1 15 2 9,710 247 10,469 60 2,146,776 142,447 217,737 0 865,010
8 PHC 4 2010 4 2 1 16 3 9,346 201 10,020 38 3,741,444 252,087 413,374 79,050 164,322
8 PHC 4 2011 4 2 1 13 3 11,581 181 10,089 29 2,877,470 123,976 797,114 0 29,900
9 AH 1 2007 135 15 27 15 27 152,952 18,372 36,703 693 55,562,156 432,314 1,765,709 46,438 503,638
9 AH 1 2008 135 15 28 17 31 133,512 19,392 37,274 420 57,904,828 364,970 1,963,448 33,307 819,660
9 AH 1 2009 135 16 26 15 21 139,071 18,844 13,080 592 65,824,040 1,302,591 2,112,095 27,298 1,362,512
9 AH 1 2010 135 15 31 21 21 140,807 23,208 13,722 779 77,921,680 931,348 3,014,077 49,931 1,482,457
9 AH 1 2011 135 16 31 21 21 138,259 20,845 13,971 284 91,644,776 471,073 5,006,899 10,867 674,048
9 CHC 1 2007 30 4 7 3 4 39,468 7,725 960 547 214,185 205,169 583,536 0 0

7170
FACILITY INFORMATION INPUTS(BEDS&STAFF) OUTPUTS EXPENDITURE
District Platform Facility Year Beds Doctors Nurses Para-medical Non-medical Outpatient Inpatient Vaccinations Births PersonnelInfrastructure+Utilities
Medical supplies+ pharmaceuticals
Administrationandtraining Non-medical
9 CHC 1 2008 30 3 8 3 4 58,080 8,019 1,084 542 197,831 129,069 626,020 0 0
9 CHC 1 2009 30 4 8 2 4 66,815 9,092 1,145 588 184,100 153,170 368,215 0 0
9 CHC 1 2010 30 4 8 3 3 75,829 8,647 1,382 690 318,446 169,206 204,339 0 0
9 CHC 1 2011 30 4 9 4 5 85,158 11,390 2,484 883 821,934 242,954 469,695 0 0
9 PHC 1 2007 4 2 1 11 2 12,995 181 0 27 2,001,472 40,325 432,363 1,603 263,945
9 PHC 1 2008 4 2 1 10 2 13,843 178 0 31 2,181,499 42,790 464,334 1,540 335,830
9 PHC 1 2009 4 2 1 11 2 14,190 159 0 36 2,547,474 37,317 287,390 2,040 356,905
9 PHC 1 2010 4 2 1 10 2 15,049 153 0 36 2,882,732 34,986 211,084 2,142 428,135
9 PHC 1 2011 4 2 1 8 2 16,143 152 0 33 3,159,328 40,710 399,519 2,100 451,353
9 DH 1 2007 100 16 29 29 15 88,803 12,122 16,529 684 11,386,780 913,218 1,758,768 1,067,660 271,416
9 DH 1 2008 100 16 29 29 17 96,189 13,664 13,007 793 12,880,815 523,095 1,974,133 325,167 338,460
9 DH 1 2009 100 16 29 29 17 95,184 15,355 16,990 789 14,149,755 1,714,244 1,754,404 565,290 512,889
9 DH 1 2010 100 21 33 28 18 88,411 14,585 17,722 996 16,153,901 1,167,475 2,877,621 470,518 360,349
9 DH 1 2011 100 21 33 28 18 83,470 13,814 13,123 1,836 20,210,028 1,364,331 4,008,601 882,848 117,055
9 CHC 2 2007 13 7 6 11 2 46,083 1,947 37,751 0 1,846,044 242,286 424,500 41,250 58,300
9 CHC 2 2008 13 7 6 14 2 45,038 2,160 39,619 0 3,088,452 189,388 535,000 49,324 56,120
9 CHC 2 2009 13 8 6 16 2 45,031 2,412 36,262 0 4,669,836 145,461 616,415 7,833 53,520
9 CHC 2 2010 13 8 6 16 2 45,363 3,821 36,577 0 4,755,528 268,477 744,784 3,193 99,951
9 CHC 2 2011 13 6 6 16 2 54,296 4,892 35,352 0 5,980,471 229,971 966,610 2,225 99,140
9 DH 1 2007 100 12 20 45 13 97,288 20,544 5,574 1,815 21,790,288 828,692 1,943,579 51,989 438,498
9 PHC 2 2007 0 2 5 13 2 41,420 453 9,437 0 1,321,990 109,752 598,975 437 0
9 PHC 2 2008 0 2 5 13 2 41,915 463 8,993 0 1,328,510 110,962 638,967 137 0
9 PHC 2 2009 0 2 5 13 2 40,547 405 9,758 0 1,526,013 108,067 442,285 2,551 0
9 PHC 2 2010 0 2 5 15 2 39,877 598 10,265 0 1,817,018 110,292 600,146 3,075 190,600
9 PHC 2 2011 0 2 5 14 2 35,746 752 10,329 0 2,025,678 115,179 515,196 5,000 0
9 PHC 3 2007 10 2 1 8 5 4,990 952 13,580 93 2,666,724 161,884 529,188 19,340 18,117
9 PHC 3 2008 10 2 1 8 4 5,007 540 13,033 72 3,349,584 199,010 563,035 21,920 20,345
9 PHC 3 2009 10 2 1 7 4 4,651 645 13,360 57 3,930,320 218,947 454,258 23,042 39,116
9 PHC 3 2010 10 2 1 9 3 4,550 563 13,818 57 4,558,500 292,787 349,792 28,848 48,751
9 PHC 3 2011 10 2 1 8 4 4,604 635 14,561 62 5,711,260 352,435 480,563 32,600 55,904
9 PHC 4 2007 4 1 1 10 2 12,206 794 12,206 66 2,192,370 70,944 344,821 0 0
9 PHC 4 2008 4 1 1 11 2 13,714 397 538 74 2,741,372 74,271 369,743 0 0
9 PHC 4 2009 4 1 1 11 2 13,450 435 13,450 35 3,107,470 77,386 151,755 0 0
9 PHC 4 2010 4 2 1 10 2 11,752 757 12,883 59 3,042,108 62,806 347,257 0 74,989
9 PHC 4 2011 4 2 1 10 3 12,041 770 402 43 3,078,179 124,803 447,065 0 287


INSTITUTE FOR HEALTH METRICS AND EVALUATION2301 Fifth Ave., Suite 600Seattle, WA 98121USA
TELEPHONE: +1-206-897-2800FAX: +1-206-897-2899EMAIL: [email protected]
CCESS,OTTLENECKS,OSTS, ANDQUITY
A B CE
PUBLIC HEALTH FOUNDATION OF INDIAPlot 47, Sector 44Gurugram, National Capital Region 122002India
TELEPHONE: +91 124 478 1400FAX: +91 124 478 1601EMAIL: [email protected]