Embed Size (px)
Citation preview

Asia Pacific Journal of Research
ISSN (Print): 2320-5504
ISSN (Online): 2347-4793
www.apjor.com Vol: I. Issue LIII, July2017 139
ASSESMENT OF SERVICE QUALITY IN ETHIOPIAN BANKS (BASED
ONSERVQUAL MODEL): EVIDENCE FROM HAWASSA AND YIRGALEM.
Asegid Getachew (MBA), Lecturer
Hawassa University, College of Business and Economics
Asegid Getachew, Hawassa University
Faculty of Business and Economics, P.O. Box 15, Yirgalem, Ethiopia
ABSTRACT
Service quality measurement has been the main focus of service marketing literature since the development of the famous multiple –
item scale measure of customer perception of service quality in the late 1980’s. A number of researchers have studied the issues in
various organizational setting and have come up with an important finding which have added new theoretical insight .This research in
this regard is was initiated to investigate the issue in the context of the Ethiopian Banking industry.
The research made use of measurement instrument developed by Parasuraman, etal.(1988) to assess the distribution and profile of
service quality dimensions among a selected number of bank customers in Hawassa and Yirgalem. The finding of the research
indicated that there exists a negative gap in customer’s expectation and perception of the quality of service. The findings further
indicated that the negative gap between expectation and perception is quite significant in private banks. The findings of the study will
be informative for bank managers who strive to devise strategies of providing excellent service to their customers by taking in to
account the dynamics of expectation and perception of their customers.
Keywords: Quality, Service Quality, Service Quality Dimensions.
1. INTRODUCTION
In today’s competitive and dynamic business environment the survival and continued growth of organizations is determined by the
level of completive strength that they manage to develop. In this regard as Parasuraman et al., (1988).state intensifying competition
and rapid deregulation have led many service and retail businesses to seek profitable ways to differentiate themselves. And one
strategy as Rudie and Wansley(1985 cited in Bhattacharjee 2010 ) indicate , that has been related to success in these businesses is the
delivery of high service quality. Hence, service quality measurement and improvement is one of the most significant strategic tools for
enhancing efficiency and business growth( Bhattacharjee 2010).
In the service industry, successful companies need more than just a competitive advantage in customer service. They need to have
unwavering loyalty from their customers. The key to providing superior service is to understand and respond to customer expectations.
This is because customers compare perceptions to expectations when judging the quality of a firm’s service offering (Parasuraman et
al., 1988).
Further as Saghier and Nathan (2013) set forth consumers all over the world have become more quality conscious; therefore
customers‟ requirements for higher quality service have been increased. Service sector such as the banks are obliged to provide
excellent services to their customers in order to have sustainable competitive advantage.

Asia Pacific Journal of Research
ISSN (Print): 2320-5504
ISSN (Online): 2347-4793
www.apjor.com Vol: I. Issue LIII, July2017 140
Banks play an important and active role in the financial and economic development of a country. An effective banking system greatly
influences the growth of a country in the various sector of the economy. Players in the banking industry face a large number of
complex challenges in the global marketplace. In this regard it is crucial for banks to understand changing customer needs and adopt
the latest information technology system in order to compete more effectively with global organization (Malhorta and Mukherjee,
2004)
As Afrinn (2012) puts it, the banking industry has been increasingly integrated in recent years. Liberalization and deregulation of the
financial sector, coupled with rapid technological advancement and improved communication systems, have contributed to the
integration process. As a result banks now are faced with intense competition. In today’s fast- paced and increasingly competitive
market the bottom line of a firm’s marketing strategy and tactic is to make profit and contribute to the growth of the company.
In the context of Ethiopia the financial sector in general and the banking sector in particular has been showing a remarkable shift.
From 1991 onwards, with the adoption of a new economic system the country has seen the emergence a number of private banks.
These banks, have since then been aggressively expanding throughout the country. Although, banks in Ethiopia, as the findings of
Eshete, etal (2012) suggest are characterized by moderate level of competition, the need to have a competitive edge that will help in
differentiating service delivered to customers is of a paramount importance. Better quality of services provided by banks has a positive
influence on satisfaction of its customers and it directly contributes to profitability of banking industry (Ilyasetal, 2013 ) . And to this
effect, these banks need to understand the dynamics of service quality in the context of the customers they are serving. This paper can,
in this regard, be considered as an initial attempt to investigate the nature of service quality in Ethiopian banks.
1.1 Problem statement
Davi and Ramburuth (2012) , assert that today’s marketing environment is characterized by increased rivalry and changes in many
other macroeconomic variables. One of this is increased competition and it goes without saying that one of the drivers of business
success is having a unique competitive advantage.
As Rahamanetal., ( 2011) assert, quality is the keyword for survival of organizations in the global economy. Organizations are
undergoing a shift from a production-led philosophy to a customer-focused approach. Competitiveness of a firm in the post-liberalized
era is determined by the way it delivers customer service. And in this regard, service quality is an approach to manage business
processes in order to ensure full satisfaction of the customers which will help to increase competitiveness and effectiveness of the
industry. Quality in service is very important especially for the growth and development of service sector business enterprises (Powell,
1995 cited in Rahamanetal., 2011). Therefore, to remain competitive and to excel in the market service delivering firms like banks
need to have a service strategy that takes in to account the expectation and perception of customers.
The concept of service quality ( which is based on the SERVQUAL model developed by Parasuraman, etal 1988) has been studied and
investigated in the banking industry of various countries : The Mauritanian Banking Sector ( Davi and Ramburuth 2012), Hong Kong
Bangink industry (Lau etal.2013), Thecase of commercial Banks in Pengan, Maleysia ( Appananetal., 2013), Banks in Egypt (Saghier
and Nathan 2012), Private commercial banks in Bangladesh ( Rahamanetal., 2011). The case of Commercial banks in Ghana
(Oyetunjietal., 2014)
The service quality model applied in all the above settings measures service quality based the result obtained by analyzing the level of
expectation and perception that customers experience in the service delivery process. And Strauss and Mang( 1999) put, the cultural
interaction between customers and service providers during service encounters might lead to different interpretations, perceptions and
evaluations toward the service performance in the minds of both the customers and the service provider.
Thus as, Winsted (1997a, 1997b cited in Strauss and Mang1999 ), there is hardly any prior discussion about the fact that customers
with different cultural backgrounds may have different expectations toward service encounters and that they may perceive these
situations differently.
The above as a background, the main aim of this paper was to investigate service quality in light of service expectation and perception
of bank customers in Ethiopia. To this effect the research addressed the following questions:
What is the profile of service quality dimensions among bank customers in Ethiopia?
Is there a difference in the distribution of these dimensions between customers of public and private banks?
Is there a variation in service quality dimensions among bank customers due to age differences?
Is there a variation in service quality dimensions among bank customers due to gender differences?
Is there a variation in service quality dimensions among bank customers due to differences in income levels?

Asia Pacific Journal of Research
ISSN (Print): 2320-5504
ISSN (Online): 2347-4793
www.apjor.com Vol: I. Issue LIII, July2017 141
1.2 Theoretical Framework
The conception of Service Quality
The term quality as the originators of the concept (Juran 1974 and Crosby 1979) discuss is quite an elusive concept which describes
conformance to customer requirements. While the substance and determinants of quality may be undefined, its importance to firms
and consumers is unequivocal (Parasuraman ,etal 1985).
Service quality, as opposed to goods quality, is very difficult to operationalize and measure due to the very heterogeneity, perishability
and intangibility of service. There has been a continued research on the definition, modeling, measurement, data collection procedure,
data analysis etc., issues of service quality, leading to development of sound base for the researchers. This documented knowledge
base through several studies on the subject can be of great use to researchers and practitioners in providing a direction on how to
explore/modify the existing service quality concepts with the changing world scenario (shift from conventional personalized services
to web enabled services). (Seth 2004)
Two most popular model of service quality have been considered as seminal and influential in the service quality literature. The fist
model is the one developed by Parasuraman et al. (1985) .the Model goes by the name SERVQUAl ( also termed as Anglo-Saxion
model ). And the one associated with Gronroos (1990) is referred to as NORDIC model of service quality.
The most well-known model is the model of Parasuraman et al. (1985) which is widely utilized in the literature. The model attempts to
show the salient activities of the service organization that influence the perception of quality. Moreover, the model shows the
interaction between these activities and identifies the linkages between the key activities of the service organization or marketer which
are pertinent to the delivery of a satisfactory level of service quality.
Parasuraman et al. (1985) proposed that service quality is a function of the differences between expectation and performance along the
quality dimensions. They developed a service quality model (Figure 1) based on gap analysis. These gaps as Shahin andSamea( 2010)
discuss have the following elements
Gap 1: Customer expectation-management gap. This gap addresses the difference between consumers’ expectations and
management’s perceptions of service quality.
Gap 2: Management perception-service quality specifications gap. This gap addresses the difference between management’s
perceptions of consumer’s expectations and service quality specifications, i.e. improper service-quality standards.
Gap 3: Service quality specification-service delivery gap. This gap addresses the difference between service quality
specifications and service actually delivered, i.e. the service performance gap.
Gap 4: Service delivery-external communication gap. This gap addresses the difference between service delivery and the
communications to consumers about service delivery, i.e. whether promises match delivery.
Gap 5: Expected service-perceived service gap. This gap addresses the difference between consumer’s expectation and
perceived service. This gap depends on size and direction of the four gaps associated with the delivery of service quality on
the marketer’s side.

Asia Pacific Journal of Research
ISSN (Print): 2320-5504
ISSN (Online): 2347-4793
www.apjor.com Vol: I. Issue LIII, July2017 142
Figure 1 Service Quality gaps.
In the Nordic model of service quality, popularised by ChristiaanGrönroos(1990) total perceived service quality is the outcome of an
evaluation process where the customer compares context specific expectations of quality with the experienced quality. The
expectations of quality are context specific to the firm under consideration and not based on the total class of service providers, as is
the case in the Anglo-Saxon model. The expected service is influenced by the marketing activities of the service provider and external
influences, such as word-of-mouth, corporate image and customer needs.
In the Nordic model, the outcome of the service and the process of service delivery are both recognized as forming part of the
experienced quality.
Figure 2The Nordic Model

Asia Pacific Journal of Research
ISSN (Print): 2320-5504
ISSN (Online): 2347-4793
www.apjor.com Vol: I. Issue LIII, July2017 143
Measurement of Service quality
Service quality, although very difficult to operationalize, is in most situations measured by the five dimensions and their
corresponding twenty two elements developed by Parasuraman et al. (1985)
1. Tangibles. Physical facilities, equipment’s and appearance of personnel.
2. Reliability. Ability to perform the promised service dependably and accurately.
3. Responsiveness. Willingness to help customers and provide prompt service.
4. Assurance (including competence, courtesy, credibility and security). Knowledge and courtesy of employees and their ability
to inspire trust and confidence.
5. Empathy (including access, communication, understanding the customer). Caring and individualizedattention that the firm
provides to its customers.
2 MATERIALS AND METHODS
2.1 Description of the study area and subjects
Subjects participating in the research were customers of private banks residing in Hawassa and Yirgalem, both of which are fond in
the Southern Nations Nationalities and Peoples Regional State (SNNPRS). The former being capital of the region and the latter a
major town in Dale Wroreda. Currently the branches of at least nine commercial (Private and Public) banks are operating in the
selected study areas.
2.2 Study design
The participant of the study were selected using a non-probability convenience method of sampling. The method is selected because it
gives the researcher the freedom to select respondents who are relevant for the study.
The total number of respondents for the study is determined using a sample size determination formula developed by Krejcie and
Morgan (1970). Since the target population for the research is infinite, a total of 384 ( which is taken from the sample size table
developed by Krejcie and Morgan (1970) ) respondents were planned to be considered sufficient for the study. However only 100
questioners were completed and returned form the respondents ,corresponding to a response rate of 26%
2.3 Study methodology
The instrument used in collecting data for the study was a questionnaire having two parts. The first part of the questionnaire was ued
to collect data related to some, basic background variable like age , gender , income level , etc. The second and major part of the
questionnaire related specifically to the focal concept of the study, Service quality. To measure service quality the study made use of a
multiple-item scale for measuring consumers’ perception of service quality (alias SERVQUAL).
This measurement scale was initially developed by parasuraman, Zeithaml, and Berry (1988) and was latter refined by the same
authors parasuraman, Berry, and Zeithaml (1991) . The scale has been considered as a standard for measuring service quality
throughout the service marketing literature. In its original form, SERVQUAL contains 22 pairs Likert scale statements structured
around five service quality dimensions in order to measure service quality (Cronin and Taylor, 1992 cited in Safakli 2007).
Each statement appears twice. One measures customer expectations of a particular service industry. The other measures the perceived
level of service provided by an individual organization in that industry. The 22 pairs of statements are designed to fit into the five
dimensions of service quality. A seven-point scale ranging from “strongly agree” (7) to “strongly disagree” (1) accompanies each
statement. The “strongly agree” end of scale is designed to correlate with high expectations and high perceptions. Service quality
occurs when expectations are met (or exceeded) and a service gap materializes if expectations are not met. The gap score for each
statement is calculated as the perception score minus the expectation score. A positive gap score implies that expectation have been
met or exceeded and a negative score implies that expectations are not being met. Gap scores can be analyzed for each individual
statement and can be aggregated to give an overall gap score for each dimension (Parasuraman at al., 1988).
2.4 Data management and analysis
The data obtained by distributing questionnaires to the selected professionals was analyzed with the help of SPSS for windows. In this
regard descriptive, correlation and inferential statistics will be used to manipulate the variables of the research. A simple comparison
of the mean results of service quality expectation and perception of customers for each attribute was made to asses’ service quality.
The strength of association between each attribute, the major dimensions of service quality and selected background variables was
measured using correlation analysis.

Asia Pacific Journal of Research
ISSN (Print): 2320-5504
ISSN (Online): 2347-4793
www.apjor.com Vol: I. Issue LIII, July2017 144
3 Results and Discussions
The following section presents the results obtained after the analysis of data using different statistical techniques.
Table 1 Background Information
Sex
Frequency Percent
Male 73 73
Female 27 27
Total 100 100
Marital status Frequency Percent
MARRIED 40 40
UNMARRIED 60 60
Total 100 100
Academic level
Frequency Percent
B.A 77 77
MA/MBA/MSC 22 22
Total 99 99
Total 100 100
Salary category
Frequency Percent
Below 2450 25 25
2451-3450 26 26
3450-5500 26 26
5500-8000 22 22
Total 100 100
Client
Frequency Percent
Government 88 88
Private 11 11
Total 100 100
As the data in Table 1. Indicates the respondents of the research are predominantly (73%) male and the remaining 27% female. And of
the total respondents 60% are single and 41 married. With regards to educational level 77 % of the respondents have a BA degree and
22 MSc /MBA. 95.5% of the respondents are within the age of 18-65 and the rest 5% are above the age of 65. 25% of the respondent
earn a monthly income of less than Br. 2500 , 26% of the respondents lie within a monthly income range of 2,451-5,500 Br. And 22%
of the respondents earn a monthly income greater than 8,000 .Majority of the respondent (88% 0 are currently clients of government
banks and the remaining 22% are affiliated with private banks.
3.1 Service quality Gap for each dimension

Asia Pacific Journal of Research
ISSN (Print): 2320-5504
ISSN (Online): 2347-4793
www.apjor.com Vol: I. Issue LIII, July2017 145
Tangibles D
imen
sio
ns
Items
Perception Expectation Difference
Individua
l MEAN
Group
MEAN
Individual
MEAN
Group
MEA
N
Individual
MEAN
Group
MEAN
Ta
ng
ibles
1) Banks should have modern looking
equipment. . 3.86
4.48
-0.62
2) The physical facilities at Banks
should be visually appealing 3.66 4.30 -0.64
3) Employees at Banks should be neat
appearing 3.96 4.05 -0.09
4) Material and information
associated with the service should
be visually appealing. 3.64 3.78 4.28 4.28 -0.64 -0.499
Tangibles basically indicate the appearance of the physical facilities of banks, the physical appearance of employees and the
attractiveness of materials and information to the customer. As the service quality gap analysis in the above table indicates, all items
measuring perception and expectation of customers have a negative gap. The highest gap relates to item “ no 4” and item no”2”
relating to the appalling perception that customers have experienced regarding the physical facilities and materials and information’s
associated with the service they received.
Table 2 Dimension Reliability
Dim
ensio
ns Items
Perception Expectation Difference
Individual
MEAN
Group
MEAN
Individual
MEAN
Group
MEAN
Individual
MEAN
Group
MEAN
Rel
iab
ilit
y.
1) When the Bank promise to do
something by a certain time, it
does so. 3.50
5.14
-1.64
2) When a customer has a problem,
the Banks’s staff are
sympathetic and reassuring. 3.56 4.27 -0.71
3) The Bank performs the service
right the first time. 3.56 4.25 -0.69
4) The Bank provides the service
at the time it promises to do so. 3.57 3.92 -0.35
5) The Bank keeps its records
accurately 4.00 3.638 4.05 4.33 -0.05 -0.689
The reliability item basically explains the timing with which service is performed ,the level of sympathy and reassurance that staffs of
the bank show to customer , the impression that customers have regarding their first encounter , whether service is done as promised
Asia Pacific Journal of Research
ISSN (Print): 2320-5504
ISSN (Online): 2347-4793
www.apjor.com Vol: I. Issue LIII, July2017 146
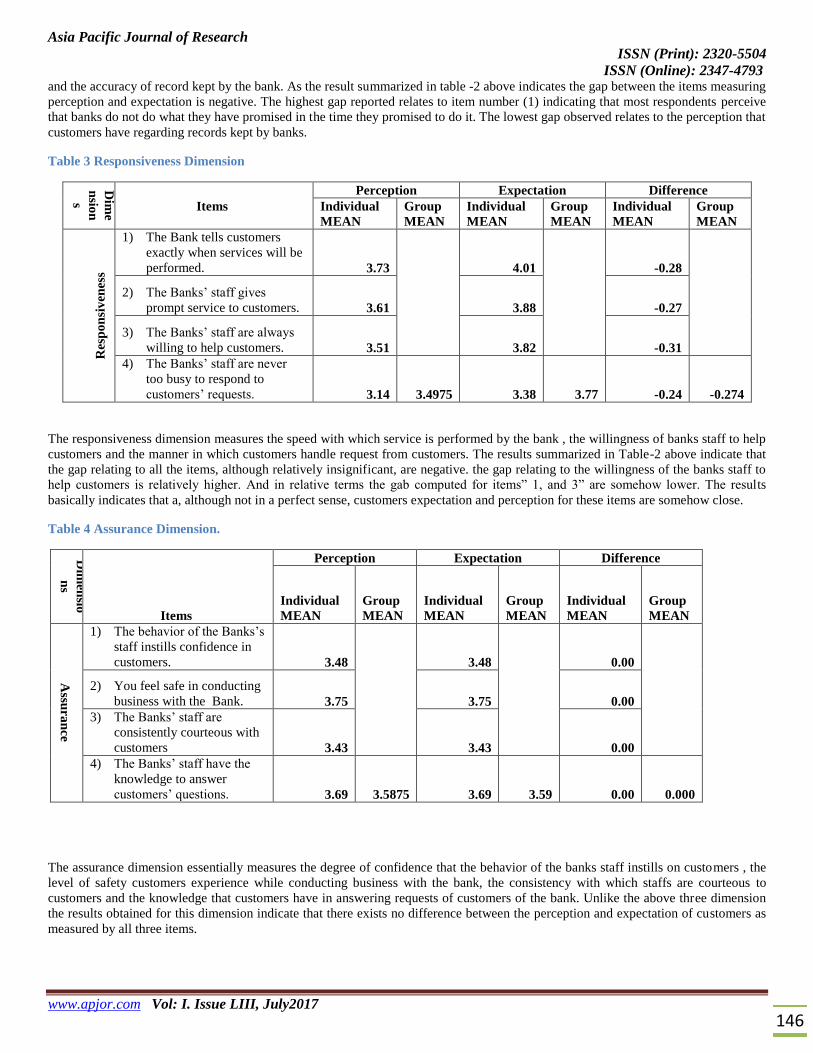
and the accuracy of record kept by the bank. As the result summarized in table -2 above indicates the gap between the items measuring
perception and expectation is negative. The highest gap reported relates to item number (1) indicating that most respondents perceive
that banks do not do what they have promised in the time they promised to do it. The lowest gap observed relates to the perception that
customers have regarding records kept by banks.
Table 3 Responsiveness Dimension
Dim
e
nsio
n
s Items
Perception Expectation Difference
Individual
MEAN
Group
MEAN
Individual
MEAN
Group
MEAN
Individual
MEAN
Group
MEAN
Res
po
nsi
ven
ess
1) The Bank tells customers
exactly when services will be
performed. 3.73
4.01
-0.28
2) The Banks’ staff gives
prompt service to customers. 3.61 3.88 -0.27
3) The Banks’ staff are always
willing to help customers. 3.51 3.82 -0.31
4) The Banks’ staff are never
too busy to respond to
customers’ requests. 3.14 3.4975 3.38 3.77 -0.24 -0.274
The responsiveness dimension measures the speed with which service is performed by the bank , the willingness of banks staff to help
customers and the manner in which customers handle request from customers. The results summarized in Table-2 above indicate that
the gap relating to all the items, although relatively insignificant, are negative. the gap relating to the willingness of the banks staff to
help customers is relatively higher. And in relative terms the gab computed for items” 1, and 3” are somehow lower. The results
basically indicates that a, although not in a perfect sense, customers expectation and perception for these items are somehow close.
Table 4 Assurance Dimension.
Dim
ensio
ns
Items
Perception Expectation Difference
Individual
MEAN
Group
MEAN
Individual
MEAN
Group
MEAN
Individual
MEAN
Group
MEAN
Assu
ran
ce
1) The behavior of the Banks’s
staff instills confidence in
customers. 3.48
3.48
0.00
2) You feel safe in conducting
business with the Bank. 3.75 3.75 0.00
3) The Banks’ staff are
consistently courteous with
customers 3.43 3.43 0.00
4) The Banks’ staff have the
knowledge to answer
customers’ questions. 3.69 3.5875 3.69 3.59 0.00 0.000
The assurance dimension essentially measures the degree of confidence that the behavior of the banks staff instills on customers , the
level of safety customers experience while conducting business with the bank, the consistency with which staffs are courteous to
customers and the knowledge that customers have in answering requests of customers of the bank. Unlike the above three dimension
the results obtained for this dimension indicate that there exists no difference between the perception and expectation of customers as
measured by all three items.
Asia Pacific Journal of Research
ISSN (Print): 2320-5504
ISSN (Online): 2347-4793
www.apjor.com Vol: I. Issue LIII, July2017 147
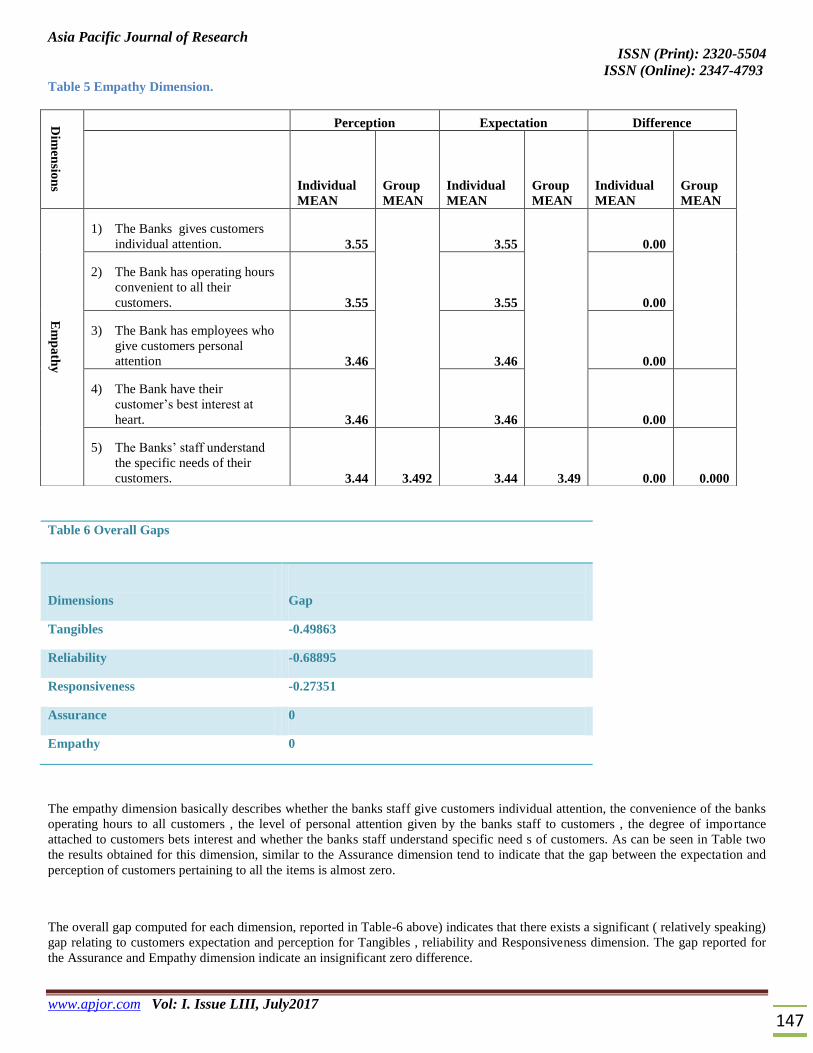
Table 5 Empathy Dimension.
The empathy dimension basically describes whether the banks staff give customers individual attention, the convenience of the banks
operating hours to all customers , the level of personal attention given by the banks staff to customers , the degree of importance
attached to customers bets interest and whether the banks staff understand specific need s of customers. As can be seen in Table two
the results obtained for this dimension, similar to the Assurance dimension tend to indicate that the gap between the expectation and
perception of customers pertaining to all the items is almost zero.
The overall gap computed for each dimension, reported in Table-6 above) indicates that there exists a significant ( relatively speaking)
gap relating to customers expectation and perception for Tangibles , reliability and Responsiveness dimension. The gap reported for
the Assurance and Empathy dimension indicate an insignificant zero difference.
Dim
ensio
ns
Perception Expectation Difference
Individual
MEAN
Group
MEAN
Individual
MEAN
Group
MEAN
Individual
MEAN
Group
MEAN
Em
pa
thy
1) The Banks gives customers
individual attention. 3.55
3.55
0.00
2) The Bank has operating hours
convenient to all their
customers. 3.55 3.55 0.00
3) The Bank has employees who
give customers personal
attention 3.46 3.46 0.00
4) The Bank have their
customer’s best interest at
heart. 3.46 3.46 0.00
5) The Banks’ staff understand
the specific needs of their
customers. 3.44 3.492 3.44 3.49 0.00 0.000
Table 6 Overall Gaps
Dimensions
Gap
Tangibles -0.49863
Reliability -0.68895
Responsiveness -0.27351
Assurance 0
Empathy 0
Asia Pacific Journal of Research
ISSN (Print): 2320-5504
ISSN (Online): 2347-4793
www.apjor.com Vol: I. Issue LIII, July2017 148
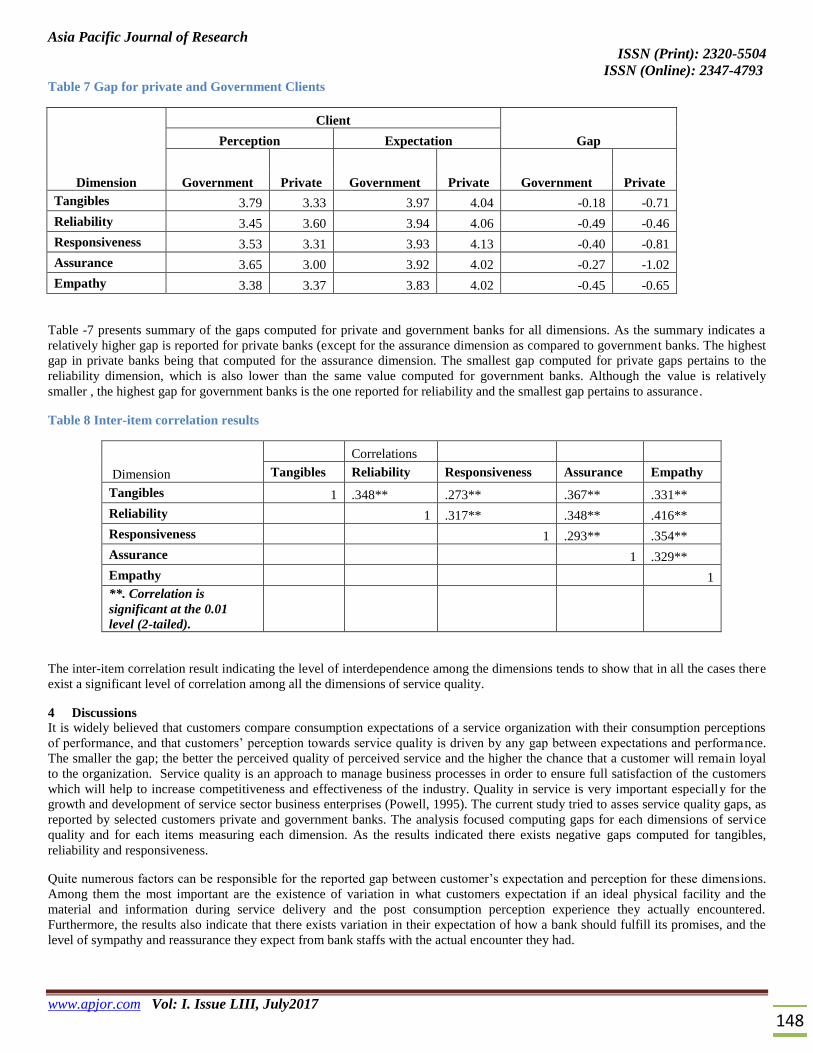
Table 7 Gap for private and Government Clients
Dimension
Client
Gap Perception Expectation
Government Private Government Private Government Private
Tangibles 3.79 3.33 3.97 4.04 -0.18 -0.71
Reliability 3.45 3.60 3.94 4.06 -0.49 -0.46
Responsiveness 3.53 3.31 3.93 4.13 -0.40 -0.81
Assurance 3.65 3.00 3.92 4.02 -0.27 -1.02
Empathy 3.38 3.37 3.83 4.02 -0.45 -0.65
Table -7 presents summary of the gaps computed for private and government banks for all dimensions. As the summary indicates a
relatively higher gap is reported for private banks (except for the assurance dimension as compared to government banks. The highest
gap in private banks being that computed for the assurance dimension. The smallest gap computed for private gaps pertains to the
reliability dimension, which is also lower than the same value computed for government banks. Although the value is relatively
smaller , the highest gap for government banks is the one reported for reliability and the smallest gap pertains to assurance.
Table 8 Inter-item correlation results
Dimension
Correlations
Tangibles Reliability Responsiveness Assurance Empathy
Tangibles 1 .348** .273** .367** .331**
Reliability 1 .317** .348** .416**
Responsiveness 1 .293** .354**
Assurance 1 .329**
Empathy
1
**. Correlation is
significant at the 0.01
level (2-tailed).
The inter-item correlation result indicating the level of interdependence among the dimensions tends to show that in all the cases there
exist a significant level of correlation among all the dimensions of service quality.
4 Discussions
It is widely believed that customers compare consumption expectations of a service organization with their consumption perceptions
of performance, and that customers’ perception towards service quality is driven by any gap between expectations and performance.
The smaller the gap; the better the perceived quality of perceived service and the higher the chance that a customer will remain loyal
to the organization. Service quality is an approach to manage business processes in order to ensure full satisfaction of the customers
which will help to increase competitiveness and effectiveness of the industry. Quality in service is very important especially for the
growth and development of service sector business enterprises (Powell, 1995). The current study tried to asses service quality gaps, as
reported by selected customers private and government banks. The analysis focused computing gaps for each dimensions of service
quality and for each items measuring each dimension. As the results indicated there exists negative gaps computed for tangibles,
reliability and responsiveness.
Quite numerous factors can be responsible for the reported gap between customer’s expectation and perception for these dimensions.
Among them the most important are the existence of variation in what customers expectation if an ideal physical facility and the
material and information during service delivery and the post consumption perception experience they actually encountered.
Furthermore, the results also indicate that there exists variation in their expectation of how a bank should fulfill its promises, and the
level of sympathy and reassurance they expect from bank staffs with the actual encounter they had.

Asia Pacific Journal of Research
ISSN (Print): 2320-5504
ISSN (Online): 2347-4793
www.apjor.com Vol: I. Issue LIII, July2017 149
Last but not least results computed indicate the existence of negative deviation with regards to customers expectation of getting prior
information regarding timing of service delivery, the speed with which service is performed and the willingness of banks staff to help
them. However, the results obtained for the assurance and empathy dimensions showed no deviation between expectation and
perception. The result somehow indicates that customers feel confidence and safety transacting with the banks and that they believe
that banks staff have the requisite knowledge to cater to their requests. The other important implication of these result is that there is a
match between customers expectation and perception regarding the individual attention they receive from banks, the convenience of
operating hours and the value given to their special interest.
The study has also tried to assess service quality gaps from the perspective of government and private bank customers. The results
obtained differ from the aggregate result discussed for each dimension. To this effect, the results indicate that government banks are
better in handling expectation of their customers. The results computed for checking inter-item correlation if the individual dimensions
indicated the existence of significant positive interdependence among them, implying that the management of service quality cannot
be effective unless it considers the interplay among the five dimensions.
5 Conclusion and Implication for future Research.
During the past few decades service quality has become a major area of attention topractitioners, managers and researchers owing to
its strong impact on business performance, lower costs, customer satisfaction, customer loyalty and profitability Seth,Netal P (2004).
The current study mainly focused on assessing the service quality gaps observed in selected commercial banks (Government and
Private) in Ethiopia, and as Saghier E,N., Nathan ,D(2013) state SERVQUAL appears to be a reliable scale to measure banking
service quality, and provide a useful diagnostic role to play in assessing and monitoring service quality in banks. To this end, the study
used SERVQUAL to assess existing service quality expectation and perception gaps. the results of the study have tremendous
implications for both organizational practice and future research’s planned to be undertaken in the area.
Banks have to understand the changing needs of customers, their aspirations and expectations to create value. Banks should also have
a strong customer relationship management system that would indicate the worth of the customer and be able to understand his needs
while interacting with him, so as to cross sell their products. The study most of all is very important for management of Banks who
must continuously devise strategies on how to excel by attracting more customers and making these customers more loyal. To
compete in the existing market by providing quality service to customers banks need to primarily understand the dynamics of
customers’ expectations and perception.
SERVQUAL is the most valuable when it is used periodically to track service quality trends , and when it is used in conjunction with
other forms of service quality measurement. Parasuramanetal (1988). To this effect although the results of the current research are an
important input in revealing the reality regarding service quality in banks it cannot by itself be considered as a definitive answer to the
probls of service quality.
The results of the study confirm to the findings of Parasuramanetal( 1991) that indicates SERVQUAL dimension represent five
conceptually distinct facets of service quality which are very interrelated. This has a critical message to practice as it entails the fact
that management of service quality can only be effective if n=managers recognize the interaction among the elemnts defining quality.
The current study only tried to show the existing gap in service quality. So future research is required to relate the issue with important
variables such as overall service quality, customer retention and loyalty and customer satisfaction.
6 References
A. Ananth,A. Ramesh R. and B. Prabahara (2011)” Service quality gap analysis in private sector bank - a customer perspective
“ Indian Journal of Commerce & Management Studies Vol–II , Issue -1 January 2011
B. Afrin, T.(2012), Quality of customer service in the banking sector of Bangladesh: An Explorative study,East West Jouranl of
Business and Social studies, Vol 3.
C. Bhattacharjee, P.K ,2010,Service Quality Measurement with Minimum Attributes (SERVQUAL-MA) Technique Upgrade
by Human Resource Development, International Journal of Innovation, Management and Technology, Vol. 1, No. 3
D. Appanan, S. Doraisamy, B. &Hui, T.X. (2013), Cutomer perception on service quality of Commercial Banks: A case study in
Penang, Malaysia, Academic Research International,4(5),459-468
E. Eshete, Z.S., Teshome, K.W., &Abebe, T.K., (2013), Competition in Ethiopian Banking Industry, African Journal of
Economics, 1(5), 176-190
F. Illyas, A., Nasir, H. Malik, M.R., Mirza U.E., Munir, S.,&Sajid, A., Assessing the service quality of Banks using
SERVQUAL model, Interdisciplinary Journal of contemporary Research in Business, 4(11),390-400.

Asia Pacific Journal of Research
ISSN (Print): 2320-5504
ISSN (Online): 2347-4793
www.apjor.com Vol: I. Issue LIII, July2017 150
G. Krejcie, R. V., & Morgan, D. W. 1970. Determining sample size for research activities. Educational andPsychological
Measurement, Vol 30, pp. 607-610.
H. Lau, M. M., Cheung, R., Lam, C. Y. & Chu, T. Y. 2013. Measuring quality in the banking industry: A Hong Kong based
study .Contemporary Management Research, 9(3), 262-282.
I. Devi, R.V, &Ramburuth, K.S. (2012),Assesing Service Quality in the Mauritanian Banking Sector, Prestige International
Journal of Mangemnt,1(1), 115-126.
J. Malhotra, N. & Mukherjee, A. (2004). The relative influence of organizational commitment and job satisfaction on service
quality of customer-contact employees in banking call centres. Journal of Services Marketing, 18 (3), 162-174.
K. Micuda, D. &Cruceru, E.(ND), Testing SERVQUAL dimensions on the Romanian Banking Sector, Proceedings of the
International Conference on RISK MANAGEMENT, ASSESSMENT and MITIGATION, pp329-334
L. Oyetunji, E.O, Baguri, B.B ,& Otis, A.E(2014), Comparison of service quality of two commercial banks in upper east region
of Ghana, Proceedings of the 2014 International Conference on Industrial Engineering and Operations Management Bali,
Indonesia, January 7 – 9, 2014,pp7.782-792
M. Parasuraman, A., Zeithaml, V.A. & Berry, L.L. (1988). SERVQUAL: a multiple-item scale for
N. measuring consumer perceptions of service quality. Journal of Retailing, 64, 12-40
O. Rahaman, M. M, Abdullah, M. &Rahaman, A.(2011), Measuring Service quality using SERVQUAL model: A study on
PCBs( Private commercial Banks in Bangledesh, Business Management Dynamics, 1(1),01-11.
P. Safakli, O.V,(2007), Measuring service quality of commercial banks towards SMEs in Nortern Cyprus, Jouranl of Yasar
University,2(8),827-839
Q. Saghier, N.E, Nathan, D.(2013), Service quality dimensions and customers’ satisfaction of banks in Egypt, Proceedings of
20th International Business Research Conference 4 - 5 April 2013, Dubai, UAE, pp.1-13
R. Seth,N ,. Deshmukh, G. S, and Vrat, P (2004), Service quality models: a review International Journal of Quality & Reliability
Management Vol. 22 No. 9, 2005 pp. 913-949
S. Straus, B. Mang, P.,(1999),”culture shocks” in intercultural service encounters?, Journal of Service Marketing,13(4/5),329-
346.
T. Wayne, S. J., Shore, L. M., &Liden, R. C. (1997). Perceived organizational support and leader-member exchange: A social
exchange perspective. Academy of Management Journal, 40(1), 82–111.
U. Shahin.A and Samea.M (2010)” Developing the Models of Service Quality Gaps: A Critical
V. Discussion “ Journal of Business Management and Strategy Vol. 1, No. 1: E2
W. Yamazakia1. Y, Petchdee ,S ,(2015) , Turnover Intention, Organizational Commitment, and Specific Job Satisfaction among
Production Employees in Thailand, Journal of Business and Management Volume 4, Issue 4
X. Zeithaml VA., Berry, LL., Parasuraman, A., (1993) ,The Nature and Determinants of Consumer
Y. Expectations of Service, Journal of the Academy of Marketing Science, Vol 21
Asia Pacific Journal of Research
ISSN (Print): 2320-5504
ISSN (Online): 2347-4793
www.apjor.com Vol: I. Issue LIII, July2017 151
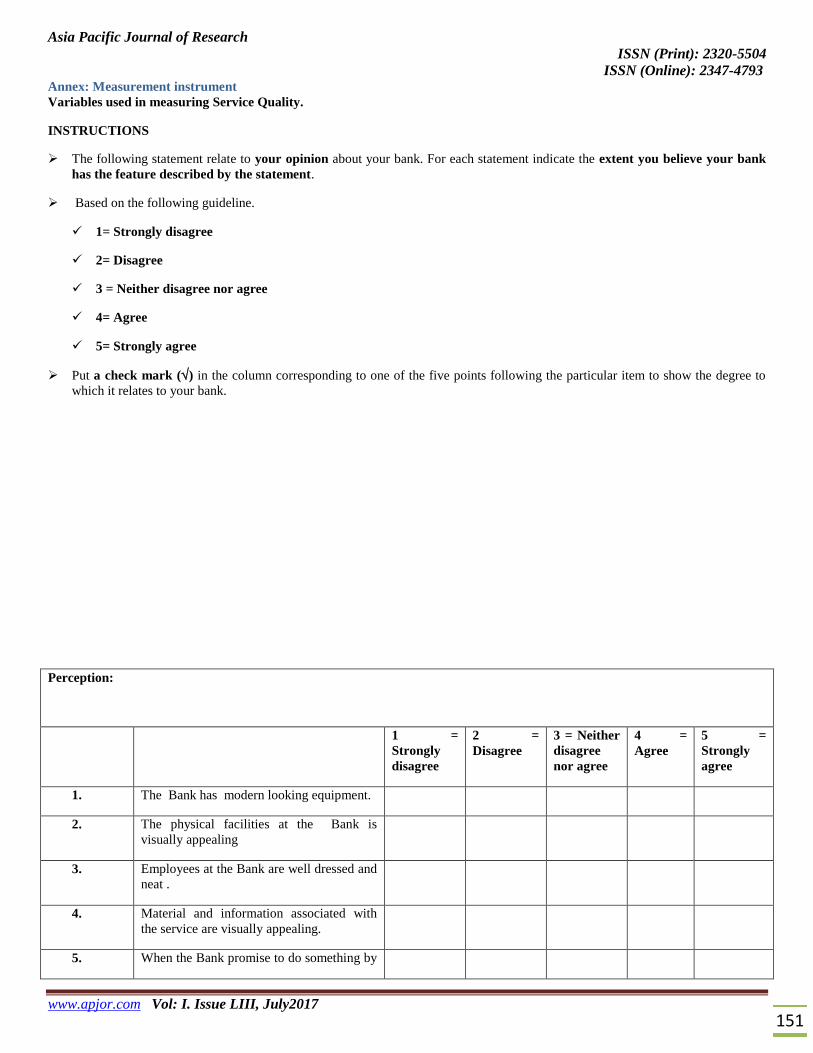
Annex: Measurement instrument
Variables used in measuring Service Quality.
INSTRUCTIONS
The following statement relate to your opinion about your bank. For each statement indicate the extent you believe your bank
has the feature described by the statement.
Based on the following guideline.
1= Strongly disagree
2= Disagree
3 = Neither disagree nor agree
4= Agree
5= Strongly agree
Put a check mark () in the column corresponding to one of the five points following the particular item to show the degree to
which it relates to your bank.
Perception:
1 =
Strongly
disagree
2 =
Disagree
3 = Neither
disagree
nor agree
4 =
Agree
5 =
Strongly
agree
1. The Bank has modern looking equipment.
2. The physical facilities at the Bank is
visually appealing
3. Employees at the Bank are well dressed and
neat .
4. Material and information associated with
the service are visually appealing.
5. When the Bank promise to do something by

Asia Pacific Journal of Research
ISSN (Print): 2320-5504
ISSN (Online): 2347-4793
www.apjor.com Vol: I. Issue LIII, July2017 152
a certain time, it does so.
6. When a customer has a problem, the
Banks’s staff are sympathetic and
reassuring.
7. The Bank performs the service right the
first time.
8. The Bank provides the service at the time it
promises to do so.
9. The Bank keeps its records accurately
10. The Bank tells customers exactly when
services will be performed.
11. The Banks’ staff gives prompt service to
customers.
12. The Banks’ staff are always willing to help
customers.
13. The Banks’ staff are never too busy to
respond to customers’ requests.
14. The behavior of the Banks’s staff instill
confidence in customers.
15. You feel safe in conducting business with
the Bank.
16. The Banks’ staff are consistently courteous
with customers
17. The Banks’ staff have the knowledge to
answer customers’ questions.
18. The Banks gives customers individual
attention.
19. The Bank has operating hours convenient to
all their customers.
20. The Bank has employees who give
customers personal attention
1 =
Strongly
disagree
2 =
Disagree
3 = Neither
disagree
nor agree
4 =
Agree
5 =
Strongly
agree
21. The Bank have their customer’s best
interest at heart.
22. The Banks’ staff understand the specific
needs of their customers.

Asia Pacific Journal of Research
ISSN (Print): 2320-5504
ISSN (Online): 2347-4793
www.apjor.com Vol: I. Issue LIII, July2017 153
INSTRUCTIONS
The following statement relate to your feeling about your bank. For each statement indicate the extent you
believe your bank has the feature described by the statement based on the following guideline.
1= Strongly disagree
2= disagree
3 = Neither disagree nor agree
4= Agree
5= Strongly agree
Put a check mark () in the column corresponding to one of the four points following the particular item to
show the degree to which it relates to your bank.
Expectations:
1 =
Strongly
disagree
2 =
Disagr
ee
3 =
Neither
disagree
nor agree
4 =
Agree
5 =
Strongly
agree
1. Banks should have modern looking
equipment. .
2. The physical facilities at Banks should be
visually appealing
3. Employees at Banks should be neat
appearing
4. Material and information associated with
the service should be visually appealing.
5. When Banks promise to do something by a
certain time, they should do so.
6. When a customer has a problem, Banks’s
staff should be sympathetic and reassuring.
7. Banks should perform the service right the
first time.
1 =
Strongly
disagree
2 =
Disagr
ee
3 =
Neither
disagree
nor agree
4 =
Agree
5 =
Strongly
agree
8. Banks should provide the service at the
time they promise to do so.
9. Banks should insist on error free records
10. Banks should tell customers exactly when
services will be performed.
Asia Pacific Journal of Research
ISSN (Print): 2320-5504
ISSN (Online): 2347-4793
www.apjor.com Vol: I. Issue LIII, July2017 154
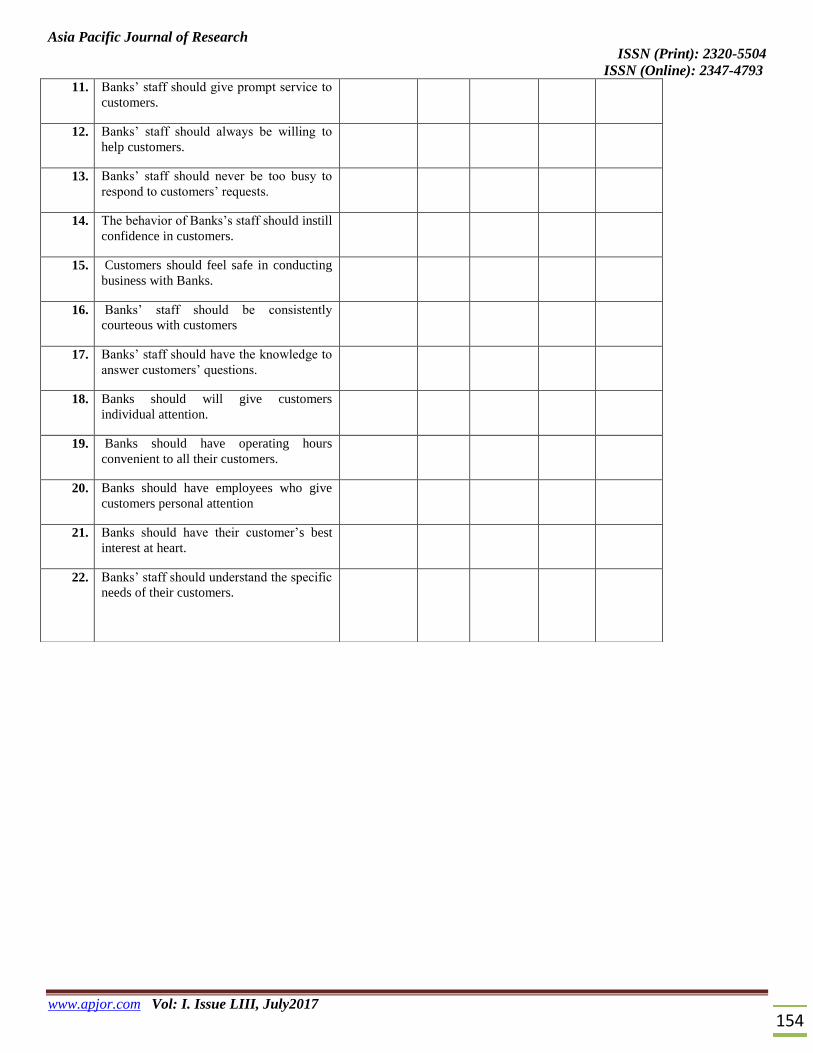
11. Banks’ staff should give prompt service to
customers.
12. Banks’ staff should always be willing to
help customers.
13. Banks’ staff should never be too busy to
respond to customers’ requests.
14. The behavior of Banks’s staff should instill
confidence in customers.
15. Customers should feel safe in conducting
business with Banks.
16. Banks’ staff should be consistently
courteous with customers
17. Banks’ staff should have the knowledge to
answer customers’ questions.
18. Banks should will give customers
individual attention.
19. Banks should have operating hours
convenient to all their customers.
20. Banks should have employees who give
customers personal attention
21. Banks should have their customer’s best
interest at heart.
22. Banks’ staff should understand the specific
needs of their customers.