Embed Size (px)
Citation preview

Lettershttps://doi.org/10.1038/s41588-018-0273-y
1Center for Computational Biology, McKusick-Nathans Institute of Genetic Medicine, Johns Hopkins University, Baltimore, MD, USA. 2Department of Computer Science, Johns Hopkins University, Baltimore, MD, USA. 3Departments of Computer Science, Biology, and Mathematics, Harvey Mudd College, Claremont, CA, USA. 4Department of Medicine, University of Colorado Denver, Aurora, CO, USA. 5Department of Medicine, Johns Hopkins University, Baltimore, MD, USA. 6Department of Internal Medicine, Section on Pulmonary, Critical Care, Allergy and Immunologic Diseases, Center for Precision Medicine, Wake Forest School of Medicine, Winston-Salem, NC, USA. 7Department of Public Health Sciences, Henry Ford Health System, Detroit, MI, USA. 8Department of Medicine, University of California, San Francisco, San Francisco, CA, USA. 9Department of Parasitology, Leiden University Medical Center, Leiden, The Netherlands. 10Department of Physiology and Biophysics, University of Mississippi Medical Center, Jackson, MS, USA. 11Institute for Immunological Research, Universidad de Cartagena, Cartagena, Colombia. 12Department of Internal Medicine, Henry Ford Health System, Detroit, MI, USA. 13Faculty of Medical Sciences Cave Hill Campus, The University of the West Indies, Bridgetown, Barbados. 14Department of Medicine, Vanderbilt University, Nashville, TN, USA. 15Department of Medicine and Center for Global Health, University of Chicago, Chicago, IL, USA. 16Department of Medicine, University of Chicago, Chicago, IL, USA. 17Laboratório de Patologia Experimental, Centro de Pesquisas Gonçalo Moniz, Salvador, Brazil. 18Department of Human Genetics, University of Chicago, Chicago, IL, USA. 19Department of Medicine, University of Arizona College of Medicine, Tucson, AZ, USA. 20Centro de Neumologia y Alergias, San Pedro Sula, Honduras. 21Caribbean Institute for Health Research, The University of the West Indies, Kingston, Jamaica. 22Pulmonary and Critical Care Medicine, Morehouse School of Medicine, Atlanta, GA, USA. 23Department of Medicine, Einstein Medical Center, Philadelphia, PA, USA. 24National Human Genome Center, Howard University College of Medicine, Washington, DC, USA. 25Department of Microbiology, Howard University College of Medicine, Washington, DC, USA. 26Departments of Bioengineering & Therapeutic Sciences and Medicine, University of California, San Francisco, San Francisco, CA, USA. 27Immunology Service, Universidade Federal da Bahia, Salvador, Brazil. 28Facultad de Ciencias Médicas, Universidad Tecnológica Centroamericana (UNITEC), Tegucigalpa, Honduras. 29Department of Biostatistics, Bloomberg School of Public Health, Johns Hopkins University, Baltimore, MD, USA. 30Department of Epidemiology, Bloomberg School of Public Health, Johns Hopkins University, Baltimore, MD, USA. 31Department of Biomedical Engineering, Johns Hopkins University, Baltimore, MD, USA. *e-mail: [email protected]; [email protected]
We used a deeply sequenced dataset of 910 individuals, all of African descent, to construct a set of DNA sequences that is present in these individuals but missing from the reference human genome. We aligned 1.19 trillion reads from the 910 individuals to the reference genome (GRCh38), collected all reads that failed to align, and assembled these reads into con-tiguous sequences (contigs). We then compared all contigs to one another to identify a set of unique sequences repre-senting regions of the African pan-genome missing from the reference genome. Our analysis revealed 296,485,284 bp in 125,715 distinct contigs present in the populations of African descent, demonstrating that the African pan-genome con-tains ~10% more DNA than the current human reference genome. Although the functional significance of nearly all of this sequence is unknown, 387 of the novel contigs fall within 315 distinct protein-coding genes, and the rest appear to be intergenic.
Since its initial publication1,2, the human genome sequence has undergone continual improvements aimed at filling gaps and cor-recting errors. The latest release, GRCh38, spans 3.1 gigabases (Gb), with just 875 remaining gaps3. The ongoing effort to improve the human reference genome, led by the Genome Reference Consortium, has in recent years added alternate loci for genomic regions where variation cannot be captured by SNPs or small inser-tions and deletions (indels). These alternate loci, which comprise 261 scaffolds in GRCh38, capture a small amount of population variation and improve read mapping for some data sets.
Despite these efforts, the current human reference genome derives primarily from a single individual4, thus limiting its use-fulness for genetic studies, especially among admixed populations, such as those representing the African diaspora. In recent years, a growing number of researchers have emphasized the importance of capturing and representing sequencing data from diverse popu-lations and incorporating these data into the reference genome
Assembly of a pan-genome from deep sequencing of 910 humans of African descentRachel M. Sherman 1,2*, Juliet Forman1,3, Valentin Antonescu1, Daniela Puiu1, Michelle Daya4, Nicholas Rafaels4, Meher Preethi Boorgula4, Sameer Chavan4, Candelaria Vergara 5, Victor E. Ortega6, Albert M. Levin7, Celeste Eng8, Maria Yazdanbakhsh 9, James G. Wilson10, Javier Marrugo11, Leslie A. Lange4, L. Keoki Williams12, Harold Watson13, Lorraine B. Ware14, Christopher O. Olopade15, Olufunmilayo Olopade16, Ricardo R. Oliveira17, Carole Ober18, Dan L. Nicolae16, Deborah A. Meyers19, Alvaro Mayorga20, Jennifer Knight-Madden21, Tina Hartert14, Nadia N. Hansel5, Marilyn G. Foreman22, Jean G. Ford23, Mezbah U. Faruque24, Georgia M. Dunston25, Luis Caraballo11, Esteban G. Burchard26, Eugene R. Bleecker19, Maria I. Araujo27, Edwin F. Herrera-Paz 28, Monica Campbell4, Cassandra Foster5, Margaret A. Taub29, Terri H. Beaty 30, Ingo Ruczinski31, Rasika A. Mathias5,30, Kathleen C. Barnes4 and Steven L. Salzberg 1,2,29,31*
NATURE GENETICS | www.nature.com/naturegenetics

Letters Nature GeNetics
and genomics studies in general5–7. The alternate loci in GRCh38 offer one possible way to add such diversity, although it is unclear whether such a solution is sustainable as more populations are sequenced. Among other problems, the addition of alternate loci as separate contigs can mislead sequence alignment programs, which were designed under the assumptions that each read has a single true point of origin and that the genome is represented as a linear haploid sequence8.
The lack of diversity in the reference genome poses many chal-lenges when analyzing individuals whose genetic background does not match the reference. This problem may be addressed by using large databases of known SNPs (for example, dbSNP9), but this solu-tion only addresses single-base differences and small indels and is not adequate for larger variants. Findings from the 1000 Genomes Project indicate that differences between populations are quite large; examination of 26 populations across five continents revealed that 86% of discovered variants were present in only one continental group. In that study, the five African populations examined had the highest number of variant sites compared with the remaining 21 populations10.
One way to address the limitations of a single reference genome is to sequence and assemble reference genomes for other human subpopulations. The 1000 Genomes Project, Genome in a Bottle, and other projects have assembled draft genomes from various populations, including Chinese, Korean, and Ashkenazi individu-als11–15. Other groups have used highly homogenous populations (for example, Danish, Dutch, or Icelandic individuals) together with assembly-based approaches to discover SNPs and structural variants (SVs), including up to several megabases of non-reference sequence common to these populations16–19. Although these variant analyses are a step in the right direction, to date, none have produced a refer-ence-quality genome that can replace GRCh38 (ref. 3); however, this is an explicit goal of the Danish Genome Project (URLs).
While efforts to produce new reference genomes are worthwhile, attempts to create a pan-genome of a human population, a collec-tion of sequences representing all of the DNA in that population, are rare. Although multiple pan-genomes have been created for bacte-rial species20–22, as of yet, there are no pan-genomes for any other animal or plant species. The lack of pan-genomes is due in part to the technical challenges of assembling many deeply sequenced genomes de novo and combining them into one genome. Whereas the Danish Genome Project focused on 50 trios of non-admixed individuals (removing admixed samples from their study17), our study focuses on a highly heterogeneous group of admixed individ-uals. Because the human reference genome is largely complete (the sequence has very few gaps), our strategy for creating a pan-genome focused on finding large insertions. This approach, although com-putationally demanding, made the African pan-genome assembly process described here feasible.
A 2010 study that sequenced one Asian and one African indi-vidual used the novel sequences identified to estimate that a full human pan-genome would contain an additional 19–40 megabases (Mb) that are not in the current reference genome11. Recent efforts to sequence a Dutch population and a set of 10,000 individuals have supported this estimate, reporting 4.3 and 3.3 Mb of non-reference sequences, respectively18,23; however, neither study was designed with the primary goal of discovering long, non-reference sequences. A 2017 study in which two haploid human genomes (hydatidiform moles) were sequenced using long reads estimated that a single diploid genome may differ by as much as 16 Mb from the reference genome24. As we describe here, our analysis of 910 deeply sequenced individuals, all from the Consortium on Asthma among African-Ancestry Populations in the Americas (CAAPA)25, produced a much larger amount of novel sequence (sequence absent from GRCh38) in the African pan-genome, spanning 296.5 Mb. We describe the methods used to identify and validate these sequences
along with comparisons to other human sequences. The African pan-genome (APG) contigs have been deposited at NCBI under accession PDBU01000000 to provide a better foundation for future analyses of individuals of African ancestry.
In total, we discovered 296.5 Mb of novel DNA distributed across 125,715 sequences assembled from 910 individuals of African descent (Table 1 and Supplementary Fig. 1). We took steps to ensure contaminants and redundant contigs were removed, resulting in a non-redundant set of human contigs representa-tive of the entire study group (Fig. 1). After discovery, we called presence/absence for all APG sequences in each CAAPA sample. A total of 33,599 contigs with a combined length of 81,096,662 bases represented sequences present in at least two individuals in the CAAPA cohort. When alignments above 80% coverage and 90% identity to Chinese and Korean genome assemblies were also considered shared, the number of non-private insertions increased to 61,410, totaling 160,475,353 bases and leaving 64,305 singleton contigs, a ~51% singleton rate. Of the 125,715 APG sequences, 1,548 (total length 4.4 Mb) were anchored to a specific location in the primary GRCh38 assembly. On average, each individual contained 859 of these inserted sequences, with a single sequence being shared among six individuals (Table 2). Placed contigs were shared among more individuals, 196 on average, as shared sequences were more likely to meet the placement criterion in at least one individual.
We fully resolved the location for 302 of these sequences and resolved the breakpoint of one end of the insertion for the remain-ing 1,246 (Supplementary Table 1). Placement locations were deter-mined by complementing our methods with results from the PopIns program16, which corroborated many placements and resolved place-ments for some insertions for which our method was ambiguous (Supplementary Note 1). The remaining sequences (Supplementary Table 2) could not be fully localized; however, mate-linking infor-mation pointed to a consistent location for at least one end for an additional 57,655 sequences (Supplementary Table 3). The longest placed sequence was 79,938 bp and appeared in 197 samples, and the longest unplaced sequence was 152,806 bp, which appeared in 11 samples (Table 1). Among all placed sequences, 387 intersected known genes, with placements within exons in 48 distinct genes and placements within introns in an additional 267 genes (some genes contained more than one insertion). Of the 315 genes containing insertions, 292 were named (had names other than ‘hypothetical’ or a non-meaningful identifier). An additional 133 placed insertions and 46 that already intersected a protein-coding gene intersected 142 distinct lncRNAs, 21 of which were named (Supplementary Table 4). A translated BLAST26 search on unplaced sequences against NCBI’s nr database yielded an additional 10,667 contigs hit-ting a chordate protein with ≥ 70% identity and an e value less than
Table 1 | Novel sequences in the African pan-genome
Number of sequence contigs
Total length (bp)
Bases with no alignment to GRCh38 (< 80% identity)
Longest contig (bp)
Two ends placed 302 667,668 431,656 20,732
One end placed 1,246 3,687,028 1,866,699 79,938
Unplaced 124,167 292,130,588 202,629,979 152,806
Total 125,715 296,485,284 204,928,334 152,806
Non-private only 33,599 80,098,092 50,044,650 152,806
Number and length of novel sequences in the African pan-genome. Bases with no alignment to GRCh38 were calculated by subtracting the lengths of all subsequences that aligned with at least 80% identity. The remainder represents truly novel sequence. Non-private insertions were insertions shared by at least two CAAPA cohort individuals.
NATURE GENETICS | www.nature.com/naturegenetics

LettersNature GeNetics
Reads(fastq)
× 910
Assembledcontigs(fasta)
× 910
Align to GRCh38(Bowtie2)
Alignments(sam)
× 910
Readunaligned
(fastq)
× 910
Extractunalignedreads and
mates
(Samtools)
Mateunaligned
(fastq)
× 910
Readunaligned
(fastq)
× 910
Matealigned(sam)
× 910
Remove <1 kband remove
contaminants
(Centrifuge)
Filteredcontigs(fasta)
× 910
Alignmentsto contig
(sam)
Read+ mate
positions(bed-pe)
Read+ mate
positions(bed-pe)
Reads aligning to end of contig
Right endLeft end
Ext
ract
cor
resp
ondi
ng m
ates
Check region
ambiguity
Align to region, ifunambiguous
(nucmer)
Insertionbreakpoint
Insertionbreakpoint
Leftend
placed
Rightend
placed
Bothends
placed
Unplaced
Clustersof 2/L/R
EPcontigs
Separately for two/left/right end placed:Cluster if within 100 bp, choose longest as representative
(Bedtools)
Alignments(coords)
Align clustercontigs to theirrepresentative
(Nucmer)
Remove pooralignments Clusters
of 2/L/REP
contigs
2EPAlignments
(coords)
Align unplaced to all 2EP cluster contigs
(Nucmer)
Remove contained from uplaced set
Unplacedcontigs
L/R EPAlignments
(coords)
Unplacedcontigs
Clustersof L/R
EPcontigs
Add containedto clusters
Finalclustersof 1EPcontigs
Overlap endsfor L/R clusterswithin 500 bp
(Nucmer)
Remove clustersof merged L/Rreps from 1EP,
add to 2EP
Align remaining unplaced to all L/R EP cluster contigs
(Nucmer)
Remove contained from uplaced set
Finalclustersof 2EPcontigs
Add containedto 2EP clusters
Finalunplacedcontigs
Align all to allRemove contained and
near identical
(Nucmer)
Unplacedcontigs
Align allunplaced toplaced reps
If similar,remove from
unplaced
(Nucmer)
Align readsto contig(Bowtie2)
Assembly of unaligned reads Location placement (per contig)
Merging of similar sequences
Assemble(MaSuRCA)
Fig. 1 | Overview of methods. Raw reads are aligned to GRCh38, and unaligned reads are assembled with MaSuRCA. Assembled contigs are then filtered for contaminants with Centrifuge, and contigs shorter than 1 kb are removed (blue box). Assembled contigs are placed based on their mate’s alignment locations when possible by checking whether > 95% of mates align to the same location. If such a placement is found, the exact breakpoint is determined via a nucmer alignment to the region for each end of the contig (yellow box). Contig placement locations are then compared between all individuals, nearby placements are clustered, and a representative is chosen. All contigs are then aligned to the representatives to determine which samples contain a given placed insertion. Contigs in or aligning to placed clusters are removed from the unplaced set, and the remaining unplaced contigs are aligned to one another with nucmer to remove redundancy and result in a final nonredundant unplaced set of contigs (purple box). EP, end placed; 1EP, one end placed; 2EP, two end placed; L, left; R, right.
NATURE GENETICS | www.nature.com/naturegenetics
Letters Nature GeNetics
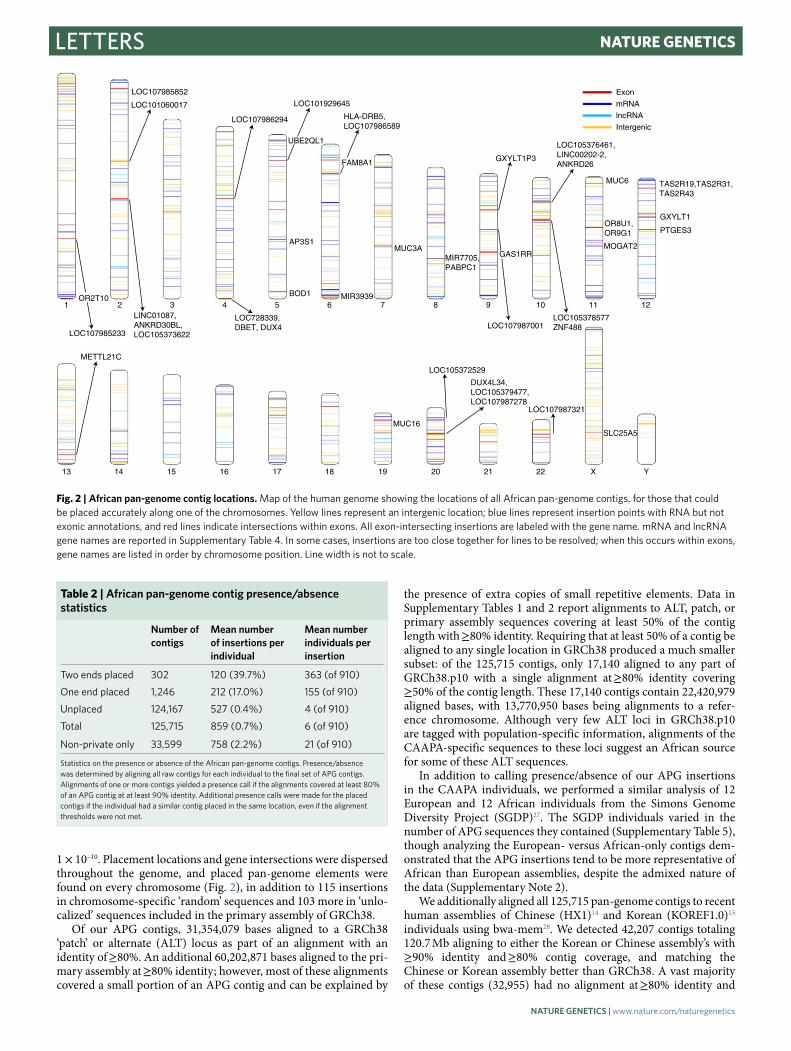
1 × 10⁻¹⁰. Placement locations and gene intersections were dispersed throughout the genome, and placed pan-genome elements were found on every chromosome (Fig. 2), in addition to 115 insertions in chromosome-specific ‘random’ sequences and 103 more in ‘unlo-calized’ sequences included in the primary assembly of GRCh38.
Of our APG contigs, 31,354,079 bases aligned to a GRCh38 ‘patch’ or alternate (ALT) locus as part of an alignment with an identity of ≥ 80%. An additional 60,202,871 bases aligned to the pri-mary assembly at ≥ 80% identity; however, most of these alignments covered a small portion of an APG contig and can be explained by
the presence of extra copies of small repetitive elements. Data in Supplementary Tables 1 and 2 report alignments to ALT, patch, or primary assembly sequences covering at least 50% of the contig length with ≥ 80% identity. Requiring that at least 50% of a contig be aligned to any single location in GRCh38 produced a much smaller subset: of the 125,715 contigs, only 17,140 aligned to any part of GRCh38.p10 with a single alignment at ≥ 80% identity covering ≥ 50% of the contig length. These 17,140 contigs contain 22,420,979 aligned bases, with 13,770,950 bases being alignments to a refer-ence chromosome. Although very few ALT loci in GRCh38.p10 are tagged with population-specific information, alignments of the CAAPA-specific sequences to these loci suggest an African source for some of these ALT sequences.
In addition to calling presence/absence of our APG insertions in the CAAPA individuals, we performed a similar analysis of 12 European and 12 African individuals from the Simons Genome Diversity Project (SGDP)27. The SGDP individuals varied in the number of APG sequences they contained (Supplementary Table 5), though analyzing the European- versus African-only contigs dem-onstrated that the APG insertions tend to be more representative of African than European assemblies, despite the admixed nature of the data (Supplementary Note 2).
We additionally aligned all 125,715 pan-genome contigs to recent human assemblies of Chinese (HX1)14 and Korean (KOREF1.0)15 individuals using bwa-mem28. We detected 42,207 contigs totaling 120.7 Mb aligning to either the Korean or Chinese assembly’s with ≥ 90% identity and ≥ 80% contig coverage, and matching the Chinese or Korean assembly better than GRCh38. A vast majority of these contigs (32,955) had no alignment at ≥ 80% identity and
Table 2 | African pan-genome contig presence/absence statistics
Number of contigs
Mean number of insertions per individual
Mean number individuals per insertion
Two ends placed 302 120 (39.7%) 363 (of 910)
One end placed 1,246 212 (17.0%) 155 (of 910)
Unplaced 124,167 527 (0.4%) 4 (of 910)
Total 125,715 859 (0.7%) 6 (of 910)
Non-private only 33,599 758 (2.2%) 21 (of 910)
Statistics on the presence or absence of the African pan-genome contigs. Presence/absence was determined by aligning all raw contigs for each individual to the final set of APG contigs. Alignments of one or more contigs yielded a presence call if the alignments covered at least 80% of an APG contig at at least 90% identity. Additional presence calls were made for the placed contigs if the individual had a similar contig placed in the same location, even if the alignment thresholds were not met.
1 2 3 4 5 6 7 8 9 10 11 12
13 14 15 16 17 18 19 20 21 22 X Y
LOC107985852
LOC101060017
LINC01087,ANKRD30BL,LOC105373622
LOC107986294
LOC728339, DBET, DUX4
LOC101929645
AP3S1
BOD1
HLA-DRB5,LOC107986589
MIR3939
MUC3AMIR7705,PABPC1
MUC6
LOC107987001
LOC105376461,LINC00202-2,ANKRD26
LOC105378577ZNF488
OR8U1,OR9G1
MOGAT2
TAS2R19,TAS2R31,TAS2R43
GXYLT1
PTGES3
GXYLT1P3
METTL21C
MUC16
LOC105372529
DUX4L34,LOC105379477,LOC107987278
LOC107987321
SLC25A5
Exon
mRNA
lncRNA
Intergenic
LOC107985233
OR2T10
UBE2QL1
FAM8A1
GAS1RR
Fig. 2 | African pan-genome contig locations. Map of the human genome showing the locations of all African pan-genome contigs, for those that could be placed accurately along one of the chromosomes. Yellow lines represent an intergenic location; blue lines represent insertion points with RNA but not exonic annotations, and red lines indicate intersections within exons. All exon-intersecting insertions are labeled with the gene name. mRNA and lncRNA gene names are reported in Supplementary Table 4. In some cases, insertions are too close together for lines to be resolved; when this occurs within exons, gene names are listed in order by chromosome position. Line width is not to scale.
NATURE GENETICS | www.nature.com/naturegenetics

LettersNature GeNetics
≥ 50% coverage to GRCh38.p10, indicating that these sequences were not simply divergent from GRCh38, but rather were not pres-ent at all (Table 3); an example of such a sequence and its alignments to GRCh38 and HX1 are shown in Fig. 3. This finding suggests these sequences have been lost in the small number of individuals used to create GRCh38, although some of them may reside in the few remaining gaps in the genome.
While Shi et al. reported 12.8 Mb of novel DNA in the HX1 genome14, we found a total of 68.1 Mb shared by HX1 and the unique sequences in the APG contigs (Table 3). This discrepancy is methodological: the Chinese genome assembly has relatively large scaffolds that were considered unique only if a large proportion of the scaffold failed to align to GRCh38 (Supplementary Note 3).
As an additional check to ensure the APG sequences were not contaminants, we examined what portion of contigs had some match, even just a partial match, to the GRCh38, Korean, or Chinese assemblies. After filtering to retain only query-consistent alignments, 98% of the contigs (123,600) had some portion align-ing to either the Chinese, Korean, or GRCh38 assemblies. The Korean assembly had the most alignment, with 123,585 contigs containing an alignment totaling 247.2 Mb of aligned length, or 83% of the total APG sequence, although only 31,033 contigs, totaling 80.9 Mb of alignment, aligned with over ≥ 90% identity and ≥ 80% coverage.
Our findings here demonstrate that the standard human refer-ence genome lacks a substantial amount of DNA sequence com-pared with other human populations. The APG sequences contain 296.5 Mb, equal to 10% of the genome, regions that will necessarily be missed by any efforts relying only on GRCh38 to study human varia-tion, as nearly all studies do at present. Of these 296.5 Mb, 120.7 Mb were shared by the Korean or Chinese populations, suggesting those regions may have been lost more recently or may be rare in the specific populations represented in GRCh38. Overall these results suggest that a single reference genome is not adequate for popula-tion-based studies of human genetics. Instead, a better approach may
be to create reference genomes for all distinct human populations, which over time will eventually yield a comprehensive pan-genome capturing all of the DNA present in humans.
URL. http://www.genomedenmark.dk/english/about/referencege-nome/.
Online contentAny methods, additional references, Nature Research reporting summaries, source data, statements of data availability and asso-ciated accession codes are available at https://doi.org/10.1038/s41588-018-0273-y.
Received: 20 November 2017; Accepted: 8 October 2018; Published: xx xx xxxx
References 1. International Human Genome Sequencing Consortium. Initial sequencing
and analysis of the human genome. Nature 409, 860–921 (2001). 2. Venter, J. C. et al. The sequence of the human genome. Science 291,
1304–1351 (2001). 3. Schneider, V. A. et al. Evaluation of GRCh38 and de novo haploid genome
assemblies demonstrates the enduring quality of the reference assembly. Genome Res. 27, 849–864 (2017).
4. Green, R. E. et al. A draft sequence of the Neandertal genome. Science 328, 710–722 (2010).
5. E pluribus unum. Nat Methods 7, 331 (2010). 6. Need, A. C. & Goldstein, D. B. Next generation disparities in human
genomics: concerns and remedies. Trends Genet. 25, 489–494 (2009). 7. Popejoy, A. B. & Fullerton, S. M. Genomics is failing on diversity. Nature 538,
161–164 (2016). 8. Church, D. M. et al. Extending reference assembly models. Genome. Biol. 16,
13 (2015). 9. Sherry, S. T. et al. dbSNP: the NCBI database of genetic variation. Nucleic
Acids Res. 29, 308–311 (2001). 10. The 1000 Genomes Project Consortium. A global reference for human
genetic variation. Nature 526, 68–74 (2015). 11. Li, R. et al. Building the sequence map of the human pan-genome.
Nat. Biotechnol. 28, 57–63 (2010).
Table 3 | Comparison of African pan-genome contigs to the Chinese and Korean genomes
Best GRCh38 alignment is 80–90% identical with 50–80% coverage
Best GRCh38 alignment is < 80% identical or < 50% coverage
Total
Contigs Length (bp) Contigs Length (bp) Contigs Length (bp)
Matches Chinese only 1,625 2,898,106 7,607 25,475,277 9,232 28,373,383
Matches Korean only 2,242 3,989,277 15,635 48,642,664 17,877 52,631,941
Matches both 5,385 9,720,662 9,713 29,981,048 15,098 39,701,710
Total 9,252 16,608,045 32,955 104,098,989 42,207 120,707,034
Contigs with a better alignment to the Chinese or Korean assemblies than to GRCh38. Alignments to the Chinese and Korean assemblies were required to have ≥ 90% identity and ≥ 80% coverage to be considered. Lengths shown are the sums of the contig lengths, not the alignment lengths.
CAAPA_113686 (3,234 bp)
GRCh38, chr21: 9,246,385–9,248,215
Chinese HX1, 005482F: 84–3,084
91.6% 89.6% 85.2%
98.3%
Fig. 3 | An example of an alignment that does not meet the 50% coverage, 80% identity threshold for a ‘reasonably good’ alignment to GRCh38. The APG contig is shown at the top, with the best consistent alignments to GRCh38 in the middle. The three constituent alignments (blue, red, and yellow segments) cover 801 bases, just under 25% of the contig, with a cumulative weighted identity of 87.9%. CAAPA_113686 has a single near-perfect alignment to a Chinese HX1 contig (delineated by dotted lines) covering over 80% of CAAPA_113686 at over 90% identity. The APG contig also aligns well to the Korean assembly (not shown).
NATURE GENETICS | www.nature.com/naturegenetics

Letters Nature GeNetics
12. Seo, J. S. et al. De novo assembly and phasing of a Korean human genome. Nature 538, 243–247 (2016).
13. Zook, J. M. et al. Extensive sequencing of seven human genomes to characterize benchmark reference materials. Sci. Data 3, 160025 (2016).
14. Shi, L. et al. Long-read sequencing and de novo assembly of a Chinese genome. Nat. Commun. 7, 12065 (2016).
15. Cho, Y. S. et al. An ethnically relevant consensus Korean reference genome is a step towards personal reference genomes. Nat. Commun. 7, 13637 (2016).
16. Kehr, B., Melsted, P. & Halldorsson, B. V. PopIns: population-scale detection of novel sequence insertions. Bioinformatics 32, 961–967 (2016).
17. Maretty, L. et al. Sequencing and de novo assembly of 150 genomes from Denmark as a population reference. Nature 548, 87–91 (2017).
18. Hehir-Kwa, J. Y. et al. A high-quality human reference panel reveals the complexity and distribution of genomic structural variants. Nat. Commun. 7, 12989 (2016).
19. Kehr, B. et al. Diversity in non-repetitive human sequences not found in the reference genome. Nat. Genet. 49, 588–593 (2017).
20. Gordienko, E. N., Kazanov, M. D. & Gelfand, M. S. Evolution of pan-genomes of Escherichia coli, Shigella spp., and Salmonella enterica. J. Bacteriol. 195, 2786–2792 (2013).
21. Tettelin, H. et al. Genome analysis of multiple pathogenic isolates of Streptococcus agalactiae: implications for the microbial “pan-genome”. Proc. Natl Acad. Sci. USA 102, 13950–13955 (2005).
22. Vernikos, G., Medini, D., Riley, D. R. & Tettelin, H. Ten years of pan-genome analyses. Curr. Opin. Microbiol. 23, 148–154 (2015).
23. Telenti, A. et al. Deep sequencing of 10,000 human genomes. Proc. Natl Acad. Sci. USA 113, 11901–11906 (2016).
24. Huddleston, J. et al. Discovery and genotyping of structural variation from long-read haploid genome sequence data. Genome Res. 27, 677–685 (2017).
25. Mathias, R. A. et al. A continuum of admixture in the Western Hemisphere revealed by the African Diaspora genome. Nat. Commun. 7, 12522 (2016).
26. Camacho, C. et al. BLAST+ : architecture and applications. BMC Bioinformatics 10, 421 (2009).
27. Mallick, S. et al. The Simons Genome Diversity Project: 300 genomes from 142 diverse populations. Nature 538, 201–206 (2016).
28. Li, H. & Durbin, R. Fast and accurate short read alignment with Burrows-Wheeler transform. Bioinformatics 25, 1754–1760 (2009).
AcknowledgementsWe gratefully acknowledge the contributions of P. Maul, T. Maul, P. Levett, A. Hennis, P. M. Lashley, R. Naidu, M. Howitt, T. Roach, A. Grant, E. V. Ponte, A. A. Cruz, E. Carvalho, S. Balcer-Whaley, M. Stockton-Porter, M. Yang, D. Mejía-Mejía, M. Meraz, J. Nuñez, E. F. Herrera Mejía, T. Ferguson, D. Ashley, S. Jimenez, N. Acevedo, D. Mercado, A. Jedlicka, H. Gui, R. Torres, A. K. May, C. Gilmore, P. Minton, Q. Niu, A. Falusi, and A. Odetunde. The authors also acknowledge the support of J. J. Shannon, K. Weiss, R. Miranda and the Indians Zenues guards, U. A. Ngoa, C. Rotimi, A. Adebowale, F. J. Malveaux, and E. Reece. We thank the numerous healthcare providers, community clinics and coinvestigators who assisted in the phenotyping and collection of DNA samples, and the families and patients for generously donating DNA samples to BAGS, BIAS, BREATHE, CAG, GRAAD, HONDAS, Jackson Heart Study, REACH, SAGE II, VALID, SAPPHIRE, SARP, COPDGene, JAAS, GALA II, PGCA, AEGS, and the asthma studies in Gabon and Palenque, Colombia. Special thanks to community leaders, teachers, doctors and personnel from health centers at the Garifuna communities for
organizing the medical brigades and to the medical students at Universidad Católica de Honduras, Campus San Pedro y San Pablo for their participation in the fieldwork related to HONDAS; study coordinator S. Salazar, and the recruiters in SAGE and GALA: D. Alva, G. Ayala-Rodriguez, U. Burley, L. Caine, E. Castellanos, J. Colon, D. DeJesus, I. Flexas, B. Lopez, B. Lopez, L. Martos, V. Medina, J. Olivo, M. Peralta, E. Pomares, J. Quraishi, J. Rodriguez, S. Saeedi, D. Soto, A. Taveras, E. Viera, M. LeNoir, K. Meade, M. Jensen, and A. Davis; and health liaisons and public health officers of the main Conde office, A. Conceição, L. Quintela, I. Santos, A. Lima, B. Valber Oliveira Silva, and I. S. Araujo, and students from the Federal University of Bahia who assisted in data collection in BIAS: R. Santana, R. Barbosa, A. P. Santana, C. Barros, M. Brandão, L. Almeida, T. Cardoso, and D. Costa. We are grateful for the support from the international state governments and universities from Honduras, Colombia, Brazil, Gabon, Nigeria, The Netherlands, Jamaica, Barbados, and the United States, who made this work possible. Funding for this study was provided in part by NIH grants R01-HL129239 (S.L.S. and K.C.B.), R01-HG006677 (S.L.S.), and R01HL104608 (K.C.B. and R.A.M.).
Author contributionsR.M.S. designed and performed analyses and wrote the paper. J.F. performed analyses. V.A. preprocessed data. D.P. performed analyses. M.D. collected data and provided comments on the manuscript. N.R., M.P.B., S.C., C.V., V.E.O., A.M.L., C.E., M.Y., J.G.W., J.M., L.A.L., L.K.W., H.W., L.B.W., C.O.O., O.O., R.R.O., C.O., D.L.N., D.A.M., A.M., J.K.-M., T.H., N.N.H., M.G.F., J.G.F., M.U.F., G.M.D., L.C., E.G.B., E.R.B., M.I.A., E.F.H.-P., M.C., and C.F. collected data. M.A.T., T.H.B., and I.R. collected data and provided comments on the manuscript. R.A.M. collected data. K.C.B. collected data and provided comments on the manuscript. S.L.S. conceived and advised the project and wrote the paper.
Competing interestsThe authors declare no competing interests.
Additional informationSupplementary information is available for this paper at https://doi.org/10.1038/s41588-018-0273-y.
Reprints and permissions information is available at www.nature.com/reprints.
Correspondence and requests for materials should be addressed to R.M.S. or S.L.S.
Publisher’s note: Springer Nature remains neutral with regard to jurisdictional claims in published maps and institutional affiliations.
© The Author(s) 2018
Open Access This article is licensed under a Creative Commons Attribution 4.0 International License, which permits use, sharing, adaptation, distribution and reproduction in any medium or
format, as long as you give appropriate credit to the original author(s) and the source, provide a link to the Creative Commons license, and indicate if changes were made. The images or other third party material in this article are included in the article’s Creative Commons license, unless indicated otherwise in a credit line to the material. If material is not included in the article’s Creative Commons license and your intended use is not permitted by statutory regulation or exceeds the permitted use, you will need to obtain permission directly from the copyright holder. To view a copy of this license, visit http://creativecommons.org/licenses/by/4.0/.
NATURE GENETICS | www.nature.com/naturegenetics

LettersNature GeNetics
MethodsWe used whole-genome shotgun sequence data from 910 individuals whose genomes were sequenced as part of the CAAPA project, available from dbGaP as accession phs001123.v1.p1. The total data set contains 1.19 trillion (1.19 × 10¹²) 100-bp paired end reads, representing an average of 30–40× coverage for each individual’s genome. Sequencing was performed on an Illumina HiSeq 2000. The subjects in the study were all of African ancestry and were selected from 19 populations across the Americas, the Caribbean, and continental Africa25 (Supplementary Table 6).
Assembly of novel contigs. For each sample, we aligned all reads to GRCh38.p0 using Bowtie2 (ref. 29) and extracted unaligned reads and their mates using Samtools30 (Fig. 1). GRCh38 alternate loci were excluded from the reference index, but were considered later in the process. We then assembled all unaligned reads with the MaSuRCA assembler31; if neither mate in a pair aligned to GRCh38, MaSuRCA treated the reads as paired ends with a fragment size of 300 bp, and if only one mate was unaligned, MaSuRCA treated it as an unpaired read.
We filtered the resulting assemblies to exclude contigs shorter than 1000 bp (Fig. 1) and evaluated all remaining contigs with the Centrifuge metagenomics program32, scanning against the comprehensive NCBI nucleotide database to obtain a taxonomic classification of each contig. We considered any contigs labeled by Centrifuge as non-chordates (for example, bacterial or viral contigs) to be contaminants and removed them from further consideration.
Positioning contigs within GRCh38. We attempted to place the assembled contigs in a precise location in the human genome using mapping information from paired reads (“mates”). We masked contigs with RepeatMasker33 with the low-complexity option off (–nolow) and used Bowtie2 to realign all unaligned reads from read pairs in which only one mate had aligned originally. For each read R aligning within 500 bases of the end of a contig, we examined the alignment of R’s mate to GRCh38 to determine whether the contig had a unique placement in the reference genome. The fragment length for all paired-end libraries was 300 bp; by considering reads within 500 bp of the end of a contig, we reduced the likelihood that one or both of the alignments was a spurious match. Additional details of the sequencing protocols for the CAAPA genomes are described elsewhere25. This process resulted in a pool of linking mates corresponding to the beginning and end of each contig.
We then separated contigs into several groups based on their linking information:
1. No linking mates existed on either end of the contig; the reads mates did not align to GRCh38.
2. Placement was unambiguous (or unique) for at least one end of the contig. We define ‘chromosome unambiguous’ to mean > 95% of the linking mates linked to the same chromosome. We define ‘region unambiguous’ to mean that of the > 95% of mates aligned to the same chromosome, all mates aligned within 2 kb of each other. When both conditions hold, we say placement is unambiguous. These contigs were further divided into two subgroups:
a. Both ends of the contig were placed unambiguously, or b. Only one end was placed unambiguously.
3. At least one end of the contig was chromosome unambiguous, but neither end was region unambiguous.
4. Neither end was chromosome unambiguous.
For all contigs in the second group, we used NUCmer34 to align them to the region determined by the linking mates (Fig. 1). If a contig end had one or more consistent exact matches of at least 15 bases (and no inconsistent alignments), we then determined the contig end’s exact insertion location based on alignment coordinates (Supplementary Methods). We permitted an exact two-ended placement only if both ends aligned to the same reference region with the same orientation. The insertion position was either a single breakpoint, if both ends of the contig were placed identically, or a range, if the insertion location of the two ends was not identical. For contigs with only a single end exactly placed, we recorded their exact single-end insertion position and the number of overlapping bases (bases to be trimmed off the end of the contig).
Insertion discovery with PopIns. To supplement the list of placed contigs determined by the procedure above, we ran the PopIns program16, which was used previously for a set of genomes from Icelandic individuals, and was designed to find insertions from a relatively genetically homogenous population. We ran PopIns beginning with the popins merge step, using the cleaned MaSuRCA contig assemblies described above. We ran subsequent PopIns steps as recommended in the PopIns documentation, through the popins place-finish step. PopIns output was converted into a comparable format, and verifiable placements were added to our sets of insertions (Supplementary Methods).
Clustering of placed contigs. Once contig locations were determined for each individual sample, we aligned all insertions to one another and clustered them to determine which contigs represented the same insertion across individuals (Fig. 1).
Clustering two-ended placements. For contigs with both ends placed, we ran BEDtools merge35 to group contigs placed at approximately the same location. We used the -d option with a distance of 10 to allow placements within 10 bases of each other to be combined. We also ran the merge using -d 100, which produced identical results. For each resulting region and contig cluster, we chose the longest contig in the cluster as the cluster’s representative (R), and these representatives formed the initial set of two-end placed contigs, 2EP. Two-ended placement clusters from PopIns were then added to 2EP. We verified clusters by aligning all contigs in each cluster to its representative, R, with default nucmer parameters and removing from the cluster any contigs that did not have any alignments to R. To find the complete set of samples containing each insertion, we then aligned all remaining contigs (including unplaced contigs) to the contigs in the clusters. Any contig aligning with > 99% identity that was fully contained within a contig in a cluster C and covered ≥ 80% of the contig in C was included in C as part of the final set. Contained, 99–100% identical contigs aligning with < 80% coverage were also included if they had at least five linking mates and at least 25% of those mates linked to within 5 kb of the placement location. The longest representative contig in each cluster was used as the final insertion sequence for the African Pan-Genome (APG) contig collection (Supplementary Tables 1 and 2).
Clustering one-ended placements. We separated contigs with only one end placed into two groups: (1) contigs where the “left” end aligned to the reference, so that the contig extends into a gap to the right of the placement location; and (2) contigs with their “right” end placed, so the contig extends into a gap to the left of the placement location (Fig. 1). Left and right were determined by the orientation of the chromosomes in GRCh38. We then created clusters separately for the two groups using BEDtools merge (-d 100) as described above, identifying the longest representative R for each group. This formed the initial set of one-end placed contigs, 1EP. Any placements within 100 bases of a two-ended cluster (in the set 2EP) were then removed from 1EP, and each contig in these 1EP clusters was aligned to the representative of the 2EP cluster(s) within 100 bases. If any 1EP contig in the cluster aligned with ≥ 80% coverage and ≥ 90% identity to the 2EP contig, the 1EP contig was added to the 2EP cluster.
We then added PopIns one-ended placement clusters to the right and left placements in 1EP (Supplementary Methods). Then for all clusters, we used NUCmer with default parameters to align contigs within each cluster to the representative R. If no alignment was found between a contig and R, the contig was removed from the cluster. We then realigned all other contigs to those in each of these filtered clusters, excluding contigs already determined to be part of a two-ended insertion. Contigs > 99% identical over their whole length to any member of a cluster C and covering at least 80% of the contig in C were added to C. Contained, 99–100% identical contigs aligning with less than 80% coverage, were also included if they had at least five linking mates and at least 25% of those mates linked to within 5 kb of the placement location.
We then evaluated the one-ended placements to determine whether two contigs might belong to the same longer insertion, where one contig would ‘fill’ the left side of a gap and the other would fill the right side, possibly meeting in the middle. In some of these cases, the contigs might overlap, allowing us to merge them and create a single, longer insertion sequence. If placement positions were within 500 bases of one another, the sequences were aligned with NUCmer and merged if they were determined to be part of the same insertion (Supplementary Methods). Resultant merged sequences and their clusters were moved to the 2EP set (Fig. 1).
Finally, to remove any potential redundancy from placed clusters, we aligned all representatives from both one- and two-end placed clusters to one another (using nucmer –maxmatch –nosimplify) regardless of placement distance. If two representatives aligned with ≥ 98% identity, covering ≥ 95% of one of the contigs, and were placed within 5 kb of one another, these clusters were merged. To determine the representative (and therefore reported placement) of the merged clusters, two-ended placed representatives were favored over one-ended representatives, then our placements were preferred over PopIns, then longer contigs were favored over shorter contigs. By merging only placements within 5 kb, we avoided merging contigs that were similar solely due to repetitive sequences but were unambiguously linked to different locations.
Unplaced contigs. For all unplaced contigs, we ran nucmer –maxmatch –nosimplify with a minimum seed length of 31 (-1 31) and a minimum cluster size of 100 (-c 100) to align all contigs against one another. Contigs contained within another contig and aligning with > 95% identity were removed, and if contigs were annotated as identical by show-coords with > 97% identity, the smaller of the two was removed. If the ends of two contigs overlapped by at least 100 bases and a third contig was contained within the joined contigs, the contained contig was also removed. Trimming of up to 100 bases was permitted for finding overlaps. Finally, we aligned all resulting unplaced contigs to the placed representatives pre-trimming. If an unplaced contig aligned with ≥ 80% coverage and ≥ 90% identity, it was removed from the unplaced set, though it was not added into the placed cluster, as it did not meet the stricter placement or containment criteria used to create the clusters.
NATURE GENETICS | www.nature.com/naturegenetics
Letters Nature GeNetics
In an additional attempt to place more contigs in the reference genome, we repeated the placement procedure described above, this time considering only the subset of linking mates that mapped to GRCh38 with a mapping quality > 10, and only attempting to place a contig if the contig end had a minimum of five such linking mates. This mapping quality criterion decreased the overall ambiguity of the putative locations for unplaced contigs (Supplementary Fig. 2); however, this additional placement effort only placed 150 additional contigs. We produced a file of putative linking locations for unplaced contigs by examining separately for each end the linking mates with a mapping quality > 10. If > 50% of these high-quality linking mates for a given end pointed to the same region, where a region was defined by grouping mates within 2 kb of each other, we reported that region as the putative placement location for that end of the contig, as well as the total number of high-quality mates and the percentage of those mates linking to that location. For this report, the two contig ends were allowed to putatively link to different locations; in such cases both the start and end regions identified are provided, as these are the two most likely placement regions for the contig (Supplementary Table 3). The putative locations include high-copy repetitive sequences that may be underrepresented in GRCh38, and thus are overrepresented as linking locations (Supplementary Note 4 and Supplementary Fig. 3).
Additional screening and analyses. To screen for contaminants missed by Centrifuge, we used the Kraken metagenomics classifier36 on our final set of representative contigs to compare them to a database containing all complete bacterial and archaeal genomes, all viral genomes, selected fungi and protists, human, mouse, and known contaminant sequences. Any unclassified contig or contig hitting something other than mouse or human was further examined by running the blastn program26 to align the contig to NCBI’s nonredundant nucleotide database. We removed all contigs (as likely contaminants) that had alignments to a non-chordate covering > 50% of the contig with a BLAST e-value < 10–10. We additionally removed a single contig, also an apparent contaminant, hitting Canis familiaris at 90% identity over the entire contig, but lacking any strong matches to primates. As expected, all of these contaminant contigs were found in the set of unplaced contigs. Deleted contaminants were examined for infections of interest, resulting in the incidental discovery of 29 individuals with malaria infections and 1 with human betaherpesvirus (Supplementary Note 5 and Supplementary Table 7).
To ensure the final set of contigs were truly absent from the human reference genome, we realigned all APG contigs to GRCh38.p10 using bwa-mem28 with default parameters. Two separate alignments were performed, one to the primary sequence and one to all patches and alternate loci. We removed any APG contigs with alignments to the primary assembly sequences at or above 90% identity over at least 80% of the contig’s length, regardless of whether they had a better alignment to some alternate locus (Supplementary Methods). In Supplementary Tables 1 and 2, we report the best alignment location for each contig that had at least 50% of the contig aligned to GRCh38.p10 at ≥ 80% identity. All placed locations were intersected with the NCBI-provided gene annotations, GCF_000001405.36, which is the union of GenBank and RefSeq annotations for GRCh38.p10, and a translated BLAST search (blastx) was run against the comprehensive NCBI protein database to identify potential protein-coding regions in the APG sequences.
Calling presence/absence per sample. Raw contigs from the MaSuRCA assemblies (including contigs under 1 kb) of all 910 individuals were aligned to the final set of APG contigs with bwa-mem using default parameters. Alignments to an APG contig aligning within 300 bp of one another were chained to create longer alignments where possible. Identity of the chained alignment was taken to be the identity of these alignments weighted by length, and coverage was taken to be the total aligned bases over the total APG contig length. If an individual’s raw contig alignments produced an alignment with ≥ 90% identity and ≥ 80% coverage to an APG contig, that APG contig was called as present, and a “1” was included in the matrix (Supplementary Data Set 1).
Additionally, for the placed contigs, because we had already determined which individuals contained these sequences, the genotype matrix was supplemented by adding a presence call (“1”) if we had determined that an individual had a contig in the placement cluster. This additional calling allowed increased sensitivity for individuals who had mate placement information available for the insertion, even when the contigs did not meet the identity/coverage criteria used for this presence/absence genotyping. The “genotype” matrix entries indicate presence/absence calls represented as 1 or 0; heterozygous and homozygous genotypes are not differentiated.
To estimate whether the pan-genome would continue to grow as more individuals were sequenced, we randomly sampled varying numbers of individuals within our dataset and used the genotype matrix to determine, in each subset, how much of the APG sequence was present. Each data point was an average of ten random samplings, each with the same number of individuals. The amount of DNA added to the pan-genome appears to increase approximately linearly as the sample size grows, and has not reached an asymptote with 910 individuals (Supplementary Fig. 4).
We additionally called presence/absence of the APG insertions in 12 individuals from six European populations and 12 individuals from six African populations from the Simons Genome Diversity Project (Supplementary Table 5). We assembled these individual’s contigs from raw read data via the same assembly pipeline used for the CAAPA data and then used the resulting MaSuRCA assembly contigs to make the presence/absence calls.
Comparisons to other genomes. We aligned all APG contigs to two additional genome assemblies: a Chinese genome assembly14 and a Korean genome assembly15. All alignments were performed using bwa-mem with default parameters. Because bwa-mem sometimes found multiple distinct alignments for a contig, the best query-consistent set of alignments for each contig was retained, so no part of an APG contig aligned to more than one location in the reference. The best query-consistent set was determined by comparing the sums of alignment length weighted by percent identity. We then filtered these alignments to these genomes, retaining alignments with an overall identity ≥ 90% that covered ≥ 80% of the contig.
We compared each APG contig’s alignment(s) to the Chinese and Korean genomes to all alignments of the same contig to GRCh38.p10, including patches and alternate loci, obtained as previously described. Among the contigs aligning to the Chinese or Korean genomes, we examined further those with a better alignment (higher identity × coverage) to the Chinese or Korean genome than to GRCh38.p10. We separated these further into two categories, those contigs with a ‘reasonably good’ alignment to GRCh38.p10 (≥ 50% contig coverage and ≥ 80% identity for query-consistent sets of alignments within 1 kb of one another), and those lacking reasonably good alignments to GRCh38.p10.
Code availability. Commands and parameters are included in Supplementary Note 6. Custom scripts used are available upon reasonable request.
Reporting Summary. Further information on research design is available in the Nature Research Reporting Summary linked to this article.
Data availabilityRaw sequence data used for this study are available from dbGaP with accession code phs001123.v1.p1. The African pan-genome contigs have been deposited at GenBank with accession code PDBU00000000. The version described in this paper is version PDBU01000000.
References 29. Langmead, B. & Salzberg, S. L. Fast gapped-read alignment with Bowtie 2.
Nat. Methods 9, 357–359 (2012). 30. Li, H. et al. The Sequence Alignment/Map format and SAMtools.
Bioinformatics 25, 2078–2079 (2009). 31. Zimin, A. V. et al. The MaSuRCA genome assembler. Bioinformatics 29,
2669–2677 (2013). 32. Kim, D., Song, L., Breitwieser, F. P. & Salzberg, S. L. Centrifuge: rapid
and sensitive classification of metagenomic sequences. Genome Res. 26, 1721–1729 (2016).
33. Tarailo-Graovac, M. & Chen, N. Using RepeatMasker to identify repetitive elements in genomic sequences. Curr. Protoc. Bioinformatics Chapter 4, Unit 4.10, (2009).
34. Delcher, A. L., Salzberg, S. L. & Phillippy, A. M. Using MUMmer to identify similar regions in large sequence sets. Curr. Protoc. Bioinformatics Chapter 10, Unit 10.13, (2003).
35. Quinlan, A. R. & Hall, I. M. BEDTools: a flexible suite of utilities for comparing genomic features. Bioinformatics 26, 841–842 (2010).
36. Wood, D. E. & Salzberg, S. L. Kraken: ultrafast metagenomic sequence classification using exact alignments. Genome. Biol. 15, R46 (2014).
NATURE GENETICS | www.nature.com/naturegenetics

1
nature research | life sciences reporting summ
aryJune 2017
Corresponding author(s): Rachel M. Sherman, Steven L. Salzberg
Initial submission Revised version Final submission
Life Sciences Reporting SummaryNature Research wishes to improve the reproducibility of the work that we publish. This form is intended for publication with all accepted life science papers and provides structure for consistency and transparency in reporting. Every life science submission will use this form; some list items might not apply to an individual manuscript, but all fields must be completed for clarity.
For further information on the points included in this form, see Reporting Life Sciences Research. For further information on Nature Research policies, including our data availability policy, see Authors & Referees and the Editorial Policy Checklist.
Experimental design1. Sample size
Describe how sample size was determined. N/A
2. Data exclusions
Describe any data exclusions. N/A
3. Replication
Describe whether the experimental findings were reliably reproduced.
N/A
4. Randomization
Describe how samples/organisms/participants were allocated into experimental groups.
N/A
5. Blinding
Describe whether the investigators were blinded to group allocation during data collection and/or analysis.
N/A
Note: all studies involving animals and/or human research participants must disclose whether blinding and randomization were used.
6. Statistical parameters For all figures and tables that use statistical methods, confirm that the following items are present in relevant figure legends (or in the Methods section if additional space is needed).
n/a Confirmed
The exact sample size (n) for each experimental group/condition, given as a discrete number and unit of measurement (animals, litters, cultures, etc.)
A description of how samples were collected, noting whether measurements were taken from distinct samples or whether the same sample was measured repeatedly
A statement indicating how many times each experiment was replicated
The statistical test(s) used and whether they are one- or two-sided (note: only common tests should be described solely by name; more complex techniques should be described in the Methods section)
A description of any assumptions or corrections, such as an adjustment for multiple comparisons
The test results (e.g. P values) given as exact values whenever possible and with confidence intervals noted
A clear description of statistics including central tendency (e.g. median, mean) and variation (e.g. standard deviation, interquartile range)
Clearly defined error bars
See the web collection on statistics for biologists for further resources and guidance.
SoftwarePolicy information about availability of computer code
7. Software
Describe the software used to analyze the data in this Software used: Bowtie2, MaSuRCA, RepeatMasker, bwa, SAMtools, BEDtools,

2
nature research | life sciences reporting summ
aryJune 2017
study. MUMmer, PopIns, BLAST, Centrifuge, Kraken, IGV. All software listed has been cited in the manuscript.
For manuscripts utilizing custom algorithms or software that are central to the paper but not yet described in the published literature, software must be made available to editors and reviewers upon request. We strongly encourage code deposition in a community repository (e.g. GitHub). Nature Methods guidance for providing algorithms and software for publication provides further information on this topic.
Materials and reagentsPolicy information about availability of materials
8. Materials availability
Indicate whether there are restrictions on availability of unique materials or if these materials are only available for distribution by a for-profit company.
N/A
9. Antibodies
Describe the antibodies used and how they were validated for use in the system under study (i.e. assay and species).
N/A
10. Eukaryotic cell linesa. State the source of each eukaryotic cell line used. N/A
b. Describe the method of cell line authentication used. N/A
c. Report whether the cell lines were tested for mycoplasma contamination.
N/A
d. If any of the cell lines used are listed in the database of commonly misidentified cell lines maintained by ICLAC, provide a scientific rationale for their use.
N/A
Animals and human research participantsPolicy information about studies involving animals; when reporting animal research, follow the ARRIVE guidelines
11. Description of research animalsProvide details on animals and/or animal-derived materials used in the study.
N/A
Policy information about studies involving human research participants
12. Description of human research participantsDescribe the covariate-relevant population characteristics of the human research participants.
N/A