Embed Size (px)
Citation preview

1
23
45
6
Xanthorrhoeoideae
Asphodeloideae
Hemerocallidoideae
Acorus_2Acorus_1
TriglochinAponogeton
Butomus SagittariaAlisma
GymnostachysOrontium
ArisaemaSpathiphyllum
Mon_delJaponolirionAcanthochlamys
TalbotiaVelloziaPandanus
CyclanthusCroomia
Stemona TaccaTrichopus
NartheciumAletris Wurmbea_1
Wurmbea_2CampynemaZigadenus
Trillium EriocaulonTypha
Tillandsia_2Tillandsia_1
Flagellaria Elegia_2Baloskion
Elegia_1Bambusa_1Bambusa_2Kingia
Dasypogon_2Dasypogon_1
MauritiaCalamus
Nypa
PtychospermaCocos
OncospermaRoystoneaRaveneaBorassusLivistona
PhilydrumHydrothrix
MonochoriaEichhornia Anigozanthos
Hanguana_2Hanguana_1Strelitzia
RavenalaPhenakospermum
Heliconia MusaMusella
Ensete_1Ensete_2
CalatheaThaumatococcus
Canna
MarantaMarantochloa
Tapeinochilos
HedychiumGlobba
RiedeliaAlpinia
SiphonochilosDimerocostus
Costus
Clivia_1
Dendrobium
CypripediumSpiranthes
EpipactisBlandfordia_1Bor_sp9696Borya
Milligania Hypoxis
Dor_exc9818Tecophilaea
CyanastrumArthropodium
Iris_1Pat_occ9809
Iris_2 IxiolirionDie_rob9810
XeronemaClivia_2
TulbaghiaAgapanthus
Lom_con9817Lom_mul9815
Lom_gla9857Lom_gla9846Art_9826
Asparagus_1Asparagus_2
Joinvillea
Polygonatum_2DanaeComospermum
DasylirionPolygonatum_1Scilla_2 BowieaHyacinthus
Scilla_1Chlorophytum_1
Chlorophytum_2Anthericum
Hosta100 Chlorogalum
CamassiaYuccaAgave_2Agave_1 Eremurus
Tra_div9706Trachyandra
Bul_gla9825Haworthia
Knipho�aKni_uva9827
100
Xan_aus9833Xan_min9837Xan_mal9807Xan_acau9671Xan_mac9823Xan_pla9935Xan_dru9712Xan_pla_9683Xan_pre9707Xan_dru9997Xan_bre10012Xan_acan10027 Tricoryne
Tri_anc9824CorynothecaCor_mic9791
JohnsoniaCaesia
PasitheaGeitonoplesium
Pho_ten100
100Agrostocrinum
HensmaniaThelionemaThe_cae9819
Rhuacophila100 Sty_gla9702
StypandraDia_rev9699Dia_con9811Dia_cae9814
100
100
100
100
100
100
100
100
100
100
100
100
100
100
100
100
100100 100
100
100100
100100
100
100
100
100
100
100100
100
100
100
100
100
100100
100100100
100
100
100
100
100
100
100
100
99
99
99
99
99
9954
87
83
3147
4555
94
4339
8243 75
5033
9646
85
98
59
6992 48
27
97 5189
8086
86
4451
79
99 59
9287
5191
5163
5592
94
95
79
91
49
9797
89
34
95 80
8252
66
477477
8571
9372
6391
33
95
98
94
53
9642
4142
9994 69
53
0.07
Figure S2. Maximum likelihood phylogeny (best tree) of monocots including Xanthorrhoeaceae (bottom of page, with subfamilies labelled). The tree was derived using RAxML from combined sequences of ndhF and trnL-trnF (cpDNA), showing branch lengths proportional to substitutions per site. The tree is rooted using Acorus, which is the sister group to the rest of monocots. Xanthorrhoeaceae is at bottom of tree, with subfamilies labelled. Branch lengths are proportional to substitutions per site. Labels on branches indicate bootstrap support (some values below 50 have been omitted to minimise clutter near tips). Circled numbers indicate calibration points explained in the text.

Hemerocallidoideae
Xanthorrhoeoideae
Asphodeloideae
Time before present (Ma)
Figure S3. Uncorrelated lognormal clock (UCLN) chronogram of monocots including Xanthorrhoeaceae (bottom of page, subfamilies labelled) and derived from combined partitioned ndhF and trnL-trnF (chloroplast DNA) sequences using BEAST with a Yule tree model. Numbers on branches are are posterior probabilities and blue node bars are 95% BCIs of node height posterior estimates. The scale indicates time before present (Ma).

X. lat 9835 copy 2
X. acau 9671 copy1
X. gla 9821 clone 6
X. aus 9860 a1
X. gra 10024 clone 22
X. acau 9671 copy 2
X. pla 9935 clone 1
X. tho 9784 clone 3
X. aus 9833
X. cae 9802 copy 2
X. sem 9800
X. cae 9802 copy 1
X. arb 9808 clone 4
X. arb 9808 clone 5
X. bre 10012 clone 5
X. dru 9712
X. med 9812 clone 1
X. res 9828 copy 1
X. res 9828 copy 2
X. con 9838 a1
X. con 9845 clone 5
X. ful 00323 clone 5
X. nan 9687 copy 1
X. bru 9813 copy 2
X. pre 9707
X. tho 9874 clone 2
X. joh 10238 clone 17
X. mal 9807 copy 2
X. joh 10173
X. ful 9831 copy 1
X. aca 10027 c8
X. bru 9710 clone 22
X. aca 10027 c1a
X. gla 9680 clone 3
X. lat 9834
X. pre 9701 clone 29
X. dru 9714 clone 4
X. nan 9687 copy 2
X. qua 9668
X. pum 10250 copy 1
X. min 9837 copy 1
X. min 9837 copy 2
X. mac 310
X. mac 9823
X. gra 9829 copy 1
Pho ten c3
Cor mic 9791 d
Cor mic 9791
Pho ten c2
Bul gla 9825 c2Bul gla 9825 c5
Bul gla 9825 d
Tra div 9706
Kni uva 9827
Art. sp. 9826
Xanthorrhoeoideae
Asphodeloideae
Hem
erocallidoideae
Figure S4. Maximum likelihood phylogeny of Xanthorrhoeaceae, derived using RAxML from sequences of rpb2 (nDNA), showing branch lengthsproportional to substitutions per site. The tree is rooted using Arthropodium (Art. sp. 9826) from the sister group, Asparagaceae. Clade labels with bars indicate subfamilies. Labels on branches indicate bootstrap support (most values within Xanthorrhoea have been omitted to minimiseclutter.

Lom con 9817
Lom mul 9815
Xanthorrhoeoideae
Asphodeloideae
Hem
erocallidoideae
X. dru 9712
X. pla 9683
X. pla 9335
X. pre 9707
Agrostocrinum
X. acan 10027
X. dru 9997
X. bre 10012
X. mal 9807
X. acau 9671
X. aus 9833
X. min 9837
X. mac 9823
Tra div 9706
Trachyandra
Eremurus
Knipho�a
Kni uva 9827
Bul gla 9825
Haworthia
Stypandra
Sty gla 9702
Rhuacophila
Thelionema
The cae 9819
Dia cae 9814
Dia con 9811
Dia rev 9699
Pho ten
Pasithea
Corynotheca
Cor mic 9791
Caesia
Johnsonia
Geitonoplesium
Hem litt
Lom gla 9846
Lom gla 9857
Figure S5. Maximum likelihood phylogeny of Xanthorrhoeaceae, derived using RAxML from combined partitioned ndhF and trnL-trnF (chloroplast DNA) sequences, showing branch lengths proportional to substitutions per site. The tree is rooted using Lomandra species from the sister group, Asparagaceae. Clade labels with bars indicate subfamilies. Labels on branches show bootstrap support (mostvalues within Xanthorrhoea have been omitted to reduce clutter.

X. dru 9712
X. pla 9683
X. pla 9335
X. pre 9707
Agrostocrinum
X. acan 10027
X. dru 9997
X. bre 10012
X. mal 9807
X. acau 9671
X. aus 9833
X. min 9837
X. mac 9823
Tra div 9706
Trachyandra
Eremurus
Knipho�a
Kni uva 9827
Bul gla 9825
Haworthia
Stypandra
Sty gla 9702
Rhuacophila
Thelionema
The cae 9819
Dia cae 9814
Dia con 9811
Dia rev 9699
Pho ten
Pasithea
Corynotheca
Cor mic 9791
Caesia
Johnsonia
Geitonoplesium
Hem litt
Estimated age (Ma)
80 70 0104060 50 30 20
XanthorrhoeoideaeA
sphodeloideaeH
emerocallidoideae
Figure S6. UCLN chronogram of Xanthorrhoeaceae derived from combined ndhF and trnL-trnF using BEAST with a Yule tree model. Branches are colored by median clock rates: red = fastest, blue = slowest, orange and green = intermediate. Clade labels with bars indicate subfamilies. The scale indicates time before present (Ma).

XanthorrhoeoideaeA
sphodeloideae
Hem
erocallidoideae
Estimated age (Ma)
?
?
X. lat 9835 copy 2X. acau 9671 copy1X. gla 9821 clone 6X. aus 9860 a1
X. gra 10024 clone 22
X. acau 9671 copy 2X. pla 9935 clone 1X. tho 9784 clone 3X. aus 9833X. cae 9802 copy 2
X. cae 9802 copy 1
X. arb 9808 clone 4X. arb 9808 clone 5
X. bre 10012 clone 5X. dru 9712X. med 9812 clone 2X. res 9828 copy 1X. res 9828 copy 2X. con 9838 a1X. con 9845 clone 5X. ful 00323 clone 5X. nan 9687 copy 1X. bru 9813 copy 2X. pre 9707X. tho 9874 clone 2X. joh 10238 clone 17X. mal 9807 copy 2X. joh 10173X. ful 9831 copy 1X. aca 10027 c8X. bru 9710 clone 22X. aca 10027 c1aX. gla 9680 clone 3X. lat 9834X. pre 9701 clone 29X. dru 9714 clone 4X. nan 9687 copy 2X. qua 9668X. pum 10250 copy 1X. min 9837 copy 1X. min 9837 copy 2X. mac 310X. mac 9823X. gra 9829 copy 1
Pho ten c3Cor mic 9791 dCor mic 9791Pho ten c2Bul gla 9825 c2Bul gla 9825 c5Bul gla 9825 dTra div 9706Kni uva 9827
X. sem 9800
Figure S7. RLC chronogram of Xanthorrhoeaceae derived from sequences of rpb2 (nuclear DNA) using BEAST with Yule tree model. Branches are colored by inferred local clock rates in the exons partition: red = fast, blue = slow. Pointers show the two inferred rate shifts: one downwards in the MRCA of Xanthorrhoeoideae (�lled pointer), followed by a second shift (open pointers), which was either a further downward shift in the stem of the large upper clade or a small upward shift in the stem of the X. macronema + X. gracilis clade. Clade labels with bars indicate subfamilies. The scale indicates time before present (Ma).

Estimated age (Ma)
80 70 0104060 50 30 20
X. lat 9835 copy 2
X. acau 9671 copy1
X. gla 9821 clone 6
X. aus 9860 a1
X. gra 10024 clone 22
X. acau 9671 copy 2
X. pla 9935 clone 1X. tho 9784 clone 3
X. aus 9833
X. cae 9802 copy 2
X. sem 9800
X. cae 9802 copy 1
X. arb 9808 clone 4
X. arb 9808 clone 5
X. bre 10012 clone 5
X. dru 9712
X. med 9812 clone 1X. res 9828 copy 1
X. res 9828 copy 2
X. con 9838 a1
X. con 9845 clone 5
X. ful 00323 clone 5
X. nan 9687 copy 1X. bru 9813 copy 2
X. pre 9707
X. tho 9874 clone 2
X. joh 10238 clone 17
X. mal 9807 copy 2
X. joh 10173
X. ful 9831 copy 1
X. aca 10027 c8
X. bru 9710 clone 22
X. aca 10027 c1a
X. gla 9680 clone 3X. lat 9834
X. pre 9701 clone 29
X. dru 9714 clone 4
X. nan 9687 copy 2
X. qua 9668
X. pum 10250 copy 1X. min 9837 copy 1
X. min 9837 copy 2
X. mac 310
X. mac 9823
X. gra 9829 copy 1
Pho ten c3
Cor mic 9791 d
Cor mic 9791Pho ten c2
Bul gla 9825 c2
Bul gla 9825 c5
Bul gla 9825 dTra div 9706
Kni uva 9827
XanthorrhoeoideaeA
sphodeloideaeH
emerocallidoideae
Figure S8. RLC chronogram of Xanthorrhoeaceae derived from sequences of rpb2 (nDNA) using BEAST with a Birth-death tree model. Unlike other analyses of either dataset using the RLC clock, this one inferred a young age for the Xanthorrhoea crown (5.0 Ma). However, the model combination including a Yule clock was very strongly preferred for this dataset in Bayes factor tests. Branches are colored by inferred local clock rates in the introns partition: red = fast, blue = slow. The pointer shows the single inferred rate shift (downwards), which occurred in the MRCA of Xanthorrhoea. Clade labels with bars indicate subfamilies. The scale indicates time before present (Ma).

X. lat 9835 copy 2
X. acau 9671 copy1
X. gla 9821 clone 6X. aus 9860 a1
X. gra 10024 clone 22
X. acau 9671 copy 2
X. pla 9935 clone 1X. tho 9784 clone 3
X. aus 9833
X. cae 9802 copy 2X. sem 9800X. cae 9802 copy 1
X. arb 9808 clone 4X. arb 9808 clone 5
X. bre 10012 clone 5
X. dru 9712
X. med 9812 clone 1X. res 9828 copy 1
X. res 9828 copy 2
X. con 9838 a1X. con 9845 clone 5
X. ful 00323 clone 5
X. nan 9687 copy 1X. bru 9813 copy 2
X. pre 9707
X. tho 9874 clone 2
X. joh 10238 clone 17
X. mal 9807 copy 2X. joh 10173
X. ful 9831 copy 1
X. aca 10027 c8
X. bru 9710 clone 22
X. aca 10027 c1a
X. gla 9680 clone 3X. lat 9834
X. pre 9701 clone 29X. dru 9714 clone 4
X. nan 9687 copy 2X. qua 9668
X. pum 10250 copy 1X. min 9837 copy 1
X. min 9837 copy 2
X. mac 310X. mac 9823
X. gra 9829 copy 1
Pho ten c3Cor mic 9791 dCor mic 9791Pho ten c2Bul gla 9825 c2Bul gla 9825 c5Bul gla 9825 dTra div 9706Kni uva 9827
Estimated age (Ma)
70 0104060 50 30 20
XanthorrhoeoideaeA
sphodeloideaeH
emerocallidoideae
Figure S9. RLC chronogram of Xanthorrhoeaceae derived from sequences of rpb2 (nDNA) using BEAST with a Birth-death tree model. Unlike other analyses of either dataset using the RLC clock, this one inferred a young age for the Xanthorrhoea crown (5.0 Ma). However, the model combination including a Yule clock was very strongly preferred for this dataset in Bayes factor tests. Branches are colored by inferred local clock rates in the exons partition: red = fast, blue = slow, i.e. in the exons, there is essentially no rate variation and the rate is much slower than in the introns. Clade labels with bars indicate subfamilies. The scale indicates time before present (Ma).

X. lat 9835 copy 2
X. acau 9671 copy1
X. gla 9821 clone 6
X. aus 9860 a1
X. gra 10024 clone 22
X. acau 9671 copy 2
X. pla 9935 clone 1
X. tho 9784 clone 3
X. aus 9833
X. cae 9802 copy 2X. sem 9800X. cae 9802 copy 1
X. arb 9808 clone 4X. arb 9808 clone 5
X. bre 10012 clone 5
X. dru 9712
X. med 9812 clone 1
X. res 9828 copy 1X. res 9828 copy 2
X. con 9838 a1
X. con 9845 clone 5X. ful 00323 clone 5
X. nan 9687 copy 1
X. bru 9813 copy 2
X. pre 9707
X. tho 9874 clone 2
X. joh 10238 clone 17
X. mal 9807 copy 2X. joh 10173
X. ful 9831 copy 1
X. aca 10027 c8
X. bru 9710 clone 22X. aca 10027 c1a
X. gla 9680 clone 3
X. lat 9834
X. pre 9701 clone 29X. dru 9714 clone 4
X. nan 9687 copy 2
X. qua 9668
X. pum 10250 copy 1
X. min 9837 copy 1
X. min 9837 copy 2
X. mac 310X. mac 9823
X. gra 9829 copy 1
Pho ten c3Cor mic 9791 dCor mic 9791Pho ten c2Bul gla 9825 c2
Bul gla 9825 c5Bul gla 9825 dTra div 9706Kni uva 9827
XanthorrhoeoideaeA
sphodeloideaeH
emerocallidoideae
Estimated age (Ma)
80 70 0104060 50 30 20
Fig S8 rpb2 introns UCLN Yule
Figure S10. UCLN chronogram of Xanthorrhoeaceae derived from sequences of rpb2 (nDNA) using BEAST with a Yule tree model. Branches are colored by median clock rates in the introns partition: red = fastest, blue = slowest, orange and green = intermediate. Clade labels with bars indicate subfamilies. The scale indicates time before present (Ma).
Rate
(site
-1 M
a-1 x
104 )
a) cpDNA UCLN Yule
d) cpDNA RLC Yule
b) rpb2 exons UCLN Yule
e) rpb2 exons RLC Yule
b) rpb2 introns UCLN Yule
f ) rpb2 introns RLC Yule
20
15
10
5
0
20
15
10
5
0
20
15
10
5
0
20
15
10
5
0
100
50
0
100
50
0
Monocots Xanthstem
Xanthcrown
Hem Asph(outgroups)
Xanthstem
Xanthcrown
Hem Asph(outgroups)
Xanthstem
Xanthcrown
Hem Asph(outgroups)
Xanthstem
Xanthcrown
Hem Asph(outgroups)
Xanthstem
Xanthcrown
Hem Asph(outgroups)
Xanthstem
Xanthcrown
Hem Asph(outgroups)
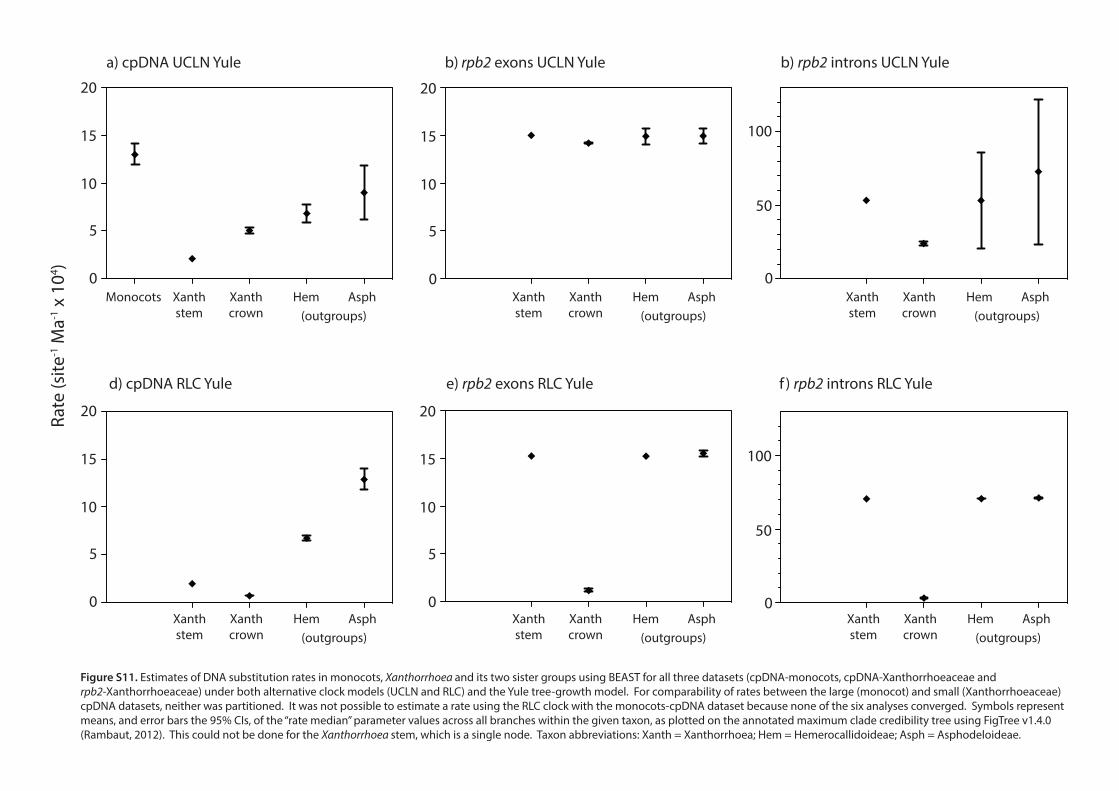
Figure S11. Estimates of DNA substitution rates in monocots, Xanthorrhoea and its two sister groups using BEAST for all three datasets (cpDNA-monocots, cpDNA-Xanthorrhoeaceae and rpb2-Xanthorrhoeaceae) under both alternative clock models (UCLN and RLC) and the Yule tree-growth model. For comparability of rates between the large (monocot) and small (Xanthorrhoeaceae) cpDNA datasets, neither was partitioned. It was not possible to estimate a rate using the RLC clock with the monocots-cpDNA dataset because none of the six analyses converged. Symbols represent means, and error bars the 95% CIs, of the “rate median” parameter values across all branches within the given taxon, as plotted on the annotated maximum clade credibility tree using FigTree v1.4.0 (Rambaut, 2012). This could not be done for the Xanthorrhoea stem, which is a single node. Taxon abbreviations: Xanth = Xanthorrhoea; Hem = Hemerocallidoideae; Asph = Asphodeloideae.

0 1 2 3 4 5 6 7 8 9
0 1 2 3 4 5 6
0 1 2 3 4 5
cpDNA
rpb2 exons
rpb2 introns
Prob
abili
ty
Number of rate shifts
0.6
0.4
0.2
0.0
0.6
0.4
0.2
0.0
0.6
0.4
0.2
0.0
0.8Prior 95% BCIPrior tailPosterior 95% BCIPosterior tail
Figure S12. Prior and posterior distributions of number of rate shifts inferred by RLC clock analyses using BEAST from cpDNA and rpb2 sequences. The lack of overlap by the 95% Bayesian credibility intervals (BCIs) indicates rejection of the prior hypothesis of no rate shifts under a strict clock. Additionally, Fisher exact tests indicate that each pair of prior and posterior distributions is signi�cantly di�erent (P = 0.0000).

![t y r r s - RUN: Página principal · À ] ] 1e / 'z /d edk^ x x x x x x x x x x x x x x x x x x x x x x x x x x x x x x x x x x x x x x x x x x x x x x x x x x x x x x x x x x x](https://img.pdfslide.us/doc/110x75/5baf4cc109d3f2c70e8c393e/-t-y-r-r-s-run-pagina-principal-a-1e-z-d-edk-x-x-x-x-x-x-x-x.jpg)


![GEF report to UNCCD COP 14 - SPANISH version...1 v ] ^/'> ^ z z s/ dhz ^ x x x x x x x x x x x x x x x x x x x x x x x x x x x x x x x x x x x x x x x x x x x x x x x x x x x x x x](https://img.pdfslide.us/doc/110x75/5ff3ad7eea16862f7a672c4b/gef-report-to-unccd-cop-14-spanish-version-1-v-z-z-s-dhz-x.jpg)

![æ ò Y - WKO.at9714]-NEKP... · ï d ] o í x x x x x x x x x x x x x x x x x x x x x x x x x x x x x x x x x x x x x x x x x x x x x x x x x x x x x x x x x x x x x x x x x x x](https://img.pdfslide.us/doc/110x75/5fbaf04dd150160874293c04/-y-wkoat-9714-nekp-d-o-x-x-x-x-x-x-x-x-x-x-x-x-x-x-x-x-x-x.jpg)


![netlusa.comnetlusa.com/desbravadores.pt/images/MANUAIS/Manual_Caes.pdf · ï } / v } µ ] } x x x x x x x x x x x x x x x x x x x x x x x x x x x x x x x x x x x x x x x x x x x x](https://img.pdfslide.us/doc/110x75/5be3717009d3f20a668b6378/-i-v-x-x-x-x-x-x-x-x-x-x-x-x-x-x-x-x-x-x-x-x-x-x-x-x-x-x-x-x-x.jpg)