Embed Size (px)
Citation preview
ASPEN-AND-ESPEN: A postacute-care comparison of the basic definition of
malnutrition from the American Society of Parenteral and Enteral Nutrition and
Academy of Nutrition and Dietetics with the European Society for Clinical
Nutrition and Metabolism definition
Dolores Sánchez-Rodríguez, MD PhD 1-4
; Ester Marco, MD PhD2,3,5,6
; Natalia
Ronquillo-Moreno, MD1; Liev Maciel-Bravo, MD
1; Abel Gonzales-Carhuancho, MD
5;
Xavier Duran MStat, PhD7; Anna Guillén-Solà, MD PhD
2,3,5; Olga Vázquez-Ibar, MD
PhD1,4
; Ferran Escalada, MD PhD2,3,5
; Josep M Muniesa, MD PhD2,3,5
1. Geriatrics Department. Parc de Salut Mar (Centre Fòrum – Hospital del Mar),
Barcelona, Spain
2. Rehabilitation Research Group. Institut Hospital del Mar d’ Investigacions Mèdiques
(IMIM), Barcelona, Spain
3. School of Medicine, Universitat Autònoma de Barcelona, Spain
4. School of Medicine, Universitat Pompeu Fabra, Barcelona, Spain
5. Physical Medicine and Rehabilitation Department. Parc de Salut Mar (Hospital del
Mar – Hospital de l’Esperança), Barcelona, Spain
6. Universitat Internacional de Catalunya, Barcelona, Spain
7. Methodology and Biostatistics Support Unit, Institut Hospital del Mar d’
Investigacions Mèdiques (IMIM), Barcelona, Spain
Corresponding author: Dolores Sánchez-Rodríguez, MD PhD.
Geriatrics Department, Centro Fòrum – Hospital del Mar, Parc Salut Mar
C/ Llull 410. 08019 Barcelona (Spain)
*ManuscriptClick here to view linked References
1
ASPEN-AND-ESPEN: A postacute-care comparison of the basic definition of 1
malnutrition from the American Society of Parenteral and Enteral Nutrition and 2
Academy of Nutrition and Dietetics with the European Society for Clinical 3
Nutrition and Metabolism definition 4
5
Abbreviations 6
AND: Academy of Nutrition and Dietetics 7
ASPEN: American Society of Parenteral and Enteral Nutrition 8
BMI: Body mass index 9
ESPEN: European American Society of Parenteral and Enteral Nutrition 10
FFMI: Fat-free mass index 11
k: kappa statistics 12
MNA-SF: Mini-Nutritional Assessment Short Form 13
REI: Rehabilitation efficiency index 14
RFG: Relative functional gain 15
*Manuscript (including track changes)
2
INTRODUCTION 16
Malnutrition is a highly prevalent condition related to adverse clinical outcomes in 17
hospitalized older patients, such as longer length of stay, mortality (1), and higher costs 18
(2). Malnutrition is bidirectionally linked to mobility and disability (3), and therefore, to 19
poor functional outcomes in rehabilitation programs (3)(4)(5). Early identification and 20
management of malnutrition can counteract this negative influence, leading to better 21
functional prognosis and shorter length of stay (5). 22
In the absence of a standardized diagnostic method, clinicians have been assessing 23
malnutrition with several tools (6)(7). The largest parenteral and enteral societies have 24
proposed diagnostic criteria, but a unified consensus suitable to all populations and 25
settings worldwide is still a challenge for the scientific community (8)(9)(10)(11).The 26
ASPEN/AND definition and ESPEN criteria are among the most widely extended 27
approaches. In 2012, ASPEN/AND proposed a set of six clinical criteria: reduced 28
energy intake, unintentional weight loss, loss of subcutaneous fat, loss of muscle mass, 29
fluid accumulation, and reduced grip strength (11). More recently, ESPEN launched a 30
new consensus statement for patients at risk of malnutrition, which combines weight 31
loss with either age-related body mass index (BMI) or fat-free mass index (FFMI) as a 32
second alternative to low BMI (<18.5 kg/m2) (8). This consensus was further completed 33
with the ESPEN guidelines on definitions and terminology of clinical nutrition (12). 34
Given that knowledge of the potential relationships between these two definitions might 35
provide an evidence-based approach to key components of malnutrition, the aim of this 36
study was to assess the prevalence of malnutrition in postacute patients, applying both 37
ASPEN/AND and ESPEN definitions; and secondly, to determine the metrological 38
properties of the ASPEN/AND basic diagnosis in comparison with the ESPEN 39

3
consensus. 40
4
METHODS 41
Prospective cohort study, reported according to the Strengthening the Reporting of 42
Observational Studies in Epidemiology (STROBE) Statement (13). The study was 43
conducted in a postacute care unit focused on comprehensive geriatric assessment and 44
rehabilitation (14) in a university hospital in Barcelona (Catalonia, Spain) in a six-45
month period June-December 2016. 46
Participating patients were aged ≥70 years with functional impairment due to a non-47
disabling medical disease, admitted to postacute care for rehabilitation. Patients whose 48
cognitive status (Mini-Mental Status Examination <21/30) and/or general condition 49
prevented completion of the diagnostic tests and/or active physical rehabilitation 50
program were excluded. 51
The main outcome variable was malnutrition according to both the ASPEN/AND and 52
ESPEN malnutrition criteria. ASPEN/AND diagnosis of malnutrition considers the 53
presence of at least two of the following factors: low energy intake, fluid accumulation, 54
diminished handgrip strength, and loss of weight, muscle mass or subcutaneous fat; 55
distinguishes between severe and non-severe malnutrition; these characteristics vary 56
according to care settings for acute or chronic illness and social or environmental 57
circumstances (11). Food intake was estimated by plate waste (%) during hospital stay 58
and categorized as “yes” when food intake was <75% of estimated energy requirement 59
for >7 days, and “no” otherwise. Unintentional weight loss was obtained by patient 60
and caregiver anamnesis and medical records documenting weight loss of at least 5% in 61
the previous month (during the acute illness). Muscle mass and fat mass in Kg were 62
estimated by bioimpedance (Bodystat 1500, Bodystat Ltd., Isle of Man British Isles) as 63
previously described (15)(16)(14) and compared with those of the European reference 64
5
population (17). Water content, expressed in liters (L), was also measured by 65
bioimpedance analysis and compared with values of same-aged healthy controls. 66
Handgrip strength, expressed in Kg and as a percentage of the reference population 67
values (18), was measured by a hand-held dynamometer (JAMAR, Nottinghamshire, 68
UK) (19). For purpose of analysis, the highest value of three reproducible isometric 69
contractions of finger flexor muscles (<10% variability between values) was used. 70
Values of body composition and muscle strength less than 80% of the reference data, 71
adjusted for sex and age, were considered decreased. 72
The ESPEN basic diagnosis required identification by any validated screening tool of 73
patients at nutritional risk; scores≤11 in the Mini-Nutritional Assessment Short Form 74
(MNA-SF) were used in this study (20). The two alternative ways to diagnose 75
malnutrition proposed by the ESPEN criteria are BMI <18.5 Kg/m2 (alternative 1) and 76
unintentional weight loss (>10% indefinite of time, or >5% in the last three months) 77
combined with age-related BMI (BMI <20 kg/m2 in <70 years, or <22 kg/m
2 in ≥70 78
years) or FFMI (<17 kg/m2 in men and <15 kg/m
2 in women). FFMI was obtained by 79
dividing the fat-free mass (Kg) by the square of the height. 80
Other outcome variables were the indexes that determine the overall value of a 81
diagnostic method: sensitivity, specificity, positive predictive value, negative and 82
negative predictive values, positive likelihood ratio, and accuracy index. The cut-off 83
points for validity were sensitivity or specificity <50% (poor validity); sensitivity or 84
specificity <80% but both values >50% (fair validity); and sensitivity and specificity 85
>80% (good validity) (21)(7). Concordance between the ESPEN consensus and 86
ASPEN/AND basic diagnosis was determined with kappa (k) statistics: k <0 (no 87
agreement), 0-0.2 (poor agreement), 0.21-0.4 (fair agreement), 0.41-0.6 (moderate 88
6
agreement), 0.61-0.8 (substantial agreement), and 0.81-1 (almost perfect agreement) 89
(21)(22). 90
Demographic and clinical characteristics included age, sex, Charlson comorbidity index, 91
cognitive (Short Portable Mental Status Questionnaire), functional status by 92
instrumental (Lawton index) and basic (Barthel index) activities of daily living. 93
Changes in the functional status during hospitalization were assessed with the 94
rehabilitation impact indexes: rehabilitation efficiency index [REI = (Barthel index at 95
discharge – Barthel index at admission) / (length of hospital stay)], and the relative 96
functional gain [RFG = (Barthel index at discharge – Barthel index at admission) / 97
(Barthel index premorbid – Barthel index at admission) × 100] (4)(23). A 10-ml venous 98
blood sample was collected from all patients under standardized conditions between 7 99
and 9 am, at rest and following an overnight fast to determine total proteins, serum 100
albumin, and cholesterol levels. 101
National and international research ethics guidelines (24), including the Deontological 102
Code of Ethics, Declaration of Helsinki, and Spain's confidentiality law concerning 103
personal data were followed. Understandable oral and written information was provided 104
to family members and patients, and informed consent to participate was signed by all 105
participants. The institution's Clinical Ethics Committee approved the informed consent 106
process used and the study. 107
Statistical analysis 108
Descriptive analysis of the sample used means with standard deviations for quantitative 109
continuous variables, and percentages and frequency distributions for categorical 110
variables. Sensitivity, specificity, positive and negative predictive values, positive 111
likelihood ratio, and accuracy index were described in percentages. In the case of 112
7
quantitative variables, the assumption of normality was analyzed through normal 113
probability graphs and using the Kolmogorov–Smirnov test corrected by the Lilliefors 114
test. Contingency tables were used to calculate the reliability indexes of ASPEN/AND 115
basic diagnosis compared with ESPEN malnutrition basic diagnosis. Each 2×2 116
contingency table contains two rows (positive or negative) for each diagnostic method. 117
Univariate analysis was performed using Chi-square test for categorical variables; in the 118
Student t-test for independent samples, mean differences with 95% confidence intervals 119
(95%CI) were used for continuous variables. P value <0.05 was considered statistically 120
significant. Analysis was performed using IBM SPSS Statistics 22 (IBM Corporation, 121
SPSS, INC., Chicago, IL, USA). 122
8
RESULTS 123
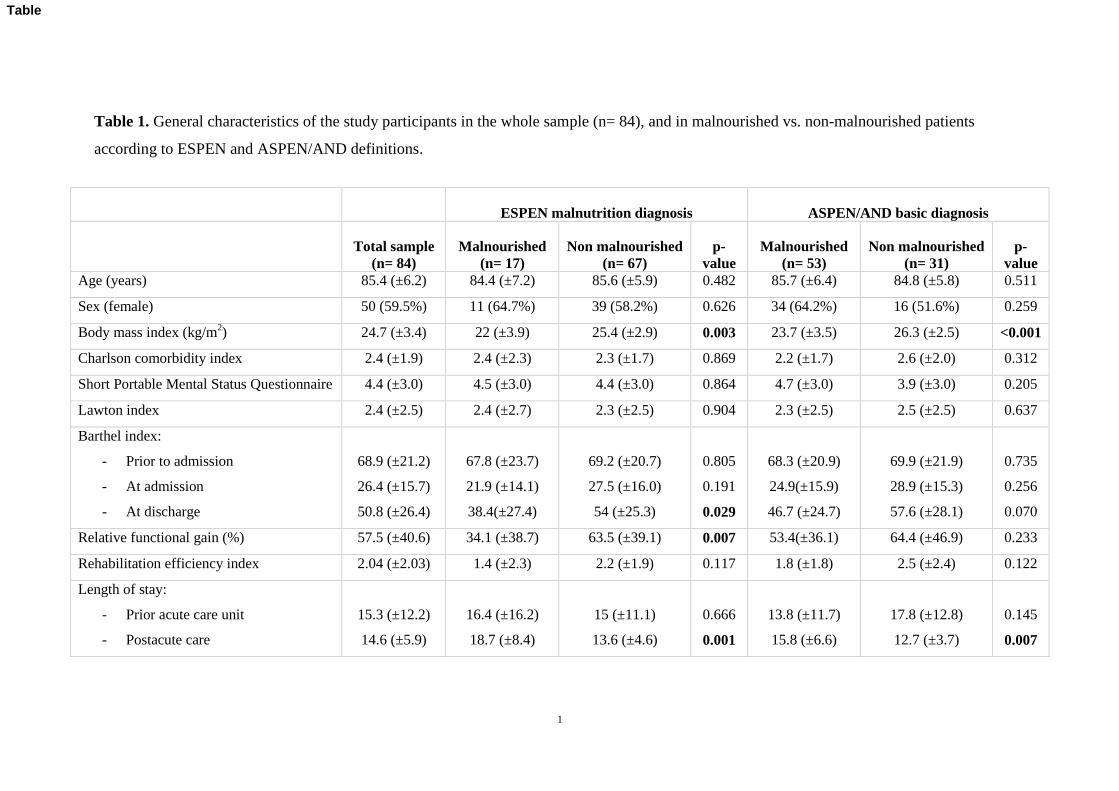
Among 84 patients (aged 85.4±6.2; 59.5% women) who fulfilled inclusion criteria, all 124
of them were identified as being “at risk” of malnutrition (MNA-SF scores ≤11). Table 125
1 shows the general and geriatric assessment results in the whole sample, and in 126
malnourished and non-malnourished patients according to both ESPEN and 127
ASPEN/AND definitions. Patients without malnutrition presented shorter length of stay 128
in postacute care, independently of the criteria used for the diagnosis: mean differences 129
5.1 (95%CI 0.7 to 9.5) by ESPEN and 3.1 (95%CI 0.5 to 5.7) by ASPEN/AND. Patients 130
identified as malnourished by both ESPEN approaches had worse functional status after 131
the rehabilitation process: mean differences of Barthel index at discharge and relative 132
functional gain were 15.5 (95%CI 1.6 to 29.5), and 29.5 (95%CI 8.4 to 50.6), 133
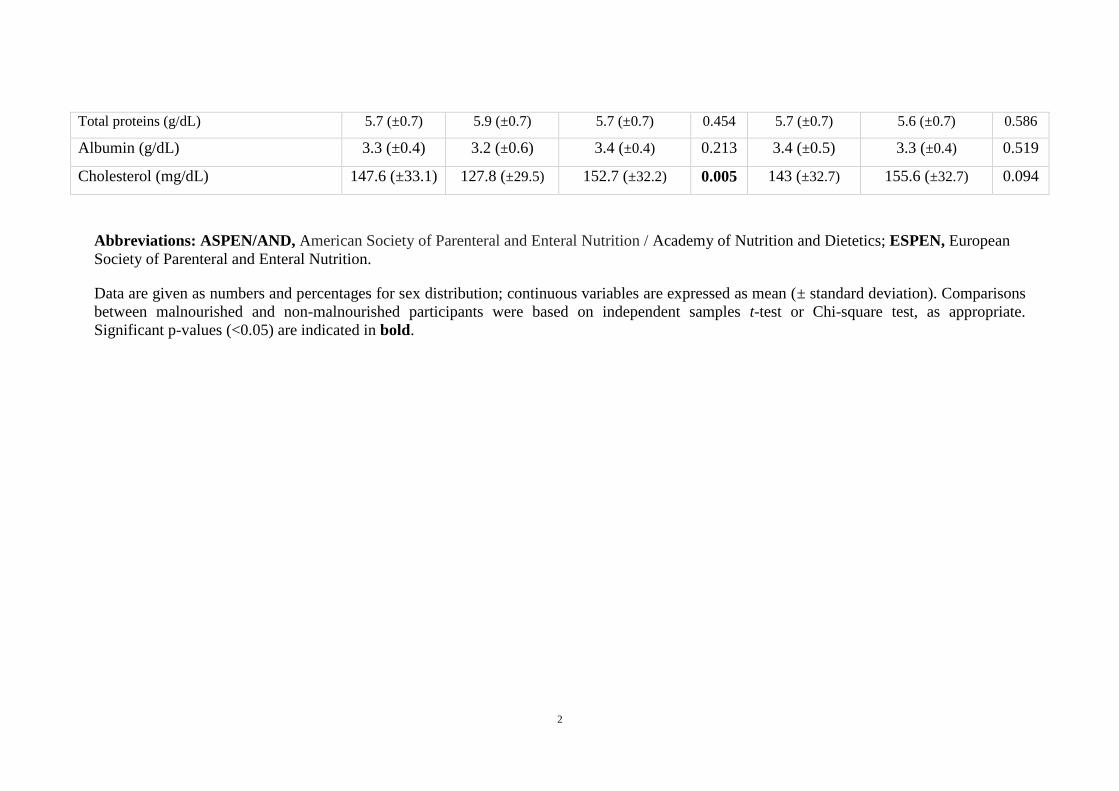
respectively. No statistical differences between the definitions were observed in total 134
proteins and serum albumin levels between patients with or without malnutrition. 135
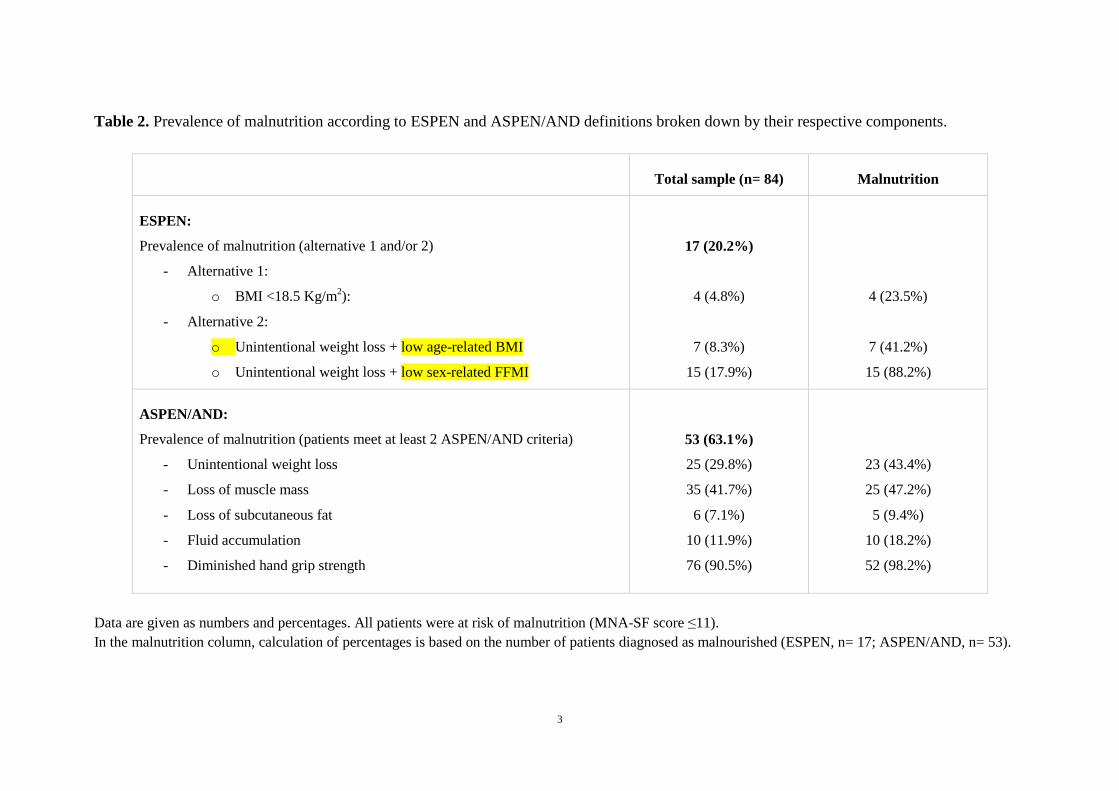
The prevalence of malnutrition was 20.2%, according to ESPEN basic diagnosis, and 136
63.1% when ASPEN/AND diagnosis of malnutrition was applied, as shown in Table 2. 137
Unintentional weight loss combined with low FFMI was the ESPEN diagnostic 138
alternative that identified a higher number of malnourished patients (15/17); likewise, 139
loss of handgrip strength was the ASPEN/AND component most frequently present in 140
patients with malnutrition (52/53). 141
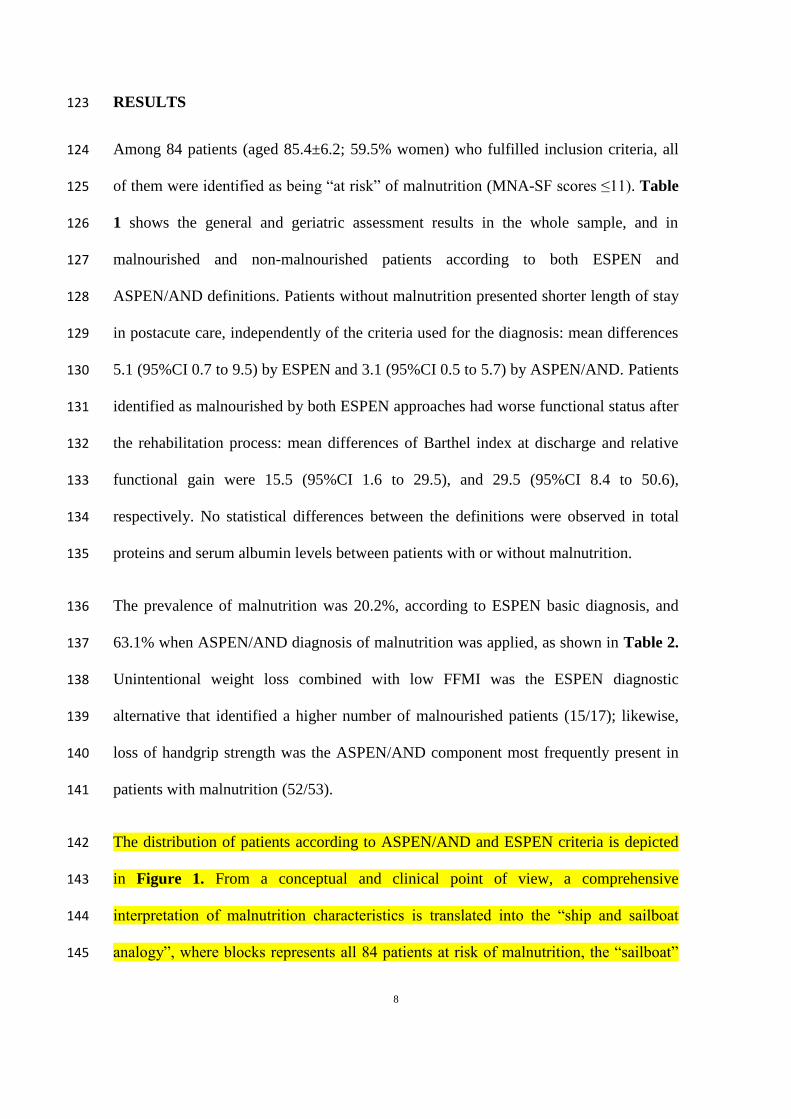
The distribution of patients according to ASPEN/AND and ESPEN criteria is depicted 142
in Figure 1. From a conceptual and clinical point of view, a comprehensive 143
interpretation of malnutrition characteristics is translated into the “ship and sailboat 144
analogy”, where blocks represents all 84 patients at risk of malnutrition, the “sailboat” 145
9
shape shows patients fulfilling ESPEN criteria and the larger “ship” encompasses 146
patients fulfilling the less restrictive ASPEN/AND criteria. 147
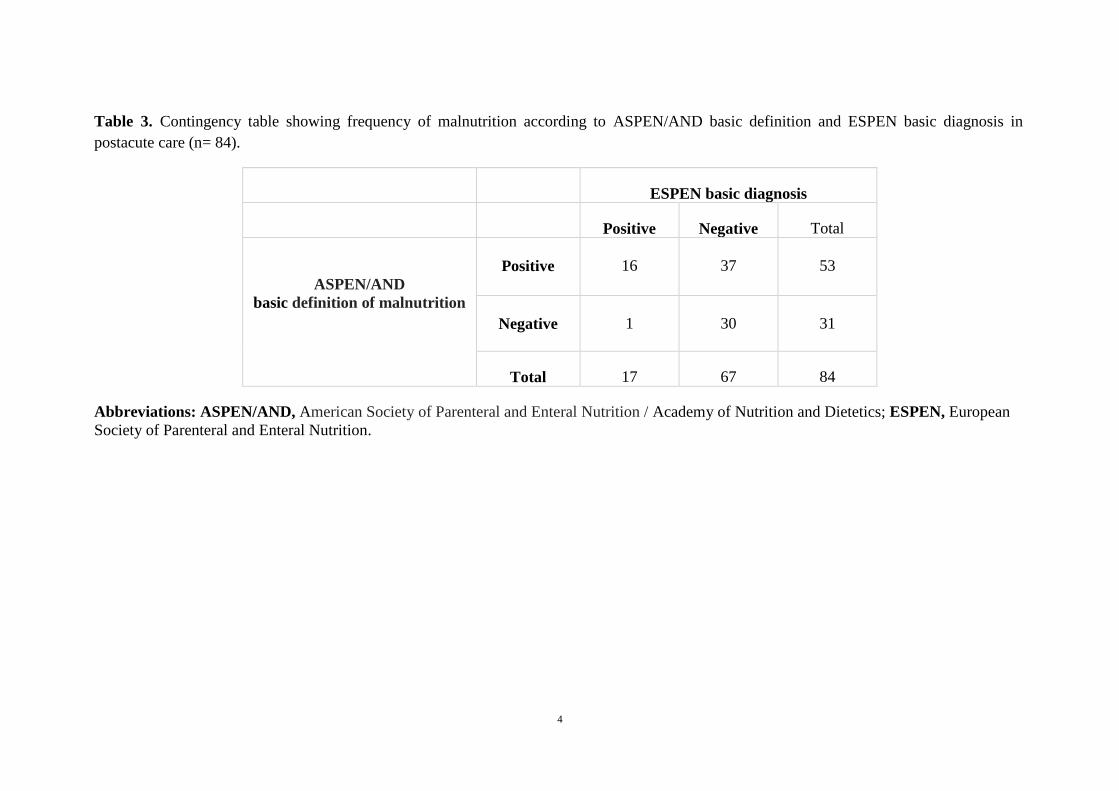
Table 3 is a contingency table comparing the distribution of ASPEN/AND basic 148
definition and ESPEN basic diagnosis. Metrological properties of the ASPEN basic 149
definition of malnutrition compared with ESPEN basic diagnosis are summarized in 150
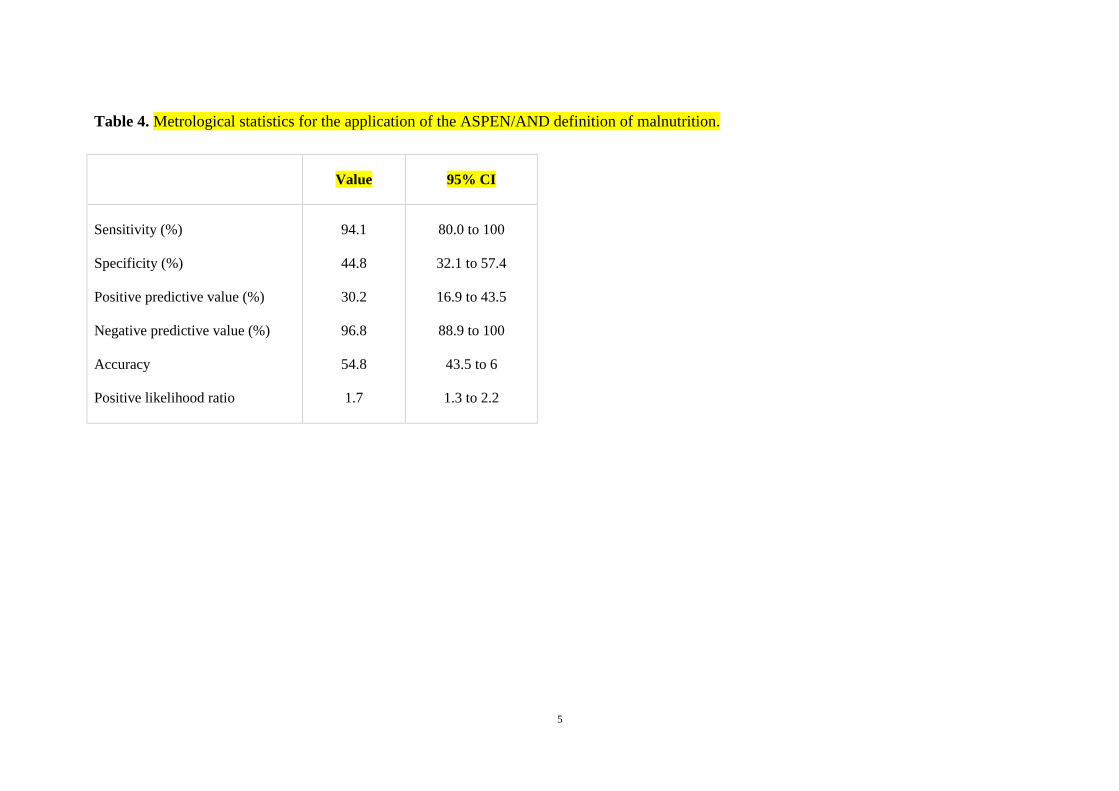
Table 4. Sensitivity and specificity of ASPEN/AND basic diagnosis were 94.1% and 151
44.8%, respectively, indicating fair validity. The agreement between both definitions of 152
malnutrition was fair (k= 0.217). 153
10
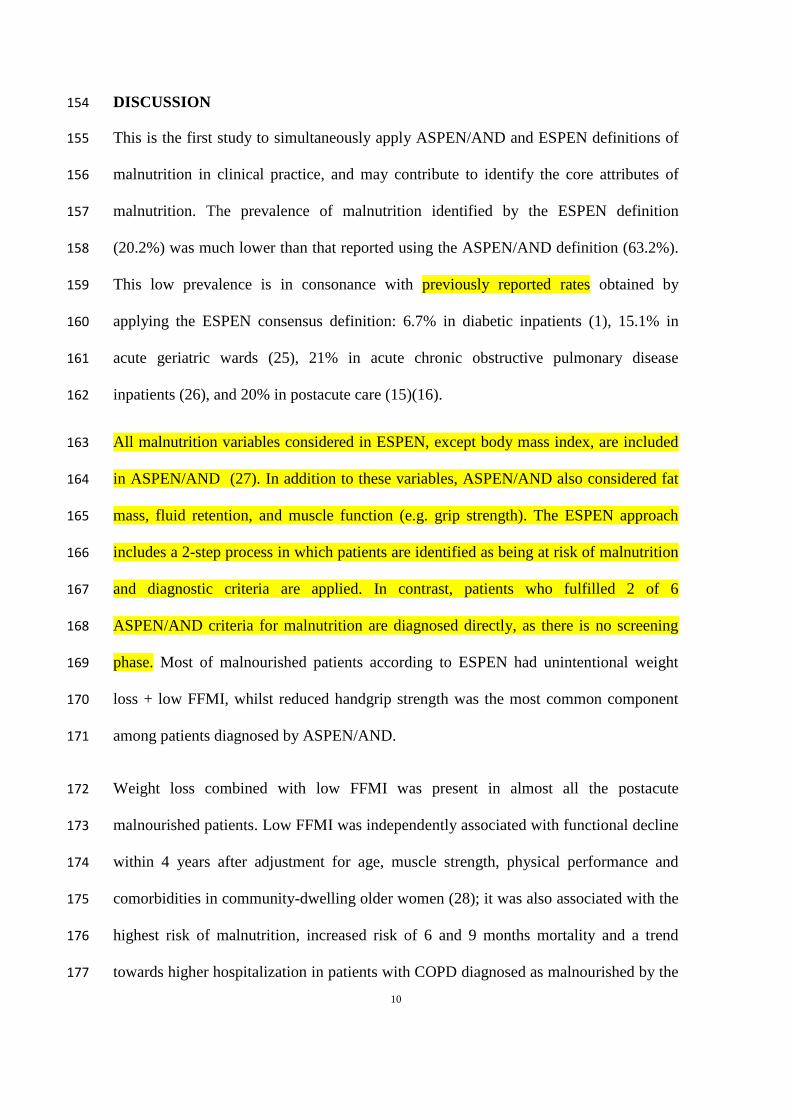
DISCUSSION 154
This is the first study to simultaneously apply ASPEN/AND and ESPEN definitions of 155
malnutrition in clinical practice, and may contribute to identify the core attributes of 156
malnutrition. The prevalence of malnutrition identified by the ESPEN definition 157
(20.2%) was much lower than that reported using the ASPEN/AND definition (63.2%). 158
This low prevalence is in consonance with previously reported rates obtained by 159
applying the ESPEN consensus definition: 6.7% in diabetic inpatients (1), 15.1% in 160
acute geriatric wards (25), 21% in acute chronic obstructive pulmonary disease 161
inpatients (26), and 20% in postacute care (15)(16). 162
All malnutrition variables considered in ESPEN, except body mass index, are included 163
in ASPEN/AND (27). In addition to these variables, ASPEN/AND also considered fat 164
mass, fluid retention, and muscle function (e.g. grip strength). The ESPEN approach 165
includes a 2-step process in which patients are identified as being at risk of malnutrition 166
and diagnostic criteria are applied. In contrast, patients who fulfilled 2 of 6 167
ASPEN/AND criteria for malnutrition are diagnosed directly, as there is no screening 168
phase. Most of malnourished patients according to ESPEN had unintentional weight 169
loss + low FFMI, whilst reduced handgrip strength was the most common component 170
among patients diagnosed by ASPEN/AND. 171
Weight loss combined with low FFMI was present in almost all the postacute 172
malnourished patients. Low FFMI was independently associated with functional decline 173
within 4 years after adjustment for age, muscle strength, physical performance and 174
comorbidities in community-dwelling older women (28); it was also associated with the 175
highest risk of malnutrition, increased risk of 6 and 9 months mortality and a trend 176
towards higher hospitalization in patients with COPD diagnosed as malnourished by the 177
11
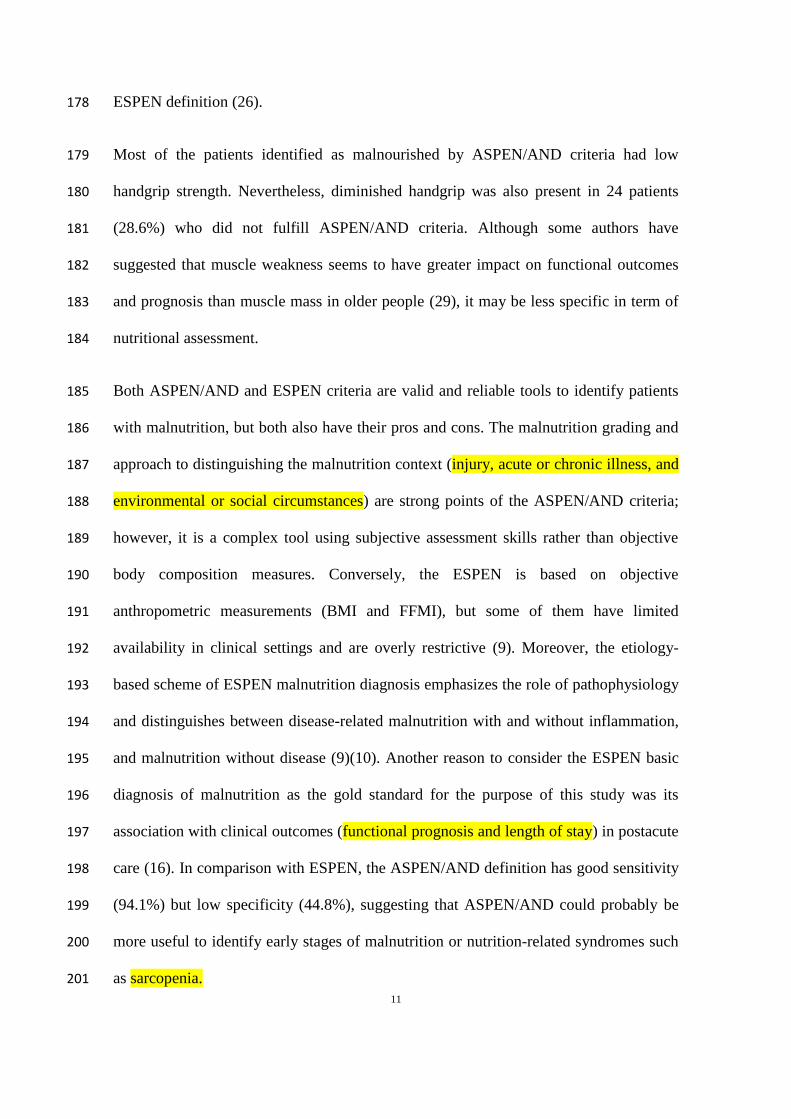
ESPEN definition (26). 178
Most of the patients identified as malnourished by ASPEN/AND criteria had low 179
handgrip strength. Nevertheless, diminished handgrip was also present in 24 patients 180
(28.6%) who did not fulfill ASPEN/AND criteria. Although some authors have 181
suggested that muscle weakness seems to have greater impact on functional outcomes 182
and prognosis than muscle mass in older people (29), it may be less specific in term of 183
nutritional assessment. 184
Both ASPEN/AND and ESPEN criteria are valid and reliable tools to identify patients 185
with malnutrition, but both also have their pros and cons. The malnutrition grading and 186
approach to distinguishing the malnutrition context (injury, acute or chronic illness, and 187
environmental or social circumstances) are strong points of the ASPEN/AND criteria; 188
however, it is a complex tool using subjective assessment skills rather than objective 189
body composition measures. Conversely, the ESPEN is based on objective 190
anthropometric measurements (BMI and FFMI), but some of them have limited 191
availability in clinical settings and are overly restrictive (9). Moreover, the etiology-192
based scheme of ESPEN malnutrition diagnosis emphasizes the role of pathophysiology 193
and distinguishes between disease-related malnutrition with and without inflammation, 194
and malnutrition without disease (9)(10). Another reason to consider the ESPEN basic 195
diagnosis of malnutrition as the gold standard for the purpose of this study was its 196
association with clinical outcomes (functional prognosis and length of stay) in postacute 197
care (16). In comparison with ESPEN, the ASPEN/AND definition has good sensitivity 198
(94.1%) but low specificity (44.8%), suggesting that ASPEN/AND could probably be 199
more useful to identify early stages of malnutrition or nutrition-related syndromes such 200
as sarcopenia. 201
12
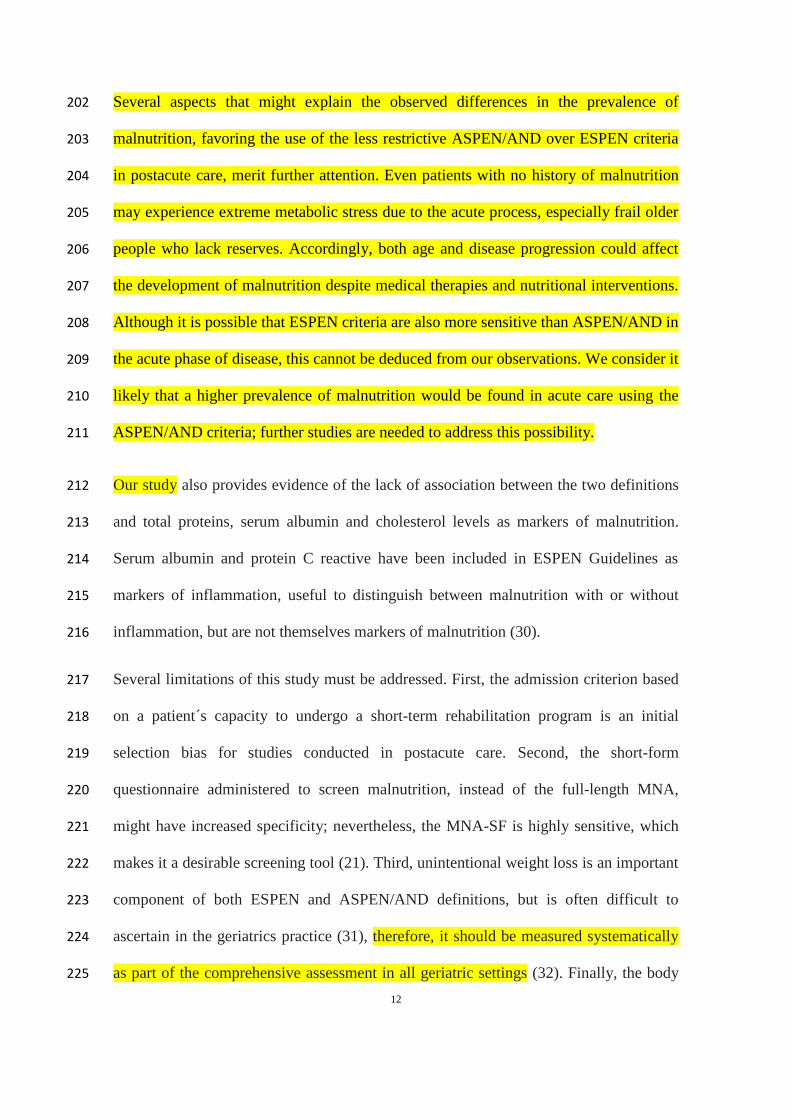
Several aspects that might explain the observed differences in the prevalence of 202
malnutrition, favoring the use of the less restrictive ASPEN/AND over ESPEN criteria 203
in postacute care, merit further attention. Even patients with no history of malnutrition 204
may experience extreme metabolic stress due to the acute process, especially frail older 205
people who lack reserves. Accordingly, both age and disease progression could affect 206
the development of malnutrition despite medical therapies and nutritional interventions. 207
Although it is possible that ESPEN criteria are also more sensitive than ASPEN/AND in 208
the acute phase of disease, this cannot be deduced from our observations. We consider it 209
likely that a higher prevalence of malnutrition would be found in acute care using the 210
ASPEN/AND criteria; further studies are needed to address this possibility. 211
Our study also provides evidence of the lack of association between the two definitions 212
and total proteins, serum albumin and cholesterol levels as markers of malnutrition. 213
Serum albumin and protein C reactive have been included in ESPEN Guidelines as 214
markers of inflammation, useful to distinguish between malnutrition with or without 215
inflammation, but are not themselves markers of malnutrition (30). 216
Several limitations of this study must be addressed. First, the admission criterion based 217
on a patient´s capacity to undergo a short-term rehabilitation program is an initial 218
selection bias for studies conducted in postacute care. Second, the short-form 219
questionnaire administered to screen malnutrition, instead of the full-length MNA, 220
might have increased specificity; nevertheless, the MNA-SF is highly sensitive, which 221
makes it a desirable screening tool (21). Third, unintentional weight loss is an important 222
component of both ESPEN and ASPEN/AND definitions, but is often difficult to 223
ascertain in the geriatrics practice (31), therefore, it should be measured systematically 224
as part of the comprehensive assessment in all geriatric settings (32). Finally, the body 225
13
composition parameters measured by impedance analysis may underestimate fat-free 226
mass because of inherent assumptions about fat distribution and cellular hydration (33). 227
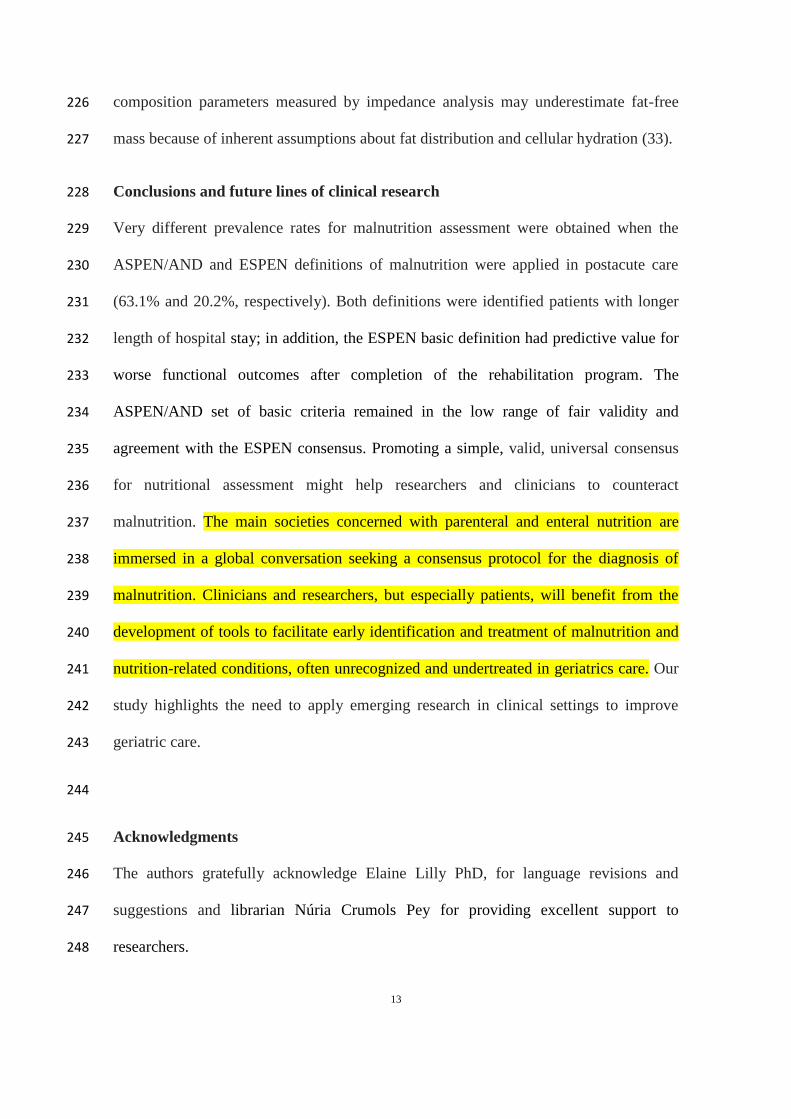
Conclusions and future lines of clinical research 228
Very different prevalence rates for malnutrition assessment were obtained when the 229
ASPEN/AND and ESPEN definitions of malnutrition were applied in postacute care 230
(63.1% and 20.2%, respectively). Both definitions were identified patients with longer 231
length of hospital stay; in addition, the ESPEN basic definition had predictive value for 232
worse functional outcomes after completion of the rehabilitation program. The 233
ASPEN/AND set of basic criteria remained in the low range of fair validity and 234
agreement with the ESPEN consensus. Promoting a simple, valid, universal consensus 235
for nutritional assessment might help researchers and clinicians to counteract 236
malnutrition. The main societies concerned with parenteral and enteral nutrition are 237
immersed in a global conversation seeking a consensus protocol for the diagnosis of 238
malnutrition. Clinicians and researchers, but especially patients, will benefit from the 239
development of tools to facilitate early identification and treatment of malnutrition and 240
nutrition-related conditions, often unrecognized and undertreated in geriatrics care. Our 241
study highlights the need to apply emerging research in clinical settings to improve 242
geriatric care. 243
244
Acknowledgments 245
The authors gratefully acknowledge Elaine Lilly PhD, for language revisions and 246
suggestions and librarian Núria Crumols Pey for providing excellent support to 247
researchers. 248

14
249
Conflict of interest 250
All authors declare they do not have any financial or personal relationships with other 251
people or organizations that could inappropriately influence their work. 252
253
Author contributions 254
DSR and EM conceived and designed the experiments; DSR, EM, and NRM performed 255
the experiments; DSR, EM, and XD analyzed and interpreted the data; DSR, EM, 256
NRM, LMB, AGC, OVI, FE and JMM contributed reagents, materials, analysis tools or 257
data; DSR and EM wrote the draft. 258
15
REFERENCES 259
1. Sanz-París A, Gómez-Candela C, Martín-Palmero Á, García-Almeida JM, 260
Burgos-Pelaez R, Matía-Martin P, et al. Application of the new ESPEN 261
definition of malnutrition in geriatric diabetic patients during hospitalization: A 262
multicentric study. Clin Nutr. 2016 Dec 8;35(6):1564–7. 263
2. Curtis LJ, Bernier P, Jeejeebhoy K, Allard J, Duerksen D, Gramlich L, et al. 264
Costs of hospital malnutrition. Clin Nutr. 2017 Oct;36(5):1391–6. 265
3. Cerri AP, Bellelli G, Mazzone A, Pittella F, Landi F, Zambon A, et al. 266
Sarcopenia and malnutrition in acutely ill hospitalized elderly: Prevalence and 267
outcomes. Clin Nutr. Churchill Livingstone; 2015 Aug;34(4):745–51. 268
4. Koh GC-H, Chen CH, Petrella R, Thind A. Rehabilitation impact indices and 269
their independent predictors: a systematic review. BMJ Open. 2013 Sep 270
24;3(9):e003483. 271
5. Wakabayashi H, Sakuma K. Rehabilitation nutrition for sarcopenia with 272
disability: a combination of both rehabilitation and nutrition care management. J 273
Cachexia Sarcopenia Muscle. 2014 Dec;5(4):269–77. 274
6. Jeejeebhoy KN, Keller H, Gramlich L, Allard JP, Laporte M, Duerksen DR, et al. 275
Nutritional assessment: comparison of clinical assessment and objective variables 276
for the prediction of length of hospital stay and readmission. Am J Clin Nutr. 277
2015 May;101(5):956–65. 278
7. Van Bokhorst-de van der Schueren MAE, Guaitoli PR, Jansma EP, de Vet HCW. 279
Nutrition screening tools: does one size fit all? A systematic review of screening 280
tools for the hospital setting. Clin Nutr. 2014 Feb;33(1):39–58. 281
8. Cederholm T, Bosaeus I, Barazzoni R, Bauer J, Van Gossum A, Klek S, et al. 282
16
Diagnostic criteria for malnutrition - An ESPEN Consensus Statement. Clin Nutr. 283
2015 Jun;34(3):335–40. 284
9. Cederholm T, Jensen GL. To create a consensus on malnutrition diagnostic 285
criteria: A report from the Global Leadership Initiative on Malnutrition (GLIM) 286
meeting at the ESPEN Congress 2016. Clin Nutr. 2017 Feb;36(1):7–10. 287
10. Cederholm T, Jensen GL. To Create a Consensus on Malnutrition Diagnostic 288
Criteria. J Parenter Enter Nutr. 2017 Mar 17;41(3):311–4. 289
11. White J V., Guenter P, Jensen G, Malone A, Schofield M, Academy Malnutrition 290
Work Group, et al. Consensus Statement: Academy of Nutrition and Dietetics 291
and American Society for Parenteral and Enteral Nutrition: Characteristics 292
Recommended for the Identification and Documentation of Adult Malnutrition 293
(Undernutrition). J Parenter Enter Nutr. 2012 May 1;36(3):275–83. 294
12. Cederholm T, Barazzoni R, Austin P, Ballmer P, Biolo G, Bischoff SC, et al. 295
ESPEN guidelines on definitions and terminology of clinical nutrition. Clin Nutr. 296
2017 Feb;36(1):49–64. 297
13. von Elm E, Altman DG, Egger M, Pocock SJ, Gøtzsche PC, Vandenbroucke JP. 298
The Strengthening the Reporting of Observational Studies in Epidemiology 299
(STROBE) statement: guidelines for reporting observational studies. Lancet. 300
2007 Oct 20;370(9596):1453–7. 301
14. Sánchez-Rodríguez D, Marco E, Miralles R, Guillén-Solà A, Vázquez-Ibar O, 302
Escalada F, et al. Does gait speed contribute to sarcopenia case-finding in a 303
postacute rehabilitation setting? Arch Gerontol Geriatr. 2015 May 29;61(2):176–304
81. 305
15. Sánchez-Rodríguez D, Marco E, Ronquillo-Moreno N, Miralles R, Vázquez-Ibar 306
O, Escalada F, et al. Prevalence of malnutrition and sarcopenia in a post-acute 307
17
care geriatric unit: Applying the new ESPEN definition and EWGSOP criteria. 308
Clin Nutr. 2017 Oct;36(5):1339–44. 309
16. Sánchez-Rodríguez D, Marco E, Annweiler C, Ronquillo-Moreno N, Tortosa A, 310
Vázquez-Ibar O, et al. Malnutrition in postacute geriatric care: Basic ESPEN 311
diagnosis and etiology based diagnoses analyzed by length of stay, in-hospital 312
mortality, and functional rehabilitation indexes. Arch Gerontol Geriatr. 313
2017;73:169–76. 314
17. Schutz Y, Kyle UUG, Pichard C. Fat-free mass index and fat mass index 315
percentiles in Caucasians aged 18-98 y. Int J Obes Relat Metab Disord. 2002 316
Jul;26(7):953–60. 317
18. Luna-Heredia E, Martín-Peña G, Ruiz-Galiana J. Handgrip dynamometry in 318
healthy adults. Clin Nutr. 2005;24:250–8. 319
19. Roberts HC, Denison HJ, Martin HJ, Patel HP, Syddall H, Cooper C, et al. A 320
review of the measurement of grip strength in clinical and epidemiological 321
studies: Towards a standardised approach. Age Ageing. 2011 Jul;40(May):423–9. 322
20. Kaiser MJ, Bauer JM, Ramsch C, Uter W, Guigoz Y, Cederholm T, et al. 323
Validation of the Mini Nutritional Assessment short-form (MNA-SF): a practical 324
tool for identification of nutritional status. J Nutr Health Aging. 2009 325
Nov;13(9):782–8. 326
21. Baek M-H, Heo Y-R. Evaluation of the efficacy of nutritional screening tools to 327
predict malnutrition in the elderly at a geriatric care hospital. Nutr Res Pract. 328
2015 Dec;9(6):637–43. 329
22. Landis JR, Koch GG. An application of hierarchical kappa-type statistics in the 330
assessment of majority agreement among multiple observers. Biometrics. 1977 331
Jun;33(2):363–74. 332
18
23. Sánchez-Rodríguez D, Miralles R, Muniesa JM, Mojal S, Abadía-Escartín A, 333
Vázquez-Ibar O. Three measures of physical rehabilitation effectiveness in 334
elderly patients: a prospective, longitudinal, comparative analysis. BMC Geriatr. 335
2015 Oct 29;15(1):142. 336
24. Muller MJ, Soares M. The ethics of research publication. Eur J Clin Nutr. 2017 337
May;71(5):569. 338
25. Jiang J, Hu X, Chen J, Wang H, Zhang L, Dong B, et al. Predicting long-term 339
mortality in hospitalized elderly patients using the new ESPEN definition. Sci 340
Rep. 2017 Dec 22;7(1):4067. 341
26. Ingadottir AR, Beck AM, Baldwin C, Weekes CE, Geirsdottir OG, Ramel A, et 342
al. Two components of the new ESPEN diagnostic criteria for malnutrition are 343
independent predictors of lung function in hospitalized patients with chronic 344
obstructive pulmonary disease (COPD). Clinical Nutrition. 2017 Jun 8; 345
27. Jensen GL, Cederholm T. Global Leadership Initiative on Malnutrition: Progress 346
Report From ASPEN Clinical Nutrition Week 2017. JPEN J Parenter Enteral 347
Nutr. 2017 Apr 1;148607117707761. 348
28. Amigues I, Schott AM, Amine M, Gelas-Dore B, Veerabudun K, Paillaud E, et 349
al. Low Skeletal Muscle Mass and Risk of Functional Decline in Elderly 350
Community-Dwelling Women: The Prospective EPIDOS Study. J Am Med Dir 351
Assoc. 2013 May;14(5):352–7. 352
29. Menant JC, Weber F, Lo J, Sturnieks DL, Close JC, Sachdev PS, et al. Strength 353
measures are better than muscle mass measures in predicting health-related 354
outcomes in older people: time to abandon the term sarcopenia? Osteoporos Int. 355
2017 Jan;28(1):59–70. 356
30. Visser M, Kritchevsky SB, Newman AB, Goodpaster BH, Tylavsky FA, Nevitt 357

19
MC, et al. Lower serum albumin concentration and change in muscle mass: the 358
Health, Aging and Body Composition Study. Am J Clin Nutr. 2005 359
Sep;82(3):531–7. 360
31. Robbins LJ. Evaluation of weight loss in the elderly. Geriatrics. 1989 361
Apr;44(4):31–4, 37. 362
32. Fougère B, Morley JE. Weight loss is a major cause of frailty. J Nutr Health 363
Aging. 2017 Nov 22;21(9):933–5. 364
33. Steiner MC, Barton RL, Singh SJ, Morgan MDL. Bedside methods versus dual 365
energy X-ray absorptiometry for body composition measurement in COPD. Eur 366
Respir J. 2002 Apr;19(4):626–31. 367
368
1
ASPEN-AND-ESPEN: A postacute-care comparison of the basic definition of 1
malnutrition from the American Society of Parenteral and Enteral Nutrition and 2
Academy of Nutrition and Dietetics with the European Society for Clinical 3
Nutrition and Metabolism definition 4
5
Abbreviations 6
AND: Academy of Nutrition and Dietetics 7
ASPEN: American Society of Parenteral and Enteral Nutrition 8
BMI: Body mass index 9
ESPEN: European American Society of Parenteral and Enteral Nutrition 10
FFMI: Fat-free mass index 11
k: kappa statistics 12
MNA-SF: Mini-Nutritional Assessment Short Form 13
REI: Rehabilitation efficiency index 14
RFG: Relative functional gain 15
*ManuscriptClick here to view linked References

2
INTRODUCTION 16
Malnutrition is a highly prevalent condition related to adverse clinical outcomes in 17
hospitalized older patients, such as longer length of stay, mortality (1), and higher costs 18
(2). Malnutrition is bidirectionally linked to mobility and disability (3), and therefore, to 19
poor functional outcomes in rehabilitation programs (3)(4)(5). Early identification and 20
management of malnutrition can counteract this negative influence, leading to better 21
functional prognosis and shorter length of stay (5). 22
In the absence of a standardized diagnostic method, clinicians have been assessing 23
malnutrition with several tools (6)(7). The largest parenteral and enteral societies have 24
proposed diagnostic criteria, but a unified consensus suitable to all populations and 25
settings worldwide is still a challenge for the scientific community (8)(9)(10)(11).The 26
ASPEN/AND definition and ESPEN criteria are among the most widely extended 27
approaches. In 2012, ASPEN/AND proposed a set of six clinical criteria: reduced 28
energy intake, unintentional weight loss, loss of subcutaneous fat, loss of muscle mass, 29
fluid accumulation, and reduced grip strength (11). More recently, ESPEN launched a 30
new consensus statement for patients at risk of malnutrition, which combines weight 31
loss with either age-related body mass index (BMI) or fat-free mass index (FFMI) as a 32
second alternative to low BMI (<18.5 kg/m2) (8). This consensus was further completed 33
with the ESPEN guidelines on definitions and terminology of clinical nutrition (12). 34
Given that knowledge of the potential relationships between these two definitions might 35
provide an evidence-based approach to key components of malnutrition, the aim of this 36
study was to assess the prevalence of malnutrition in postacute patients, applying both 37
ASPEN/AND and ESPEN definitions; and secondly, to determine the metrological 38
properties of the ASPEN/AND basic diagnosis in comparison with the ESPEN 39

3
consensus. 40
4
METHODS 41
Prospective cohort study, reported according to the Strengthening the Reporting of 42
Observational Studies in Epidemiology (STROBE) Statement (13). The study was 43
conducted in a postacute care unit focused on comprehensive geriatric assessment and 44
rehabilitation (14) in a university hospital in Barcelona (Catalonia, Spain) in a six-45
month period June-December 2016. 46
Participating patients were aged ≥70 years with functional impairment due to a non-47
disabling medical disease, admitted to postacute care for rehabilitation. Patients whose 48
cognitive status (Mini-Mental Status Examination <21/30) and/or general condition 49
prevented completion of the diagnostic tests and/or active physical rehabilitation 50
program were excluded. 51
The main outcome variable was malnutrition according to both the ASPEN/AND and 52
ESPEN malnutrition criteria. ASPEN/AND diagnosis of malnutrition considers the 53
presence of at least two of the following factors: low energy intake, fluid accumulation, 54
diminished handgrip strength, and loss of weight, muscle mass or subcutaneous fat; 55
distinguishes between severe and non-severe malnutrition; these characteristics vary 56
according to care settings for acute or chronic illness and social or environmental 57
circumstances (11). Food intake was estimated by plate waste (%) during hospital stay 58
and categorized as “yes” when food intake was <75% of estimated energy requirement 59
for >7 days, and “no” otherwise. Unintentional weight loss was obtained by patient 60
and caregiver anamnesis and medical records documenting weight loss of at least 5% in 61
the previous month (during the acute illness). Muscle mass and fat mass in Kg were 62
estimated by bioimpedance (Bodystat 1500, Bodystat Ltd., Isle of Man British Isles) as 63
previously described (15)(16)(14) and compared with those of the European reference 64
5
population (17). Water content, expressed in liters (L), was also measured by 65
bioimpedance analysis and compared with values of same-aged healthy controls. 66
Handgrip strength, expressed in Kg and as a percentage of the reference population 67
values (18), was measured by a hand-held dynamometer (JAMAR, Nottinghamshire, 68
UK) (19). For purpose of analysis, the highest value of three reproducible isometric 69
contractions of finger flexor muscles (<10% variability between values) was used. 70
Values of body composition and muscle strength less than 80% of the reference data, 71
adjusted for sex and age, were considered decreased. 72
The ESPEN basic diagnosis required identification by any validated screening tool of 73
patients at nutritional risk; scores≤11 in the Mini-Nutritional Assessment Short Form 74
(MNA-SF) were used in this study (20). The two alternative ways to diagnose 75
malnutrition proposed by the ESPEN criteria are BMI <18.5 Kg/m2 (alternative 1) and 76
unintentional weight loss (>10% indefinite of time, or >5% in the last three months) 77
combined with age-related BMI (BMI <20 kg/m2 in <70 years, or <22 kg/m
2 in ≥70 78
years) or FFMI (<17 kg/m2 in men and <15 kg/m
2 in women). FFMI was obtained by 79
dividing the fat-free mass (Kg) by the square of the height. 80
Other outcome variables were the indexes that determine the overall value of a 81
diagnostic method: sensitivity, specificity, positive predictive value, negative and 82
negative predictive values, positive likelihood ratio, and accuracy index. The cut-off 83
points for validity were sensitivity or specificity <50% (poor validity); sensitivity or 84
specificity <80% but both values >50% (fair validity); and sensitivity and specificity 85
>80% (good validity) (21)(7). Concordance between the ESPEN consensus and 86
ASPEN/AND basic diagnosis was determined with kappa (k) statistics: k <0 (no 87
agreement), 0-0.2 (poor agreement), 0.21-0.4 (fair agreement), 0.41-0.6 (moderate 88
6
agreement), 0.61-0.8 (substantial agreement), and 0.81-1 (almost perfect agreement) 89
(21)(22). 90
Demographic and clinical characteristics included age, sex, Charlson comorbidity index, 91
cognitive (Short Portable Mental Status Questionnaire), functional status by 92
instrumental (Lawton index) and basic (Barthel index) activities of daily living. 93
Changes in the functional status during hospitalization were assessed with the 94
rehabilitation impact indexes: rehabilitation efficiency index [REI = (Barthel index at 95
discharge – Barthel index at admission) / (length of hospital stay)], and the relative 96
functional gain [RFG = (Barthel index at discharge – Barthel index at admission) / 97
(Barthel index premorbid – Barthel index at admission) × 100] (4)(23). A 10-ml venous 98
blood sample was collected from all patients under standardized conditions between 7 99
and 9 am, at rest and following an overnight fast to determine total proteins, serum 100
albumin, and cholesterol levels. 101
National and international research ethics guidelines (24), including the Deontological 102
Code of Ethics, Declaration of Helsinki, and Spain's confidentiality law concerning 103
personal data were followed. Understandable oral and written information was provided 104
to family members and patients, and informed consent to participate was signed by all 105
participants. The institution's Clinical Ethics Committee approved the informed consent 106
process used and the study. 107
Statistical analysis 108
Descriptive analysis of the sample used means with standard deviations for quantitative 109
continuous variables, and percentages and frequency distributions for categorical 110
variables. Sensitivity, specificity, positive and negative predictive values, positive 111
likelihood ratio, and accuracy index were described in percentages. In the case of 112

7
quantitative variables, the assumption of normality was analyzed through normal 113
probability graphs and using the Kolmogorov–Smirnov test corrected by the Lilliefors 114
test. Contingency tables were used to calculate the reliability indexes of ASPEN/AND 115
basic diagnosis compared with ESPEN malnutrition basic diagnosis. Each 2×2 116
contingency table contains two rows (positive or negative) for each diagnostic method. 117
Univariate analysis was performed using Chi-square test for categorical variables; in the 118
Student t-test for independent samples, mean differences with 95% confidence intervals 119
(95%CI) were used for continuous variables. P value <0.05 was considered statistically 120
significant. Analysis was performed using IBM SPSS Statistics 22 (IBM Corporation, 121
SPSS, INC., Chicago, IL, USA). 122
8
RESULTS 123
Among 84 patients (aged 85.4±6.2; 59.5% women) who fulfilled inclusion criteria, all 124
of them were identified as being “at risk” of malnutrition (MNA-SF scores ≤11). Table 125
1 shows the general and geriatric assessment results in the whole sample, and in 126
malnourished and non-malnourished patients according to both ESPEN and 127
ASPEN/AND definitions. Patients without malnutrition presented shorter length of stay 128
in postacute care, independently of the criteria used for the diagnosis: mean differences 129
5.1 (95%CI 0.7 to 9.5) by ESPEN and 3.1 (95%CI 0.5 to 5.7) by ASPEN/AND. Patients 130
identified as malnourished by both ESPEN approaches had worse functional status after 131
the rehabilitation process: mean differences of Barthel index at discharge and relative 132
functional gain were 15.5 (95%CI 1.6 to 29.5), and 29.5 (95%CI 8.4 to 50.6), 133
respectively. No statistical differences between the definitions were observed in total 134
proteins and serum albumin levels between patients with or without malnutrition. 135
The prevalence of malnutrition was 20.2%, according to ESPEN basic diagnosis, and 136
63.1% when ASPEN/AND diagnosis of malnutrition was applied, as shown in Table 2. 137
Unintentional weight loss combined with low FFMI was the ESPEN diagnostic 138
alternative that identified a higher number of malnourished patients (15/17); likewise, 139
loss of handgrip strength was the ASPEN/AND component most frequently present in 140
patients with malnutrition (52/53). 141
The distribution of patients according to ASPEN/AND and ESPEN criteria is depicted 142
in Figure 1. From a conceptual and clinical point of view, a comprehensive 143
interpretation of malnutrition characteristics is translated into the “ship and sailboat 144
analogy”, where blocks represents all 84 patients at risk of malnutrition, the “sailboat” 145
9
shape shows patients fulfilling ESPEN criteria and the larger “ship” encompasses 146
patients fulfilling the less restrictive ASPEN/AND criteria. 147
Table 3 is a contingency table comparing the distribution of ASPEN/AND basic 148
definition and ESPEN basic diagnosis. Metrological properties of the ASPEN basic 149
definition of malnutrition compared with ESPEN basic diagnosis are summarized in 150
Table 4. Sensitivity and specificity of ASPEN/AND basic diagnosis were 94.1% and 151
44.8%, respectively, indicating fair validity. The agreement between both definitions of 152
malnutrition was fair (k= 0.217). 153
10
DISCUSSION 154
This is the first study to simultaneously apply ASPEN/AND and ESPEN definitions of 155
malnutrition in clinical practice, and may contribute to identify the core attributes of 156
malnutrition. The prevalence of malnutrition identified by the ESPEN definition 157
(20.2%) was much lower than that reported using the ASPEN/AND definition (63.2%). 158
This low prevalence is in consonance with previously reported rates obtained by 159
applying the ESPEN consensus definition: 6.7% in diabetic inpatients (1), 15.1% in 160
acute geriatric wards (25), 21% in acute chronic obstructive pulmonary disease 161
inpatients (26), and 20% in postacute care (15)(16). 162
All malnutrition variables considered in ESPEN, except body mass index, are included 163
in ASPEN/AND (27). In addition to these variables, ASPEN/AND also considered fat 164
mass, fluid retention, and muscle function (e.g. grip strength). The ESPEN approach 165
includes a 2-step process in which patients are identified as being at risk of malnutrition 166
and diagnostic criteria are applied. In contrast, patients who fulfilled 2 of 6 167
ASPEN/AND criteria for malnutrition are diagnosed directly, as there is no screening 168
phase. Most of malnourished patients according to ESPEN had unintentional weight 169
loss + low FFMI, whilst reduced handgrip strength was the most common component 170
among patients diagnosed by ASPEN/AND. 171
Weight loss combined with low FFMI was present in almost all the postacute 172
malnourished patients. Low FFMI was independently associated with functional decline 173
within 4 years after adjustment for age, muscle strength, physical performance and 174
comorbidities in community-dwelling older women (28); it was also associated with the 175
highest risk of malnutrition, increased risk of 6 and 9 months mortality and a trend 176
towards higher hospitalization in patients with COPD diagnosed as malnourished by the 177
11
ESPEN definition (26). 178
Most of the patients identified as malnourished by ASPEN/AND criteria had low 179
handgrip strength. Nevertheless, diminished handgrip was also present in 24 patients 180
(28.6%) who did not fulfill ASPEN/AND criteria. Although some authors have 181
suggested that muscle weakness seems to have greater impact on functional outcomes 182
and prognosis than muscle mass in older people (29), it may be less specific in term of 183
nutritional assessment. 184
Both ASPEN/AND and ESPEN criteria are valid and reliable tools to identify patients 185
with malnutrition, but both also have their pros and cons. The malnutrition grading and 186
approach to distinguishing the malnutrition context (injury, acute or chronic illness, and 187
environmental or social circumstances) are strong points of the ASPEN/AND criteria; 188
however, it is a complex tool using subjective assessment skills rather than objective 189
body composition measures. Conversely, the ESPEN is based on objective 190
anthropometric measurements (BMI and FFMI), but some of them have limited 191
availability in clinical settings and are overly restrictive (9). Moreover, the etiology-192
based scheme of ESPEN malnutrition diagnosis emphasizes the role of pathophysiology 193
and distinguishes between disease-related malnutrition with and without inflammation, 194
and malnutrition without disease (9)(10). Another reason to consider the ESPEN basic 195
diagnosis of malnutrition as the gold standard for the purpose of this study was its 196
association with clinical outcomes (functional prognosis and length of stay) in postacute 197
care (16). In comparison with ESPEN, the ASPEN/AND definition has good sensitivity 198
(94.1%) but low specificity (44.8%), suggesting that ASPEN/AND could probably be 199
more useful to identify early stages of malnutrition or nutrition-related syndromes such 200
as sarcopenia. 201
12
Several aspects that might explain the observed differences in the prevalence of 202
malnutrition, favoring the use of the less restrictive ASPEN/AND over ESPEN criteria 203
in postacute care, merit further attention. Even patients with no history of malnutrition 204
may experience extreme metabolic stress due to the acute process, especially frail older 205
people who lack reserves. Accordingly, both age and disease progression could affect 206
the development of malnutrition despite medical therapies and nutritional interventions. 207
Although it is possible that ESPEN criteria are also more sensitive than ASPEN/AND in 208
the acute phase of disease, this cannot be deduced from our observations. We consider it 209
likely that a higher prevalence of malnutrition would be found in acute care using the 210
ASPEN/AND criteria; further studies are needed to address this possibility. 211
Our study also provides evidence of the lack of association between the two definitions 212
and total proteins, serum albumin and cholesterol levels as markers of malnutrition. 213
Serum albumin and protein C reactive have been included in ESPEN Guidelines as 214
markers of inflammation, useful to distinguish between malnutrition with or without 215
inflammation, but are not themselves markers of malnutrition (30). 216
Several limitations of this study must be addressed. First, the admission criterion based 217
on a patient´s capacity to undergo a short-term rehabilitation program is an initial 218
selection bias for studies conducted in postacute care. Second, the short-form 219
questionnaire administered to screen malnutrition, instead of the full-length MNA, 220
might have increased specificity; nevertheless, the MNA-SF is highly sensitive, which 221
makes it a desirable screening tool (21). Third, unintentional weight loss is an important 222
component of both ESPEN and ASPEN/AND definitions, but is often difficult to 223
ascertain in the geriatrics practice (31), therefore, it should be measured systematically 224
as part of the comprehensive assessment in all geriatric settings (32). Finally, the body 225
13
composition parameters measured by impedance analysis may underestimate fat-free 226
mass because of inherent assumptions about fat distribution and cellular hydration (33). 227
Conclusions and future lines of clinical research 228
Very different prevalence rates for malnutrition assessment were obtained when the 229
ASPEN/AND and ESPEN definitions of malnutrition were applied in postacute care 230
(63.1% and 20.2%, respectively). Both definitions were identified patients with longer 231
length of hospital stay; in addition, the ESPEN basic definition had predictive value for 232
worse functional outcomes after completion of the rehabilitation program. The 233
ASPEN/AND set of basic criteria remained in the low range of fair validity and 234
agreement with the ESPEN consensus. Promoting a simple, valid, universal consensus 235
for nutritional assessment might help researchers and clinicians to counteract 236
malnutrition. The main societies concerned with parenteral and enteral nutrition are 237
immersed in a global conversation seeking a consensus protocol for the diagnosis of 238
malnutrition. Clinicians and researchers, but especially patients, will benefit from the 239
development of tools to facilitate early identification and treatment of malnutrition and 240
nutrition-related conditions, often unrecognized and undertreated in geriatrics care. Our 241
study highlights the need to apply emerging research in clinical settings to improve 242
geriatric care. 243
244
Acknowledgments 245
The authors gratefully acknowledge Elaine Lilly PhD, for language revisions and 246
suggestions and librarian Núria Crumols Pey for providing excellent support to 247
researchers. 248
14
249
Conflict of interest 250
All authors declare they do not have any financial or personal relationships with other 251
people or organizations that could inappropriately influence their work. 252
253
Author contributions 254
DSR and EM conceived and designed the experiments; DSR, EM, and NRM performed 255
the experiments; DSR, EM, and XD analyzed and interpreted the data; DSR, EM, 256
NRM, LMB, AGC, OVI, FE and JMM contributed reagents, materials, analysis tools or 257
data; DSR and EM wrote the draft. 258

15
REFERENCES 259
1. Sanz-París A, Gómez-Candela C, Martín-Palmero Á, García-Almeida JM, 260
Burgos-Pelaez R, Matía-Martin P, et al. Application of the new ESPEN 261
definition of malnutrition in geriatric diabetic patients during hospitalization: A 262
multicentric study. Clin Nutr. 2016 Dec 8;35(6):1564–7. 263
2. Curtis LJ, Bernier P, Jeejeebhoy K, Allard J, Duerksen D, Gramlich L, et al. 264
Costs of hospital malnutrition. Clin Nutr. 2017 Oct;36(5):1391–6. 265
3. Cerri AP, Bellelli G, Mazzone A, Pittella F, Landi F, Zambon A, et al. 266
Sarcopenia and malnutrition in acutely ill hospitalized elderly: Prevalence and 267
outcomes. Clin Nutr. Churchill Livingstone; 2015 Aug;34(4):745–51. 268
4. Koh GC-H, Chen CH, Petrella R, Thind A. Rehabilitation impact indices and 269
their independent predictors: a systematic review. BMJ Open. 2013 Sep 270
24;3(9):e003483. 271
5. Wakabayashi H, Sakuma K. Rehabilitation nutrition for sarcopenia with 272
disability: a combination of both rehabilitation and nutrition care management. J 273
Cachexia Sarcopenia Muscle. 2014 Dec;5(4):269–77. 274
6. Jeejeebhoy KN, Keller H, Gramlich L, Allard JP, Laporte M, Duerksen DR, et al. 275
Nutritional assessment: comparison of clinical assessment and objective variables 276
for the prediction of length of hospital stay and readmission. Am J Clin Nutr. 277
2015 May;101(5):956–65. 278
7. Van Bokhorst-de van der Schueren MAE, Guaitoli PR, Jansma EP, de Vet HCW. 279
Nutrition screening tools: does one size fit all? A systematic review of screening 280
tools for the hospital setting. Clin Nutr. 2014 Feb;33(1):39–58. 281
8. Cederholm T, Bosaeus I, Barazzoni R, Bauer J, Van Gossum A, Klek S, et al. 282

16
Diagnostic criteria for malnutrition - An ESPEN Consensus Statement. Clin Nutr. 283
2015 Jun;34(3):335–40. 284
9. Cederholm T, Jensen GL. To create a consensus on malnutrition diagnostic 285
criteria: A report from the Global Leadership Initiative on Malnutrition (GLIM) 286
meeting at the ESPEN Congress 2016. Clin Nutr. 2017 Feb;36(1):7–10. 287
10. Cederholm T, Jensen GL. To Create a Consensus on Malnutrition Diagnostic 288
Criteria. J Parenter Enter Nutr. 2017 Mar 17;41(3):311–4. 289
11. White J V., Guenter P, Jensen G, Malone A, Schofield M, Academy Malnutrition 290
Work Group, et al. Consensus Statement: Academy of Nutrition and Dietetics 291
and American Society for Parenteral and Enteral Nutrition: Characteristics 292
Recommended for the Identification and Documentation of Adult Malnutrition 293
(Undernutrition). J Parenter Enter Nutr. 2012 May 1;36(3):275–83. 294
12. Cederholm T, Barazzoni R, Austin P, Ballmer P, Biolo G, Bischoff SC, et al. 295
ESPEN guidelines on definitions and terminology of clinical nutrition. Clin Nutr. 296
2017 Feb;36(1):49–64. 297
13. von Elm E, Altman DG, Egger M, Pocock SJ, Gøtzsche PC, Vandenbroucke JP. 298
The Strengthening the Reporting of Observational Studies in Epidemiology 299
(STROBE) statement: guidelines for reporting observational studies. Lancet. 300
2007 Oct 20;370(9596):1453–7. 301
14. Sánchez-Rodríguez D, Marco E, Miralles R, Guillén-Solà A, Vázquez-Ibar O, 302
Escalada F, et al. Does gait speed contribute to sarcopenia case-finding in a 303
postacute rehabilitation setting? Arch Gerontol Geriatr. 2015 May 29;61(2):176–304
81. 305
15. Sánchez-Rodríguez D, Marco E, Ronquillo-Moreno N, Miralles R, Vázquez-Ibar 306
O, Escalada F, et al. Prevalence of malnutrition and sarcopenia in a post-acute 307

17
care geriatric unit: Applying the new ESPEN definition and EWGSOP criteria. 308
Clin Nutr. 2017 Oct;36(5):1339–44. 309
16. Sánchez-Rodríguez D, Marco E, Annweiler C, Ronquillo-Moreno N, Tortosa A, 310
Vázquez-Ibar O, et al. Malnutrition in postacute geriatric care: Basic ESPEN 311
diagnosis and etiology based diagnoses analyzed by length of stay, in-hospital 312
mortality, and functional rehabilitation indexes. Arch Gerontol Geriatr. 313
2017;73:169–76. 314
17. Schutz Y, Kyle UUG, Pichard C. Fat-free mass index and fat mass index 315
percentiles in Caucasians aged 18-98 y. Int J Obes Relat Metab Disord. 2002 316
Jul;26(7):953–60. 317
18. Luna-Heredia E, Martín-Peña G, Ruiz-Galiana J. Handgrip dynamometry in 318
healthy adults. Clin Nutr. 2005;24:250–8. 319
19. Roberts HC, Denison HJ, Martin HJ, Patel HP, Syddall H, Cooper C, et al. A 320
review of the measurement of grip strength in clinical and epidemiological 321
studies: Towards a standardised approach. Age Ageing. 2011 Jul;40(May):423–9. 322
20. Kaiser MJ, Bauer JM, Ramsch C, Uter W, Guigoz Y, Cederholm T, et al. 323
Validation of the Mini Nutritional Assessment short-form (MNA-SF): a practical 324
tool for identification of nutritional status. J Nutr Health Aging. 2009 325
Nov;13(9):782–8. 326
21. Baek M-H, Heo Y-R. Evaluation of the efficacy of nutritional screening tools to 327
predict malnutrition in the elderly at a geriatric care hospital. Nutr Res Pract. 328
2015 Dec;9(6):637–43. 329
22. Landis JR, Koch GG. An application of hierarchical kappa-type statistics in the 330
assessment of majority agreement among multiple observers. Biometrics. 1977 331
Jun;33(2):363–74. 332

18
23. Sánchez-Rodríguez D, Miralles R, Muniesa JM, Mojal S, Abadía-Escartín A, 333
Vázquez-Ibar O. Three measures of physical rehabilitation effectiveness in 334
elderly patients: a prospective, longitudinal, comparative analysis. BMC Geriatr. 335
2015 Oct 29;15(1):142. 336
24. Muller MJ, Soares M. The ethics of research publication. Eur J Clin Nutr. 2017 337
May;71(5):569. 338
25. Jiang J, Hu X, Chen J, Wang H, Zhang L, Dong B, et al. Predicting long-term 339
mortality in hospitalized elderly patients using the new ESPEN definition. Sci 340
Rep. 2017 Dec 22;7(1):4067. 341
26. Ingadottir AR, Beck AM, Baldwin C, Weekes CE, Geirsdottir OG, Ramel A, et 342
al. Two components of the new ESPEN diagnostic criteria for malnutrition are 343
independent predictors of lung function in hospitalized patients with chronic 344
obstructive pulmonary disease (COPD). Clinical Nutrition. 2017 Jun 8; 345
27. Jensen GL, Cederholm T. Global Leadership Initiative on Malnutrition: Progress 346
Report From ASPEN Clinical Nutrition Week 2017. JPEN J Parenter Enteral 347
Nutr. 2017 Apr 1;148607117707761. 348
28. Amigues I, Schott AM, Amine M, Gelas-Dore B, Veerabudun K, Paillaud E, et 349
al. Low Skeletal Muscle Mass and Risk of Functional Decline in Elderly 350
Community-Dwelling Women: The Prospective EPIDOS Study. J Am Med Dir 351
Assoc. 2013 May;14(5):352–7. 352
29. Menant JC, Weber F, Lo J, Sturnieks DL, Close JC, Sachdev PS, et al. Strength 353
measures are better than muscle mass measures in predicting health-related 354
outcomes in older people: time to abandon the term sarcopenia? Osteoporos Int. 355
2017 Jan;28(1):59–70. 356
30. Visser M, Kritchevsky SB, Newman AB, Goodpaster BH, Tylavsky FA, Nevitt 357
19
MC, et al. Lower serum albumin concentration and change in muscle mass: the 358
Health, Aging and Body Composition Study. Am J Clin Nutr. 2005 359
Sep;82(3):531–7. 360
31. Robbins LJ. Evaluation of weight loss in the elderly. Geriatrics. 1989 361
Apr;44(4):31–4, 37. 362
32. Fougère B, Morley JE. Weight loss is a major cause of frailty. J Nutr Health 363
Aging. 2017 Nov 22;21(9):933–5. 364
33. Steiner MC, Barton RL, Singh SJ, Morgan MDL. Bedside methods versus dual 365
energy X-ray absorptiometry for body composition measurement in COPD. Eur 366
Respir J. 2002 Apr;19(4):626–31. 367
368
1
Table 1. General characteristics of the study participants in the whole sample (n= 84), and in malnourished vs. non-malnourished patients
according to ESPEN and ASPEN/AND definitions.
ESPEN malnutrition diagnosis ASPEN/AND basic diagnosis
Total sample
(n= 84)
Malnourished
(n= 17)
Non malnourished
(n= 67)
p-
value
Malnourished
(n= 53)
Non malnourished
(n= 31)
p-
value
Age (years) 85.4 (±6.2) 84.4 (±7.2) 85.6 (±5.9) 0.482 85.7 (±6.4) 84.8 (±5.8) 0.511
Sex (female) 50 (59.5%) 11 (64.7%) 39 (58.2%) 0.626 34 (64.2%) 16 (51.6%) 0.259
Body mass index (kg/m2) 24.7 (±3.4) 22 (±3.9) 25.4 (±2.9) 0.003 23.7 (±3.5) 26.3 (±2.5) <0.001
Charlson comorbidity index 2.4 (±1.9) 2.4 (±2.3) 2.3 (±1.7) 0.869 2.2 (±1.7) 2.6 (±2.0) 0.312
Short Portable Mental Status Questionnaire 4.4 (±3.0) 4.5 (±3.0) 4.4 (±3.0) 0.864 4.7 (±3.0) 3.9 (±3.0) 0.205
Lawton index 2.4 (±2.5) 2.4 (±2.7) 2.3 (±2.5) 0.904 2.3 (±2.5) 2.5 (±2.5) 0.637
Barthel index:
- Prior to admission
- At admission
- At discharge
68.9 (±21.2)
26.4 (±15.7)
50.8 (±26.4)
67.8 (±23.7)
21.9 (±14.1)
38.4(±27.4)
69.2 (±20.7)
27.5 (±16.0)
54 (±25.3)
0.805
0.191
0.029
68.3 (±20.9)
24.9(±15.9)
46.7 (±24.7)
69.9 (±21.9)
28.9 (±15.3)
57.6 (±28.1)
0.735
0.256
0.070
Relative functional gain (%) 57.5 (±40.6) 34.1 (±38.7) 63.5 (±39.1) 0.007 53.4(±36.1) 64.4 (±46.9) 0.233
Rehabilitation efficiency index 2.04 (±2.03) 1.4 (±2.3) 2.2 (±1.9) 0.117 1.8 (±1.8) 2.5 (±2.4) 0.122
Length of stay:
- Prior acute care unit
- Postacute care
15.3 (±12.2)
14.6 (±5.9)
16.4 (±16.2)
18.7 (±8.4)
15 (±11.1)
13.6 (±4.6)
0.666
0.001
13.8 (±11.7)
15.8 (±6.6)
17.8 (±12.8)
12.7 (±3.7)
0.145
0.007
Table
2
Total proteins (g/dL) 5.7 (±0.7) 5.9 (±0.7) 5.7 (±0.7) 0.454 5.7 (±0.7) 5.6 (±0.7) 0.586
Albumin (g/dL) 3.3 (±0.4) 3.2 (±0.6) 3.4 (±0.4) 0.213 3.4 (±0.5) 3.3 (±0.4) 0.519
Cholesterol (mg/dL) 147.6 (±33.1) 127.8 (±29.5) 152.7 (±32.2) 0.005 143 (±32.7) 155.6 (±32.7) 0.094
Abbreviations: ASPEN/AND, American Society of Parenteral and Enteral Nutrition / Academy of Nutrition and Dietetics; ESPEN, European
Society of Parenteral and Enteral Nutrition.
Data are given as numbers and percentages for sex distribution; continuous variables are expressed as mean (± standard deviation). Comparisons
between malnourished and non-malnourished participants were based on independent samples t-test or Chi-square test, as appropriate.
Significant p-values (<0.05) are indicated in bold.
3
Table 2. Prevalence of malnutrition according to ESPEN and ASPEN/AND definitions broken down by their respective components.
Total sample (n= 84) Malnutrition
ESPEN:
Prevalence of malnutrition (alternative 1 and/or 2)
- Alternative 1:
o BMI <18.5 Kg/m2):
- Alternative 2:
o Unintentional weight loss + low age-related BMI
o Unintentional weight loss + low sex-related FFMI
17 (20.2%)
4 (4.8%)
7 (8.3%)
15 (17.9%)
4 (23.5%)
7 (41.2%)
15 (88.2%)
ASPEN/AND:
Prevalence of malnutrition (patients meet at least 2 ASPEN/AND criteria)
- Unintentional weight loss
- Loss of muscle mass
- Loss of subcutaneous fat
- Fluid accumulation
- Diminished hand grip strength
53 (63.1%)
25 (29.8%)
35 (41.7%)
6 (7.1%)
10 (11.9%)
76 (90.5%)
23 (43.4%)
25 (47.2%)
5 (9.4%)
10 (18.2%)
52 (98.2%)
Data are given as numbers and percentages. All patients were at risk of malnutrition (MNA-SF score ≤11).
In the malnutrition column, calculation of percentages is based on the number of patients diagnosed as malnourished (ESPEN, n= 17; ASPEN/AND, n= 53).
4
Table 3. Contingency table showing frequency of malnutrition according to ASPEN/AND basic definition and ESPEN basic diagnosis in
postacute care (n= 84).
ESPEN basic diagnosis
Positive Negative Total
ASPEN/AND
basic definition of malnutrition
Positive
16
37
53
Negative
1
30
31
Total 17 67 84
Abbreviations: ASPEN/AND, American Society of Parenteral and Enteral Nutrition / Academy of Nutrition and Dietetics; ESPEN, European
Society of Parenteral and Enteral Nutrition.
5
Table 4. Metrological statistics for the application of the ASPEN/AND definition of malnutrition.
Value 95% CI
Sensitivity (%)
Specificity (%)
Positive predictive value (%)
Negative predictive value (%)
Accuracy
Positive likelihood ratio
94.1
44.8
30.2
96.8
54.8
1.7
80.0 to 100
32.1 to 57.4
16.9 to 43.5
88.9 to 100
43.5 to 6
1.3 to 2.2
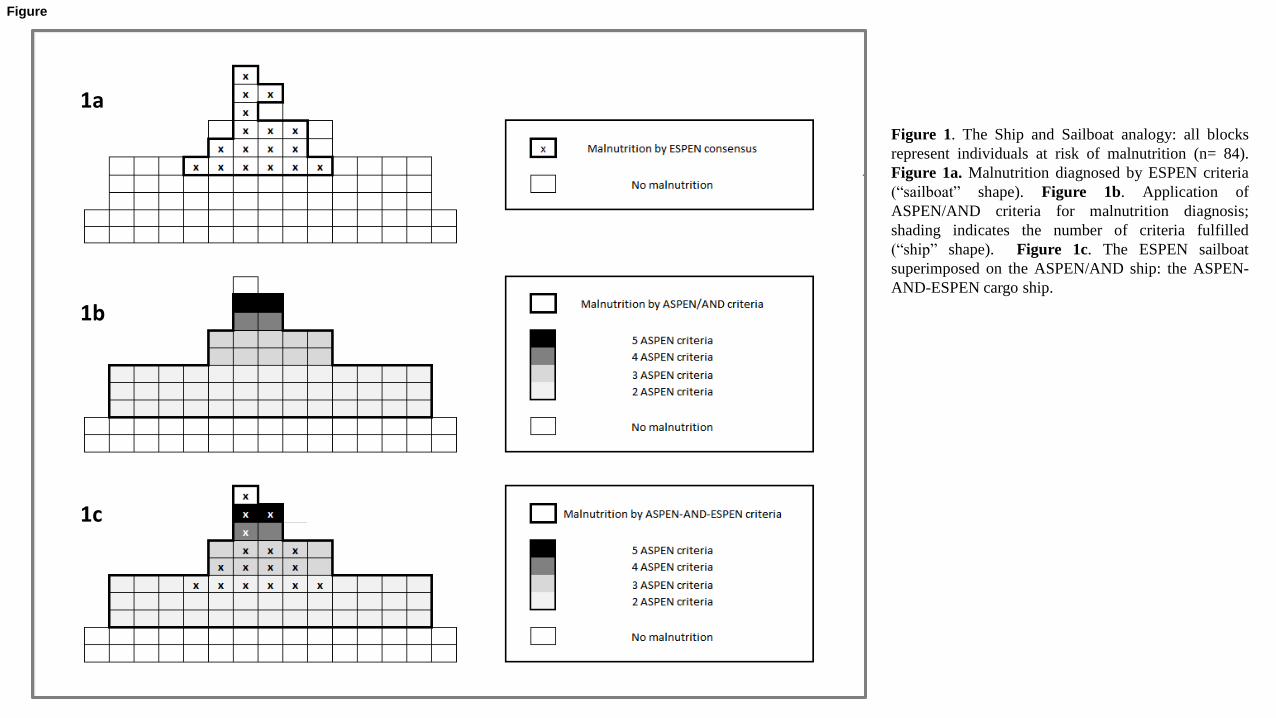
Figure 1. The Ship and Sailboat analogy: all blocks
represent individuals at risk of malnutrition (n= 84).
Figure 1a. Malnutrition diagnosed by ESPEN criteria
(“sailboat” shape). Figure 1b. Application of
ASPEN/AND criteria for malnutrition diagnosis;
shading indicates the number of criteria fulfilled
(“ship” shape). Figure 1c. The ESPEN sailboat
superimposed on the ASPEN/AND ship: the ASPEN-
AND-ESPEN cargo ship.
1a
1b
1c
Figure
Highlights
The ASPEN/AND definition yielded a much higher prevalence of malnutrition than the
ESPEN definition in a sample of geriatric patients in postacute care.
The ASPEN/AND set of basic criteria and ESPEN consensus showed fair agreement in
their diagnoses and fair comparative validity.
Further research is needed on nutritional assessment, both for malnutrition diagnosis
and for nutrition-related conditions.
Highlights (for review)

STROBE_ChecklistClick here to download Supplemental Reference File: STROBE_checklist.doc