Embed Size (px)
Citation preview
Aspecte ale competitivitatiieconomice a Romaniei
Ionut DumitruPresedinte Consiliul Fiscal, Economist-sef Raiffeisen Bank*
Mai 2014
*Opiniile exprimate sunt opinii personale ale autorului si nu implica institutiile cu careeste asociat.
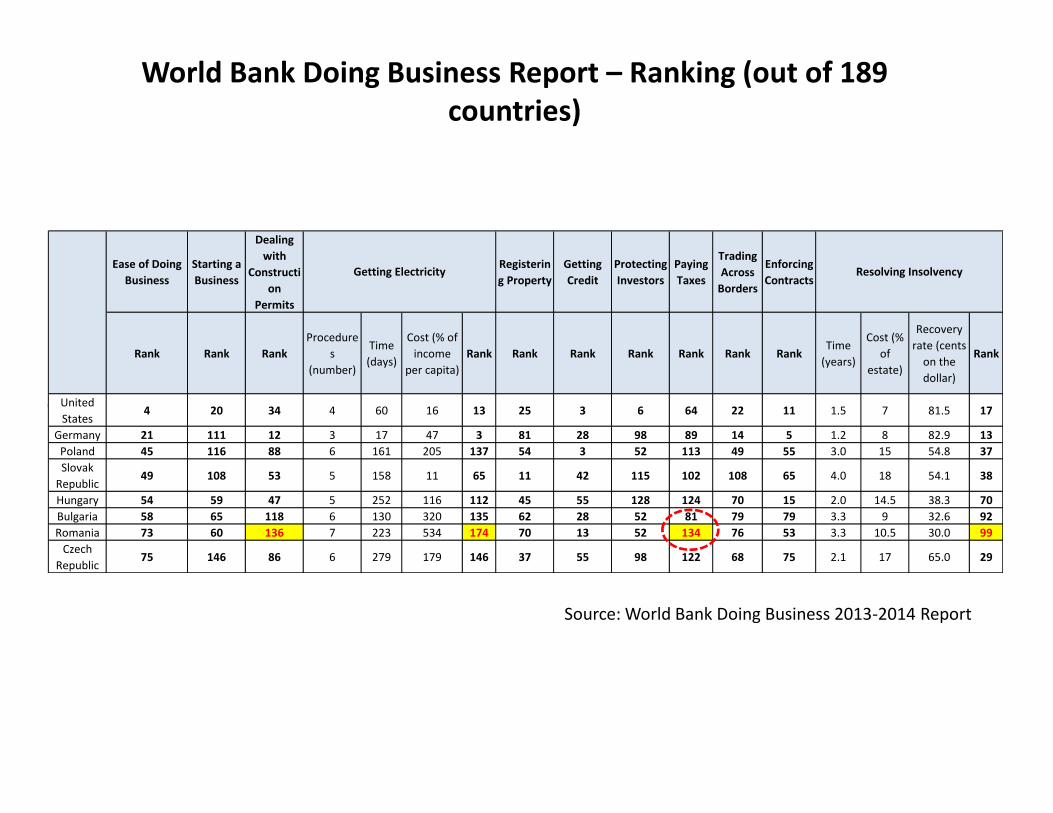
World Bank Doing Business Report – Ranking (out of 189countries)
Ease of DoingBusiness
Starting aBusiness
Dealingwith
Construction
Permits
Registering Property
GettingCredit
ProtectingInvestors
PayingTaxes
TradingAcross
Borders
EnforcingContracts
Rank Rank RankProcedure
s(number)
Time(days)
Cost (% ofincome
per capita)Rank Rank Rank Rank Rank Rank Rank
Time(years)
Cost (%of
estate)
Recoveryrate (cents
on thedollar)
Rank
UnitedStates
4 20 34 4 60 16 13 25 3 6 64 22 11 1.5 7 81.5 17
Germany 21 111 12 3 17 47 3 81 28 98 89 14 5 1.2 8 82.9 13Poland 45 116 88 6 161 205 137 54 3 52 113 49 55 3.0 15 54.8 37Slovak
Republic49 108 53 5 158 11 65 11 42 115 102 108 65 4.0 18 54.1 38
Hungary 54 59 47 5 252 116 112 45 55 128 124 70 15 2.0 14.5 38.3 70Bulgaria 58 65 118 6 130 320 135 62 28 52 81 79 79 3.3 9 32.6 92Romania 73 60 136 7 223 534 174 70 13 52 134 76 53 3.3 10.5 30.0 99
CzechRepublic
75 146 86 6 279 179 146 37 55 98 122 68 75 2.1 17 65.0 29
Getting Electricity Resolving InsolvencyEase of DoingBusiness
Starting aBusiness
Dealingwith
Construction
Permits
Registering Property
GettingCredit
ProtectingInvestors
PayingTaxes
TradingAcross
Borders
EnforcingContracts
Rank Rank RankProcedure
s(number)
Time(days)
Cost (% ofincome
per capita)Rank Rank Rank Rank Rank Rank Rank
Time(years)
Cost (%of
estate)
Recoveryrate (cents
on thedollar)
Rank
UnitedStates
4 20 34 4 60 16 13 25 3 6 64 22 11 1.5 7 81.5 17
Germany 21 111 12 3 17 47 3 81 28 98 89 14 5 1.2 8 82.9 13Poland 45 116 88 6 161 205 137 54 3 52 113 49 55 3.0 15 54.8 37Slovak
Republic49 108 53 5 158 11 65 11 42 115 102 108 65 4.0 18 54.1 38
Hungary 54 59 47 5 252 116 112 45 55 128 124 70 15 2.0 14.5 38.3 70Bulgaria 58 65 118 6 130 320 135 62 28 52 81 79 79 3.3 9 32.6 92Romania 73 60 136 7 223 534 174 70 13 52 134 76 53 3.3 10.5 30.0 99
CzechRepublic
75 146 86 6 279 179 146 37 55 98 122 68 75 2.1 17 65.0 29
Getting Electricity Resolving Insolvency
Source: World Bank Doing Business 2013-2014 Report
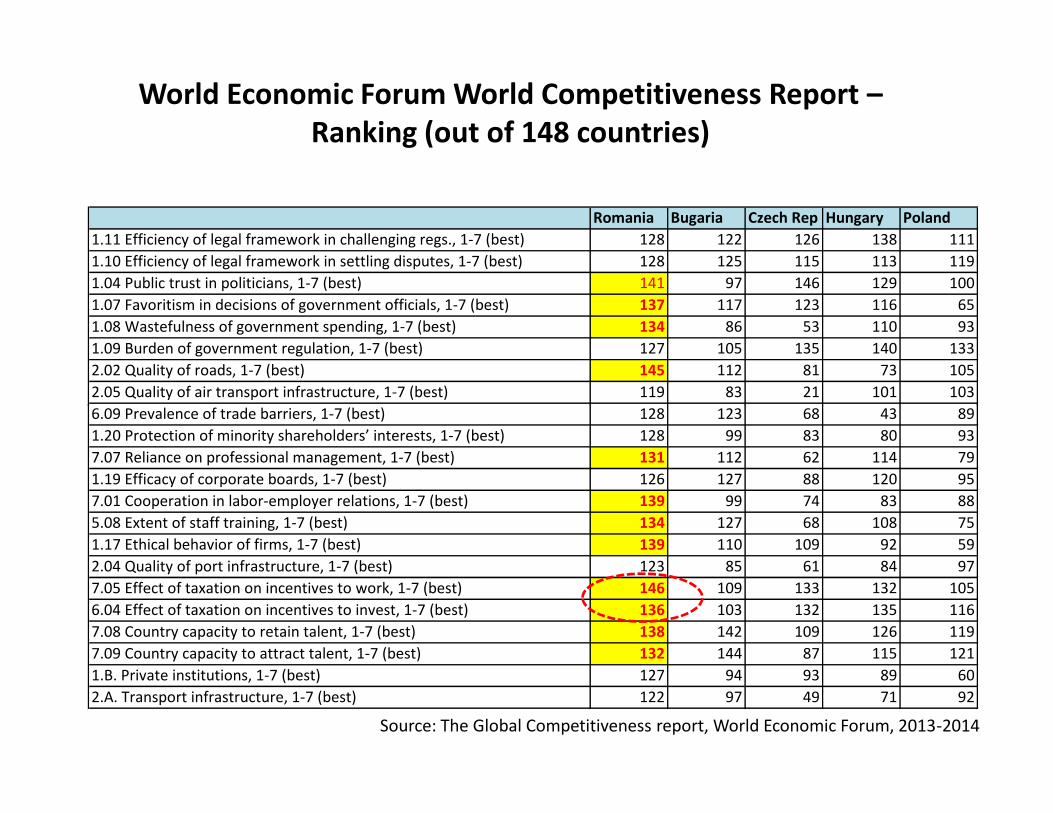
World Economic Forum World Competitiveness Report –Ranking (out of 148 countries)
Romania Bugaria Czech Rep Hungary Poland1.11 Efficiency of legal framework in challenging regs., 1-7 (best) 128 122 126 138 1111.10 Efficiency of legal framework in settling disputes, 1-7 (best) 128 125 115 113 1191.04 Public trust in politicians, 1-7 (best) 141 97 146 129 1001.07 Favoritism in decisions of government officials, 1-7 (best) 137 117 123 116 651.08 Wastefulness of government spending, 1-7 (best) 134 86 53 110 931.09 Burden of government regulation, 1-7 (best) 127 105 135 140 1332.02 Quality of roads, 1-7 (best) 145 112 81 73 1052.05 Quality of air transport infrastructure, 1-7 (best) 119 83 21 101 1036.09 Prevalence of trade barriers, 1-7 (best) 128 123 68 43 891.20 Protection of minority shareholders’ interests, 1-7 (best) 128 99 83 80 937.07 Reliance on professional management, 1-7 (best) 131 112 62 114 791.19 Efficacy of corporate boards, 1-7 (best) 126 127 88 120 957.01 Cooperation in labor-employer relations, 1-7 (best) 139 99 74 83 885.08 Extent of staff training, 1-7 (best) 134 127 68 108 751.17 Ethical behavior of firms, 1-7 (best) 139 110 109 92 592.04 Quality of port infrastructure, 1-7 (best) 123 85 61 84 977.05 Effect of taxation on incentives to work, 1-7 (best) 146 109 133 132 1056.04 Effect of taxation on incentives to invest, 1-7 (best) 136 103 132 135 1167.08 Country capacity to retain talent, 1-7 (best) 138 142 109 126 1197.09 Country capacity to attract talent, 1-7 (best) 132 144 87 115 1211.B. Private institutions, 1-7 (best) 127 94 93 89 602.A. Transport infrastructure, 1-7 (best) 122 97 49 71 92
Romania Bugaria Czech Rep Hungary Poland1.11 Efficiency of legal framework in challenging regs., 1-7 (best) 128 122 126 138 1111.10 Efficiency of legal framework in settling disputes, 1-7 (best) 128 125 115 113 1191.04 Public trust in politicians, 1-7 (best) 141 97 146 129 1001.07 Favoritism in decisions of government officials, 1-7 (best) 137 117 123 116 651.08 Wastefulness of government spending, 1-7 (best) 134 86 53 110 931.09 Burden of government regulation, 1-7 (best) 127 105 135 140 1332.02 Quality of roads, 1-7 (best) 145 112 81 73 1052.05 Quality of air transport infrastructure, 1-7 (best) 119 83 21 101 1036.09 Prevalence of trade barriers, 1-7 (best) 128 123 68 43 891.20 Protection of minority shareholders’ interests, 1-7 (best) 128 99 83 80 937.07 Reliance on professional management, 1-7 (best) 131 112 62 114 791.19 Efficacy of corporate boards, 1-7 (best) 126 127 88 120 957.01 Cooperation in labor-employer relations, 1-7 (best) 139 99 74 83 885.08 Extent of staff training, 1-7 (best) 134 127 68 108 751.17 Ethical behavior of firms, 1-7 (best) 139 110 109 92 592.04 Quality of port infrastructure, 1-7 (best) 123 85 61 84 977.05 Effect of taxation on incentives to work, 1-7 (best) 146 109 133 132 1056.04 Effect of taxation on incentives to invest, 1-7 (best) 136 103 132 135 1167.08 Country capacity to retain talent, 1-7 (best) 138 142 109 126 1197.09 Country capacity to attract talent, 1-7 (best) 132 144 87 115 1211.B. Private institutions, 1-7 (best) 127 94 93 89 602.A. Transport infrastructure, 1-7 (best) 122 97 49 71 92
Source: The Global Competitiveness report, World Economic Forum, 2013-2014
RankPayments
(number peryear)
Time (hoursper year)
Profit tax(%)
Labor tax andcontributions (%)
Othertaxes (%)
Total tax rate(% profit)
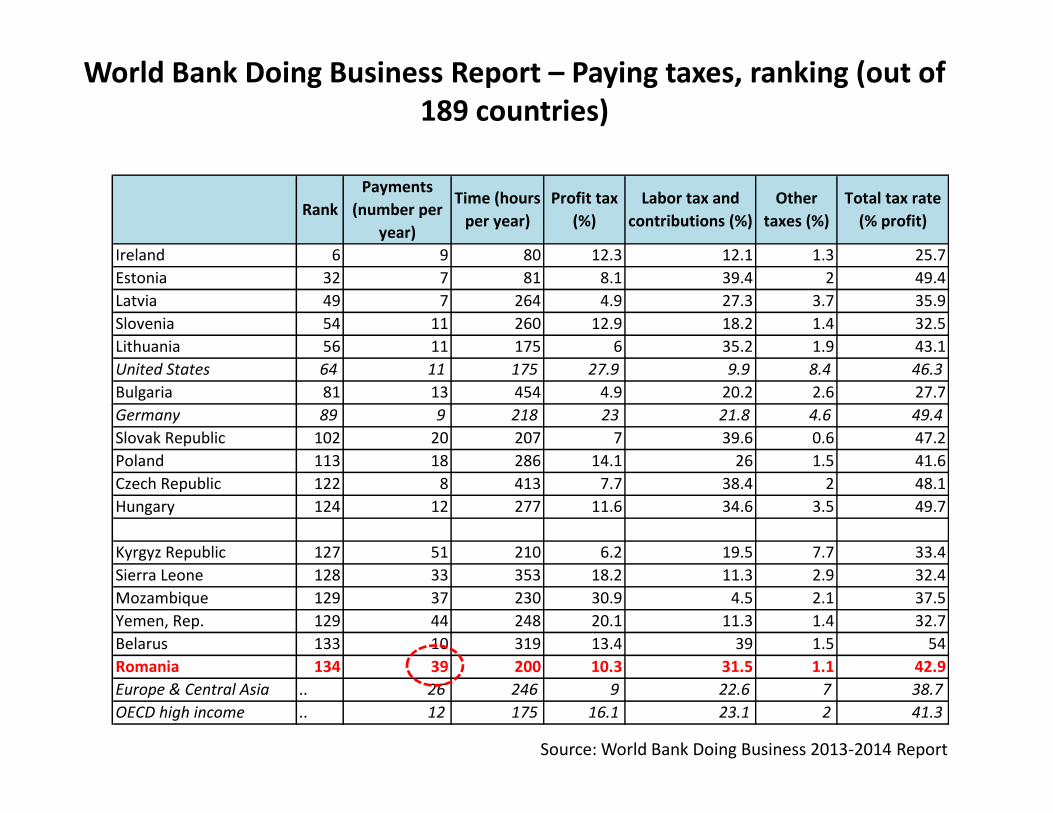
Ireland 6 9 80 12.3 12.1 1.3 25.7Estonia 32 7 81 8.1 39.4 2 49.4Latvia 49 7 264 4.9 27.3 3.7 35.9Slovenia 54 11 260 12.9 18.2 1.4 32.5Lithuania 56 11 175 6 35.2 1.9 43.1United States 64 11 175 27.9 9.9 8.4 46.3Bulgaria 81 13 454 4.9 20.2 2.6 27.7Germany 89 9 218 23 21.8 4.6 49.4Slovak Republic 102 20 207 7 39.6 0.6 47.2Poland 113 18 286 14.1 26 1.5 41.6Czech Republic 122 8 413 7.7 38.4 2 48.1Hungary 124 12 277 11.6 34.6 3.5 49.7
Kyrgyz Republic 127 51 210 6.2 19.5 7.7 33.4Sierra Leone 128 33 353 18.2 11.3 2.9 32.4Mozambique 129 37 230 30.9 4.5 2.1 37.5Yemen, Rep. 129 44 248 20.1 11.3 1.4 32.7Belarus 133 10 319 13.4 39 1.5 54Romania 134 39 200 10.3 31.5 1.1 42.9Europe & Central Asia .. 26 246 9 22.6 7 38.7OECD high income .. 12 175 16.1 23.1 2 41.3
World Bank Doing Business Report – Paying taxes, ranking (out of189 countries)
RankPayments
(number peryear)
Time (hoursper year)
Profit tax(%)
Labor tax andcontributions (%)
Othertaxes (%)
Total tax rate(% profit)
Ireland 6 9 80 12.3 12.1 1.3 25.7Estonia 32 7 81 8.1 39.4 2 49.4Latvia 49 7 264 4.9 27.3 3.7 35.9Slovenia 54 11 260 12.9 18.2 1.4 32.5Lithuania 56 11 175 6 35.2 1.9 43.1United States 64 11 175 27.9 9.9 8.4 46.3Bulgaria 81 13 454 4.9 20.2 2.6 27.7Germany 89 9 218 23 21.8 4.6 49.4Slovak Republic 102 20 207 7 39.6 0.6 47.2Poland 113 18 286 14.1 26 1.5 41.6Czech Republic 122 8 413 7.7 38.4 2 48.1Hungary 124 12 277 11.6 34.6 3.5 49.7
Kyrgyz Republic 127 51 210 6.2 19.5 7.7 33.4Sierra Leone 128 33 353 18.2 11.3 2.9 32.4Mozambique 129 37 230 30.9 4.5 2.1 37.5Yemen, Rep. 129 44 248 20.1 11.3 1.4 32.7Belarus 133 10 319 13.4 39 1.5 54Romania 134 39 200 10.3 31.5 1.1 42.9Europe & Central Asia .. 26 246 9 22.6 7 38.7OECD high income .. 12 175 16.1 23.1 2 41.3
Source: World Bank Doing Business 2013-2014 Report
Tax or mandatorycontribution
Payments(number)
Notes onPayments
Total taxrate (%profit)
Tax or mandatorycontribution
Payments(number)
Notes onPayments
Total taxrate (%profit)
Tax or mandatorycontribution
Payments(number)
Notes onPayments
Total taxrate (%profit)
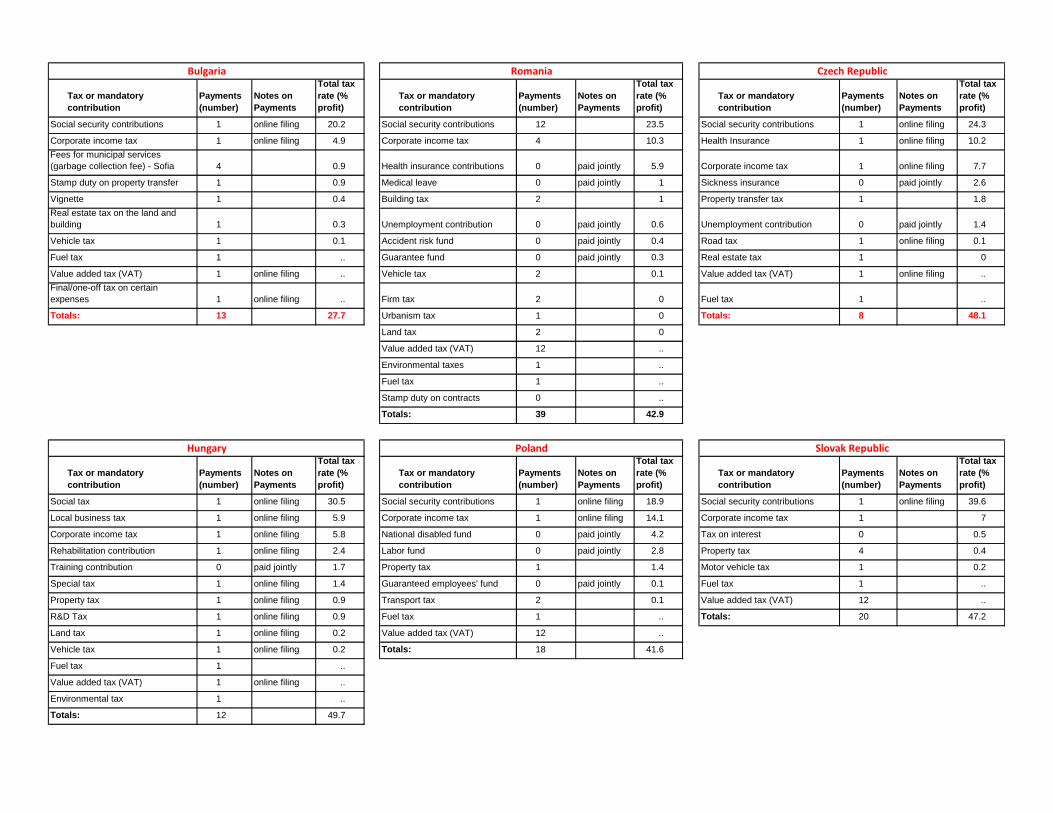
Social security contributions 1 online filing 20.2 Social security contributions 12 23.5 Social security contributions 1 online filing 24.3
Corporate income tax 1 online filing 4.9 Corporate income tax 4 10.3 Health Insurance 1 online filing 10.2Fees for municipal services(garbage collection fee) - Sofia 4 0.9 Health insurance contributions 0 paid jointly 5.9 Corporate income tax 1 online filing 7.7
Stamp duty on property transfer 1 0.9 Medical leave 0 paid jointly 1 Sickness insurance 0 paid jointly 2.6
Vignette 1 0.4 Building tax 2 1 Property transfer tax 1 1.8Real estate tax on the land andbuilding 1 0.3 Unemployment contribution 0 paid jointly 0.6 Unemployment contribution 0 paid jointly 1.4
Vehicle tax 1 0.1 Accident risk fund 0 paid jointly 0.4 Road tax 1 online filing 0.1
Fuel tax 1 .. Guarantee fund 0 paid jointly 0.3 Real estate tax 1 0
Value added tax (VAT) 1 online filing .. Vehicle tax 2 0.1 Value added tax (VAT) 1 online filing ..Final/one-off tax on certainexpenses 1 online filing .. Firm tax 2 0 Fuel tax 1 ..
Totals: 13 27.7 Urbanism tax 1 0 Totals: 8 48.1
Land tax 2 0
Value added tax (VAT) 12 ..
Environmental taxes 1 ..
Fuel tax 1 ..
Stamp duty on contracts 0 ..
Totals: 39 42.9
Tax or mandatorycontribution
Payments(number)
Notes onPayments
Total taxrate (%profit)
Tax or mandatorycontribution
Payments(number)
Notes onPayments
Total taxrate (%profit)
Tax or mandatorycontribution
Payments(number)
Notes onPayments
Total taxrate (%profit)
Social tax 1 online filing 30.5 Social security contributions 1 online filing 18.9 Social security contributions 1 online filing 39.6
Local business tax 1 online filing 5.9 Corporate income tax 1 online filing 14.1 Corporate income tax 1 7
Corporate income tax 1 online filing 5.8 National disabled fund 0 paid jointly 4.2 Tax on interest 0 0.5
Rehabilitation contribution 1 online filing 2.4 Labor fund 0 paid jointly 2.8 Property tax 4 0.4
Training contribution 0 paid jointly 1.7 Property tax 1 1.4 Motor vehicle tax 1 0.2
Special tax 1 online filing 1.4 Guaranteed employees' fund 0 paid jointly 0.1 Fuel tax 1 ..
Property tax 1 online filing 0.9 Transport tax 2 0.1 Value added tax (VAT) 12 ..
R&D Tax 1 online filing 0.9 Fuel tax 1 .. Totals: 20 47.2
Land tax 1 online filing 0.2 Value added tax (VAT) 12 ..
Vehicle tax 1 online filing 0.2 Totals: 18 41.6
Fuel tax 1 ..
Value added tax (VAT) 1 online filing ..
Environmental tax 1 ..
Totals: 12 49.7
Bulgaria Romania Czech Republic
Hungary Poland Slovak Republic
Tax or mandatorycontribution
Payments(number)
Notes onPayments
Total taxrate (%profit)
Tax or mandatorycontribution
Payments(number)
Notes onPayments
Total taxrate (%profit)
Tax or mandatorycontribution
Payments(number)
Notes onPayments
Total taxrate (%profit)
Social security contributions 1 online filing 20.2 Social security contributions 12 23.5 Social security contributions 1 online filing 24.3
Corporate income tax 1 online filing 4.9 Corporate income tax 4 10.3 Health Insurance 1 online filing 10.2Fees for municipal services(garbage collection fee) - Sofia 4 0.9 Health insurance contributions 0 paid jointly 5.9 Corporate income tax 1 online filing 7.7
Stamp duty on property transfer 1 0.9 Medical leave 0 paid jointly 1 Sickness insurance 0 paid jointly 2.6
Vignette 1 0.4 Building tax 2 1 Property transfer tax 1 1.8Real estate tax on the land andbuilding 1 0.3 Unemployment contribution 0 paid jointly 0.6 Unemployment contribution 0 paid jointly 1.4
Vehicle tax 1 0.1 Accident risk fund 0 paid jointly 0.4 Road tax 1 online filing 0.1
Fuel tax 1 .. Guarantee fund 0 paid jointly 0.3 Real estate tax 1 0
Value added tax (VAT) 1 online filing .. Vehicle tax 2 0.1 Value added tax (VAT) 1 online filing ..Final/one-off tax on certainexpenses 1 online filing .. Firm tax 2 0 Fuel tax 1 ..
Totals: 13 27.7 Urbanism tax 1 0 Totals: 8 48.1
Land tax 2 0
Value added tax (VAT) 12 ..
Environmental taxes 1 ..
Fuel tax 1 ..
Stamp duty on contracts 0 ..
Totals: 39 42.9
Tax or mandatorycontribution
Payments(number)
Notes onPayments
Total taxrate (%profit)
Tax or mandatorycontribution
Payments(number)
Notes onPayments
Total taxrate (%profit)
Tax or mandatorycontribution
Payments(number)
Notes onPayments
Total taxrate (%profit)
Social tax 1 online filing 30.5 Social security contributions 1 online filing 18.9 Social security contributions 1 online filing 39.6
Local business tax 1 online filing 5.9 Corporate income tax 1 online filing 14.1 Corporate income tax 1 7
Corporate income tax 1 online filing 5.8 National disabled fund 0 paid jointly 4.2 Tax on interest 0 0.5
Rehabilitation contribution 1 online filing 2.4 Labor fund 0 paid jointly 2.8 Property tax 4 0.4
Training contribution 0 paid jointly 1.7 Property tax 1 1.4 Motor vehicle tax 1 0.2
Special tax 1 online filing 1.4 Guaranteed employees' fund 0 paid jointly 0.1 Fuel tax 1 ..
Property tax 1 online filing 0.9 Transport tax 2 0.1 Value added tax (VAT) 12 ..
R&D Tax 1 online filing 0.9 Fuel tax 1 .. Totals: 20 47.2
Land tax 1 online filing 0.2 Value added tax (VAT) 12 ..
Vehicle tax 1 online filing 0.2 Totals: 18 41.6
Fuel tax 1 ..
Value added tax (VAT) 1 online filing ..
Environmental tax 1 ..
Totals: 12 49.7
Bulgaria Romania Czech Republic
Hungary Poland Slovak Republic
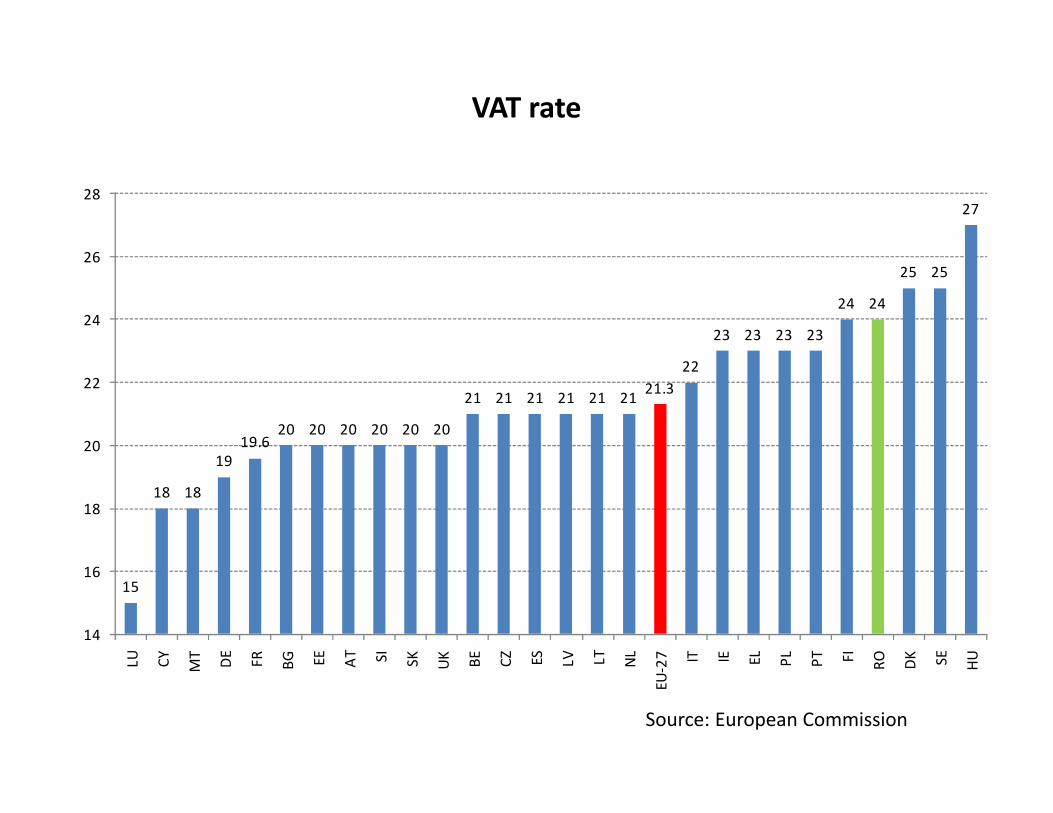
VAT rate
15
18 18
1919.6
20 20 20 20 20 20
21 21 21 21 21 21 21.322
23 23 23 23
24 24
25 25
27
14
16
18
20
22
24
26
28
LU CY MT DE FR BG EE AT SI SK UK BE CZ ES LV LT NL
EU-2
7 IT IE EL PL PT FI RO DK SE HU
15
18 18
1919.6
20 20 20 20 20 20
21 21 21 21 21 21 21.322
23 23 23 23
24 24
25 25
27
14
16
18
20
22
24
26
28
LU CY MT DE FR BG EE AT SI SK UK BE CZ ES LV LT NL
EU-2
7 IT IE EL PL PT FI RO DK SE HU
Source: European Commission
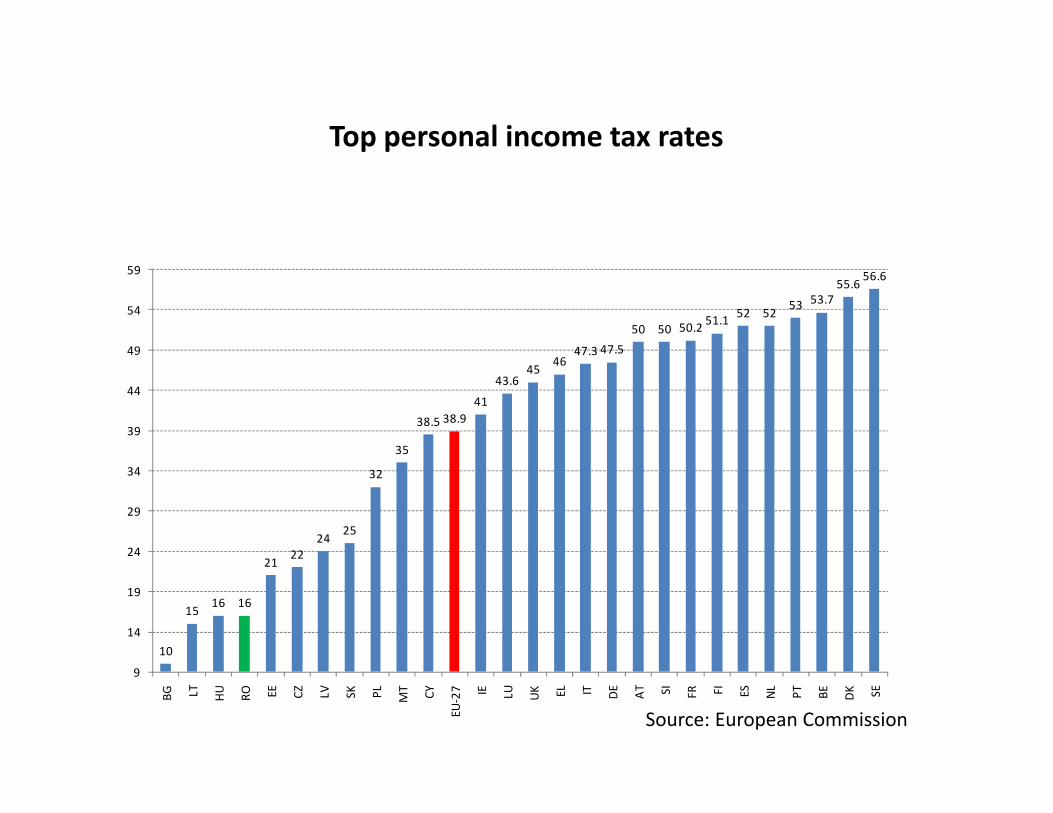
Top personal income tax rates
10
15 16 16
21 2224 25
32
35
38.5 38.941
43.645 46
47.3 47.550 50 50.2 51.1 52 52 53 53.7
55.6 56.6
9
14
19
24
29
34
39
44
49
54
59
BG LT HU RO EE CZ LV SK PL MT CY
EU-2
7 IE LU UK EL IT DE AT SI FR FI ES NL PT BE DK SE
10
15 16 16
21 2224 25
32
35
38.5 38.941
43.645 46
47.3 47.550 50 50.2 51.1 52 52 53 53.7
55.6 56.6
9
14
19
24
29
34
39
44
49
54
59
BG LT HU RO EE CZ LV SK PL MT CY
EU-2
7 IE LU UK EL IT DE AT SI FR FI ES NL PT BE DK SE
Source: European Commission
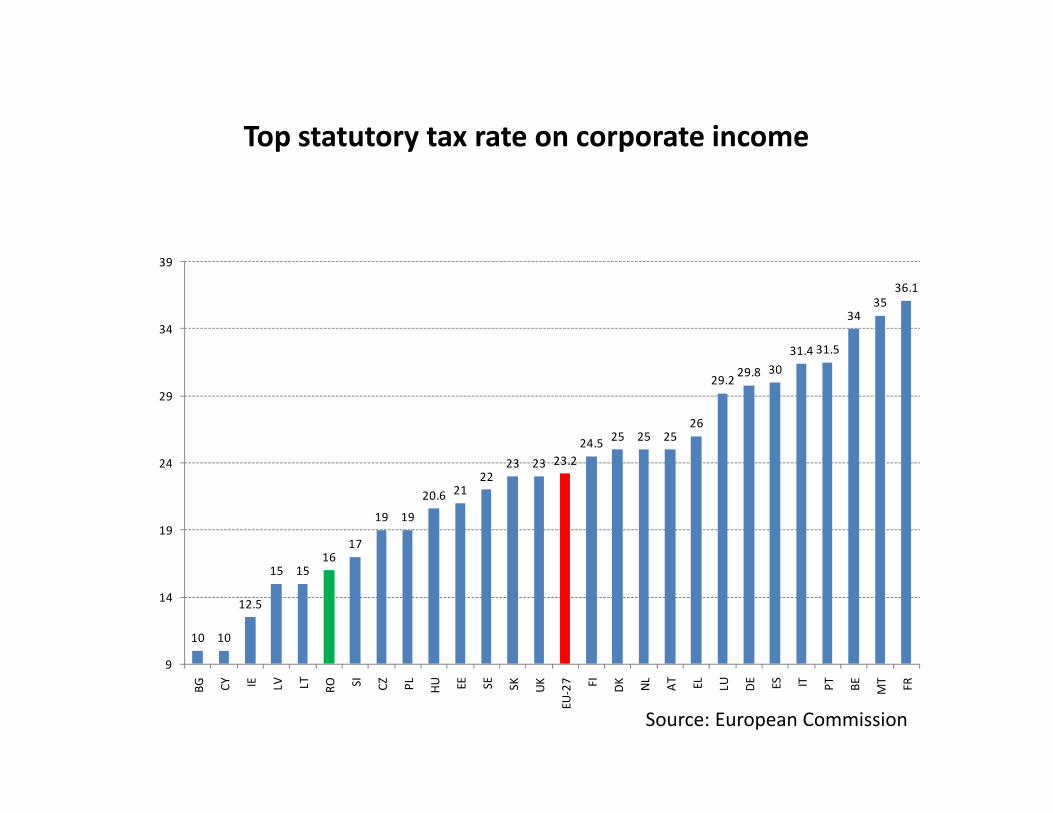
Top statutory tax rate on corporate income
10 10
12.5
15 1516
17
19 19
20.6 2122
23 23 23.224.5 25 25 25
26
29.2 29.8 3031.4 31.5
3435
36.1
9
14
19
24
29
34
39
BG CY IE LV LT RO SI CZ PL HU EE SE SK UK
EU-2
7 FI DK NL AT EL LU DE ES IT PT BE MT FR
10 10
12.5
15 1516
17
19 19
20.6 2122
23 23 23.224.5 25 25 25
26
29.2 29.8 3031.4 31.5
3435
36.1
9
14
19
24
29
34
39
BG CY IE LV LT RO SI CZ PL HU EE SE SK UK
EU-2
7 FI DK NL AT EL LU DE ES IT PT BE MT FR
Source: European Commission
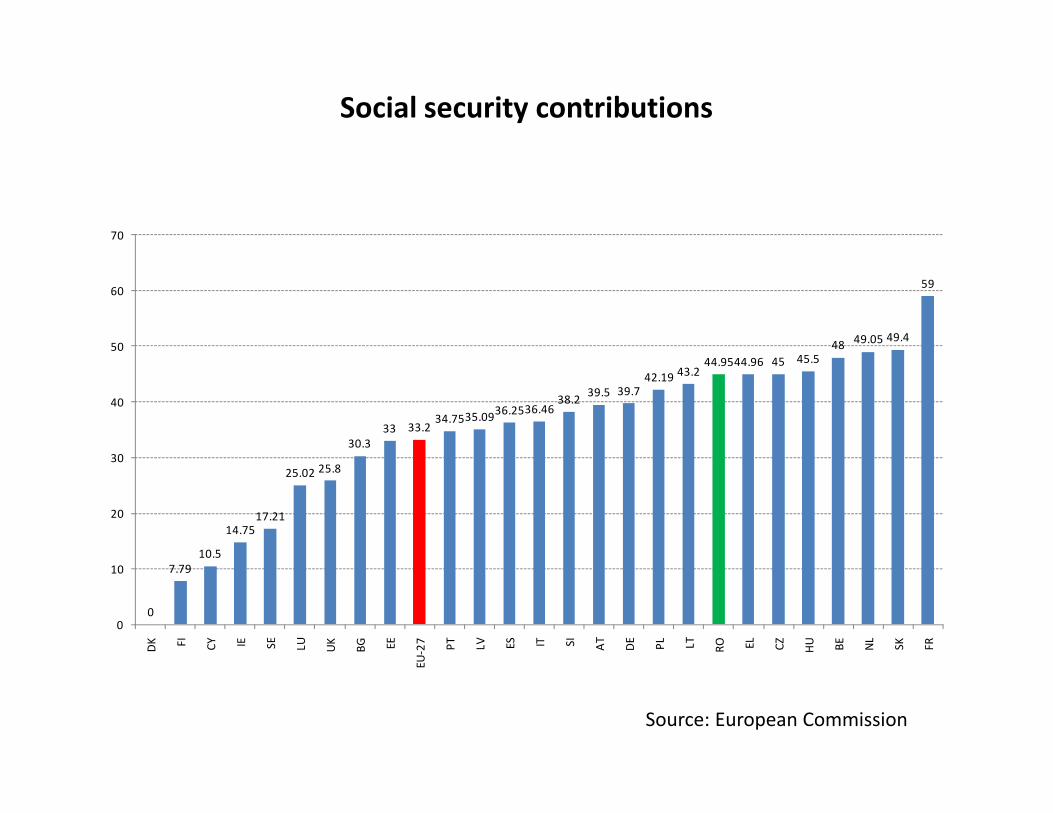
Social security contributions
0
7.7910.5
14.7517.21
25.02 25.8
30.333 33.2
34.7535.0936.2536.4638.2 39.5 39.7
42.19 43.244.9544.96 45 45.5
48 49.05 49.4
59
0
10
20
30
40
50
60
70
DK FI CY IE SE LU UK BG EE
EU-2
7 PT LV ES IT SI AT DE PL LT RO EL CZ HU BE NL SK FR
0
7.7910.5
14.7517.21
25.02 25.8
30.333 33.2
34.7535.0936.2536.4638.2 39.5 39.7
42.19 43.244.9544.96 45 45.5
48 49.05 49.4
59
0
10
20
30
40
50
60
70
DK FI CY IE SE LU UK BG EE
EU-2
7 PT LV ES IT SI AT DE PL LT RO EL CZ HU BE NL SK FR
Source: European Commission
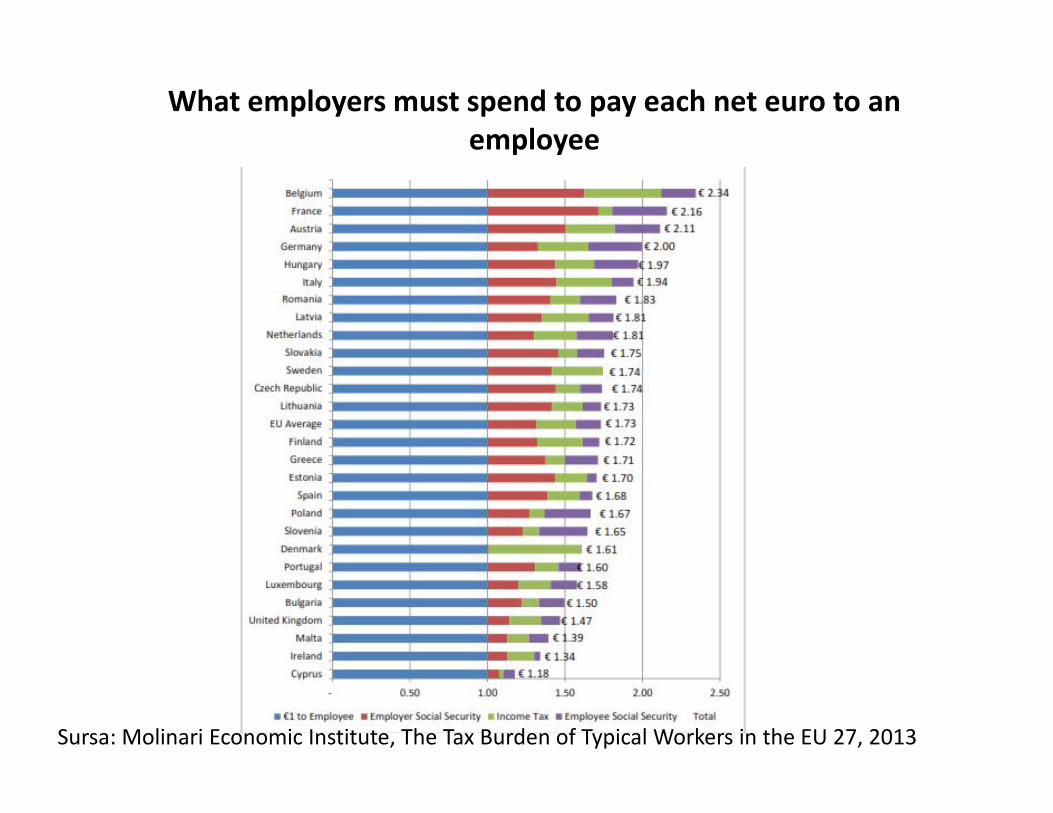
What employers must spend to pay each net euro to anemployee
Sursa: Molinari Economic Institute, The Tax Burden of Typical Workers in the EU 27, 2013
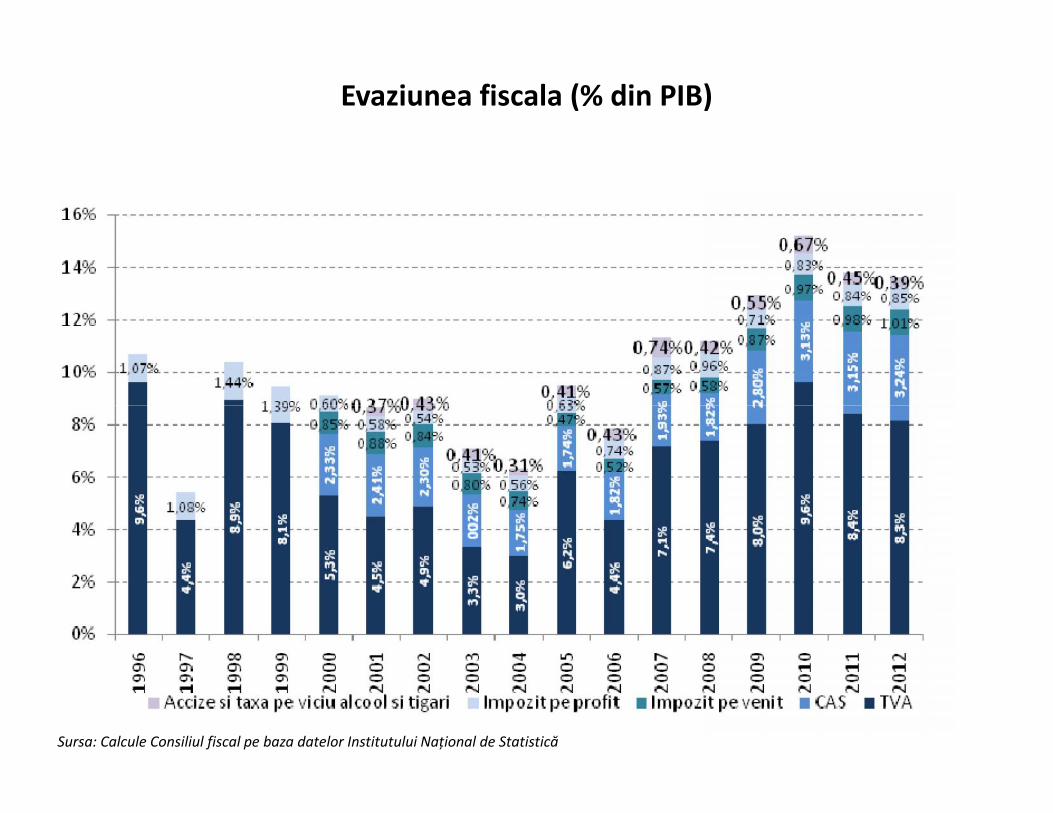
Evaziunea fiscala (% din PIB)
Sursa: Calcule Consiliul fiscal pe baza datelor Institutului Național de Statistică
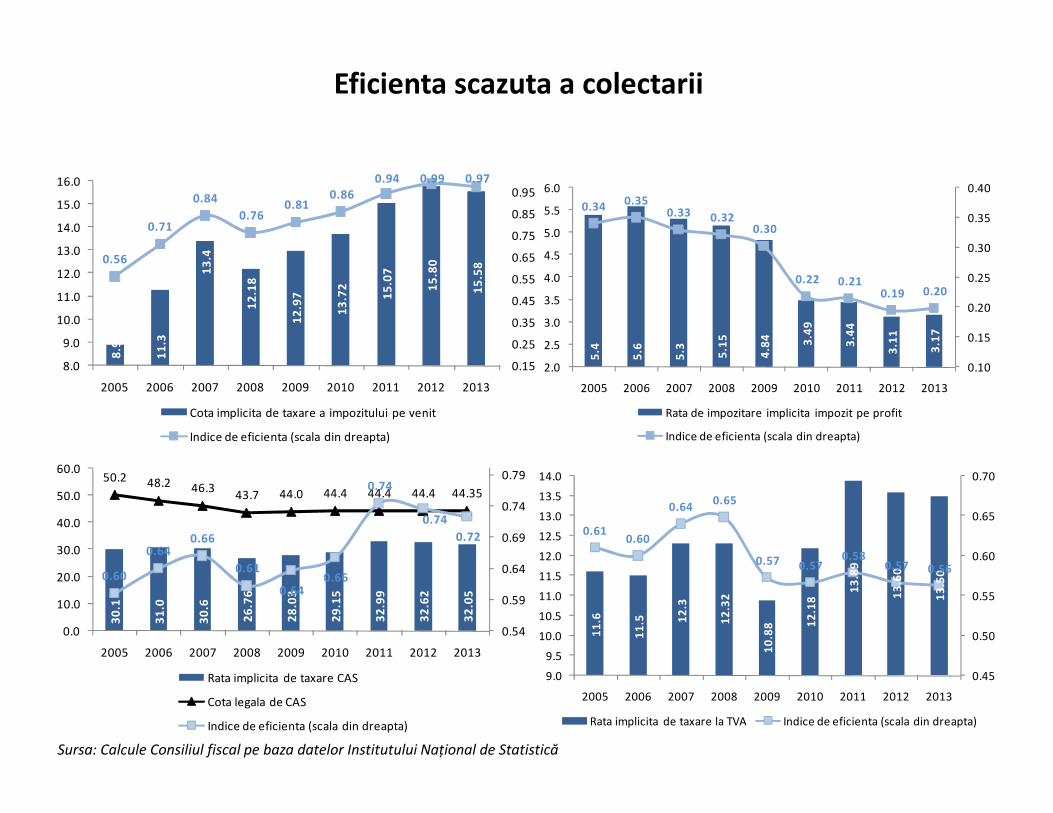
Eficienta scazuta a colectarii8.
9
11.3
13.4
12.1
8
12.9
7
13.7
2
15.0
7
15.8
0
15.5
80.56
0.71
0.840.76
0.810.86
0.94 0.99 0.97
0.15
0.25
0.35
0.45
0.55
0.65
0.75
0.85
0.95
8.0
9.0
10.0
11.0
12.0
13.0
14.0
15.0
16.0
2005 2006 2007 2008 2009 2010 2011 2012 2013
Cota implicita de taxare a impozitului pe venit
Indice de eficienta (scala din dreapta)
5.4
5.6
5.3
5.15
4.84 3.
49
3.44
3.11
3.17
0.34 0.350.33 0.32
0.30
0.22 0.210.19 0.20
0.10
0.15
0.20
0.25
0.30
0.35
0.40
2.0
2.5
3.0
3.5
4.0
4.5
5.0
5.5
6.0
2005 2006 2007 2008 2009 2010 2011 2012 2013
Rata de impozitare implicita impozit pe profit
Indice de eficienta (scala din dreapta)
8.9
11.3
13.4
12.1
8
12.9
7
13.7
2
15.0
7
15.8
0
15.5
80.56
0.71
0.840.76
0.810.86
0.94 0.99 0.97
0.15
0.25
0.35
0.45
0.55
0.65
0.75
0.85
0.95
8.0
9.0
10.0
11.0
12.0
13.0
14.0
15.0
16.0
2005 2006 2007 2008 2009 2010 2011 2012 2013
Cota implicita de taxare a impozitului pe venit
Indice de eficienta (scala din dreapta)
5.4
5.6
5.3
5.15
4.84 3.
49
3.44
3.11
3.17
0.34 0.350.33 0.32
0.30
0.22 0.210.19 0.20
0.10
0.15
0.20
0.25
0.30
0.35
0.40
2.0
2.5
3.0
3.5
4.0
4.5
5.0
5.5
6.0
2005 2006 2007 2008 2009 2010 2011 2012 2013
Rata de impozitare implicita impozit pe profit
Indice de eficienta (scala din dreapta)
30.1
31.0
30.6
26.7
6
28.0
3
29.1
5
32.9
9
32.6
2
32.0
550.2 48.2 46.3 43.7 44.0 44.4 44.4 44.4 44.35
0.60
0.640.66
0.61
0.640.66
0.74
0.740.72
0.54
0.59
0.64
0.69
0.74
0.79
0.0
10.0
20.0
30.0
40.0
50.0
60.0
2005 2006 2007 2008 2009 2010 2011 2012 2013
Rata implicita de taxare CAS
Cota legala de CAS
Indice de eficienta (scala din dreapta)
11.6
11.5 12
.3
12.3
2
10.8
8 12.1
8
13.8
9
13.6
0
13.5
0
0.61 0.60
0.64 0.65
0.57 0.570.58
0.57 0.56
0.45
0.50
0.55
0.60
0.65
0.70
9.0
9.5
10.0
10.5
11.0
11.5
12.0
12.5
13.0
13.5
14.0
2005 2006 2007 2008 2009 2010 2011 2012 2013
Rata implicita de taxare la TVA Indice de eficienta (scala din dreapta)
Sursa: Calcule Consiliul fiscal pe baza datelor Institutului Național de Statistică
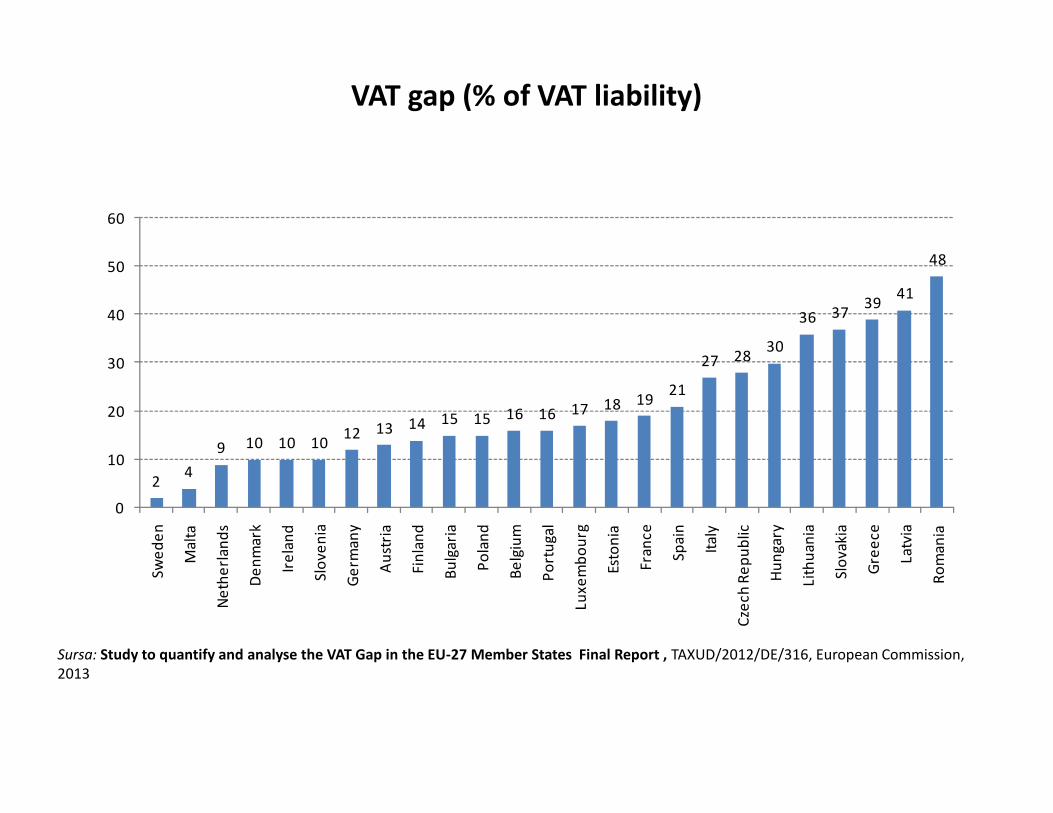
2 49 10 10 10 12 13 14 15 15 16 16 17 18 19 21
27 28 30
36 37 39 41
48
0
10
20
30
40
50
60
Swed
en
Mal
ta
Neth
erla
nds
Denm
ark
Irela
nd
Slov
enia
Germ
any
Aust
ria
Finl
and
Bulg
aria
Pola
nd
Belg
ium
Port
ugal
Luxe
mbo
urg
Esto
nia
Fran
ce
Spai
n
Italy
Czec
h Re
publ
ic
Hung
ary
Lith
uani
a
Slov
akia
Gree
ce
Latv
ia
Rom
ania
VAT gap (% of VAT liability)
2 49 10 10 10 12 13 14 15 15 16 16 17 18 19 21
27 28 30
36 37 39 41
48
0
10
20
30
40
50
60
Swed
en
Mal
ta
Neth
erla
nds
Denm
ark
Irela
nd
Slov
enia
Germ
any
Aust
ria
Finl
and
Bulg
aria
Pola
nd
Belg
ium
Port
ugal
Luxe
mbo
urg
Esto
nia
Fran
ce
Spai
n
Italy
Czec
h Re
publ
ic
Hung
ary
Lith
uani
a
Slov
akia
Gree
ce
Latv
ia
Rom
ania
Sursa: Study to quantify and analyse the VAT Gap in the EU-27 Member States Final Report , TAXUD/2012/DE/316, European Commission,2013
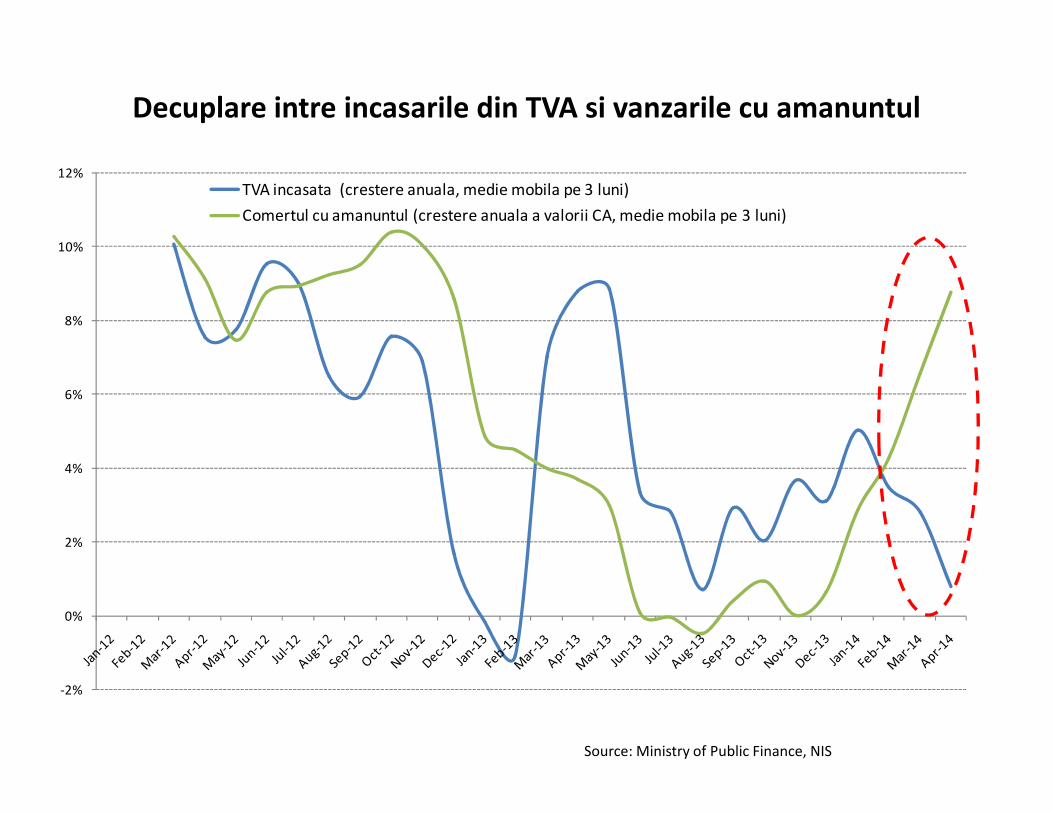
Decuplare intre incasarile din TVA si vanzarile cu amanuntul
-2%
0%
2%
4%
6%
8%
10%
12%TVA incasata (crestere anuala, medie mobila pe 3 luni)Comertul cu amanuntul (crestere anuala a valorii CA, medie mobila pe 3 luni)
-2%
0%
2%
4%
6%
8%
10%
12%TVA incasata (crestere anuala, medie mobila pe 3 luni)Comertul cu amanuntul (crestere anuala a valorii CA, medie mobila pe 3 luni)
Source: Ministry of Public Finance, NIS
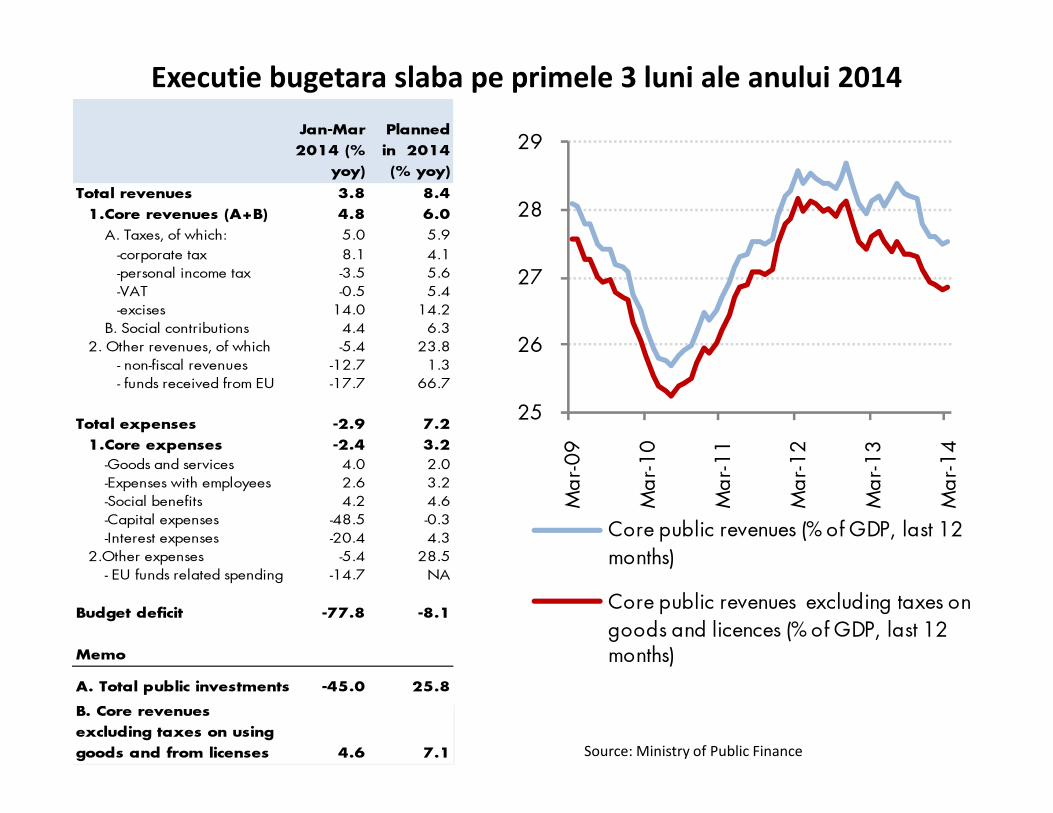
Executie bugetara slaba pe primele 3 luni ale anului 2014
Total revenues 3.8 8.41.Core revenues (A+B) 4.8 6.0
A. Taxes, of which: 5.0 5.9 -corporate tax 8.1 4.1 -personal income tax -3.5 5.6 -VAT -0.5 5.4 -excises 14.0 14.2
B. Social contributions 4.4 6.32. Other revenues, of which -5.4 23.8
- non-fiscal revenues -12.7 1.3 - funds received from EU -17.7 66.7
Total expenses -2.9 7.21.Core expenses -2.4 3.2
-Goods and services 4.0 2.0 -Expenses with employees 2.6 3.2 -Social benefits 4.2 4.6 -Capital expenses -48.5 -0.3 -Interest expenses -20.4 4.3
2.Other expenses -5.4 28.5 - EU funds related spending -14.7 NA
Budget deficit -77.8 -8.1
Memo
A. Total public investments -45.0 25.8
B. Core revenuesexcluding taxes on usinggoods and from licenses 4.6 7.1
Plannedin 2014(% yoy)
Jan-Mar2014 (%
yoy)
25
26
27
28
29
Mar
-09
Mar
-10
Mar
-11
Mar
-12
Mar
-13
Mar
-14
Core public revenues (% of GDP, last 12months)
Core public revenues excluding taxes ongoods and licences (% of GDP, last 12months)
Source: Ministry of Public Finance