Embed Size (px)
Citation preview
w w w . a u t o s t e e l . o r g
A/SP Standardization of Hole Expansion Test
Mai Huang
ArcelorMittal Global R&D – East Chicago
Jugraj Singh
Chrysler Group LLC
Insert Company
Logo Here
w w w . a u t o s t e e l . o r g
Introduction
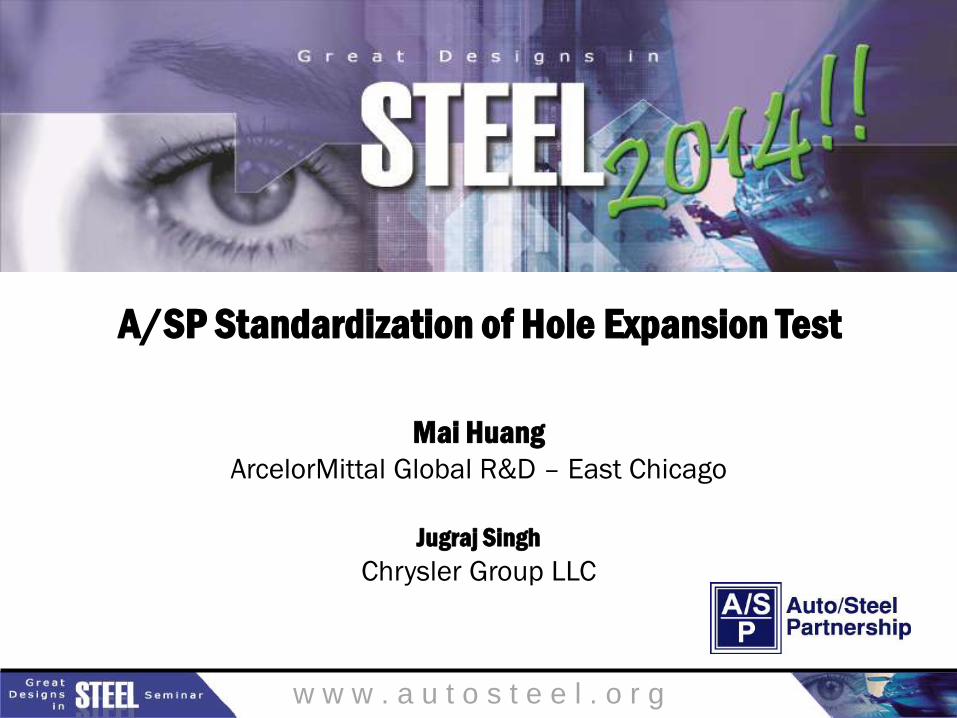
• Newly developed AHSS have good ‘Global’ Formability (FLD,
elongation, n-value)
• Concerns center around ‘local’ formability
Bendability, ability of bending-under-tension
Stretch flangeability, edge cracking & tearing
w w w . a u t o s t e e l . o r g
Introduction Insert Company
Logo Here
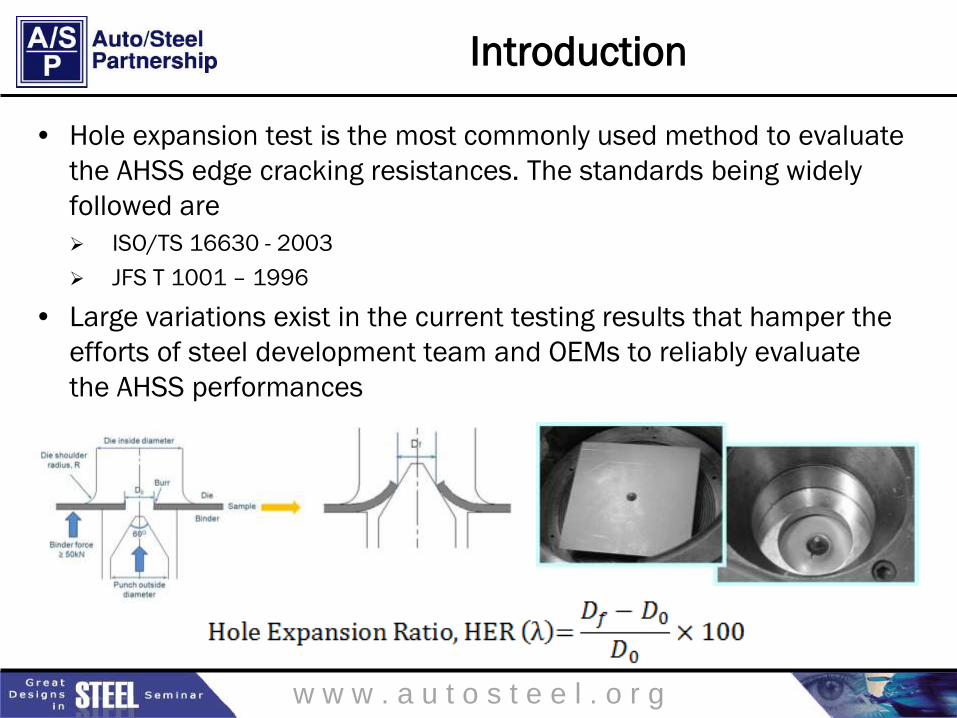
• Hole expansion test is the most commonly used method to evaluate
the AHSS edge cracking resistances. The standards being widely
followed are
ISO/TS 16630 - 2003
JFS T 1001 – 1996
• Large variations exist in the current testing results that hamper the
efforts of steel development team and OEMs to reliably evaluate
the AHSS performances
w w w . a u t o s t e e l . o r g
Introduction Insert Company
Logo Here
•A/SP STHT Team – Chrysler, Ford, GM, AK Steel, ArcelorMittal USA (AM),
Nucor, Severstal NA, ThyssenKrupp USA (TKS), USS
•Project objectives
Investigate testing variations within a facility and among facilities
Minimize testing variations with the standardization and optimization of testing tools, setups
and procedure
Develop a standard hole expansion test for NA steel and automotive industries
•Phase 1 – Conduct round robin tests for 6 steel suppliers
Study 1 – Determine the hole expansion test variations within a facility and among the facilities
– 1/2013
Study 2 - Determine the hole piercing operation variations – 5/2013
Study 3 – Optimize the hole making method to reduce test variations – 10/2013
•Phase 2 – Establish the test standard – 2/2014
•Phase 3 – Standardize / commonize the testing tools, setups and
procedure according to the test standard – 12/2014
w w w . a u t o s t e e l . o r g
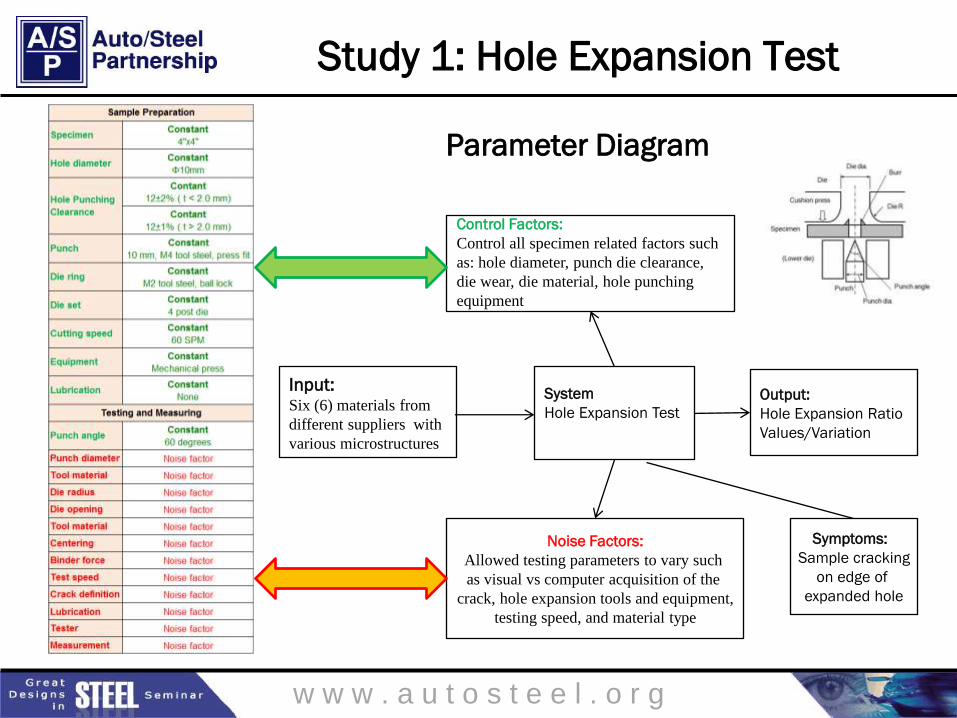
Parameter Diagram
Study 1: Hole Expansion Test
Control Factors:
Control all specimen related factors such
as: hole diameter, punch die clearance,
die wear, die material, hole punching
equipment
Output:
Hole Expansion Ratio
Values/Variation
Noise Factors:
Allowed testing parameters to vary such
as visual vs computer acquisition of the
crack, hole expansion tools and equipment,
testing speed, and material type
System
Hole Expansion Test
Input: Six (6) materials from
different suppliers with
various microstructures
Symptoms:
Sample cracking
on edge of
expanded hole
w w w . a u t o s t e e l . o r g
Sampling Control Insert Company
Logo Here
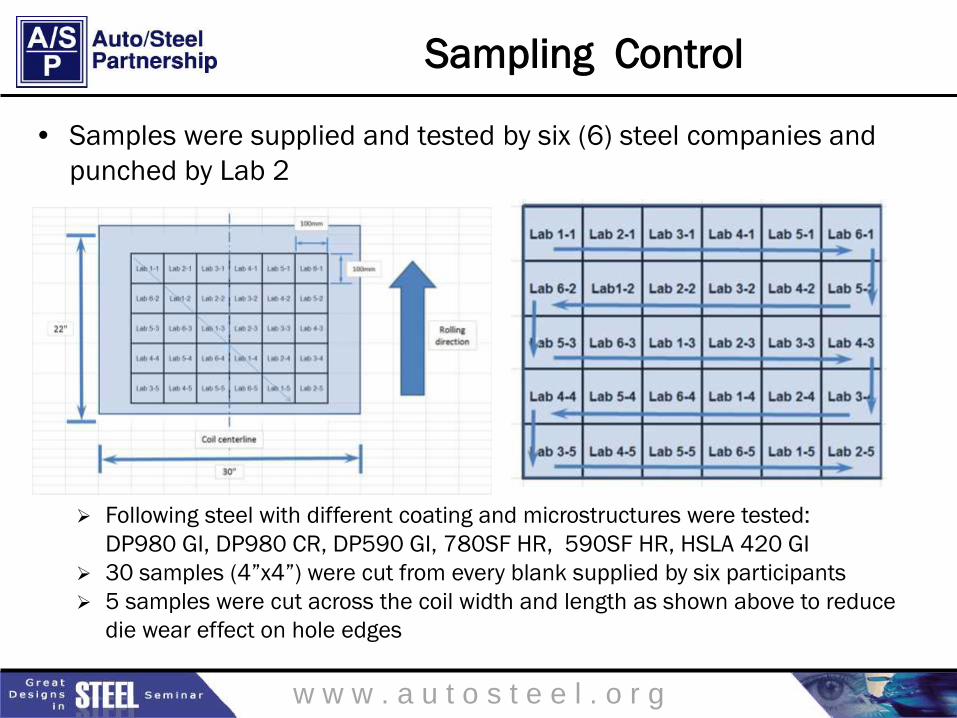
• Samples were supplied and tested by six (6) steel companies and
punched by Lab 2
Following steel with different coating and microstructures were tested:
DP980 GI, DP980 CR, DP590 GI, 780SF HR, 590SF HR, HSLA 420 GI
30 samples (4”x4”) were cut from every blank supplied by six participants
5 samples were cut across the coil width and length as shown above to reduce
die wear effect on hole edges
w w w . a u t o s t e e l . o r g
Digital Imaging System vs. Manual Test Insert Company
Logo Here
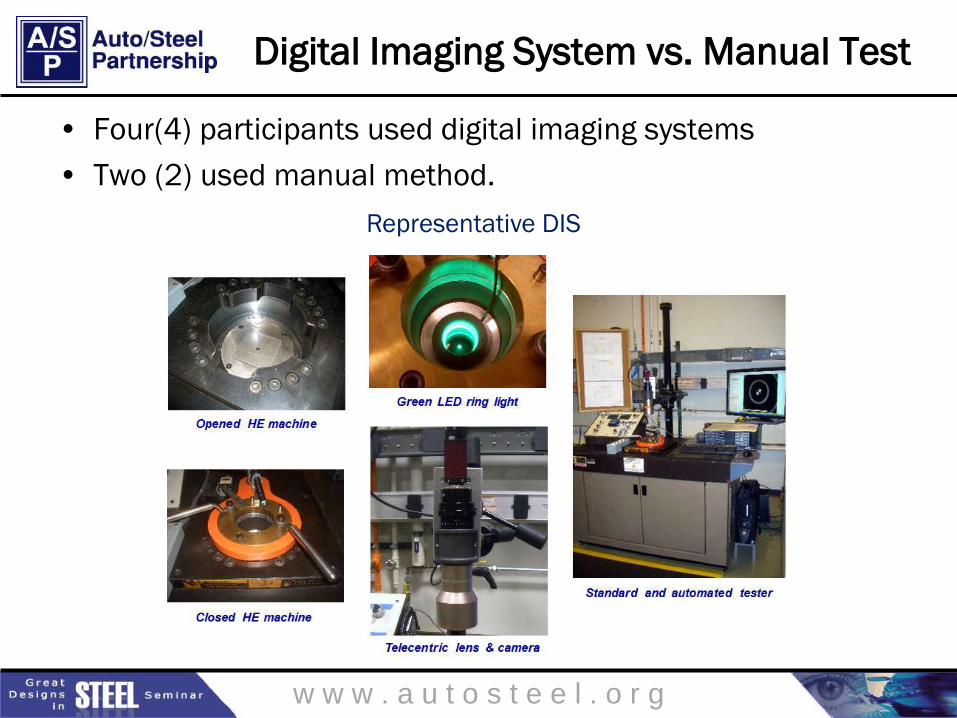
• Four(4) participants used digital imaging systems
• Two (2) used manual method.
Representative DIS
w w w . a u t o s t e e l . o r g
Test Results Insert Company
Logo Here
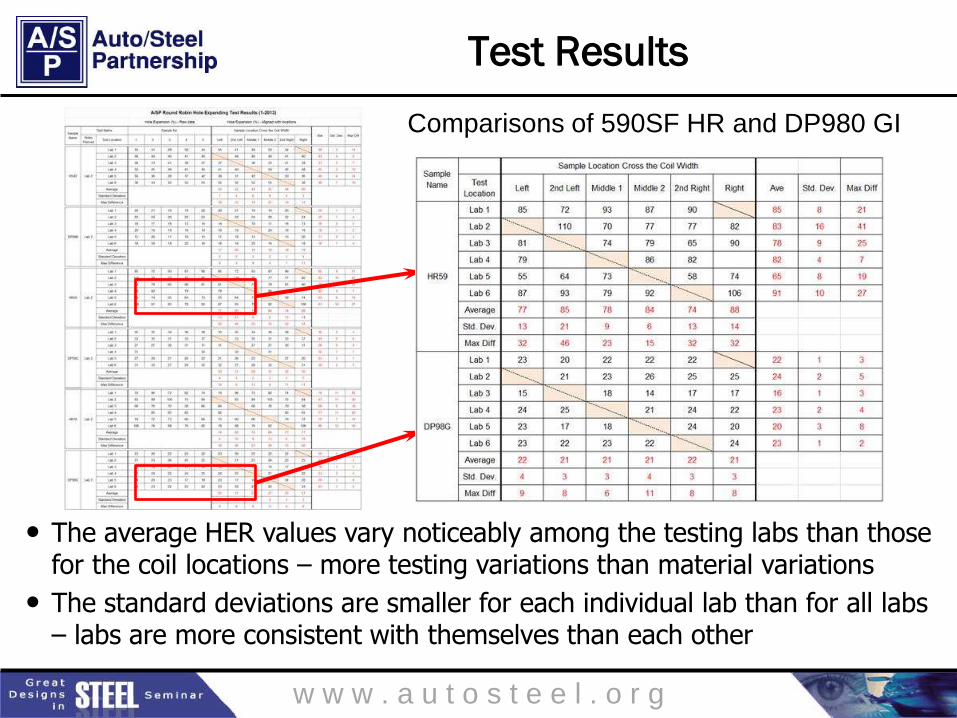
• The average HER values vary noticeably among the testing labs than those for the coil locations – more testing variations than material variations
• The standard deviations are smaller for each individual lab than for all labs – labs are more consistent with themselves than each other
Comparisons of 590SF HR and DP980 GI
w w w . a u t o s t e e l . o r g
Result Analysis Insert Company
Logo Here
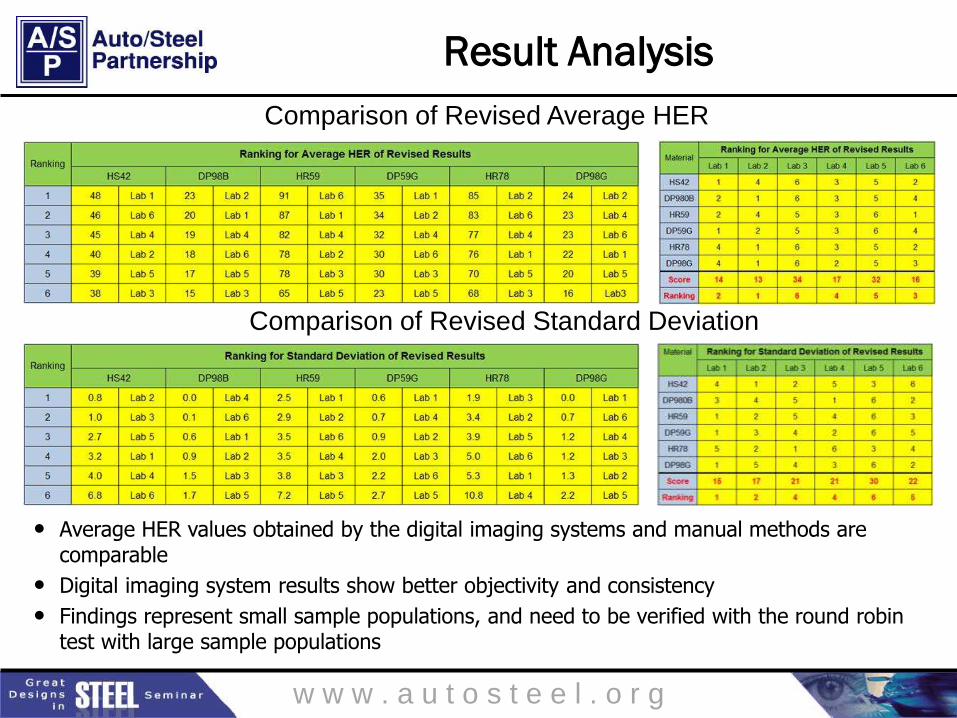
Comparison of Revised Average HER
Comparison of Revised Standard Deviation
• Average HER values obtained by the digital imaging systems and manual methods are comparable
• Digital imaging system results show better objectivity and consistency
• Findings represent small sample populations, and need to be verified with the round robin test with large sample populations
w w w . a u t o s t e e l . o r g
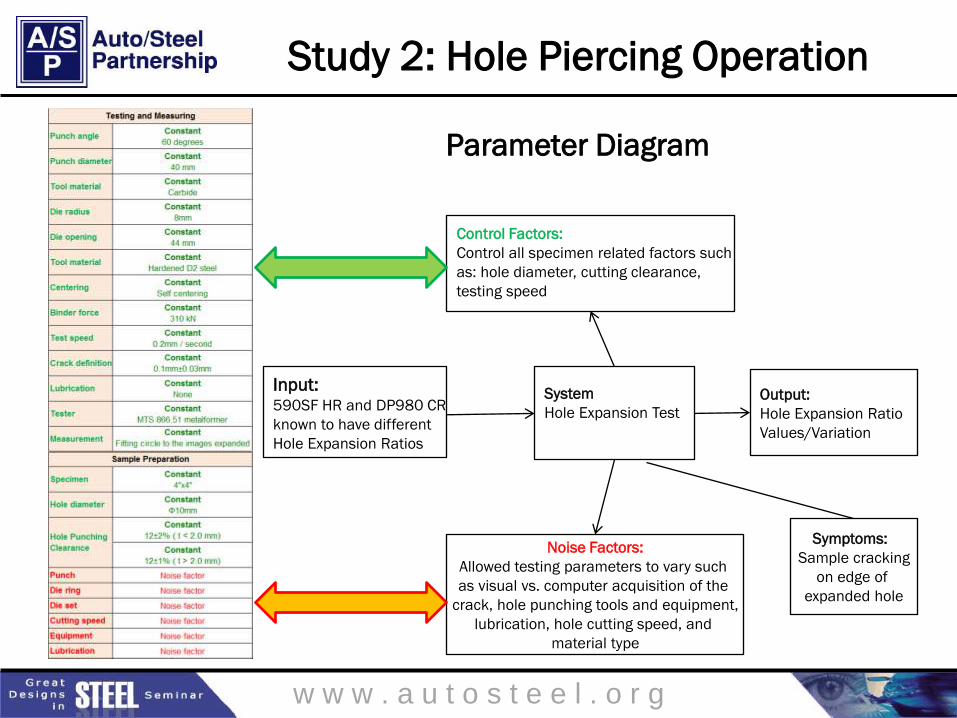
Parameter Diagram
Study 2: Hole Piercing Operation
Control Factors:
Control all specimen related factors such
as: hole diameter, cutting clearance,
testing speed
Output:
Hole Expansion Ratio
Values/Variation
Noise Factors:
Allowed testing parameters to vary such
as visual vs. computer acquisition of the
crack, hole punching tools and equipment,
lubrication, hole cutting speed, and
material type
System
Hole Expansion Test
Input: 590SF HR and DP980 CR
known to have different
Hole Expansion Ratios
Symptoms:
Sample cracking
on edge of
expanded hole
w w w . a u t o s t e e l . o r g
Sampling Control Insert Company
Logo Here
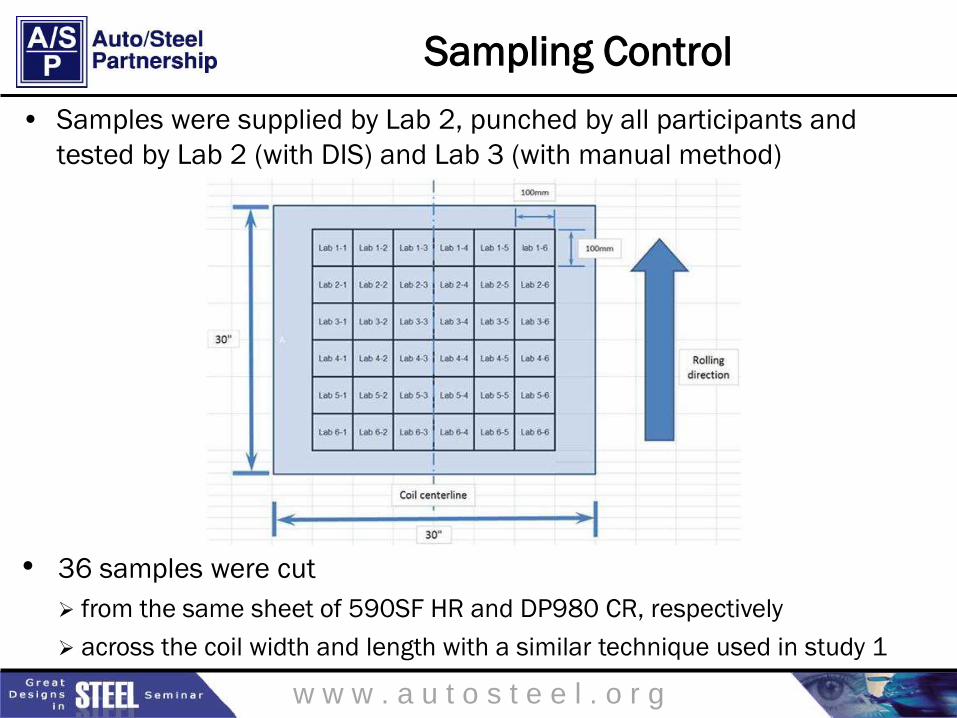
• Samples were supplied by Lab 2, punched by all participants and
tested by Lab 2 (with DIS) and Lab 3 (with manual method)
• 36 samples were cut
from the same sheet of 590SF HR and DP980 CR, respectively
across the coil width and length with a similar technique used in study 1
w w w . a u t o s t e e l . o r g
Hole Punching Equipment and Tools Insert Company
Logo Here
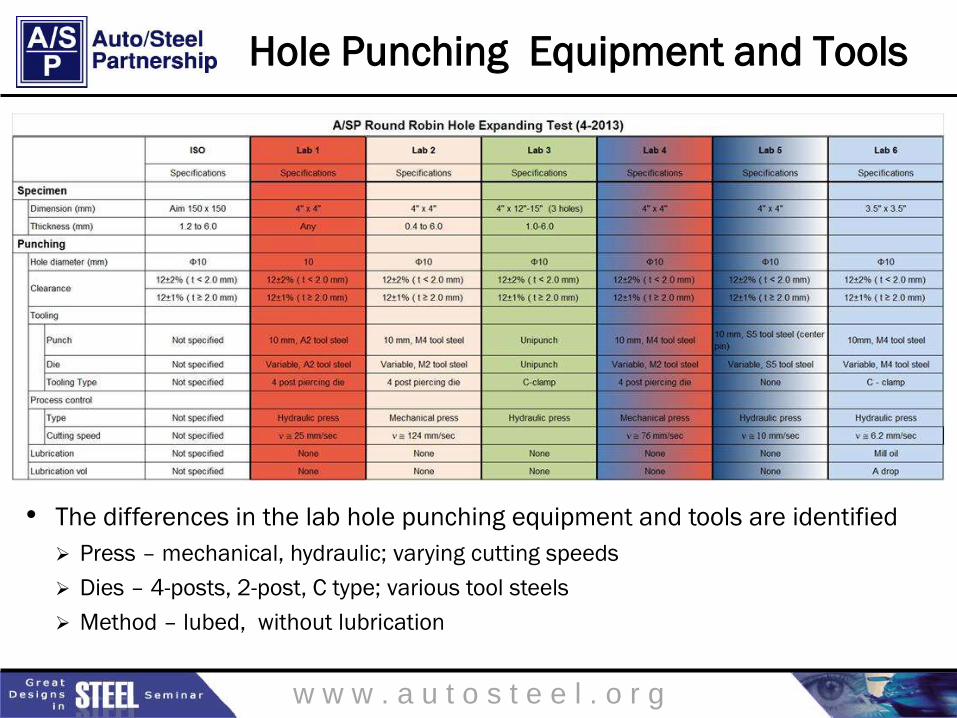
• The differences in the lab hole punching equipment and tools are identified
Press – mechanical, hydraulic; varying cutting speeds
Dies – 4-posts, 2-post, C type; various tool steels
Method – lubed, without lubrication
w w w . a u t o s t e e l . o r g
Test Results Insert Company
Logo Here
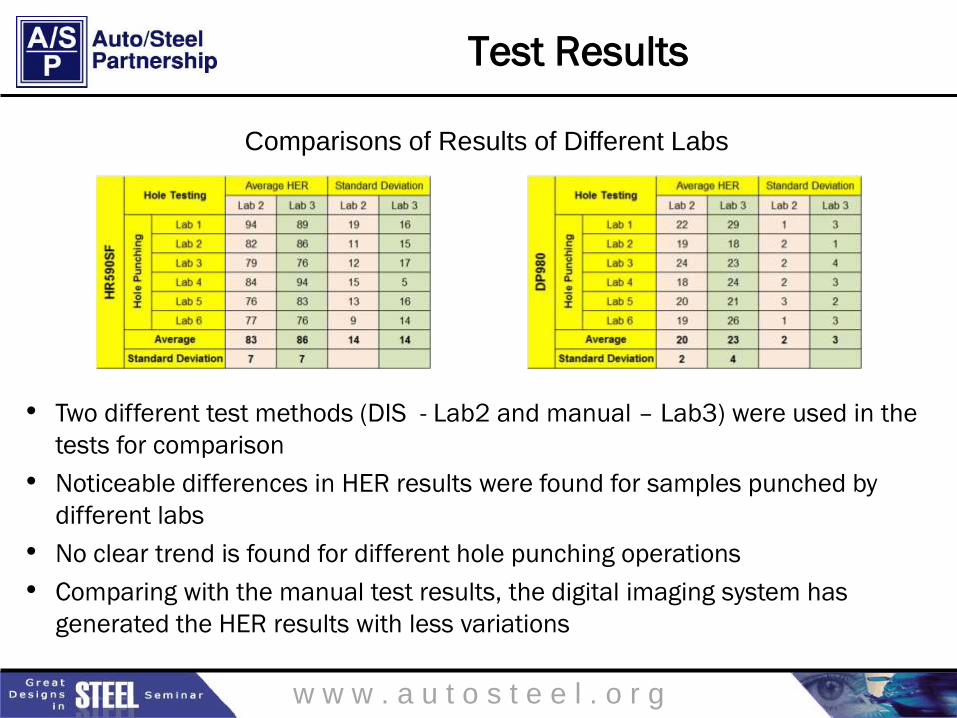
Comparisons of Results of Different Labs
• Two different test methods (DIS - Lab2 and manual – Lab3) were used in the
tests for comparison
• Noticeable differences in HER results were found for samples punched by
different labs
• No clear trend is found for different hole punching operations
• Comparing with the manual test results, the digital imaging system has
generated the HER results with less variations
w w w . a u t o s t e e l . o r g
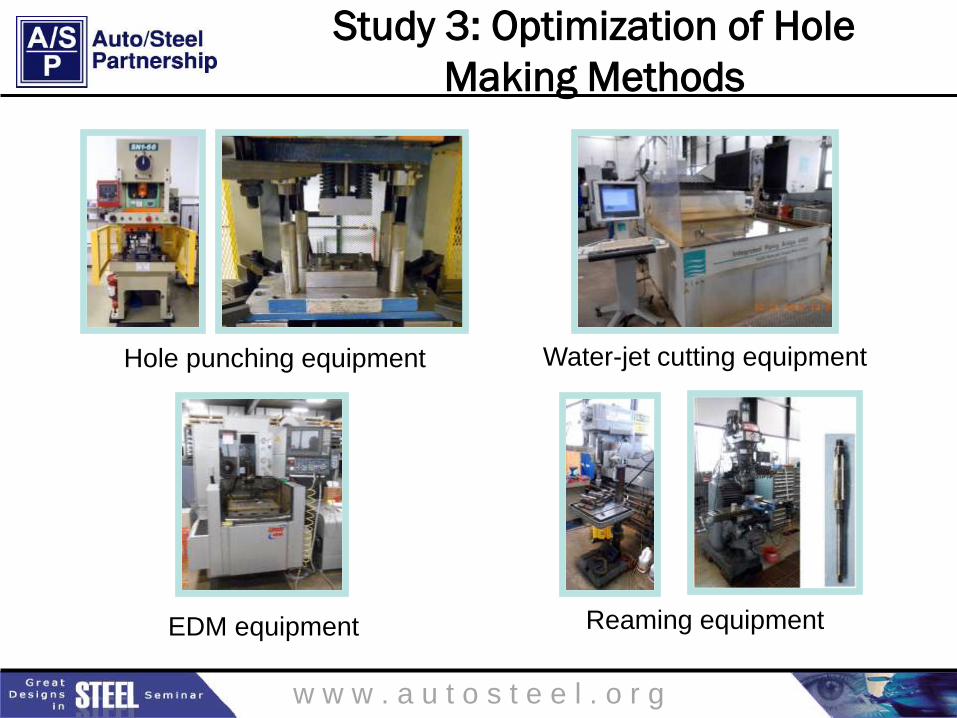
Study 3: Optimization of Hole
Making Methods Insert Company
Logo Here
Hole punching equipment Water-jet cutting equipment
EDM equipment Reaming equipment
w w w . a u t o s t e e l . o r g
Test Results Insert Company
Logo Here
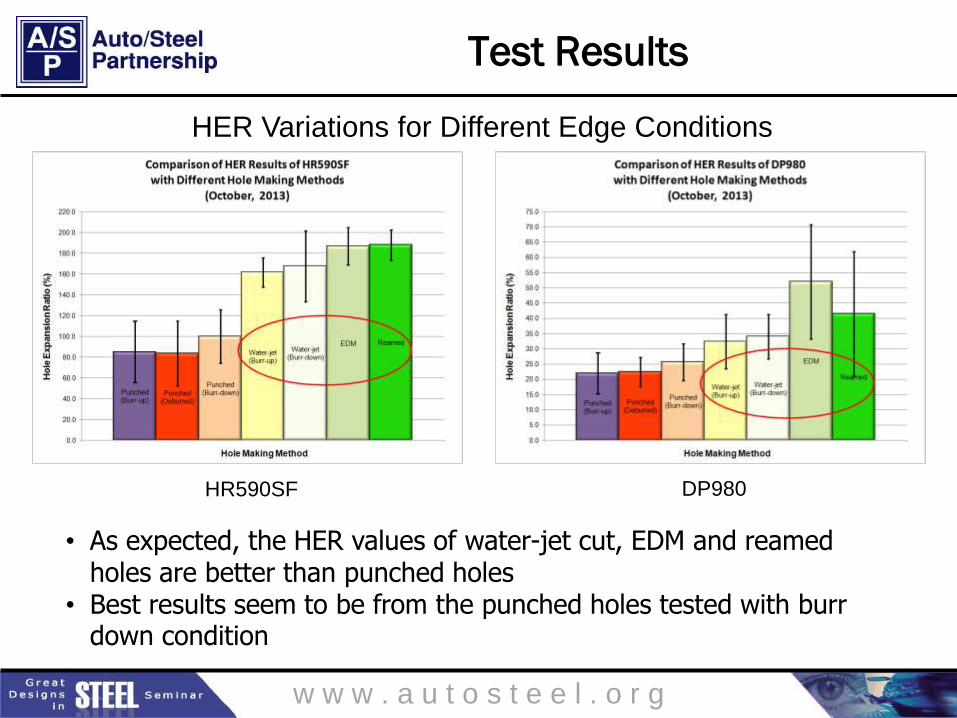
HER Variations for Different Edge Conditions
DP980 HR590SF
• As expected, the HER values of water-jet cut, EDM and reamed holes are better than punched holes
• Best results seem to be from the punched holes tested with burr down condition
w w w . a u t o s t e e l . o r g
Failure Modes and Edge Conditions Insert Company
Logo Here
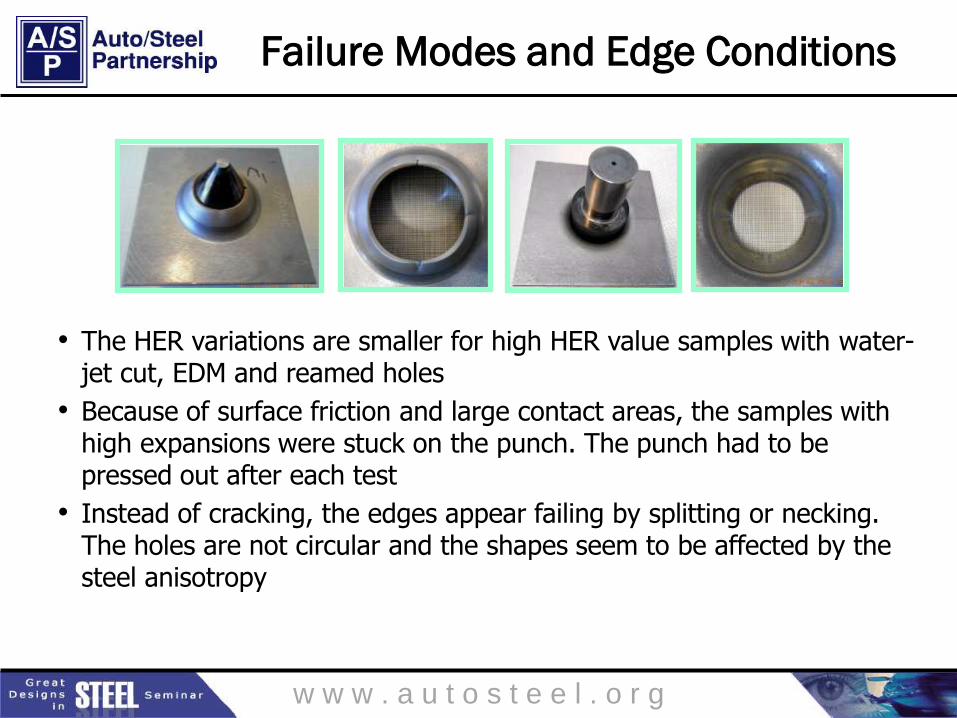
• The HER variations are smaller for high HER value samples with water-jet cut, EDM and reamed holes
• Because of surface friction and large contact areas, the samples with high expansions were stuck on the punch. The punch had to be pressed out after each test
• Instead of cracking, the edges appear failing by splitting or necking. The holes are not circular and the shapes seem to be affected by the steel anisotropy
w w w . a u t o s t e e l . o r g
Edge Conditions and Test Variations Insert Company
Logo Here
• The edge conditions may change the failure mode from edge
cracking to edge necking / splitting – an FLC type of failure
• The good edge conditions can improve the HER results. However,
they do not necessarily reduce the HER variations because of the
material variability / inhomogeneity
• The low HER values and variations had been obtained for the holes
with run down edge conditions. In this case, the edge conditions
resulting from the process have dominated the edge cracking
performances
• By intuition, a “sweet spot” can exist for minimized HER variations.
It would be difficult to realize it by matching the hole making
methods with the materials
w w w . a u t o s t e e l . o r g
Testing Conditions and Variations Insert Company
Logo Here
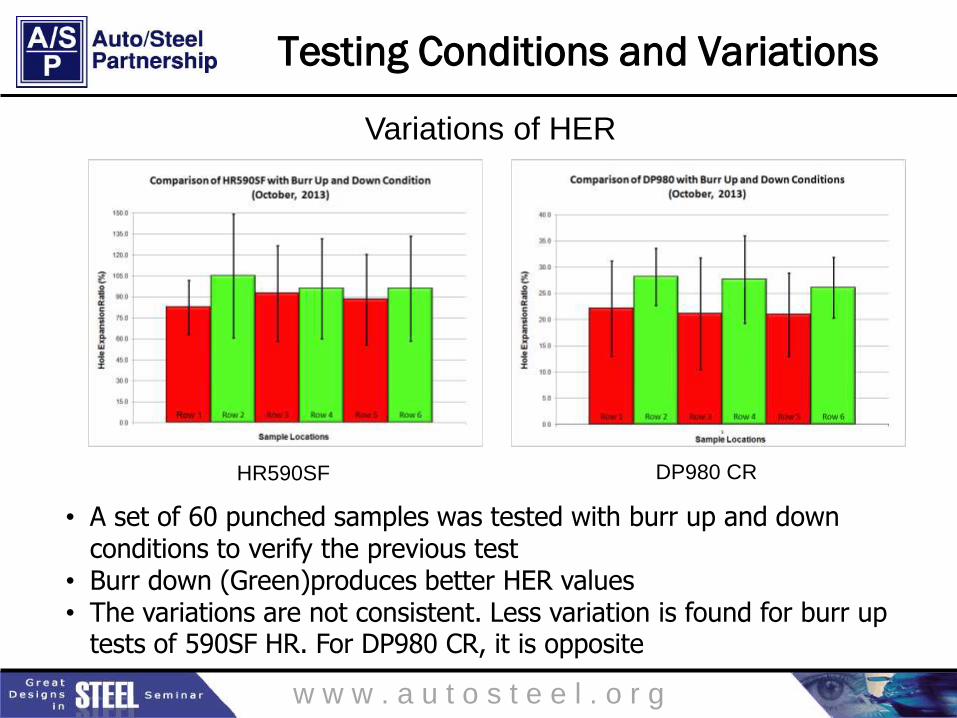
Variations of HER
DP980 CR HR590SF
• A set of 60 punched samples was tested with burr up and down conditions to verify the previous test
• Burr down (Green)produces better HER values • The variations are not consistent. Less variation is found for burr up
tests of 590SF HR. For DP980 CR, it is opposite
w w w . a u t o s t e e l . o r g
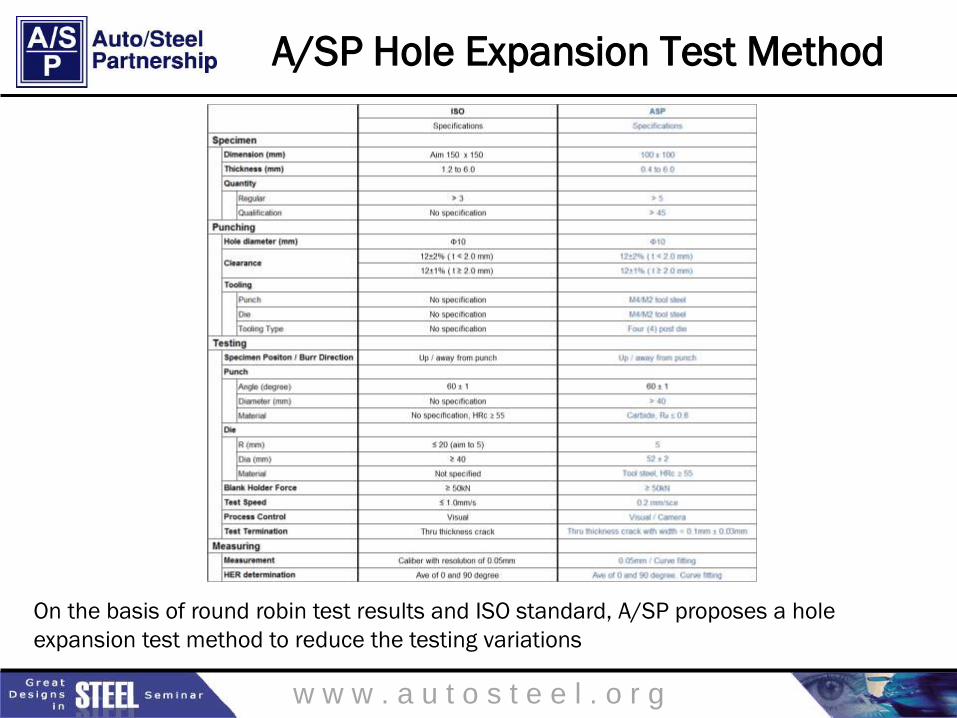
A/SP Hole Expansion Test Method Insert Company
Logo Here
On the basis of round robin test results and ISO standard, A/SP proposes a hole
expansion test method to reduce the testing variations
w w w . a u t o s t e e l . o r g
Conclusions Insert Company
Logo Here
• Edges can fail in two different modes (cracking or necking /splitting) in hole
expansion tests depending on the material properties and cut edge conditions
• Results show that the testing variations can be larger than the AHSS material
variations
• Testing variations among the labs are bigger than these within a lab
• The digital imaging system should be used for the hole expansion test because of its
objectivity and consistency in inter-laboratory tests
• The hole piercing operation has a significant effect on HER variation
• The effects of hole piercing and expansion operations are entangled intrinsically and
difficult to separate
• Some hole making methods have improved the HER values significantly. They do not
necessarily reduce the variations
• We should minimize the testing variations. The HER results will still be affected by the
material variations because of AHSS inhomogeneous microstructures
w w w . a u t o s t e e l . o r g
For More Information Insert Company
Logo Here
Mai Huang
Principal Research Engineer
ArcelorMittal Global R&D – East
Chicago
219-399-2851
email:
Jugraj Singh
Sheet Metal Specialist
Materials Engineering
Chrysler Group LLC
248-512-0029
email: [email protected]
• Contact