Embed Size (px)
Citation preview
1 of 3
Almere, The Netherlands
April 19, 2018
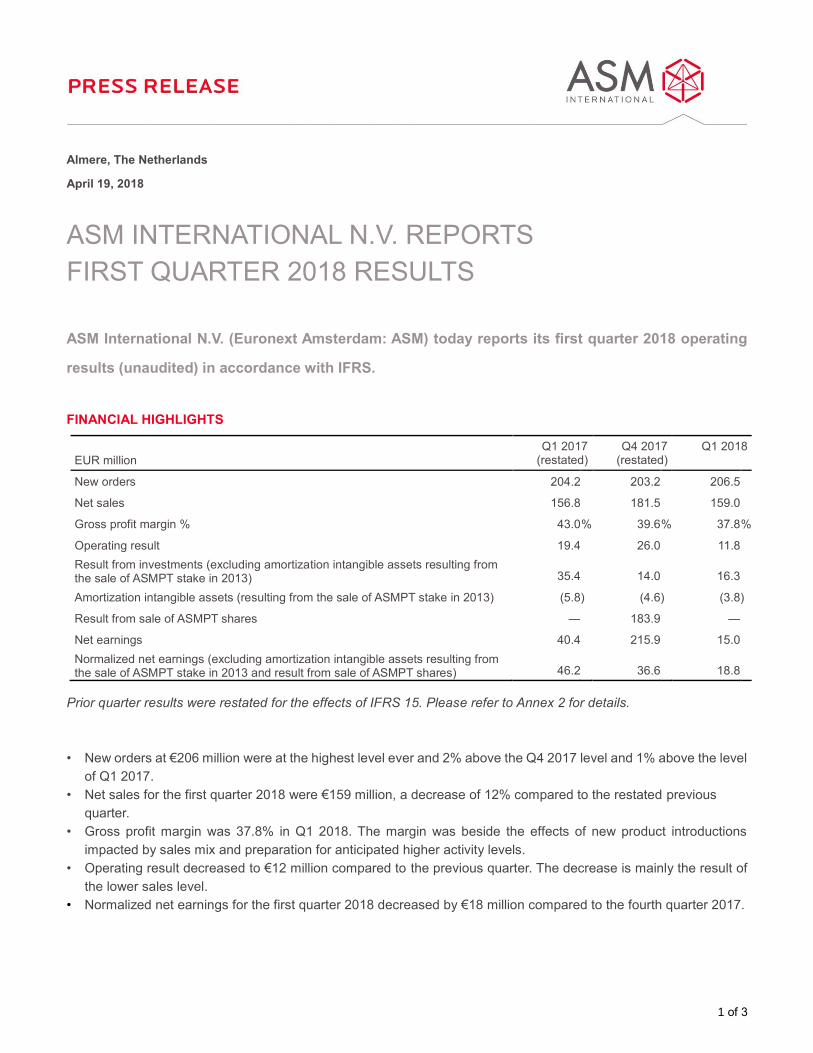
ASM INTERNATIONAL N.V. REPORTS
FIRST QUARTER 2018 RESULTS
ASM International N.V. (Euronext Amsterdam: ASM) today reports its first quarter 2018 operating
results (unaudited) in accordance with IFRS.
FINANCIAL HIGHLIGHTS
EUR million
Q1 2017 (restated)
Q4 2017 (restated)
Q1 2018
New orders 204.2 203.2 206.5
Net sales 156.8 181.5 159.0
Gross profit margin % 43.0 % 39.6 % 37.8 %
Operating result 19.4 26.0 11.8
Result from investments (excluding amortization intangible assets resulting from the sale of ASMPT stake in 2013) 35.4
14.0
16.3
Amortization intangible assets (resulting from the sale of ASMPT stake in 2013) (5.8 ) (4.6 ) (3.8 )
Result from sale of ASMPT shares — 183.9 —
Net earnings 40.4 215.9 15.0
Normalized net earnings (excluding amortization intangible assets resulting from the sale of ASMPT stake in 2013 and result from sale of ASMPT shares) 46.2
36.6
18.8
Prior quarter results were restated for the effects of IFRS 15. Please refer to Annex 2 for details.
• New orders at €206 million were at the highest level ever and 2% above the Q4 2017 level and 1% above the level
of Q1 2017.
• Net sales for the first quarter 2018 were €159 million, a decrease of 12% compared to the restated previous
quarter.
• Gross profit margin was 37.8% in Q1 2018. The margin was beside the effects of new product introductions
impacted by sales mix and preparation for anticipated higher activity levels.
• Operating result decreased to €12 million compared to the previous quarter. The decrease is mainly the result of
the lower sales level.
• Normalized net earnings for the first quarter 2018 decreased by €18 million compared to the fourth quarter 2017.

2 of 3
COMMENT
Commenting on the results, Chuck del Prado, President and Chief Executive Officer of ASM International said:
"In Q1 we realized sales of €159 million and an order intake of €206 million. Our sales were at the lower end of our
guidance while order intake was at the higher end of our guidance. The gross margin in Q1 at 38% was impacted by
an unfavorable product mix and costs related to our preparation for further growth. We estimate our gross margin in
Q2 to show a substantial improvement bringing it back again in the range of low to mid 40’s."
OUTLOOK
For Q2, on a currency comparable level, we expect sales of €200-230 million, and we expect an order intake of €160-
200 million. The broad ranges for Q2 reflect some uncertainty around the exact timing of individual tools.
For 2018, market watchers currently expect the wafer fab equipment market to increase with, on average, a high
single digit percentage. We aim to outgrow the wafer fab equipment market in 2018.
SHARE BUYBACK PROGRAM AND ANNUAL GENERAL MEETING OF SHAREHOLDERS
On April 24, 2017, ASMI announced a partial sale of a stake of approximately 5% in ASMPT, whereby ASMI indicated
to use the proceeds of approximately €245 million for a new share buyback program. The start of this new program
for a total amount of €250 million was announced on September 22, 2017. The program was completed on March
29, 2018. In total, 4,353,292 shares at an average price of €57.43, including expenses, were repurchased.
On November 2, 2017, ASMI announced a partial sale of a stake of approximately 9% in ASMPT, whereby ASMI
received proceeds of approximately €445 million. As announced on February 28, 2018, ASMI intends to distribute the
proceeds through a new €250 million share buyback program and a capital return. ASMI remains committed to use
excess cash for the benefit of its shareholders.
On April 16, 2018, ASMI published the agenda for the 2018 Annual General Meeting of Shareholders (AGM), to be
held on May 28, 2018, which includes the following financial matters:
• proposal to declare a dividend of €0.80 per common share;
• proposal to distribute €4.00 per common share; and
• proposal to cancel 6 million treasury shares.
Please refer to the AGM documents available on our website for more detailed information.
About ASM International
ASM International NV, headquartered in Almere, the Netherlands, its subsidiaries and participations design and manufacture
equipment and materials used to produce semiconductor devices. ASM International, its subsidiaries and participations provide
production solutions for wafer processing (Front-end segment) as well as for assembly & packaging and surface mount technology
(Back-end segment) through facilities in the United States, Europe, Japan and Asia. ASM International's common stock trades on
the Euronext Amsterdam Stock Exchange (symbol ASM). For more information, visit ASMI's website at www.asm.com.
Cautionary Note Regarding Forward-Looking Statements: All matters discussed in this press release, except for any historical
data, are forward-looking statements. Forward-looking statements involve risks and uncertainties that could cause actual results
to differ materially from those in the forward-looking statements. These include, but are not limited to, economic conditions and
trends in the semiconductor industry generally and the timing of the industry cycles specifically, currency fluctuations, corporate
transactions, financing and liquidity matters, the success of restructurings, the timing of significant orders, market acceptance of
new products, competitive factors, litigation involving intellectual property, shareholders or other issues, commercial and economic
disruption due to natural disasters, terrorist activity, armed conflict or political instability, epidemics and other risks indicated in the
Company's reports and financial statements. The Company assumes no obligation nor intends to update or revise any forward-
looking statements to reflect future developments or circumstances.
This press release contains inside information within the meaning of Article 7(1) of the EU Market Abuse Regulation.
3 of 3
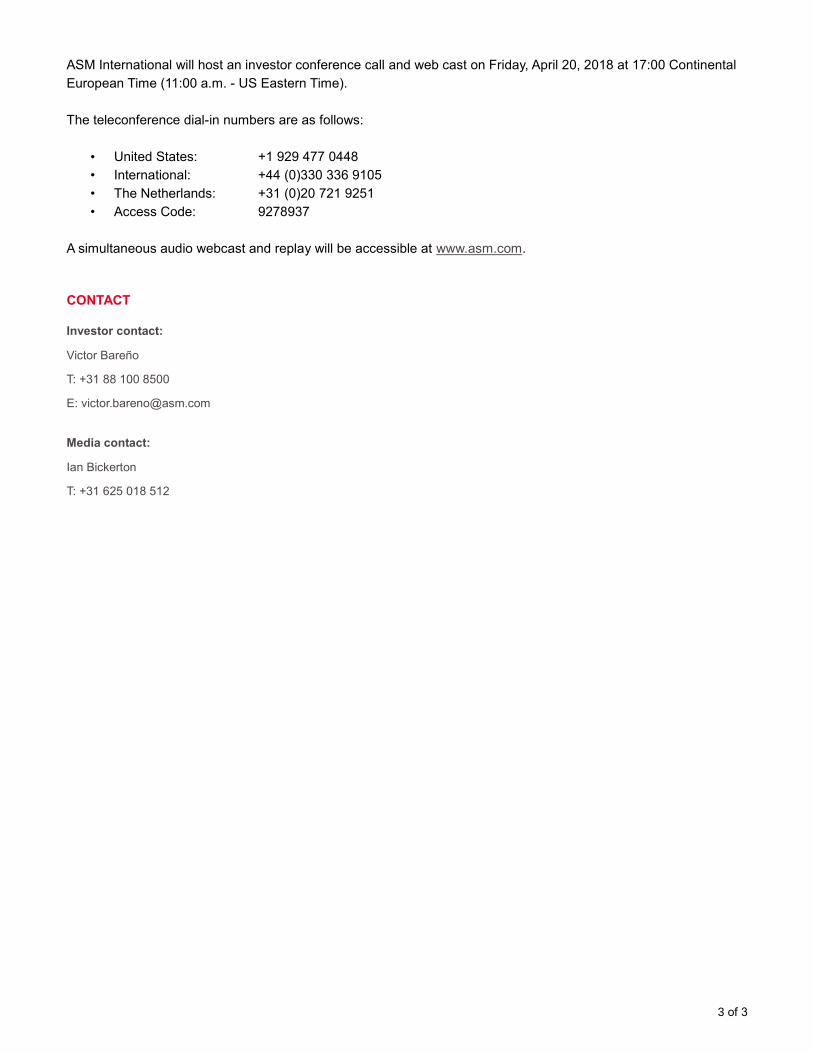
ASM International will host an investor conference call and web cast on Friday, April 20, 2018 at 17:00 Continental
European Time (11:00 a.m. - US Eastern Time).
The teleconference dial-in numbers are as follows:
• United States: +1 929 477 0448
• International: +44 (0)330 336 9105
• The Netherlands: +31 (0)20 721 9251
• Access Code: 9278937
A simultaneous audio webcast and replay will be accessible at www.asm.com.
CONTACT
Investor contact:
Victor Bareño
T: +31 88 100 8500
Media contact:
Ian Bickerton
T: +31 625 018 512

1 of 9
ANNEX 1
OPERATING AND FINANCIAL REVIEW
Bookings
The following table shows the level of new orders for the first quarter of 2018 and the backlog at the end of the first quarter of
2018, compared to the previous quarter and the comparable quarter previous year:
EUR million Q1 2017
(restated) Q4 2017
(restated) Q1 2018
Change Q4 2017
to Q1 2018
Change Q1 2017
to Q1 2018
Backlog at the beginning of the quarter 145.1 150.6 171.2 14 % 18 %
New orders for the quarter 204.2 203.2 206.5 2 % 1 %
Net sales for the quarter (156.8 ) (181.5 ) (159.0 ) (12 )% 1 %
FX-effect for the quarter 1.8 (1.1 ) (0.8 )
Backlog at the end of the quarter 194.3 171.2 217.9 27 % 12 %
Book-to-bill ratio (new orders divided by net sales) 1.3 1.1 1.3
The backlog increased from €171 million at the end of the fourth quarter 2017 to €218 million as per March 31, 2018. The book-
to-bill ratio for Q1 was 1.3. In terms of customer segments, new orders in the first quarter 2018 were led by memory, followed by
logic and then foundry.
Net Sales
EUR million Q1 2017
(restated) Q4 2017
(restated) Q1 2018
Change Q4 2017
to Q1 2018
Change Q1 2017
to Q1 2018
Equipment sales 119.4 138.5 120.3 (13 )% 1 %
Spares & service sales 37.4 43.0 38.6 (10 )% 3 %
Net sales 156.8 181.5 159.0 (12 )% 1 %
Net sales for the first quarter 2018 decreased with 12% compared to the previous quarter and increased by 1% year-on-year. Net
sales in the first quarter were led by memory followed by logic. The impact of currency changes was a decrease of 1% quarter to
quarter and a decrease of 7% year-on-year.
Gross profit margin
EUR million Q1 2017
(restated) Q4 2017
(restated) Q1 2018
Change Q4 2017
to Q1 2018
Change Q1 2017
to Q1 2018
Gross profit 67.4 71.8 60.2 (16 )% (11 )%
Gross profit margin 43.0 % 39.6 % 37.8 % (2 )% (5 )%
The gross profit margin decreased from 39.6% in Q4 to 37.8% in Q1. For Q1 2017 gross profit margin was 43.0%. The gross profit
margin continued to be impacted by new product introductions and related initial costs. While the negative impact of the new
products moderated from 3% points in Q4 to 2% points in Q1, the gross margin in the first quarter was negatively impacted by
sales mix of existing products in the quarter and costs associated with preparation for anticipated higher activity levels which had
a more pronounced impact because of the relatively low sales level in Q1. The impact of currency changes on gross profit was a
decrease of 1% quarter to quarter and a decrease of 7% year-on-year.

2 of 9
Selling, general and administrative expenses
EUR million Q1 2017 Q4 2017 Q1 2018
Change Q4 2017
to Q1 2018
Change Q1 2017
to Q1 2018
SG&A expenses 23.0 25.0 27.2 9 % 18 %
Selling, general and administrative (SG&A) expenses increased by 9% compared to the previous quarter. This increase was mainly
due to costs related to patent disputes as earlier communicated. As a percentage of sales SG&A expenses were 17% (Q4 2017:
14%, Q1 2017: 15%). The impact of currency changes on SG&A expenses was a decrease of 1% quarter to quarter and a decrease
of 6% year-on-year.
Research and development expenses
EUR million Q1 2017 Q4 2017 Q1 2018
Change Q4 2017
to Q1 2018
Change Q1 2017
to Q1 2018
Research and development expenses 27.6 29.5 28.4 (4 )% 3 %
Capitalization of development expenses (6.7 ) (14.7 ) (10.1 ) (31 )% 51 %
Amortization of capitalized development expenses 3.6 2.9 2.8 (4 )% (24 )%
Impairment capitalized development expenses — 3.0 — n/a n/a
R&D expenses 24.5 20.7 21.0 2 % (14 )%
Research and development (R&D) expenses increased by 2% compared to the previous quarter. As a percentage of sales R&D
expenses were 13% compared to 11% for the previous quarter. For the first quarter of 2017 this was 16%. The impact of currency
changes on R&D expenses was a decrease of 2% quarter to quarter and a decrease of 8% year-on-year.
Operating result
EUR million Q1 2017
(restated) Q4 2017
(restated) Q1 2018
Change Q4 2017
to Q1 2018
Change Q1 2017
to Q1 2018
Operating result 19.4 26.0 11.8 (55 )% (39 )%
Operating result margin 12.4 % 14.3 % 7.4 % (7 )% (5 )%
The operating profit margin decreased from 14.3% in Q4 to 7.4% in Q1. For Q1 2017 operating profit margin was 12.4%. The
impact of currency changes on operating profit was no change quarter to quarter and a decrease of 8% year-on-year.
Financing costs
Financing costs are mainly related to translation results. The Q1 2018 results included a translation loss of €8 million compared to
a loss of €5 million included in the Q4 2017 results and a loss of €7 million included in the Q1 2017 results. The translation results
are mainly related to movements in the US dollar in the respective periods. A substantial part of ASMI's cash position is
denominated in US dollar.

3 of 9
Result from investments
EUR million Q1 2017 Q4 2017 Q1 2018
Change Q4 2017
to Q1 2018
Change Q1 2017
to Q1 2018
Result from investments (excluding amortization intangible assets resulting from the sale of ASMPT stake in 2013) 35.4
14.0
16.3
16 % (54 )%
Amortization intangible assets (resulting from the sale of ASMPT stake in 2013) (5.8 ) (4.6 ) (3.8 ) (17 )% (34 )%
Result from sale of ASMPT shares — 183.9 — n/a n/a
Result from investments, which primarily reflects our approximate 25% shareholding in ASMPT, increased to €16 million from €14
million in the previous quarter. ASMPT’s net earnings, on a 100% basis, increased with 30% to €65 million compared to the
previous quarter. Q1 last year, also on a 100% basis, showed net earnings of €89 million. For further information on the Q1 results
of ASMPT, please visit ASMPT's website www.asmpacific.com.
Amortization intangible assets resulting from the sale of the 12% stake of ASMPT in 2013 amounted to €4 million in Q1. For
2018, on a currency comparable basis, this amortization is expected to amount to €13 million.
Income tax
Income tax in the first quarter amounted to an expense of €1.3 million. Income tax in the previous quarter amounted to an income
of €1.6 million.
Net earnings
EUR million Q1 2017
(restated) Q4 2017
(restated) Q1 2018
Change Q4 2017
to Q1 2018
Change Q1 2017
to Q1 2018
Net earnings 40.4 215.9 15.0 (93 )% (63 )%
Amortization intangible assets (resulting from the sale of ASMPT stake in 2013) (5.8 ) (4.6 ) (3.8 ) (17 )% (34 )%
Result from sale of ASMPT shares — 183.9 — n/a n/a
Normalized net earnings 46.2 36.6 18.8 (49 )% (59 )%
Normalized net earnings decreased €18 million compared to Q4 2017.
Cash flow
EUR million Q1 2017 Q4 2017 Q1 2018
Net cash from operating activities 33.4 34.0 33.5
Net cash from investing activities (13.9 ) 414.8 (18.7 )
Net cash from financing activities (23.7 ) (133.8 ) (101.5 )
Total net cash provided / (used) (4.2 ) 314.9 (86.7 )
The cash flow from operating activities remained stable at €34 million as lower net earnings were compensated by lower working
capital needs. The cash flow from investing activities in Q4 2017 included proceeds of €445 million related to the sale of the
ASMPT shares. Excluding this effect, the cash flow from investing activities improved by €12 million compared to the previous
quarter. Cash used by financing activities was mainly for share repurchases.

4 of 9
Balance sheet
EUR million December 31, 2017 March 31, 2018
(audited)
Inventories 142.8 151.7
Accounts receivable 163.1 127.7
Other current assets 19.1 12.8
Accounts payable (79.3 ) (86.1 )
Provision for warranty (6.6 ) (6.5 )
Accrued expenses and other payables (59.0 ) (44.1 )
Working capital 180.2 155.6
Net working capital decreased to €156 million compared to €180 million per December 31, 2017 (€139 million per March 31, 2017).
Accounts receivable decreased with €36 million reflecting the lower sales level, while inventories and accounts payable increased
reflecting the higher backlog. The number of outstanding days of working capital, measured against quarterly sales, increased to
88 days on March 31, 2018 from 75 days on December 31, 2017 (86 days on March 31, 2017).
Sources of liquidity
As per March 31, 2018, the Company’s principal sources of liquidity consisted of €741 million in cash and cash equivalents and
€150 million in undrawn bank lines.

5 of 9
ANNEX 2
CONSOLIDATED STATEMENTS OF PROFIT OR LOSS
Three months ended March 31,
2017 (restated) 2018
EUR thousand, except per share data (unaudited) (unaudited)
Net sales 156,836 158,974
Cost of sales (89,407 ) (98,818 )
Gross profit 67,429 60,156
Operating expenses:
Selling, general and administrative (23,010 ) (27,219 )
Research and development (24,525 ) (20,998 )
Restructuring expenses (492 ) (149 )
Total operating expenses (48,027 ) (48,366 )
Operating result 19,402 11,790
Net interest income (expense) (5 ) (502 )
Foreign currency exchange gains (losses) (7,314 ) (7,536 )
Result from investments 29,654 12,470
Earnings before income taxes 41,737 16,222
Income tax (1,315 ) (1,269 )
Net earnings 40,422 14,954
Per share data:
Basic net earnings 0.68 0.27
Diluted net earnings (1) 0.67 0.27
Weighted average number of shares used in
computing per share amounts (in thousand):
Basic 59,661 54,792
Diluted (1) 60,411 55,555
Outstanding shares: 59,475 54,403
Treasury shares: 4,322 7,895
(1) The calculation of diluted net earnings per share reflects the potential dilution that could occur if securities or other contracts to issue common stock were exercised or converted into common stock or resulted in the issuance of common stock that then shared in earnings of the Company. Only instruments that have a dilutive effect on net earnings are included in the calculation. The calculation is done for each reporting period individually. The possible increase of common shares caused by employee stock options and restricted shares for the three months ended March 31, 2018 is 762,962 common shares. Adjustments have been reflected in the diluted weighted average number of shares and net earnings per share for this period.

6 of 9
CONSOLIDATED STATEMENTS OF FINANCIAL POSITION
December 31, March 31,
2017 2018
EUR thousand (audited) (unaudited)
Assets
Property, plant and equipment 106,632 107,571
Goodwill 11,270 11,270
Other intangible assets 113,295 119,397
Investments in associates 730,552 726,060
Deferred tax assets 18,116 18,205
Other non-current assets 4,845 4,797
Evaluation tools at customers 29,710 41,461
Total non-current assets 1,014,420 1,028,761
Inventories 142,849 151,714
Accounts receivable 163,135 127,709
Income taxes receivable 1,272 1,091
Other current assets 19,065 12,821
Cash and cash equivalents 836,461 741,096
Total current assets 1,162,782 1,034,431
Total Assets 2,177,202 2,063,192
Equity and liabilities
Equity 2,011,512 1,908,435
Pension liabilities 386 316
Deferred tax liabilities 13,864 14,017
Total non-current liabilities 14,250 14,333
Accounts payable 79,349 86,075
Provision for warranty 6,562 6,499
Income taxes payable 6,575 3,744
Accrued expenses and other payables 58,954 44,106
Total current liabilities 151,440 140,424
Total Liabilities 165,690 154,757
Total Equity and Liabilities 2,177,202 2,063,192
Amounts are rounded to the nearest thousand euro; therefore amounts may not equal (sub) totals due to rounding.
7 of 9
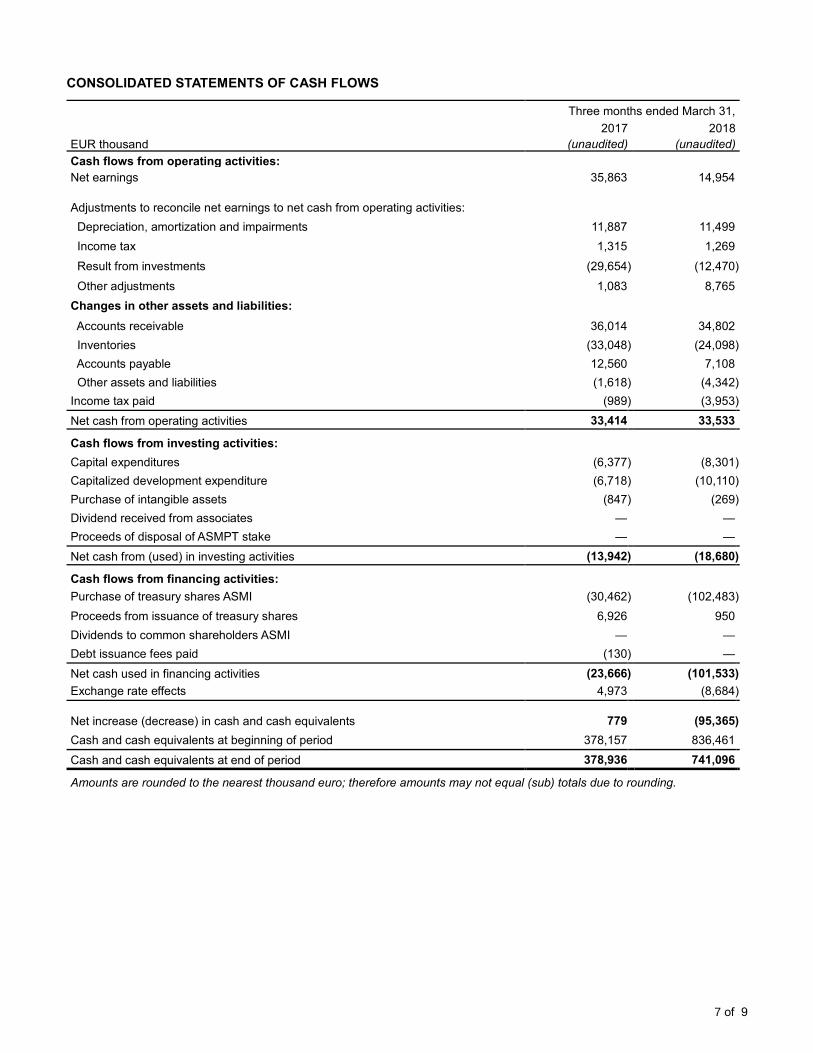
CONSOLIDATED STATEMENTS OF CASH FLOWS
Three months ended March 31,
2017 2018
EUR thousand (unaudited) (unaudited)
Cash flows from operating activities:
Net earnings 35,863 14,954
Adjustments to reconcile net earnings to net cash from operating activities:
Depreciation, amortization and impairments 11,887 11,499
Income tax 1,315 1,269
Result from investments (29,654 ) (12,470 )
Other adjustments 1,083 8,765
Changes in other assets and liabilities:
Accounts receivable 36,014 34,802
Inventories (33,048 ) (24,098 )
Accounts payable 12,560 7,108
Other assets and liabilities (1,618 ) (4,342 )
Income tax paid (989 ) (3,953 )
Net cash from operating activities 33,414 33,533
Cash flows from investing activities:
Capital expenditures (6,377 ) (8,301 )
Capitalized development expenditure (6,718 ) (10,110 )
Purchase of intangible assets (847 ) (269 )
Dividend received from associates — —
Proceeds of disposal of ASMPT stake — —
Net cash from (used) in investing activities (13,942 ) (18,680 )
Cash flows from financing activities:
Purchase of treasury shares ASMI (30,462 ) (102,483 )
Proceeds from issuance of treasury shares 6,926 950
Dividends to common shareholders ASMI — —
Debt issuance fees paid (130 ) —
Net cash used in financing activities (23,666 ) (101,533 )
Exchange rate effects 4,973 (8,684 )
Net increase (decrease) in cash and cash equivalents 779
(95,365 )
Cash and cash equivalents at beginning of period 378,157 836,461
Cash and cash equivalents at end of period 378,936 741,096
Amounts are rounded to the nearest thousand euro; therefore amounts may not equal (sub) totals due to rounding.

8 of 9
NOTES TO THE CONSOLIDATED FINANCIAL STATEMENTS
Basis of presentation
The consolidated financial statements have been prepared in accordance with International Financial Reporting Standards
(“IFRS”) as adopted by the European Union.
Amounts are rounded to the nearest thousand euro; therefore amounts may not equal (sub) totals due to rounding.
Principles of consolidation
The Consolidated Financial Statements include the accounts of ASMI and its subsidiaries, where ASMI holds a controlling
interest. All unrealized intercompany profits, transactions and balances have been eliminated in consolidation. Associates are
investments in entities in which ASMI can exert significant influence but which ASMI does not control, generally by ASMI having
between 20% and 50% of the voting rights. These entities are accounted for using the equity method.
Change in accounting policies
IFRS 15 Revenue from Contracts with Customers is effective for interim and annual periods beginning after January 1, 2018. We
concluded that the timing of recognition for installation, conditional equipment sales and fixed fee royalties are impacted. ASMI
selected full retrospective adoption and will publish restated financial statements in the Annual Report 2018. Below are the
restated quarterly 2017 results.
The 2017 full year impact on net sales is a decrease 0.9% and the impact on net earnings is a decrease of 0.9%.
EUR million Q1 2017
(restated) Q2 2017
(restated) Q3 2017
(restated) Q4 2017
(restated)
Full Year 2017
(restated)
New orders 204.2
205.9
160.4
203.2
773.7
Net sales 156.8
214.5
178.1
181.5
730.9
Gross profit margin % 43.0 % 43.4 % 38.8 % 39.6 % 41.3 %
Operating result 19.4
42.7
20.8
26.0
108.9
Result from investments (excluding amortization intangible assets resulting from the sale of ASMPT stake in 2013) 35.4
30.9
32.1
14.0
112.4
Amortization intangible assets (resulting from the sale of ASMPT stake in 2013) (5.8 ) (7.0 ) (5.4 ) (4.6 ) (22.8 )
Result from sale of ASMPT shares —
101.0
—
183.9
284.9
Net earnings 40.4
154.5
37.3
215.9
448.1
Normalized net earnings (excluding amortization intangible assets resulting from the sale of ASMPT stake in 2013) 46.2
60.5
42.7
36.6
186.0

9 of 9
EUR million Q1 2017
(reported) Q2 2017
(reported) Q3 2017
(reported) Q4 2017
(reported)
Full Year 2017
(audited)
New orders 204.2
205.9
160.4
203.2
773.7
Net sales 144.5
202.0
185.3
205.6
737.4
Gross profit margin % 43.5 % 43.7 % 40.0 % 39.3 % 41.5 %
Operating result 14.8
37.7
25.7
34.9
113.2
Result from investments (excluding amortization intangible assets resulting from the sale of ASMPT stake in 2013) 35.4
30.9
32.1
14.0
112.4
Amortization intangible assets (resulting from the sale of ASMPT stake in 2013) (5.8 ) (7.0 ) (5.4 ) (4.6 ) (22.8 )
Result from sale of ASMPT shares —
101.0
—
183.9
284.9
Net earnings 35.9
149.6
42.2
224.8
452.4
Normalized net earnings (excluding amortization intangible assets resulting from the sale of ASMPT stake in 2013) 41.6
55.6
47.6
45.5
190.3
Additional disclosures
As from 2018 onwards, ASMI will provide a breakdown of its net sales in equipment sales and spares & service sales and
therefore provides 2017 comparables.
EUR million Q1 2017
(restated) Q2 2017
(restated) Q3 2017
(restated) Q4 2017
(restated)
Full Year 2017
(restated)
Equipment sales 119.4 172.5 136.9 138.5 567.3
Spares & service sales 37.4 42.0 41.2 43.0 163.6
Net sales 156.8 214.5 178.1 181.5 730.9