Embed Size (px)
Citation preview

July 2019
Asia’s future is now

McKinsey Global Institute
Since its founding in 1990, the McKinsey Global Institute (MGI) has sought to develop a deeper understanding of the evolving global economy. As the business and economics research arm of McKinsey & Company, MGI aims to provide leaders in the commercial, public, and social sectors with the facts and insights on which to base management and policy decisions.
MGI research combines the disciplines of economics and management, employing the analytical tools of economics with the insights of business leaders. Our “micro-to-macro” methodology examines microeconomic industry trends to better understand the broad macroeconomic forces affecting business strategy and public policy. MGI’s in-depth reports have covered more than 20 countries and 30 industries. Current research focuses on six themes: productivity and growth, natural resources, labor markets, the evolution of global financial markets, the economic impact of technology and innovation, and urbanization. Recent reports have assessed the digital economy, the impact of AI and automation on employment, income inequality, the productivity puzzle, the economic benefits of tackling gender inequality, a new era of global competition, Chinese innovation, and digital and financial globalization.
MGI is led by three McKinsey & Company senior partners: Jacques Bughin, Jonathan Woetzel, and James Manyika, who also serves as the chairman of MGI. Michael Chui, Susan Lund, Anu Madgavkar, Jan Mischke, Sree Ramaswamy, and Jaana Remes are MGI partners, and Mekala Krishnan and Jeongmin Seong are MGI senior fellows.
Project teams are led by the MGI partners and a group of senior fellows and include consultants from McKinsey offices around the world. These teams draw on McKinsey’s global network of partners and industry and management experts. The MGI Council, which includes leaders from McKinsey offices around the world and the Firm’s sector practices, includes Michael Birshan, Andrés Cadena, Sandrine Devillard, André Dua, Kweilin Ellingrud, Tarek Elmasry, Katy George, Rajat Gupta, Eric Hazan, Acha Leke, Scott Nyquist, Gary Pinkus, Sven Smit, Oliver Tonby, and Eckart Windhagen. In addition, leading economists, including Nobel laureates, advise MGI research.
The partners of McKinsey fund MGI’s research; it is not commissioned by any business, government, or other institution. For further information about MGI and to download reports, please visit www.mckinsey.com/mgi.
ii McKinsey Global Institute

AuthorsOliver Tonby, SingaporeJonathan Woetzel, ShanghaiWonsik Choi, SeoulJeongmin Seong, ShanghaiPatti Wang, Shanghai
Asia’s future is now

Contents
Asia is transforming trade 5
Asian corporates are on the rise 8
Asia is shaping the future of digital innovation globally 12
Asia’s consumers are a force in the global economy 15
2 McKinsey Global Institute

Asia’s future is now
For years, Western observers and media have been talking about the rise of Asia in terms of its massive future potential. But the time has come for the rest of the world to update its thinking—because the future arrived even faster than expected.
One of the most dramatic developments of the past 30 years has been emerging Asia’s soaring consumption and its integration into global flows of trade, capital, talent, and innovation. In the decades ahead, Asia’s economies will go from participating in these flows to determining their shape and direction. Indeed, in many areas—from the internet to trade and luxury goods—they already are. The question is no longer how quickly Asia will rise; it is how Asia will lead.
Of course, it is hard to generalize about a such a vast swathe of the world, spanning myriad languages, ethnicities, and religions.1 These nations have widely varying forms of government, economic systems, and human development indicators. Some have young and growing populations, while others are aging. Annual per capita income ranges from US$849 in Nepal to US$57,714 in Singapore. The region encompasses ancient ruins and bullet trains, rural farming villages and towering skyscrapers.
The common thread across this diverse region is an upward trajectory across key economic and social indicators (Exhibit 1). In 2000, Asia accounted for just under one-third of global GDP (in PPP terms), and it is on track to top 50 percent by 2040. By that point, it is expected to account for 40 percent of the world’s total consumption. Asia is making not only economic progress but rapid strides in human development, from longer lifespans and greater literacy to a dramatic surge in internet use.
The region’s rise has not only lifted hundreds of millions out of extreme poverty; it has also raised living standards more broadly for people of every income level. Urbanization is fueling economic growth and opening doors to education and public health services. But pockets of poverty and real development challenges remain. The breakneck pace of growth has left many cities struggling to provide the housing, infrastructure, and other services that their surging populations need. Countries across the region need to achieve more inclusive and sustainable economic growth to address inequality and environmental stresses.
Recent McKinsey Global Institute (MGI) research examined 71 developing economies and singled out 18 of them for consistently posting robust economic GDP growth. All seven long-term outperformers, and five out of 11 recent outperformers, are located in Asia.2 In recent decades, several Asian countries have propelled themselves into the ranks of middle-income and even advanced economies. This reflects the region’s ongoing industrialization and urbanization, its rising demand and productivity growth, and its dynamic corporate sector.
1 The United Nations and UNCTAD count 77 countries and territories as part of the Asia and Oceania region. Our research follows this grouping with the exception of omitting Iran and the countries within the UN’s “Western Asia” grouping (including Saudi Arabia and the rest of the Middle East) due to dissimilarities and lack of strong economic ties between these nations and most of East and Southeast Asia. It should also be noted that while Oceania and Central Asia are included in our analyses, limited data is available for many of these countries.
2 Outperformers: High-growth emerging economies and the companies that propel them, McKinsey Global Institute, September 2018.
3Asia’s future is now

These trends represent a real shift in the world’s center of gravity. Scholar Parag Khanna asserts that the “Asian century” has begun and observes that the region’s rise is not cyclical but structural.3 Emerging Asia’s evolution has reached a stage that requires deeper global acknowledgment. It is upending assumptions—long held in the West, in other emerging economies, and even in Asia itself—about the world’s economic balance.
This paper provides an overview of Asia’s role in four areas: trade flows and networks, the corporate ecosystem, technology, and the Asian consumer. MGI will return to each of these topics with more extensive standalone research reports in the months ahead. Yet combining these perspectives, as we do here, provides a wider view of how the region is evolving—and a hint of how it might define the future.
3 Parag Khanna, The future is Asian: Commerce, conflict, and culture in the 21st century, Simon & Schuster/Hachette, 2019.
Exhibit 1
Asia’s upward trajectory is apparent in multiple indicators.
Actuals ForecastNorth America Europe AsiaRoW
1 Projections are indexed to 2010 USD.2 North America and Western Europe not included as their literacy rates are close to 100%.3 North American data is from 2010, 2013, and 2016 as data is not available for other years.
Source: World Bank, McKinsey Global Institute analysis
Consumer: Consumption value1 Trade: Annual trade value1Economic: GDP PPP1
Social: Literacy rate,2 % of individuals >15 years who are literate
80 100 16
1475 90
1280 10
7070 8
65 660
460 50 2
5 40 01997 2007 2017 2007 2012 2017 2009 2012 2017
Social: Poverty rate,3 % of population earning less than $1.90 per day
Regional share of key indicators
Nominal value of key indicators
Social: Average life expectancy at birth, years
60 40 45
35 4050
30 35
40 25 30
2530 20
2015
20 1510 10
10 5 5
0 2000 2017 2040 0 2000 2017 2040 0 2000 2007 2017
4 McKinsey Global Institute

Asia is transforming trade Recent MGI research examined 23 industry value chains spanning 43 countries and documented major structural shifts in the world’s trade patterns.4 Asia is at the center of many of these changes, and its companies will continue to respond to them in the years ahead. Over the past decade, global output has continued to rise but the share of goods traded across borders has fallen by 5.6 percentage points. This decline does not reflect trade disputes or hint at an impending slowdown. Instead, it reflects healthy economic development in China, India, and the rest of emerging Asia.
As consumption rises, more of what gets made in these countries is now sold locally instead of being exported to the West. Over the decade from 2007 to 2017, China almost tripled its production of labor-intensive goods, from US$3.1 trillion to US$8.8 trillion. At the same time, the share of gross output China exports has dramatically decreased, from 15.5 percent to 8.3 percent. India has similarly been exporting a smaller share of its output over time (Exhibit 2). This implies that more goods are being consumed domestically rather than exported. Furthermore, as the region’s emerging economies develop new industrial capabilities and begin making more sophisticated products, they are becoming less reliant on foreign imports of both intermediate inputs and final goods.
The previous era of globalization was marked by Western companies building supply chains that stretched halfway around the world as they sought out the lowest possible labor costs—and often their supply chains ran through Asia. Now labor arbitrage is on the wane. Only 18 percent of today’s goods trade now involves exports from low-wage countries to high-wage countries—a far smaller share than most people assume and one that is declining in many industries.
Labor-intensive manufacturing for export was a major engine of China’s rise, and it has historically been the clear path to economic development for poor countries. However, opportunities to compete on the basis of low-cost labor are narrowing as wages rise across the region and as automation technologies are adopted more widely.
For some in the region, the window is not closed yet. As wages rise in China and the country moves into higher-value activities, its share of global exports of labor-intensive goods has declined by 3 percentage points. This has created an opening for other countries to step in (Exhibit 3). In the past decade, Vietnam, India, and Bangladesh have managed to grow their exports of labor-intensive manufactured goods (particularly textiles) by annual rates of 15 percent, 8 percent, and 7 percent, respectively. This trend can turn unknown cities into new manufacturing hot spots (see Box 1, “Tomorrow’s manufacturing hubs take root”).
Nevertheless, infrastructure, workforce skills, and productivity will be critical to competitiveness in the decade ahead. Low-cost labor alone will not be enough. All industry value chains now rely more heavily on R&D and innovation—and the share of value generated by the actual production of goods is declining.5 These shifts, combined with a wave of new manufacturing and logistics technologies, mean that countries across Asia will need to alter their investment priorities and develop new types of skills to compete in a more knowledge-intensive trade landscape.
4 Globalization in transition: The future of trade and value chains, McKinsey Global Institute, January 2019.5 See, for example, Mary Hallward-Driemeier and Gaurav Nayyar, Trouble in the making? The future of manufacturing-led
development, World Bank, 2017; and Jonathan Haskel and Stian Westlake, Capitalism without capital: The rise of the intangible economy, Princeton University Press, 2017.
5Asia’s future is now
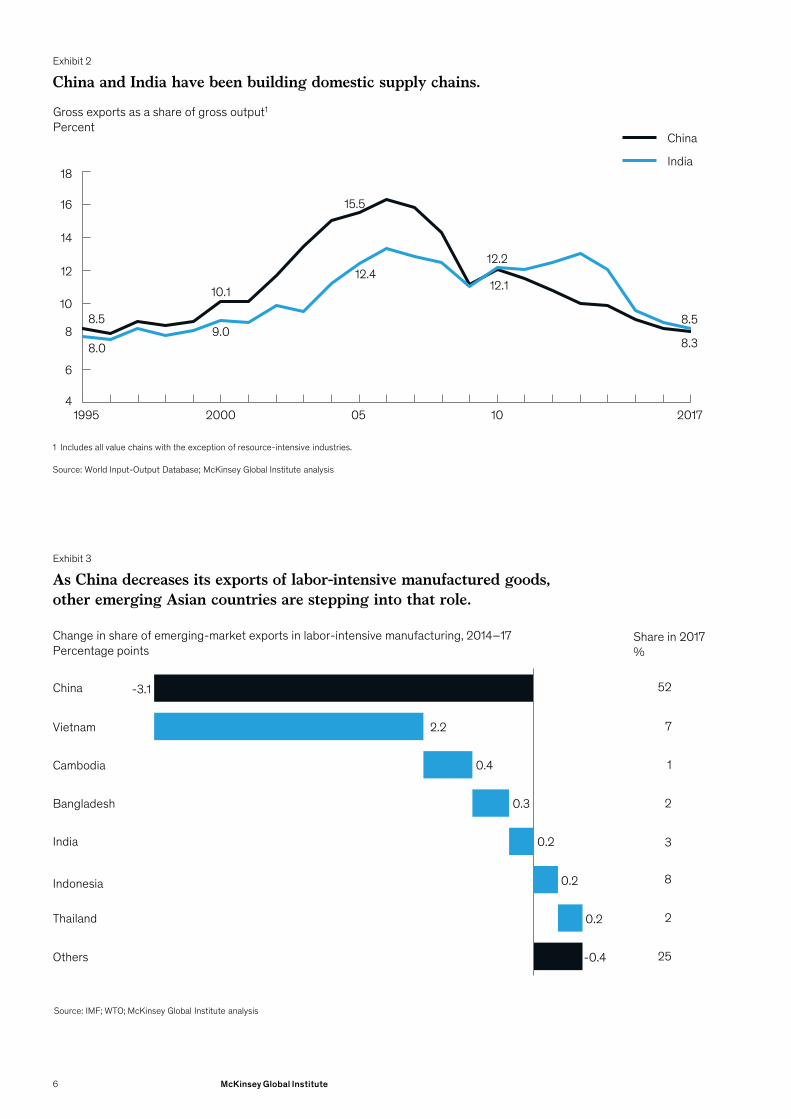
Exhibit 2
China and India have been building domestic supply chains.
1 Includes all value chains with the exception of resource-intensive industries.
Source: World Input-Output Database; McKinsey Global Institute analysis
8.5
10.1
15.5
12.1
8.38.09.0
12.412.2
8.5
16
18
4
12
6
14
8
10
05 20171995 2000 10
China
India
Gross exports as a share of gross output1
Percent
Exhibit 3
-3.1
0.2
-0.4
0.2
As China decreases its exports of labor-intensive manufactured goods, other emerging Asian countries are stepping into that role.
52
7
1
2
3
8
2
25
India
Thailand
China
Vietnam
Indonesia
Cambodia
Bangladesh
Others
2.2
0.4
0.3
0.2
Change in share of emerging-market exports in labor-intensive manufacturing, 2014–17Percentage points
Share in 2017%
Source: IMF; WTO; McKinsey Global Institute analysis
6 McKinsey Global Institute

Box 1 Tomorrow’s manufacturing hubs take root
Historically China was known as the “factory to the world.” But while low-cost labor was its original competitive advantage, the wage gap between China and the rest of Asia is closing. In 1996, wages in Japan were 46 times higher than in China; by 2016, they were only four times higher. China is moving up the value chain, and as it transitions, other locations around Asia are stepping into some of its former niches.
Vietnam, in particular, has become a hub of labor-intensive manufacturing for export. The country has attracted a flood of greenfield investment into cities such as Hai Phong. In addition to Hai Phong (Vietnam), Ho Chi Minh City (Vietnam), Bekasi (Indonesia), and Xi’an (China) are rising makers of electronics. As new places assume new roles in industry value chains, a new set of cities begins to benefit from the influx of capital. Investment in factories leads to new roads, new jobs, and urbanization.
Much of the capital flowing into Vietnam comes from South Korea and Japan. These new manufacturing hubs speak not only to the rise of emerging Asian countries but also to a region that is more connected and co-invested.
Companies are increasingly focused on speed to market and improving coordination and visibility across the entire value chain—goals that are hard to achieve when suppliers are halfway around the globe. As a result, supply chains are becoming shorter and more localized. Intra-regional trade is increasing at the expense of long-haul trade.
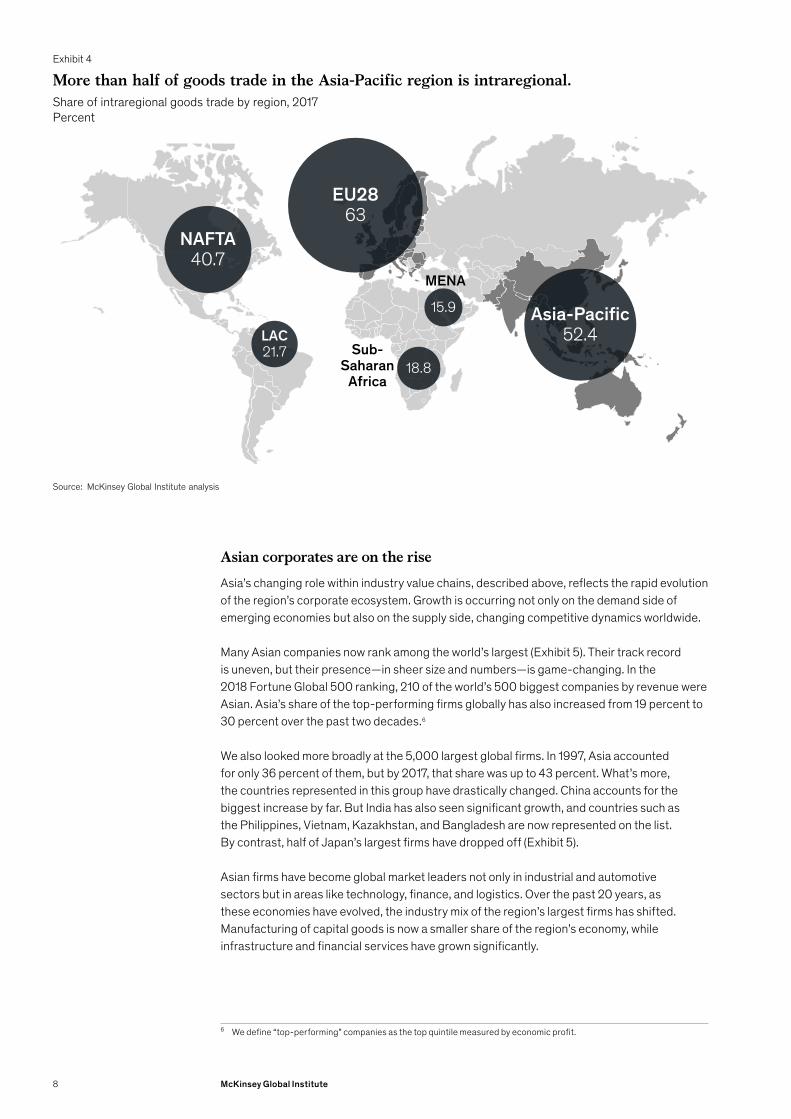
Because of its diversity and geographic sweep, Asia is not and likely will never be the same kind of tightly integrated trade entity as the European Union or NAFTA. Although it is a looser constellation of countries, trade ties and cooperation are deepening across the region. Today 52 percent of Asian trade is intra-regional, a sharply higher share than in North America (Exhibit 4). This points toward a new trend of firms building self-contained regional supply chains to serve Asian markets. It also indicates deepening trade ties among Asian countries themselves—with much more room to grow. The Regional Comprehensive Economic Partnership (RCEP) is a new free trade agreement that includes 16 countries across the region, including China, Japan, India, and Vietnam.
While trade in goods has flattened, flows of services have become the real connective tissue of the global economy. In fact, services trade is growing 60 percent faster than trade in goods—and Asia’s services trade is growing 1.7 times faster than the rest of the world’s. While India and the Philippines are among the biggest exporters of back-office business services, trade in knowledge-intensive services is still in its infancy across most Asian countries and represents an important gap to be filled.
In our follow-on research, we will take a more holistic view of how Asia is developing global networks. Among the questions for the future:
— What kind of networks are forming across Asia, and how will they shape global trends? What is the role of each country?
— Which cities will be the hotspots of the future in different fields?
— How will Asia’s evolution change the center of gravity within various sectors?
7Asia’s future is now
Asian corporates are on the riseAsia’s changing role within industry value chains, described above, reflects the rapid evolution of the region’s corporate ecosystem. Growth is occurring not only on the demand side of emerging economies but also on the supply side, changing competitive dynamics worldwide.
Many Asian companies now rank among the world’s largest (Exhibit 5). Their track record is uneven, but their presence—in sheer size and numbers—is game-changing. In the 2018 Fortune Global 500 ranking, 210 of the world’s 500 biggest companies by revenue were Asian. Asia’s share of the top-performing firms globally has also increased from 19 percent to 30 percent over the past two decades.6
We also looked more broadly at the 5,000 largest global firms. In 1997, Asia accounted for only 36 percent of them, but by 2017, that share was up to 43 percent. What’s more, the countries represented in this group have drastically changed. China accounts for the biggest increase by far. But India has also seen significant growth, and countries such as the Philippines, Vietnam, Kazakhstan, and Bangladesh are now represented on the list. By contrast, half of Japan’s largest firms have dropped off (Exhibit 5).
Asian firms have become global market leaders not only in industrial and automotive sectors but in areas like technology, finance, and logistics. Over the past 20 years, as these economies have evolved, the industry mix of the region’s largest firms has shifted. Manufacturing of capital goods is now a smaller share of the region’s economy, while infrastructure and financial services have grown significantly.
6 We define “top-performing” companies as the top quintile measured by economic profit.
Exhibit 4
More than half of goods trade in the Asia-Pacific region is intraregional.
Source: McKinsey Global Institute analysis
Share of intraregional goods trade by region, 2017Percent
NAFTA40.7
EU2863
LAC21.7
Asia-Pacific52.4
MENA
15.9
Sub-Saharan
Africa18.8
8 McKinsey Global Institute

Exhibit 5
Asia’s share of the largest 5,000 firms worldwide spans a wide range of sectors and countries.
Japan$3,218 Bn1,215
Australia$128 Bn72
MainlandChina$36 Bn57
Hong Kong$64 Bn98
India$14 Bn25
Indonesia$6 Bn11
Malaysia$47 Bn50
New Zealand$15 Bn20
Pakistan$2 Bn4
Philippines$3 Bn8
Singapore$37 Bn45
South Korea$242 Bn135 Taiwan
$21 Bn19
Thailand$17 Bn28
Geography breakdown, 1995-97
India
Geography$Bn total revenue# Total number of firmsGreater China South East Asia Central AsiaAdvanced Asia
Source: CPAT
2015–17
India$879 Bn142 companies
Malaysia$175 Bn310
Indonesia$178 Bn36
Thailand$178 Bn29
Australia$596 Bn102
Japan$5,917 644
New Zealand$61 Bn16 companies
Singapore$346 Bn38
South Korea$1,411 Bn156
Pakistan$27 Bn10
Azerbaijan$1 Bn1
MainlandChina$7,504 Bn738
Hong Kong$618 Bn75
Taiwan$736 Bn92
Vietnam$38 Bn15
Philippines$60 Bn15
Kazakhstan$14 Bn4
Bangladesh$1 Bn1
Malaysia$175 Bn31
Indonesia$178 Bn36
Thailand$178 Bn29
India$879 Bn142
9Asia’s future is now

Exhibit 10
Construction$274 Bn139
Distribution and logistics$314 Bn171
Auto and parts$446 Bn94
Fabricatedcomponents$228 Bn122
Industrial chemicals$171 Bn105
Machinery and equipment$383 Bn211
Food, beverages, and tobacco$120 Bn113
Pharma,medical products$50 Bn35
Retail$139 Bn112
Hospitality $24 Bn42
Computers andElectronics$196 Bn93
Natural resource processing$196 Bn93
Transportation$235 Bn89
Utilities$206 Bn49
Appeal and luxury$45 Bn63
Real estate$69 Bn47
Internet and media$77 Bn41
Professional services$9 Bn 13
Telecommunications$129 Bn13
Consumer packed goods$32 Bn16
Asia’s share of the largest 5,000 firms worldwide spans a wide range ofsectors and countries.
Source: McKinsey Global Institute analysis
InfrastructureBusiness Services
Banks$87 Bn32
Healthcare$1 Bn2
Insurance$17 Bn8
Education$3 Bn2
Industry$Bn total revenue# Total number of firms
Industry breakdown, 1995-97
Capital Goods
Education$11 Bn5Natural resource
processing$2,964 Bn207
Transport-ation$937 Bn126
Utilities$1,136 Bn97
Telecommunications$605 Bn29
Auto and parts$1,360 Bn102
Fabricatedcomponents$449 Bn89
Industrial chemicals$614 Bn121
Machinery and equipment$1,882 Bn195
Banks$1,032 Bn100
Real estate$600 Bn108
Insurance$754 Bn31
Construction$1,124 Bn154
Distribution and logistics$1,003 Bn142
Professional services$127 Bn 22
Computers andelectronics$1,614 Bn140
Internet and media$278 Bn50
Appeal,luxury$179 Bn44
Consumer packed goods$63 Bn15
Food, beverages, tobacco$702 Bn126
Pharma,medical products$217 Bn48
Healthcare$24 Bn8
Retail$887 Bn147
Hospitality $103 Bn34
2015–17
Consumer GoodsConsumer Services
Information Technology
Financial Services
10 McKinsey Global Institute

The ownership structures, growth strategies, and operating styles of Asian corporate giants differ from those of publicly owned Western multinationals.7 About two-thirds of the 110 Chinese companies in the Fortune 500 are state owned.8 The region also has a number of large conglomerates. South Korea’s top five family-controlled chaebols together account for roughly half of the value in the country’s stock market. Japan’s “big six” keiretsu similarly have outsized weight in the country equity market; each one owns dozens of companies spanning several industries. All major Japanese car manufacturers, for example, can be tied back to a keiretsu. India’s top six conglomerates alone employ more than 2 million people.
A firm with a controlling shareholder—whether family, founder, or state—may focus on expanding its position through top-line growth and is able to take a longer-term view about accomplishing that goal. This stands in contrast to widely held public firms that must answer to shareholders every quarter and are more focused on maximizing earnings in the immediate term.
Despite the varying degree of government involvement in economies across the region, competition remains high. Some companies enjoy government support, but it is often tied to performance goals. Across the region, the churn rate of firms in the top quintile of performance is around 20 percentage points higher in Asia than in the world’s advanced economies.9
However, as in the West, the distribution of economic profit and loss is skewed. Recent MGI research analyzed more than 5,000 of the world’s largest public and private firms with annual revenues above US$1 billion. It identified a so-called “superstar” phenomenon—that is, a set of firms that capture a greater share of income and are pulling away from their peers.10 Asia accounts for 30 percent of all global superstar firms, up from 15 percent in the 1990s. Most of these companies are from China, India, Japan, and Korea. The region is producing more global superstar firms over time, although it is still underrepresented.
MGI found that firms in the top decile of performance are generating higher economic profits11 than ever before, while losses are growing among the worst-performing firms (some of which are “zombie” firms that actually destroy value). This effect tends to squeeze the firms in the middle of the distribution. This phenomenon is global, and it is particularly pronounced in Asia. In the decade since 2005-07, the economic profit produced by top-quintile Asian firms increased by 57 percent (versus 33 percent in North America). Meanwhile, the economic profit destroyed by bottom-quintile Asian firms increased sevenfold (versus 2.5 times in North America).
The revenues produced by the region’s superstar firms are seven times larger than those of their median counterparts , and their ROIC is 2.2 times higher. The most dominant sectors within this group are computers and electronics, automotive, and banking. At the other end of the performance curve, a significant number of firms in the region are in the bottom decile for economic profit globally. Many of them are in the natural resource processing, machinery and equipment, and real estate industries.
7 For more on this topic, see Playing to win: The new global competition for corporate profits, McKinsey Global Institute, September 2015.
8 Mainland China and Hong Kong9 Outperformers: High-growth emerging economies and the companies that propel them, McKinsey Global Institute,
September 2018.10 Superstars: The dynamics of firms, sectors, and cities leading the global economy, McKinsey Global Institute, October
2018. There is extensive recent academic literature on this topic. See, for example, Jason Furman and Peter Orszag, “A firm-level perspective on the role of rents in the rise in inequality,” paper presented at Columbia University’s “A Just Society” centennial event in honor of Joseph Stiglitz, October 2015; David Autor et al., The fall of the labor share and the rise of superstar firms, NBER working paper number 23396, May 2017; and Jan de Loecker and Jan Eeckhout, Global market power, NBER working paper number 24768, June 2018.
11 The metric we use to define “superstar” firms is economic profit, which measures a firm’s profit above and beyond opportunity cost. We take the firm’s returns, deduct the cost of capital, and multiply by the firm’s total invested capital. We use this metric rather than focusing on revenue, market share, or productivity growth to prevent including firms that are simply large and may not create economic value.
11Asia’s future is now

The superstar effect in the corporate world is mirrored by widening disparities between cities, regions, and population segments. Asia may be replicating some of the patterns that have taken hold in the West.
In forthcoming research, MGI will delve more deeply into the rise of Asian firms and explore questions for the future:
— How competitive are Asian firms globally?
— How has their evolution challenged global dynamics?
— What does “winning” mean for Asian companies? How are business models evolving across the region?
— How is the growth of the corporate sector changing Asian society more broadly?
Asia is shaping the future of digital innovation globally
Asia is online and booming. Today it already accounts for half (2.2 billion) of the world’s internet users; China and India alone account for one-third (Exhibit 6). The region’s enormous pools of digital consumers support a flourishing and innovative technology sector.
China, Japan, South Korea, and Singapore are among the most digitally advanced nations in the world. China has joined these ranks with startling speed. In e-commerce, for example, China accounted for less than 1 percent of the value of worldwide transactions only about a decade ago; that share is now more than 40 percent. Penetration of mobile payments among China’s Internet users grew from just 25 percent in 2013 to 68 percent in 2016. Three of China’s Internet giants—Baidu, Alibaba, and Tencent—are building a rich digital ecosystem now growing beyond them.12
12 Digital China: Powering the economy to global competitiveness, McKinsey Global Institute, December 2017.
Exhibit 6
Asia accounts for half of the world’s total internet users.
Source: Internet World Stats
Number of internet users, millions
Asia RoW% Share of total of
2000 2019 2000 2019 internet users, 2019
19 13 7 3 3 3 3 3 2 2 2 2 2 1 1 1 1 1 1 1
Chin
a
Indi
a
Uni
ted
Stat
es
Bra
zil
Indo
nesi
a
Japa
n
Nig
eria
Russ
ia
Ban
glad
esh
Mex
ico
Ger
man
y
Turk
ey
Philip
pine
s
Viet
nam
Uni
ted
King
dom
Iran
Fran
ce
Thai
land
Italy
Egyp
t
12 McKinsey Global Institute

Asia has ample venture capital to support technology innovation and entrepreneurship. China now ranks second only to the United States in terms of start-up investment. From 2014 through 2016, China provided just under 20 percent of the world’s venture capital. India is also catching up quickly, tripling Germany’s venture funding in 2018. Asia now accounts for nearly half of global investment (Exhibit 7). It is now among the top global sources and destinations for venture capital in fields such as virtual reality, autonomous vehicles, 3-D printing, robotics, drones, and artificial intelligence (AI).
Innovation hubs are starting to take root. As of April 2019, Asia was home to more than one-third (119) of the world’s 331 “unicorns” (startups valued at more than US$1 billion; see Box 2, “Asia’s unicorns: Learning to run while young”). Ninety-one of these companies are in China, followed by India with 13, South Korea with six, and Indonesia at four. By comparison, the United States is home to 161 unicorns, while the United Kingdom has 16 and Germany has nine.
Exhibit 7
Global investment in start-ups has shifted over the past five years.USD Billion, 2018, 2013-2018
Source: Preqin, McKinsey Global Institute analysis
Start-up investment in 2018 USD B
0.0
20.0
40.0
60.0
80.0
100.0
110.8
Delta (13-18)
-0.29 99.41
1.1
3.3
110.8
10.0
10.6
4.03.3
106.2
3.52.5
5.1 2.7
1.9
2.4
Box 2 Asia’s unicorns: Learning to run while young
Asia is not only producing a substantial share of global unicorns, but it is doing it much faster than the West. We looked how long it took these firms to go from their founding to unicorn status. On average, it took 10 years for firms in the EMEA region, nine years for firms in North America, and only six years for firms in Asia.
Asia’s startups have other distinguishing features. They can scale much faster than their Western peers. They tend to be B2C focused and concentrated in less R&D-intensive industries such as e-commerce or education and training services. B2B and more R&D-intensive industries (such as analytics and performance software, cloud computing, and healthcare IT) tend to be led by firms based in the United States, the United Kingdom, and Germany.
13Asia’s future is now

China has made AI development a strategic priority, and it currently ranks as one of the global leaders in this field.13 South Korea and Singapore also have major national initiatives to build AI capabilities.14 Japan has similar ambitions and recently announced new courses in its universities and technical schools to produce 250,000 graduates annually with proficiency in AI.15 Despite this flurry of activity and innovation, some 2 billion people across the region lack Internet access, including many in rural areas of India, China, and Indonesia. Building out backbone digital infrastructure beyond major cities and bringing more of this population online is an issue for both economic and human development.
However, even lagging countries are rapidly digitizing. Private-sector innovation is bringing internet-enabled services to millions of consumers and made online usage more accessible. As this process unfolds, it is creating a mobile-first environment, with large populations skipping over the stages of broadband and PC usage altogether in favor of mobile phone usage and applications.
Indonesia and India have outpaced the world in the speed of digital adoption over the past three years—and once new users go online, they quickly gain digital savvy. The number of internet subscribers in India alone has almost doubled since 2014 to 560 million. Their use of mobile data is growing at 152 percent annually—more than twice the rates in the United States.16
In a promising step that could serve as a model for other Asian countries still in the earlier stages of their digitization journey, the Indian government has managed to enroll more than 1.2 billion people in a biometric digital identity program. This has given many people a legal identity for the first time, making it possible for them to access banking, credit, government benefits, education, and other services.17 India has also brought more than 10 million businesses onto a common digital platform through a goods and service tax.18 These types of initiatives can accelerate the process of digitization more broadly across entire economies.
Whether they are digital leaders or laggards, the next stage of the journey for countries across the region is to go beyond consumer use and encourage wider adoption of digital tools in traditional sectors, from agriculture to retail and logistics. Similarly, the public and social sectors can continue deploying digital systems to make government services and healthcare more efficient. The ultimate goal is harnessing the latest technology tools to boost productivity in a meaningful way.
Asian countries are breaking through to the forefront of innovation and technology. In the next phase of our research, MGI will explore questions for the future:
— Where will Asia’s versions of Silicon Valley emerge? How will they differ from startups hubs in other parts of the world?
— How competitive is Asia’s innovation environment? Who is driving innovation in Asia?
— How do innovative firms in Asia operate and lead?
— What can policymakers and corporations do to accelerate the adoption of both basic and advanced digital tools to propel productivity growth?
13 See, for example, Artificial intelligence: Implications for China, McKinsey Global Institute, April 2017; and Kai-Fu Lee’s perspectives on two global leaders in artificial intelligence: China and the United States, video interview, June 2018, available at www.mckinsey.com/featured-insights/artificial-intelligence/kai-fu-lees-perspectives-on-two-global-leaders-in-artificial-intelligence-china-and-the-united-states.
14 Notes from the AI frontier: Modeling the impact of AI on the world economy, McKinsey Global Institute, September 2018.15 Minako Yamashita, “Japan aims to produce 250,000 AI experts a year,” Nikkei Asian Review, March 30, 2019.16 Digital India: Technology to transform a connected nation, McKinsey Global Institute, March 2019.17 Digital identification: A key to inclusive growth, McKinsey Global Institute, April 2019.18 Digital India: Technology to transform a connected nation, McKinsey Global Institute, March 2019.
14 McKinsey Global Institute

Asia’s consumers are a force in the global economyOver the past two decades, global poverty has dropped dramatically. Some 1.2 billion people have been propelled into the consuming class, meaning that they have passed the income level at which they can begin to make significant discretionary purchases. This is one of the greatest economic success stories in history—and it is very much an Asian story.
Today those legions of households are flexing growing spending power. McKinsey projects that the region will fuel half of all the consumption growth expected worldwide over the course of the next decade. By 2030, it is projected to account for more than half of global consumption growth (Exhibit 8).
The growing Asian middle class will soon be three billion strong. Southeast Asia alone had some 80 million households in the consuming class just a few years ago. Now that number is on track to double to 163 million households by 2030, with Indonesia, in particular, generating tens of millions of newly prosperous consumers.19
The region is one of the most important markets for international companies. Asian consumers have long had a strong preference for foreign luxury goods and brands. But things are changing. The post-90’s generation is starting to lose this bias against domestic brands; in fact, they are starting to choose them over foreign brands more often. Whether they are Asian or Western, brands need highly targeted strategies to succeed across such a diverse and fragmented region—where wealthy advanced economies already have well-developed brands and retail channels, but new consumers in developing economies still need to acquire many basics. India’s average spending on apparel and footwear rose from US$40 per person in 2007 to US$64 in 2017, for example.20
19 Southeast Asia at the crossroads: Three paths to prosperity, McKinsey Global Institute, November 2014.20 Globalization in transition: The future of trade and value chains, McKinsey Global Institute, January 2019.
Exhibit 8
31
7
651
23
9
8
54 3
Asia could drive 50 percent of global consumption growth in the decade ahead.Share of urban consumption growth, 2015–30, percent
Source: McKinsey Global Institute analysis
Northeast Asia
Eastern Europe
China
South Asia
Southeast Asia
Australia
United States and Canada
Western Europe
Sub-Saharan Africa
Latin America
MENA
15Asia’s future is now

The most striking rise in consumption has occurred in China. Previous MGI research highlighted China’s working-age population as one of the world’s key consumer demographics. By 2030, this group could account for 12 cents of every $1 of worldwide urban consumption. Growing wealth in China has created an affluent class of aspirational consumers. In 2018, less than 30 million Chinese consumers accounted for one-third of global spending on luxury goods, and McKinsey projects that their outlay will almost double by 2025 (Exhibit 9).
The “Asian consumer” resists easy characterization. The region’s seniors, for example, will drive 15 percent of global consumption growth, adding some US$660 billion to what they already spend today. Their needs go beyond healthcare. As many choose to age at home, for example, many will opt for renovations.
Asia’s Generation Z has different buying behaviors and values. They have grown up with unprecedented wealth, greater exposure to Western culture, and digital savvy. The luxury purchases of young Chinese consumers are heavily influenced by their media consumption and their desire to be seen and snapped in the latest styles.
Consumer markets across the region are experiencing not only tremendous growth but also dynamic change as new consumers quickly move past basic purchases, form new brand loyalties, and hit the point at which they can purchase some personal indulgences and express their own fashion and style. As companies strive to meet ever-high expectations, Asian consumers will increasingly set trends for the rest of the world.
Exhibit 9
Asia is on track to account for more than half of the global market for personal luxury goods.1
EUR billion
1 Includes ready to wear, accessories, watches, and jewelry and beauty2 Both domestic and overseas spending
Source: China Luxury Report 2019; China Luxury Report 2017
182012 20 2025
Other worldwide consumers
Total Asianconsumers2
52%
Share of global market
83
152 173
244
231
330358
441
16 McKinsey Global Institute

MGI’s forthcoming research into Asia’s consumption will explore a number of questions for the future:
— Which consumer groups will be the main drivers of future growth?
— How big are nascent markets for services, experience, and data? How can companies tap into them?
— How will the rise of Generation Z shape future consumption patterns in Asia? How does Asia’s Generation Z differ from their Western peers?
— How is Asia aging? How will this wave change consumption patterns?
Asia is a hub of world trade, home to some of the world’s largest companies, the fastest-growing part of the internet, and the engine of global consumption growth. In the months ahead, MGI will return to each of these topics with a series of comprehensive research reports. We hope to illuminate not only the region’s future trajectory but also how Asia is putting its own stamp on the world economy.
17Asia’s future is now

McKinsey Global Institute July 2019 Copyright © McKinsey & Company Designed by the McKinsey Global institute
www.mckinsey.com
@McKinsey @McKinsey