Embed Size (px)
Citation preview

Level 2/424 Upper Roma StBrisbane QueenslandAustralia 4003
Lai-Ling LamAnalyst, Gartner Dataquest
Teleconference
3 September 2003
Copyright © 2002Entire contents © 2001 by Gartner, Inc. All rights reserved. Reproduction of this publication in any formwithout prior written permission is forbidden. The information contained herein has been obtained fromsources believed to be reliable. Gartner disclaims all warranties as to the accuracy, completeness oradequacy of such information. Gartner shall have no liability for errors, omissions or inadequacies in theinformation contained herein or for interpretations thereof. The reader assumes sole responsibility for theselection of these materials to achieve its intended results. The opinions expressed herein are subject toh ith t ti
Asia/Pacific: Printer Market, 2Q03

Copyright © 2003
Page 1
Source: Gartner Dataquest(September 2003)
Market Highlights, 2Q03 (1)
� Total Asia/Pacific Printer Shipments– 4,211,000 units
� End-User Spending� $882.4 Million� Largest Markets
– China: 44.3%– South Korea: 9.8%– Australia: 7.6%
15.8%
13.9%
23.6%-33.7 %
35.9 %
In the second quarter of 2003, approximately 4.2 million printers were shipped inAsia/Pacific. This was an impressive 15.8 percent improvement over the same period of ayear ago, despite the outbreak of severe acute respiratory syndrome (SARS) in some of thelarge economies in Asia/Pacific. Asia/Pacific continued to outshine other regions and is theonly region to report positive growth. The United States and Europe suffered double-digitdeclines, while Latin America and Japan experienced single-digit declines.
End-user spending on printers was $882.4 million, an increase of 13.9 percent year overyear.
China, with shipments of almost 1.9 million, continued to be the largest market, followed bySouth Korea with 415,000 units or almost a 10 percent share. Australia overtook Taiwan tobecome the third-largest market with 7.6 percent market share.

Copyright © 2003
Page 2
Source: Gartner Dataquest(September 2003)
Market Highlights, 2Q03 (2)
� Largest Year-Over-Year Growth– Indonesia: 74.6%– Vietnam: 57.4%– India: 56.1%
� Leaders– HP: 30.8%– Epson: 23.6%– Canon: 18.1%
30.6%
17.0%
9.6 %
The emerging economies of Indonesia, Vietnam and India topped the growth charts, each recordinggrowth of more than 50 percent.
There were no changes to market standing. HP remained the market leader with almost 1.3 millionprinters, a 30.8 percent market share. Epson and Canon remained in second and third place.
Copyright © 2003
Page 3
Source: Gartner Dataquest(September 2003)
Asia/Pacific: Printer Market Trends
-40%
-30%
-20%
-10%
0%
10%
20%
30%
40%
50%
60%1Q
98
2Q98
3Q98
4Q98
1Q99
2Q99
3Q99
4Q99
1Q00
2Q00
3Q00
4Q00
1Q01
2Q01
3Q01
4Q01
1Q02
2Q02
3Q02
4Q02
1Q03
2Q03
Units
End-User Spending
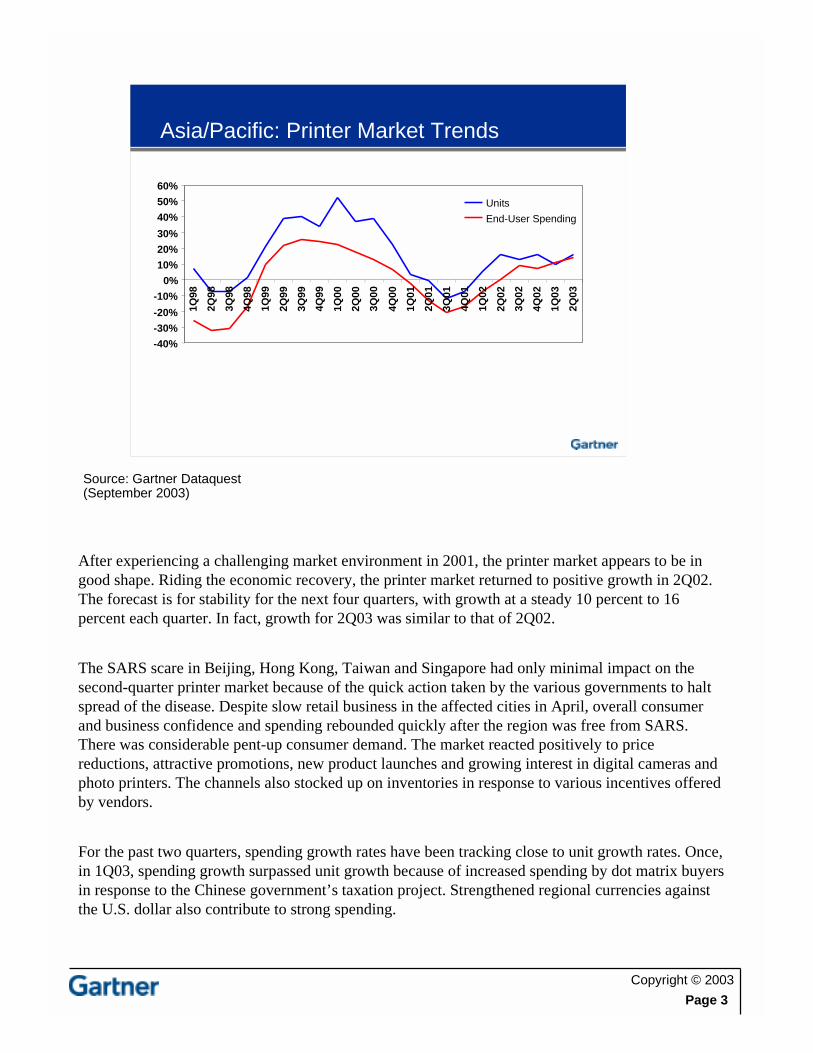
After experiencing a challenging market environment in 2001, the printer market appears to be ingood shape. Riding the economic recovery, the printer market returned to positive growth in 2Q02.The forecast is for stability for the next four quarters, with growth at a steady 10 percent to 16percent each quarter. In fact, growth for 2Q03 was similar to that of 2Q02.
The SARS scare in Beijing, Hong Kong, Taiwan and Singapore had only minimal impact on thesecond-quarter printer market because of the quick action taken by the various governments to haltspread of the disease. Despite slow retail business in the affected cities in April, overall consumerand business confidence and spending rebounded quickly after the region was free from SARS.There was considerable pent-up consumer demand. The market reacted positively to pricereductions, attractive promotions, new product launches and growing interest in digital cameras andphoto printers. The channels also stocked up on inventories in response to various incentives offeredby vendors.
For the past two quarters, spending growth rates have been tracking close to unit growth rates. Once,in 1Q03, spending growth surpassed unit growth because of increased spending by dot matrix buyersin response to the Chinese government’s taxation project. Strengthened regional currencies againstthe U.S. dollar also contribute to strong spending.

Copyright © 2003
Page 4
Source: Gartner Dataquest(September 2003)
2Q03 Country Market Growth Rates
36%
24%
-1%
56%
75%
-34%
12%
-15%
20%25%
17%15%
57%
34%30%
14%
6%2%
-22%
29%
2%-1%
7% 6%
-2%
11%
-40%
-20%
0%
20%
40%
60%
80%
Australia
China
Hong
Kong
India
Indonesia
Malaysia
New
Zealand
Philippines
Singapore
Taiw
an
Thailand
Vietnam
Y/Y Growth Q/Q Growth
South
Korea
More than 70 percent of the major markets in Asia/Pacific experienced positive growth in the secondquarter of 2002.
China, the largest market, grew an impressive 24 percent, despite being affected by SARS in theearly part of the quarter. Market sentiment was strong, buoyed by increasing IT infrastructureprojects in both the government and private sector and the growing affluence of the Chinese society.
South Korea, which was plagued by political and economic problems, was the hardest hit, suffering a34 percent year-over-year decline.
In line with overall PC market, the Australian printer market saw some upside, fueled byreplacement cycle purchases and the boom in digital photography.
Thanks to spending that increased as the economy recovered, the Indian market become more activefollowing lackluster growth in the past few quarters.
Indonesia also experienced a strong performance from riding a stable economy. Year-over-yeargrowth of 100 percent appeared impressive, but that was compared with a particularly bad quarterone year ago.

Copyright © 2003
Page 5
Source: Gartner Dataquest(September 2003)
Geographical Contribution2Q03 vs. 2Q02
2Q02 Shipments
China41%
Hong Kong2%India
5%
Indonesia4%
South Korea17%
Malaysia5%
Philippines2%
New Zealand2%
Australia6%
Vietnam1%
Thailand5%
Singapore2% Taiwan
7%ROA1%
2Q03 Shipments
ROA1%
Taiwan7%
Singapore2% Thailand
4% Vietnam1%
Australia8%
New Zealand1%
Philippines2%
Malaysia5%
South Korea10%
Indonesia6% India
7%Hong Kong
2%
China44%
The percentage breakdown was similar to that of the previous year.
China accounted for more than 44 percent of all printer shipments in Asia/Pacific, followedby South Korea, Australia and Taiwan. Combined, the four regions accounted for 69 percentof all Asia/Pacific shipments.

Copyright © 2003
Page 6
Source: Gartner Dataquest(September 2003)
Total Market: Top 10 Vendors, 2Q03
0.0%
5.0%
10.0%
15.0%
20.0%
25.0%
30.0%
35.0%
Mar
ketS
hare
HP
Eps
on
Can
on
Lege
nd
Lexm
ark
Sam
sung
Ele
ctro
nics
Sta
r
Fou
nder
Ele
ctro
nics
Fuj
itsu
Oki
Dat
a
2Q 02
1Q 03
2Q 03
Growth Rate Highlights:Star 113.9% TVSE 104.4% Legend 48.1%
HP maintained its market share of 30.8 percent in the second quarter. Riding a strong return ofconsumer confidence after the region was declared SARS-free, HP introduced several new inkjetmodels, cut prices of old models and embarked on aggressive promotional campaigns, therebyboosting its market share. HP saw its shipments increase 30.6 percent over the previous year.
Epson remained the No. 2 player with 23.6 percent market share, despite suffering a 2 percentagepoint market share decline from the previous quarter. With only one new inkjet model launched inmid-quarter, it was overshadowed by HP’s impressive five new inkjet models. On the other hand,Epson continued to improve its standing in the laser segment.
Canon maintained its No. 3 position with an 18.1 percent market share in 2Q03, losing 1 percentagepoint. Canon has been outpaced by the market for the past few quarters as it gradually shifted focusfrom low-end to mid-end inkjet products with direct camera printing capability.
Legend jumped three notches and commanded an 8.6 percent market share. Legend’s shipmentsincreased 48 percent from a year ago, driven by PC bundling and interest from business andgovernment sectors.
In fifth position was Lexmark with a 4.6 percent market share. Lexmark suffered a shipment declineof 38 percent from the previous year, despite achieving sequential growth of 34 percent. Lexmarkhad been reporting erratic inkjet performance over the past few quarters. However, Lexmark’s lasershave seen an increase through larger channel reach.
Samsung suffered a 25 percent shipment decline , no thanks to a weak local market in South Korea.On the other hand, Samsung has been quite successful in the expansion plans into otherAsia/Pacific countries such as China, India, Singapore, Taiwan, Malaysia, Australia.\

Copyright © 2003
Page 7
Source: Gartner Dataquest(September 2003)
Asia/Pacific Output Technology Trends
-
500
1,000
1,500
2,000
2,500
3,000
3,500
1Q00
2Q00
3Q00
4Q00
1Q01
2Q01
3Q01
4Q01
1Q02
2Q02
3Q02
4Q02
1Q03
2Q03
Inkjet
Page
Dot Matrix
Line Matrix
-40%
-20%
0%
20%
40%
60%
80%
1Q00
2Q00
3Q00
4Q00
1Q01
2Q01
3Q01
4Q01
1Q02
2Q02
3Q02
4Q02
1Q03
2Q03
Inkjet continued to dominate the printer market where it comprised 70 percent of total printershipments. In the third quarter of 2001, the page printer segment overtook dot matrix as thesecond-most popular technology. In the second quarter of 2003, page printers accounted fora 16.6 percent market share; dot matrix’s market share was 13.5 percent.
Even during poor economic conditions, such as in 2001, the page printer segment hasexperienced stable double-digit growth on a regular quarterly basis. The dot matrix segmentis much influenced by happenings in China, because it constitutes more than 60 percent oftotal dot matrix shipments. Government initiatives to introduce the Golden Tax Project in late2000 resulted in tremendous dot matrix shipment growth. Then the government’s laterdecision to postpone the project resulted in a sharp decline in dot matrix shipments.Renewed interest in the project in late 2002 resulted in sharp increase in dot matrix printers.

Copyright © 2003
Page 8
Source: Gartner Dataquest(September 2003)
Inkjet Shipments Year-Over-Year Change,2Q03
-60%
-40%
-20%
0%
20%
40%
60%
80%
100%
Asia/P
acific
Australia
China
Hong
Kong
India
Indonesia
Malaysia
New
Zealand
Philippines
Singapore
Taiw
an
Thailand
Vietnam
RestofA
sia/Pacific
South
Korea
All countries/regions in Asia/Pacific experienced positive double-digit growth rates, except for NewZealand and South Korea.
Indonesia, with a strong consumer appetite for affordable printers, saw inkjet sales double those ofthe same quarter in the previous year. Strong promotional programs such as free ink cartridges,sharp price cuts (the least-expensive model cost just $36), increased warranty periods, and roadshows in various towns across the country, continued to drive the market. Sales were furtherstimulated by the stable economy and strong local currency. However, the high growth rate wasachieved against a very poor performance during the same period in the previous year.
India achieved 54 percent growth. This appears high against the backdrop of a particularly bad year,followed by a new year showing optimism about economic growth, leading to more liberal spending.Rapidly dropping prices, bundled offers and a wide range of available models also help to boost theIndian market.
After performing sluggishly for the past few quarters, Australia’s inkjet market rebounded to growmore than 43 percent in the second quarter, thanks to strong demand for upgrades. The hypecreated by all-in-one (AIO) products helped rejuvenate interest in single-function inkjet printers withbetter quality and functionality, for example, photo printers with direct printing capability.
Another replacement market, the Singapore inkjet market, performed beyond expectations. DespiteSARS, it enjoyed 32 percent growth. Reasons contributing to strong shipment growth were abooming digital camera market, demand for photo printing, direct-connect printing, price cuts, andbundling with digital cameras, scanners and PCs. Promotions with banks, credit card companies andtelephone companies also boosted growth.
South Korea’s decline was the result of a weak economy and vendors focusing more on AIOproducts.
Copyright © 2003
Page 9
Source: Gartner Dataquest(September 2003)
Inkjet Price Band Analysis
0%
20%
40%
60%
80%
100%
1Q01 2Q01 3Q01 4Q01 1Q02 2Q02 3Q02 4Q02 1Q03 2Q03
< $50 $51-79 $80-99 $100-149 $150-199 $200-299 > $299
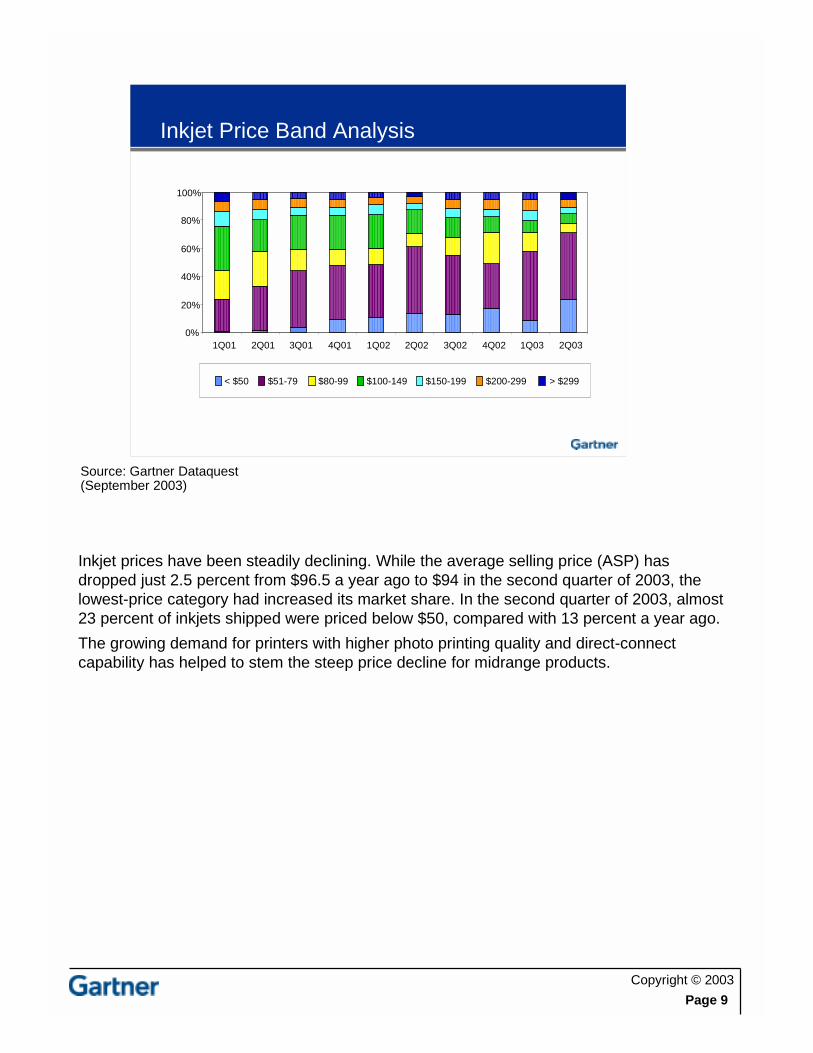
Inkjet prices have been steadily declining. While the average selling price (ASP) hasdropped just 2.5 percent from $96.5 a year ago to $94 in the second quarter of 2003, thelowest-price category had increased its market share. In the second quarter of 2003, almost23 percent of inkjets shipped were priced below $50, compared with 13 percent a year ago.
The growing demand for printers with higher photo printing quality and direct-connectcapability has helped to stem the steep price decline for midrange products.

Copyright © 2003
Page 10
Source: Gartner Dataquest(September 2003)
Inkjet Price Band Analysis: Top Vendors
0%
20%
40%
60%
80%
100%
1Q01 2Q01 3Q01 4Q01 1Q02 2Q02 3Q02 4Q02 1Q03 2Q03
< $50 $51-79 $80-99 $100-149 $150-199 $200-299 > $299
Canon
Lexmark printers had the lowest ASP at $72.90 in the second quarter of 2003. HP had thehighest ASP, $106.20.
Over time, Canon has slowly been diverting its focus from entry-level and moving up thedollar chain. Canon’s ASP increased 10 percent to $104.40. Although Canon’s unit sharedeclined from the previous quarter, its spending share increased.
it was a different story for HP and Epson. To increase shipment market share, HP has beenfocusing on its low-level models. In the second quarter, printers priced below $50 accountedfor 21 percent of its shipments, compared with only 12 percent a year ago. HP suffered a 7percent decline in ASP.
Epson’s below-$50 market share increased from 4 percent a year ago to 13 percent. Epsonsuffered a 10 percent ASP decline to $101.50.

Copyright © 2003
Page 11
Source: Gartner Dataquest(September 2003)
Inkjet Price Band Analysis: Top Vendors
0%
20%
40%
60%
80%
100%
1Q01 2Q01 3Q01 4Q01 1Q02 2Q02 3Q02 4Q02 1Q03 2Q03
Epson
< $50 $51-79 $80-99 $100-149 $150-199 $200-299 > $299
Lexmark printers had the lowest ASP at $72.90 in the second quarter of 2003. HP had thehighest ASP, $106.20.
Over time, Canon has slowly been diverting its focus from entry-level and moving up thedollar chain. Canon’s ASP increased 10 percent to $104.40. Although Canon’s unit sharedeclined from the previous quarter, its spending share increased.
it was a different story for HP and Epson. To increase shipment market share, HP has beenfocusing on its low-level models. In the second quarter, printers priced below $50 accountedfor 21 percent of its shipments, compared with only 12 percent a year ago. HP suffered a 7percent decline in ASP.
Epson’s below-$50 market share increased from 4 percent a year ago to 13 percent. Epsonsuffered a 10 percent ASP decline to $101.50.

Copyright © 2003
Page 12
Source: Gartner Dataquest(September 2003)
Inkjet Price Band Analysis: Top Vendors
0%
20%
40%
60%
80%
100%
1Q01 2Q01 3Q01 4Q01 1Q02 2Q02 3Q02 4Q02 1Q03 2Q03
HP
< $50 $51-79 $80-99 $100-149 $150-199 $200-299 > $299
Lexmark printers had the lowest ASP at $72.90 in the second quarter of 2003. HP had thehighest ASP, $106.20.
Over time, Canon has slowly been diverting its focus from entry-level and moving up thedollar chain. Canon’s ASP increased 10 percent to $104.40. Although Canon’s unit sharedeclined from the previous quarter, its spending share increased.
it was a different story for HP and Epson. To increase shipment market share, HP has beenfocusing on its low-level models. In the second quarter, printers priced below $50 accountedfor 21 percent of its shipments, compared with only 12 percent a year ago. HP suffered a 7percent decline in ASP.
Epson’s below-$50 market share increased from 4 percent a year ago to 13 percent. Epsonsuffered a 10 percent ASP decline to $101.50.

Copyright © 2003
Page 13
Source: Gartner Dataquest(September 2003)
Inkjet Price Band Analysis: Top Vendors
0%
20%
40%
60%
80%
100%
1Q01 2Q01 3Q01 4Q01 1Q02 2Q02 3Q02 4Q02 1Q03 2Q03
Lexmark
< $50 $51-79 $80-99 $100-149 $150-199 $200-299 > $299
Lexmark printers had the lowest ASP at $72.90 in the second quarter of 2003. HP had thehighest ASP, $106.20.
Over time, Canon has slowly been diverting its focus from entry-level and moving up thedollar chain. Canon’s ASP increased 10 percent to $104.40. Although Canon’s unit sharedeclined from the previous quarter, its spending share increased.
it was a different story for HP and Epson. To increase shipment market share, HP has beenfocusing on its low-level models. In the second quarter, printers priced below $50 accountedfor 21 percent of its shipments, compared with only 12 percent a year ago. HP suffered a 7percent decline in ASP.
Epson’s below-$50 market share increased from 4 percent a year ago to 13 percent. Epsonsuffered a 10 percent ASP decline to $101.50.
Copyright © 2003
Page 14
Source: Gartner Dataquest(September 2003)
Inkjet Market: Top 5 Vendors, 2Q03
0.0%
5.0%
10.0%
15.0%
20.0%
25.0%
30.0%
35.0%
Market Share
HP Canon Epson Legend Lexmark SamsungElectronics
FounderElectronics
2Q 02 1Q 03 2Q 03
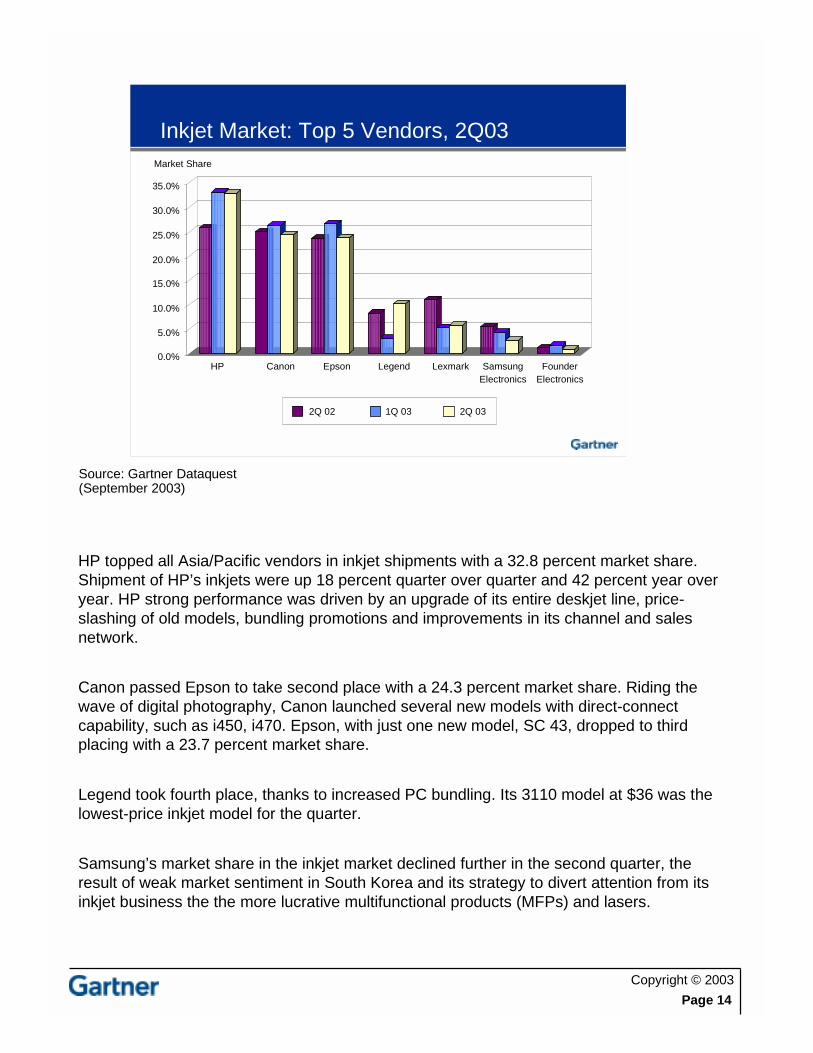
HP topped all Asia/Pacific vendors in inkjet shipments with a 32.8 percent market share.Shipment of HP’s inkjets were up 18 percent quarter over quarter and 42 percent year overyear. HP strong performance was driven by an upgrade of its entire deskjet line, price-slashing of old models, bundling promotions and improvements in its channel and salesnetwork.
Canon passed Epson to take second place with a 24.3 percent market share. Riding thewave of digital photography, Canon launched several new models with direct-connectcapability, such as i450, i470. Epson, with just one new model, SC 43, dropped to thirdplacing with a 23.7 percent market share.
Legend took fourth place, thanks to increased PC bundling. Its 3110 model at $36 was thelowest-price inkjet model for the quarter.
Samsung’s market share in the inkjet market declined further in the second quarter, theresult of weak market sentiment in South Korea and its strategy to divert attention from itsinkjet business the the more lucrative multifunctional products (MFPs) and lasers.

Copyright © 2003
Page 15
Source: Gartner Dataquest(September 2003)
Page Shipments Year-Over-Year Change,2Q03
-60%
-40%
-20%
0%
20%
40%
60%
80%
100%
Asia/P
acific
Australia
China
Hong
Kong
India
Indonesia
South
Korea
Malaysia
New
Zealand
Philippines
Singapore
Taiw
an
Thailand
Vietnam
RestofA
sia/Pacific
The page printer market maintained its growth path in the second quarter of 2003. Theoverall laser market grew 18 percent. Replacement cycle purchases from the businesssector in the mature economies of Australia, Singapore, New Zealand and Taiwan resultedin double-digit growth in these market. The page market in India grew 38 percent as a resultof the rapid penetration of laser printers into the corporate, government and educationsectors. The strong yearly growth appears especially large, coming, as it does, after aparticularly bad 2002.
The upward trend of increased capital investments in emerging Vietnam resulted in stronglaser demand of more than 80 percent.
Page demand in Hong Kong continued its downward trend because of the weak economicenvironment and the impact of SARS on business. Thailand and Indonesia sufferednegative growth as well because of fewer corporate and government projects compared withthe same period a year ago.

Copyright © 2003
Page 16
Source: Gartner Dataquest(September 2003)
Page Shipments: Mono vs. Color
-
100,000
200,000
300,000
400,000
500,000
600,000
700,000
800,000
1Q00
3Q00
1Q01
3Q01
1Q02
3Q02
1Q03
Mono Color
-20%
0%
20%
40%
60%
80%
100%
120%
1Q00
3Q00
1Q01
3Q01
1Q02
3Q02
1Q03
Mono Color
Monochrome printers continue to dominate the page market. However, they have beengradually losing market share to their color counterparts, as more vendors enter thecompetition, and prices continue to fall rapidly. Monochrome page printers grew 16 percentin the second quarter, while color grew more than 100 percent. The second quarter saw newmodels such as HP LJ 1500, Oki Data 5000 series and Canon LBP 2410.

Copyright © 2003
Page 17
Source: Gartner Dataquest(September 2003)
Asia/Pacific: Mono Page Trends
0%
10%
20%
30%
40%
50%
60%
70%
80%
90%
100%
1Q01 2Q01 3Q01 4Q01 1Q02 2Q02 3Q02 4Q02 1Q03 2Q03
91+ ppm
70-90 ppm
41-69 ppm
31-40 ppm
21-30 ppm
11-20 ppm
1-10 ppm
As vendors migrate to higher speeds, speed band market share has changed steadily. Inthe low-end segments, the market share of 1-10 pages per minute (ppm) fell from 42.1percent in the second quarter of 2002 to 30 percent in the second quarter of 2003, as entry-level speed shifted to 14-17 ppm. The market share of the 11-20 ppm segment increaseddramatically to 47 percent a year ago to 56 percent. The 21-30 ppm category saw anincrease of 10 percent to 11 percent.

Copyright © 2003
Page 18
Source: Gartner Dataquest(September 2003)
Asia/Pacific: Color Page Trends
0%
10%
20%
30%
40%
50%
60%
70%
80%
90%
100%
1Q01 2Q01 3Q01 4Q01 1Q02 2Q02 3Q02 4Q02 1Q03 2Q03
> 30 ppm
21-30 ppm
11-20 ppm
1- 10ppm
Speed here refers to color speed. Thanks to the introduction of entry-level color printers,such as HP LJ1500, Epson C900/C1900, Oki Data C5000 series and Canon LBP 2410, thelow-end segment of 1-10 ppm continues to dominate, as color printing moves into the smalloffice market. Tandem or single-pass printing continued to generate strong demand amongmidsize-to-large corporations and government agencies.
Copyright © 2003
Page 19
Source: Gartner Dataquest(September 2003)
Page Printer Market: Top 10 Vendors, 2Q03
0.0%
10.0%
20.0%
30.0%
40.0%
50.0%
60.0%
Market Share
HP
Sam
sung
Ele
ctro
nics
Lege
nd
Eps
on
Can
on
Xer
ox
Lexm
ark
Fou
nder
Ele
ctro
nics
Min
olta
-Q
MS
Sin
doric
oh
2Q 02
1Q 03
2Q 03
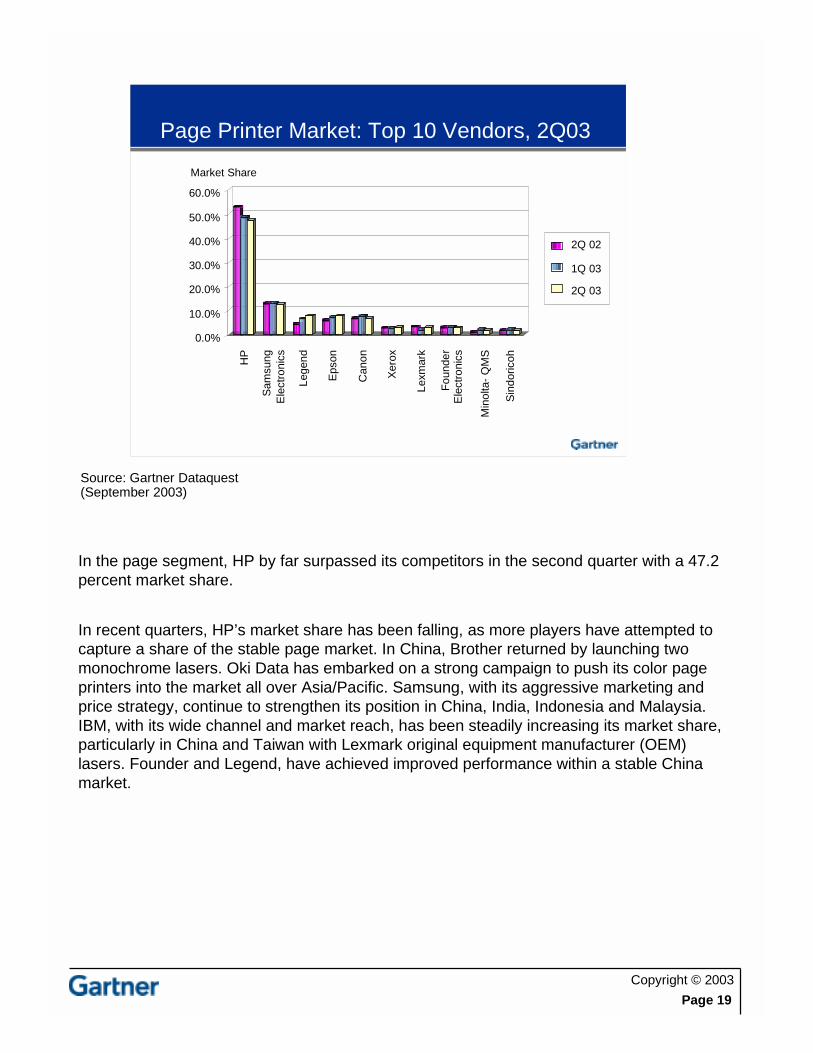
In the page segment, HP by far surpassed its competitors in the second quarter with a 47.2percent market share.
In recent quarters, HP’s market share has been falling, as more players have attempted tocapture a share of the stable page market. In China, Brother returned by launching twomonochrome lasers. Oki Data has embarked on a strong campaign to push its color pageprinters into the market all over Asia/Pacific. Samsung, with its aggressive marketing andprice strategy, continue to strengthen its position in China, India, Indonesia and Malaysia.IBM, with its wide channel and market reach, has been steadily increasing its market share,particularly in China and Taiwan with Lexmark original equipment manufacturer (OEM)lasers. Founder and Legend, have achieved improved performance within a stable Chinamarket.

Copyright © 2003
Page 20
Source: Gartner Dataquest(September 2003)
Top 10 Vendors: Color vs. Mono, 2Q03
0.0%
5.0%
10.0%
15.0%
20.0%
25.0%
30.0%
35.0%
40.0%
45.0%
50.0%
55.0%
Mar
ketS
hare
HP SamsungElectronics
Legend Epson Canon Lexmark FounderElectronics
Xerox Sindoricoh Brother
Color
Mono
0.0%
5.0%
10.0%
15.0%
20.0%
25.0%
30.0%
35.0%
40.0%
45.0%
Mar
ketS
hare
HP Epson Xerox Minolta-QMS
Lexmark Legend Oki Data SamsungElectronics
Sindoricoh Canon
2Q 02
1Q 03
2Q 03
2Q 02
1Q 03
2Q 03
In the more competitive color segment, HP gained 4 percentage points to garner a 39.3percent market share, thanks primarily to strong sales of its entry-level LJ1500. Shipment ofHP’s color laser enjoyed quarterly growth of 40 percent and a year-over-year growth of 90percent. Epson, with stiff competition from HP’s LJ1500, suffered a 17 percent drop inshipments from the previous quarter. Xerox overtook Minolta-QMS for third place, thanksprimarily to a large contract in South Korea. Minolta-QMS dropped to fourth placing becauseof weak sales in the Association of Southeast Asian Nations (ASEAN).
Smaller color players, such as Canon, Legend and Oki Data, reported growth of more than100 percent over the previous quarter.
HP continued to dominate the monochrome segment, although its dominance was erodedby stiff price competition from Samsung, Legend and Epson.
Copyright © 2003
Page 21
Source: Gartner Dataquest(September 2003)
Dot Matrix Shipments Year-Over-YearChange, 2Q03
-60%
-40%
-20%
0%
20%
40%
60%
80%
100%
Asia/P
acific
Australia
China
Hong
Kong
India
Indonesia
South
Korea
Malaysia
New
Zealand
Philippines
Singapore
Taiw
an
Thailand
Vietnam
RestofA
sia/Pacific
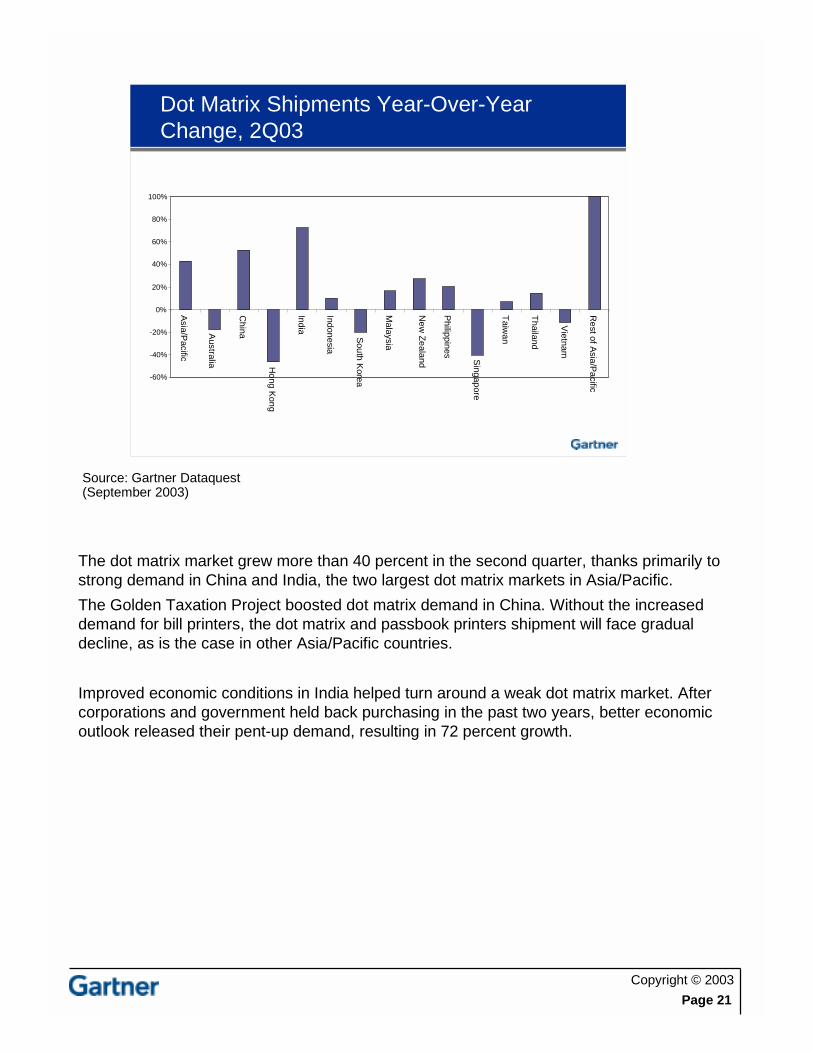
The dot matrix market grew more than 40 percent in the second quarter, thanks primarily tostrong demand in China and India, the two largest dot matrix markets in Asia/Pacific.
The Golden Taxation Project boosted dot matrix demand in China. Without the increaseddemand for bill printers, the dot matrix and passbook printers shipment will face gradualdecline, as is the case in other Asia/Pacific countries.
Improved economic conditions in India helped turn around a weak dot matrix market. Aftercorporations and government held back purchasing in the past two years, better economicoutlook released their pent-up demand, resulting in 72 percent growth.

Copyright © 2003
Page 22
Source: Gartner Dataquest(September 2003)
Dot Matrix Market: Top 10 Vendors, 2Q03
0%
10%
20%
30%
40%
50%
60%
70%
Mar
ketS
hare
Eps
on
Sta
r
Fuj
itsu
Oki
Dat
a
TV
SE
Wip
ro
Pan
ason
ic
Sta
rt
Nan
tian
Lege
nd
2Q 02
1Q 03
2Q 03
Epson continued to dominate the serial impact dot matrix (SIDM) market with increasedmarket share. Epson came next, followed by Star, Fujitsu , Oki Data and TVSE.

Copyright © 2003
Page 23
Source: Gartner Dataquest(September 2003)
Inkjet MFP/AIO Shipment Growth, 1Q03-2Q03
1Q03 2Q03
0%20%40%60%80%
100%120%140%160%180%200%
Asia/P
acific
Australia
China
Hong
Kong
India
Indonesia
South
Korea
Malaysia
New
Zealand
Philippines
Singapore
Taiw
an
Thailand
Vietnam
RestofA
sia/Pacific
Inkjet MFP shipments increased considerably across the region, but growth was moresubstantial in emerging markets such as Indonesia, Thailand and Malaysia, because thesemarket grew from a relatively small base.
In Asia/Pacific, it is still too early to judge the impact of MFPs on single-function inkjets,because much of the region has yet to reach market maturity. However, signs in the maturemarket of Singapore, Australia, New Zealand, Hong Kong and South Korea indicate anoverall slowdown in single-function inkjet sales. On the other hand, the hype created byAIOs has rejuvenated single-function inkjet printer market, by motivating many consumersto upgrade their printers.
Copyright © 2003
Page 24
Source: Gartner Dataquest(September 2003)
Inkjet MFP/AIO Market:Top 6 Vendors, 2Q03
0.0%
10.0%
20.0%
30.0%
40.0%
50.0%
60.0%
70.0%
Mar
ketS
hare
HP Samsung Canon Epson Lexmark Legend
3Q 02
1Q 03
2Q 03
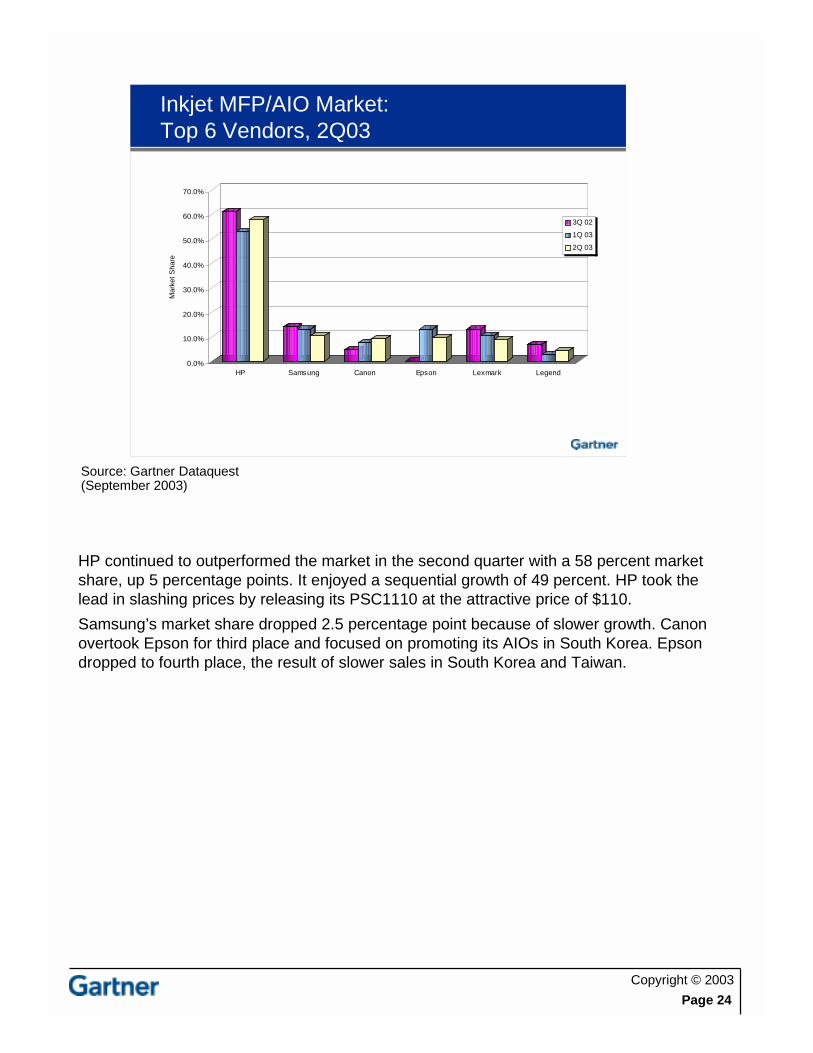
HP continued to outperformed the market in the second quarter with a 58 percent marketshare, up 5 percentage points. It enjoyed a sequential growth of 49 percent. HP took thelead in slashing prices by releasing its PSC1110 at the attractive price of $110.
Samsung’s market share dropped 2.5 percentage point because of slower growth. Canonovertook Epson for third place and focused on promoting its AIOs in South Korea. Epsondropped to fourth place, the result of slower sales in South Korea and Taiwan.

Copyright © 2003
Page 25
Source: Gartner Dataquest(September 2003)
Asia/Pacific: Printer Shipment Forecast,3Q03-2Q04
0500,000
1,000,0001,500,0002,000,0002,500,0003,000,0003,500,0004,000,0004,500,0005,000,000
1Q03 2Q03 3Q03 4Q03 1Q04 2Q04
Un
itS
hip
men
ts
Line PrinterDot MatrixPageInk Jet
0%5%
10%15%20%25%30%35%40%45%
1Q03 2Q03 3Q03 4Q03 1Q04 2Q04
Y/Y
Sh
ipm
ent
Gro
wth
Ink JetPageDot MatrixLine Printer
Gartner Dataquest forecasts printer shipments in Asia/Pacific to grow steadily from 4.2million in the second quarter of 2003 to 4.75 million by the second quarter of 2004, yearlygrowth of 13 percent.
As in past years, the second half of 2003 will be stronger than the first. We expect 4 percentgrowth over the first half of 2003.
Inkjet growth will be stable in the third quarter, but it may improve substantially in the fourthquarter, because we expect vendors to introduce new products. The People PC project inThailand is expected to boost that country’s inkjet market beginning late in the third quarter.
The page market will continue to exhibit steady double-digit growth as laser prices continueto fall, making them more affordable to the small office/home office (SOHO) market. Colorlasers will be the main growth catalyst.
After the Golden Taxation project, the dot matrix printer market will face a general decline.

Copyright © 2003
Page 26
Conclusions
� The overall Asia/Pacific printer market continuedto grow, but at a slower pace
� The dot matrix market remained significant
� AIO shipments were up considerably
� HP was the No. 1 printer vendor in shipmentsand end-user spending

Copyright © 2003
Page 27
Contacts
Lai-ling Lam [email protected]
+65 6879 2723
Ravindra Datar [email protected]
+91 22 5660 5140
Andrew Kim [email protected]
+82 2 551 1331