Embed Size (px)
Citation preview
Asian Office of Aerospace Research and Development (AOARD)
School of Business and Management Institut Teknologi Bandung
HOW DOES EMOTION INFLUENCE COLLABORATION? - AN AGENT BASED
SIMULATION OF THE DYNAMIC OF CONFRONTATION
AFOSR/AOARD (Award number FA2386-10-1-4091)
Principal Investigator:
Dr. Utomo Sarjono Putro
August, 2011
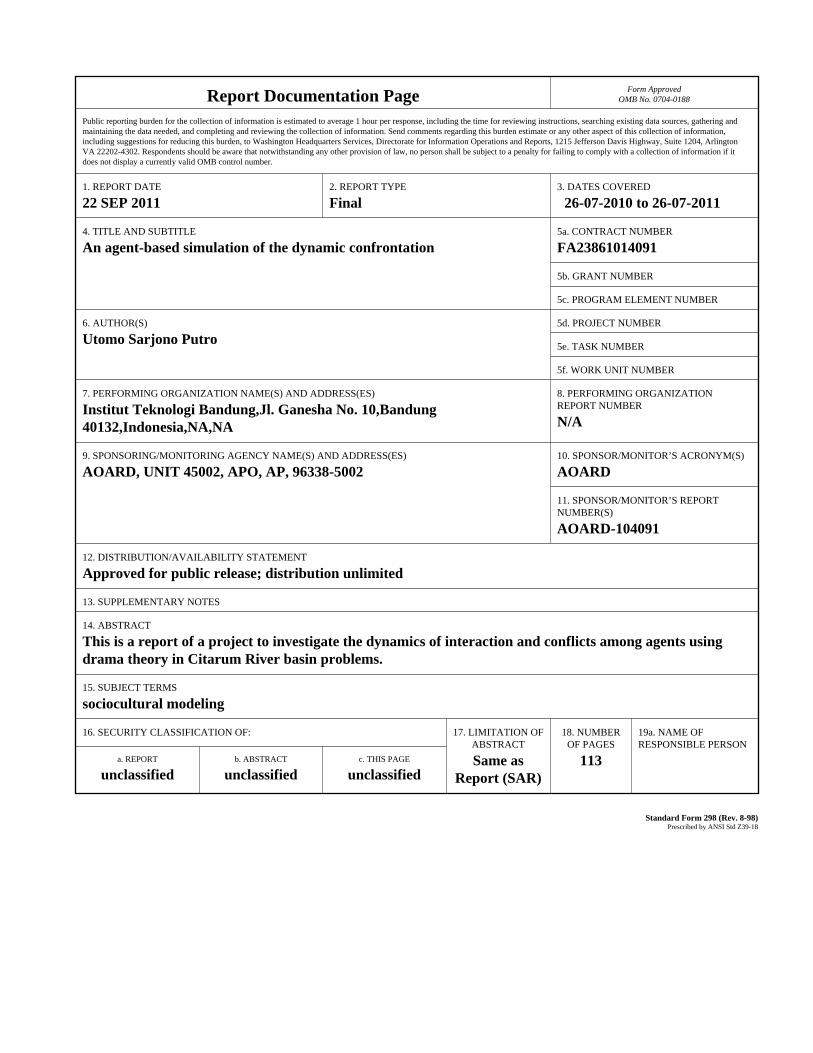
Report Documentation Page Form ApprovedOMB No. 0704-0188
Public reporting burden for the collection of information is estimated to average 1 hour per response, including the time for reviewing instructions, searching existing data sources, gathering andmaintaining the data needed, and completing and reviewing the collection of information. Send comments regarding this burden estimate or any other aspect of this collection of information,including suggestions for reducing this burden, to Washington Headquarters Services, Directorate for Information Operations and Reports, 1215 Jefferson Davis Highway, Suite 1204, ArlingtonVA 22202-4302. Respondents should be aware that notwithstanding any other provision of law, no person shall be subject to a penalty for failing to comply with a collection of information if itdoes not display a currently valid OMB control number.
1. REPORT DATE 22 SEP 2011
2. REPORT TYPE Final
3. DATES COVERED 26-07-2010 to 26-07-2011
4. TITLE AND SUBTITLE An agent-based simulation of the dynamic confrontation
5a. CONTRACT NUMBER FA23861014091
5b. GRANT NUMBER
5c. PROGRAM ELEMENT NUMBER
6. AUTHOR(S) Utomo Sarjono Putro
5d. PROJECT NUMBER
5e. TASK NUMBER
5f. WORK UNIT NUMBER
7. PERFORMING ORGANIZATION NAME(S) AND ADDRESS(ES) Institut Teknologi Bandung,Jl. Ganesha No. 10,Bandung 40132,Indonesia,NA,NA
8. PERFORMING ORGANIZATIONREPORT NUMBER N/A
9. SPONSORING/MONITORING AGENCY NAME(S) AND ADDRESS(ES) AOARD, UNIT 45002, APO, AP, 96338-5002
10. SPONSOR/MONITOR’S ACRONYM(S) AOARD
11. SPONSOR/MONITOR’S REPORT NUMBER(S) AOARD-104091
12. DISTRIBUTION/AVAILABILITY STATEMENT Approved for public release; distribution unlimited
13. SUPPLEMENTARY NOTES
14. ABSTRACT This is a report of a project to investigate the dynamics of interaction and conflicts among agents usingdrama theory in Citarum River basin problems.
15. SUBJECT TERMS sociocultural modeling
16. SECURITY CLASSIFICATION OF: 17. LIMITATION OF ABSTRACT Same as
Report (SAR)
18. NUMBEROF PAGES
113
19a. NAME OFRESPONSIBLE PERSON
a. REPORT unclassified
b. ABSTRACT unclassified
c. THIS PAGE unclassified
Standard Form 298 (Rev. 8-98) Prescribed by ANSI Std Z39-18
i
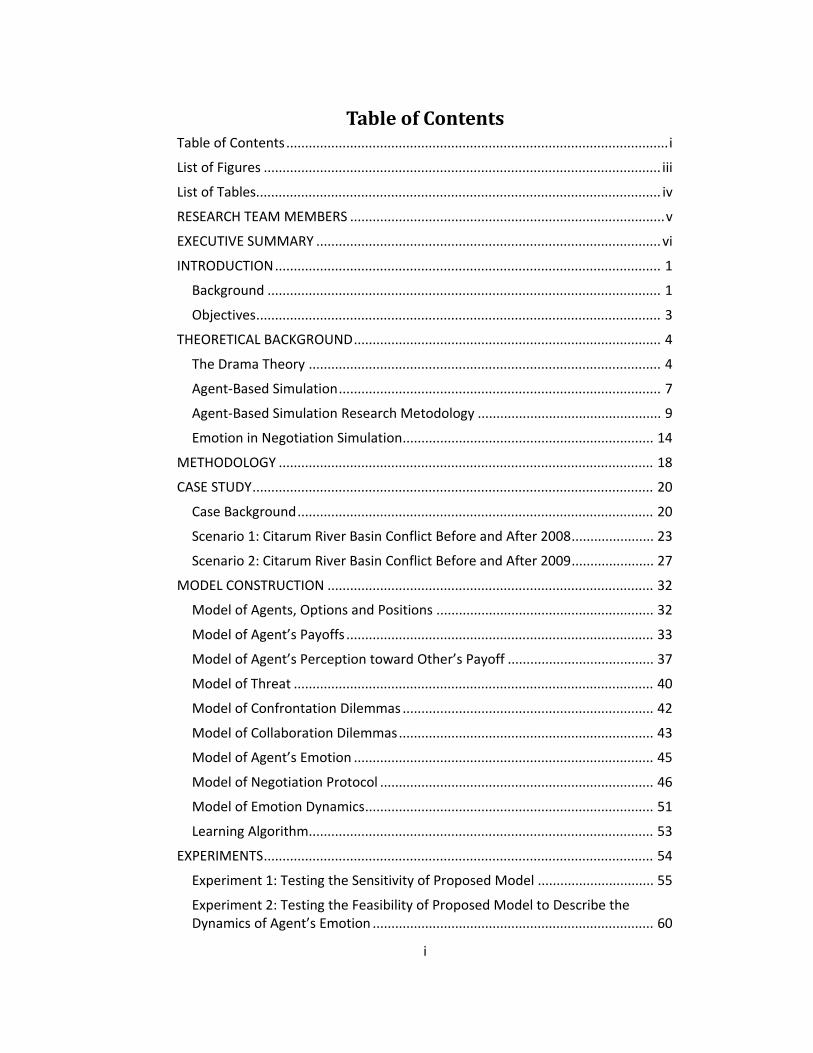
Table of Contents Table of Contents ...................................................................................................... i
List of Figures .......................................................................................................... iii
List of Tables............................................................................................................ iv
RESEARCH TEAM MEMBERS .................................................................................... v
EXECUTIVE SUMMARY ............................................................................................ vi
INTRODUCTION ....................................................................................................... 1
Background ......................................................................................................... 1
Objectives ............................................................................................................ 3
THEORETICAL BACKGROUND .................................................................................. 4
The Drama Theory .............................................................................................. 4
Agent‐Based Simulation ...................................................................................... 7
Agent‐Based Simulation Research Metodology ................................................. 9
Emotion in Negotiation Simulation ................................................................... 14
METHODOLOGY .................................................................................................... 18
CASE STUDY ........................................................................................................... 20
Case Background ............................................................................................... 20
Scenario 1: Citarum River Basin Conflict Before and After 2008 ...................... 23
Scenario 2: Citarum River Basin Conflict Before and After 2009 ...................... 27
MODEL CONSTRUCTION ....................................................................................... 32
Model of Agents, Options and Positions .......................................................... 32
Model of Agent’s Payoffs .................................................................................. 33
Model of Agent’s Perception toward Other’s Payoff ....................................... 37
Model of Threat ................................................................................................ 40
Model of Confrontation Dilemmas ................................................................... 42
Model of Collaboration Dilemmas .................................................................... 43
Model of Agent’s Emotion ................................................................................ 45
Model of Negotiation Protocol ......................................................................... 46
Model of Emotion Dynamics ............................................................................. 51
Learning Algorithm ............................................................................................ 53
EXPERIMENTS ........................................................................................................ 54
Experiment 1: Testing the Sensitivity of Proposed Model ............................... 55
Experiment 2: Testing the Feasibility of Proposed Model to Describe the Dynamics of Agent’s Emotion ........................................................................... 60
ii
Testing model’s validity in describing emotion trends in Scenario 1 ........... 61
Testing model’s validity in describing emotion trends in Scenario 2 ........... 62
Experiment 3: Testing the Feasibility of Proposed Model to Describe the Dynamics of Agent’s Positions .......................................................................... 63
Testing model’s validity in describing majority positions in Scenario 1 ....... 64
Testing model’s validity in describing majority positions in Scenario 2 ....... 65
Experiment 4: Inferring Suggestions for Real World Agents ............................ 67
CONCLUSIONS AND FURTHER RESEARCH ............................................................. 70
Conclusions ....................................................................................................... 70
Further Research ............................................................................................... 71
REFERENCES .......................................................................................................... 73
Appendix A Proceedings of International Industrial Engineering and Service Science Conference 2011 ...................................................................................... 79
Promoting Collaboration among Stakeholders in Citarum River Basin Problem ........................................................................................................................... 80
A Drama Theoretical Approach of Stakeholder Analysis of Citarum River Pollution Problem in Indonesia ......................................................................... 86
Appendix B Proceedings of the World Congress on Engineering and Technology (CET) 2011 ............................................................................................................. 92
Environmental Management Using Drama Theory .......................................... 93
How Can Agent Learn Other Agent’s Emotion in Dynamic Negotiation Process? ........................................................................................................................... 97
Rehearsing Initiatives to Facilitate Collaboration in Environmental Conflict . 101
iii
List of Figures Figure 1 Episode in drama theory ........................................................................... 5 Figure 2 Relationship between initial condition and the resulted outcome in a complex system .................................................................................................... 12 Figure 3 The simulation result of segregation model by Schelling ....................... 13 Figure 4 the simulation result of the diffusion of environmental innovations model .................................................................................................................... 14 Figure 5 Simulation result of artificial Anasazi model .......................................... 14 Figure 6 research Process Flow Chart ................................................................... 19 Figure 7 Citarum River Basin Area ........................................................................ 20 Figure 8 Time line of Citarum River Basin Common Reference Frames ............... 23 Figure 9 Illustration of implementation result of position matrix ........................ 33 Figure 10 Illustration of implementation result of acc‐payoff and rej‐payoff matrices ................................................................................................................. 36 Figure 11 Illustration of implementation result of Vpo‐matrix ............................ 37 Figure 12 Illustration of per‐acc‐payoff‐1 and per‐acc‐payoff‐2 .......................... 39 Figure 13 Illustration of per‐acc‐payoff‐1 and per‐acc‐payoff‐2 .......................... 40 Figure 14 Illustration of acc‐payoff and rej‐payoff matrices ................................ 41 Figure 15 Illustration of Vpt‐vector ....................................................................... 41 Figure 16 Implementation result of confrontation dilemma calculation ............. 43 Figure 17 Agent 1’s estimation toward agent 2’s payoff ...................................... 44 Figure 18 Agent 2’s estimation toward agent 1’s payoff ...................................... 44 Figure 19 Trust dilemma implementation in NetLogo .......................................... 45 Figure 20 Agent’s emotional state calculation ..................................................... 46 Figure 21 Agent’s acc‐payoff and rej‐payoff ......................................................... 48 Figure 22 Agent 1’s estimation toward agent 2’s payoff ...................................... 48 Figure 23 Agent 2’s estimation toward agent 1’s payoff ...................................... 49 Figure 24 Pleasure, arousal and dominance dimension of each agent ................ 49 Figure 25 Agent 1’s payoff matrices after giving option to agent 2 ..................... 49 Figure 26 Agent 1’s new estimation toward agent 2’s payoff .............................. 50 Figure 27 Agent 2’s payoff matrices after receiving option from agent 1 ........... 50 Figure 28 Agent 2’s new estimation toward agent 1’s payoff .............................. 50 Figure 29 Agent 1’s emotion matrices after giving offer to agent 2 .................... 53 Figure 30 Agent’s emotion trends output in Scenario 1 ....................................... 61 Figure 31 Agent’s emotion trends output in Scenario 2 ....................................... 62 Figure 32 Majority of agents position in Scenario 1 based on simulation output 64 Figure 33 Majority of agents position in Scenario 2 based on simulation output 66 Figure 34 The simulation result that produce desired resolution in Citarum River Basin conflict ......................................................................................................... 68 Figure 35 Simulation result that produce undesired resolution when agent’s emotions are positive ........................................................................................... 69 Figure 36 Simulation result that produce undesired resolution .......................... 69
iv
List of Tables
Table 1 Basic Variety of Emotion and Sample of Emotions in PAD Scale ............. 17 Table 2 Common Reference Frame of Citarum River Basin Conflict Before 2008 25 Table 3 Common Reference Frame of Citarum River Basin Conflict After 2008 .. 27 Table 4 Common Reference Frame of Citarum River Basin Conflict Before 2009 29 Table 5 Common Reference Frame of Citarum River Basin Conflict After 2009 .. 31 Table 6 Illustration of common reference frame model ...................................... 33 Table 7 Illustration of the Vpo‐matrix ................................................................... 36 Table 8 Illustration of Vpo matrix and Vpt vector used to calculate confrontation dilemmas ............................................................................................................... 42 Table 9 Agent’s positions ...................................................................................... 44 Table 10 Transformation from emotional disposition into PAD dimensions ....... 52 Table 11 Simulation outputs from both test groups in Scenario 1 ....................... 55 Table 12 the test result for normality of group 1 outputs in Scenario 1 .............. 56 Table 13 the test result for normality of group 2 outputs in Scenario 1 .............. 56 Table 14 The independent sample T test result of Scenario 1 ............................. 57 Table 15 Simulation outputs from both test groups in Scenario 2 ....................... 58 Table 16 the test result for normality of group 1 outputs in Scenario 2 .............. 58 Table 17 the test result for normality of group 2 outputs in Scenario 2 .............. 58 Table 18 The independent sample T test result of Scenario 2 ............................. 59 Table 19 Agent’s emotion trends in Scenario 1 .................................................... 61 Table 20 Agent’s emotion trends in Scenario 2 .................................................... 62 Table 21 the majority of positions after 2008 ...................................................... 64 Table 22 the majority of positions after 2009 ...................................................... 65
v
RESEARCH TEAM MEMBERS
Principal Investigator : Dr. Ir. Utomo Sarjono Putro M.Eng (School of Business and Management, Institut Teknologi Bandung)
Researcher : 1. Dr. Pri Hermawan S.T, M.T (School of Business and Management, Institut Teknologi Bandung)
2. Dr. Yos Sunitiyoso S.T, M.Eng (School of Business and Management, Institut Teknologi Bandung)
Junior Researcher : Dhanan Sarwo Utomo S.Si, MSM (School of Business and Management, Institut Teknologi Bandung)
Field Reearcher : 1. Anita Silvianita S.E, MSM (School of Business and Management, Institut Teknologi Bandung)
2. Farah Alfanur S.Si, MSM (School of Business and Management, Institut Teknologi Bandung)
3. Dini Turipanam Alamanda S.Tp, MSM (School of Business and Management, Institut Teknologi Bandung)
4. Eka Yuliana S.E, MSM (School of Business and Management, Institut Teknologi Bandung)
Practitioner : Ir. Supardiyono Sobirin (DPLKTS Bandung)
vi
EXECUTIVE SUMMARY
This research aims to investigate the dynamics of interaction and conflicts among agents using drama theory in Citarum river basin problems. Citarum River basin is a region in Java Island, Indonesia, with 6,080 km2 area crossing two provinces, i.e., West Java, and Jakarta. Citarum River is one of the strategic rivers in Indonesia. Almost everyone along Citarum River utilize its water to support their life; e.g. for drinking water, industry, agriculture, power generation, flood control and recreation object. In the past Citarum River can perform these functions well, but those conditions have completely change. There are several causes of this change. First is the population explosion that led to an increase in illegal lodging and deforestation in the upper stream region. Second is household waste disposal into the river. Along the Citarum River there are ± 8 million residents who approximately dispose 200 tons of household wastes per month into Citarum River. Third is the industrial waste disposal into the river. In the Citarum river basin there are approximately 1000 industries that use surface water, as well as producing industrial waste. Many of industries do not perform waste treatment before throwing them away into Citarum River. As a result, floods always occur during the rainy season due to sedimentation at Citarum river downstream region, and the increasing number of barren land. The flood and the dirty river water have also caused many kinds of diseases suffered by the community along the Citarum River.
There are hundreds of agents involved in the conflict in the Citarum River Basin. These agents consist of central government agencies, provincial government agencies, city agencies / counties and villages, state‐owned enterprises, NGOs at the regional level and NGOs at local level. There are many programs and proposals that have been produced through the repeated interactions and negotiations among these agents such as Citarum Bergetar program in 2001 and Integrated Water Resources Management (IWRM) program in 2008. However, since each agent has different interests, these programs and proposals cannot produce a significant impact on the improvement of Citarum River Basin conditions. Besides that, agent’s emotion and learning also play important role in the interactions among agents, and affect the resolution of the conflict.
To accomplish the research’s aim, an agent‐based model of confrontation based on drama theory, combined with emotional‐state model (PAD) and learning models was constructed. The proposed model is able to describe negotiation process as repeated interactions among agents, in which the possible conflict resolutions are truly affected by agent’s emotion and learning process. During the conflict phase the model is able to describe two types of dilemma of conflict i.e. persuasion and rejection dilemma. After the conflict has resolved, the model is able to describe the emergence of the dilemma of collaboration i.e. trust dilemma, among the agents.
vii
In order to obtained necessary inputs for the constructed model, field observations and focus group discussions with stake holders in Citarum river basin conflict were conducted. Stakeholders involved in this process come from government, NGOs, community members, public enterprises, and business. Through this process description of the current condition of Citarum river basin conflict is obtained. Based on the obtained data the chronological history of Citarum river basin conflict can be captured.
In order to test model’s robustness toward the dynamics of common reference frame and the emergence of new options the conflict’s chronological history is divided into two different milestones (resulting two scenarios). By considering the completeness of the data, the first milestone is set at 2008 and the second milestone is set at 2009. Each scenario consists of two common reference frames; i.e., the common reference frame before the milestone and the common reference frame after the milestone. For instance, the first scenario consists of common reference frame before 2008 and common reference frame after 2008. By using the two common reference frames in each scenario, agent’s efforts to reduce the dilemmas can be identified. In addition, changes of agent's emotion toward the other agents can also be obtained.
Experiments are then conducted to test the model sensitivity, validity, feasibility, and to infer recommendations for agents in the real world. The meaning of feasible in this study is that the proposed models can be used to assist agents in the real world in facing conflict situation. Feasible and valid have overlapping meanings. Generally, valid means something that can be accepted as legitimately and logically (WrodNet Search 3.1; Wikitionary.org) while; feasible means something that is capable of being done with means at hand and circumstances as they are (WrodNet Search 3.1; Wikitionary.org). Not all valid solutions /answers are feasible to be used. But all answers/solutions that are produced by something that is feasible must able to satisfy all constraint (valid answer) (Wikipedia.org). With this understanding, the proposed model will be considered as feasible to be used if the model can produce valid solutions in all cases tested in the experiment.
The first experiment aims to test model’s sensitivity. The number of iterations required to eliminate confrontation dilemmas and the amount of trust dilemma that appears become the main parameters to test the sensitivity of the model. The sensitivity analyses of the proposed model shows that the number of iterations required to eliminate the confrontation dilemmas and the number of trust dilemma that arise are significantly lower if all agents have positive emotions towards other agents. The sensitivity analysis also concludes that the model is robust to the initial common reference frame so that the result will be consistent even if the model is used for other conflict situation.
The second experiment and the third experiment aim to test model’s validity and feasibility. The validity analysis results show that the proposed model is valid to
viii
describe the trend of agent’s emotion and the majority of agent’s position that may appear during the conflict. The validity analysis results also show that the proposed model is robust against initial common reference frame. This means that the model will also valid to describe the trend of agent’s emotion and the majority of agent’s position that may appear in other conflict situation. Since the model validity applies generally, the model can be considered as feasible to help real world agents to anticipate the dynamics of agent’s emotion trends and the majority of agent’s positions that may occur in the real world.
By doing experiments with the proposed model it can be concluded that in order to achieve resolution that can help to improve the condition of the Citarum River it is suggested that the agents in the real world should use positive emotions in negotiation with other agents. Moreover, the use of positive emotions accelerates the achievement of conflict resolution, and reduces the possibility of the emergence of trust dilemma.
1
INTRODUCTION
Background
A conflict, from mere difference of opinion to deadly confrontations, is inevitable in human life (Obeidi, Kilgour, & Hipel, 2009). Different from natural phenomena, social phenomena involve human, organization, country, and company which may behave according their own interests. Social phenomena involve interactive situation, in which many parties are related and interdependent. In such situation, result gained by a person will depend on action from other persons. Therefore, human interaction always involves conflict and collaboration. The conflict occurs due to the different interests owned by each person while the collaboration is needed to achieve a desired outcome in the best way possible for all parties. As an effort to resolve conflict, negotiation becomes a very common process in everyday life. This is why the negotiation process studied in various scientific fields such as economy, political science, psychology, organizational behavior, decision sciences, operations research and mathematics (Sycara & Dai, 2010).
In general, researches from social sciences fields related to the negotiations process aim to understand the factors involved in a negotiation (descriptive) (Martinovski, 2010; Koeszegi & Vetschera, 2010; Albin & Druckman, 2010) while, research from economics and mathematics fields aim to formalize the negotiation process so that the negotiations can be achieve optimal results (prescriptive). In general, most models that have been produced are oversimplified versions of reality (Sycara & Dai, 2010). They generally make the assumptions that the negotiation process is well structured where the negotiation actions occur and result in agreement or opting out of the negotiation. In addition, almost all of current research considers negotiation or conflict as a onetime event (Sycara & Dai, 2010).
However, the conflict situations in the real world are generally more complex than the assumptions used in current studies. Negotiation in the real world (except in its most simple form) has the followings characteristics i.e.:
a) Decentralized (Sycara & Dai, 2010), parties in a negotiation cans have different frames and strategy in seeking resolution of conflict.
b) Involve communication among parties (Sycara & Dai, 2010). Decisions of negotiators are interlinked through communication processes that involve many different levels (Koeszegi & Vetschera, 2010).
c) Involve incomplete information (Sycara & Dai, 2010), for example, a party cannot know for certain the utilities from the other parties.
d) In many cases, negotiation process in the real world involves repeated interaction with no well‐structured sequences (Sycara & Dai, 2010).
e) Negotiation process involves emotions of each party. Emotion is an important device in structuring goals, values and preferences
2
(Martinovski, 2010) and affects communication (Koeszegi & Vetschera, 2010) in a negotiation.
Through the above review, gaps between current research on conflict and negotiation and the situation in the real world can be identified. To overcome the existing gaps, an approach that is able to describe the negotiations as a decentralized process, involving incomplete information and communication processes that occur iteratively and involving emotions is needed. Computer simulation is one of the alternative approaches to fill the gap that currently occurs. There are several natures of a computer simulation that can help researchers to model a negotiation process, namely:
a) The nature of programming language that is more expressive than verbal language and less abstract than mathematical equation (Srbljinović & Škunca, 2003), enable researcher to model both quantitative and qualitative theories (Gilbert & Terna, 2000).
b) Using computer simulation it is easier to model decentralized processes that involve bounded rational agents (Srbljinović & Škunca, 2003).
c) Within a computer simulation there are no difficulties to model repeated interaction with no well‐structured sequences.
This study aims to construct an agent‐based simulation of the dynamics of negotiation based on drama theory frame‐work. Agents in the constructed simulation are equipped with emotions and ability to learn. The agent‐based simulation is chosen because it can minimize the number of simplifications used by its ability to fully represents individuals and model bounded rational behavior while, drama theory is chosen because, it proposes an episodic model whereby situations unfold. By constructing an agent‐based simulation to model conflict and collaboration it is expected that the possible evolution of the conflict can be observed and suggestions to agents in the real world in order to achieve the desired futures can be proposed.
This research is a further development of a series of studies that have been carried out since 2007. In 2007, an agent‐based simulation model of the negotiation process based on drama theory framework has been constructed (Putro, Siallagan, & Novani, 2007). The model that has been constructed integrates PAD emotional model into negotiation protocol among agents. This model was able to describe the dynamics confrontation dilemmas due to the variations agent’s emotion during the negotiation process. In 2008, this model was developed by integrating trust dilemma using norm game mechanism (Putro U. , Siallagan, Novani, & Utomo, 2008). The model was further developed in 2009 by integrating learning mechanisms (Putro, Hermawan, Siallagan, Novani, & Utomo, 2010). The focus of current research is to enhance the existing model so that it can describe the dynamics of confrontation dilemmas (rejection and persuasion) and collaboration dilemmas (trust) without involving the norm game
3
mechanism. The second focus in this research is to study the feasibility of the constructed model in representing the dynamics of conflict in the real world.
Objectives
In this study, there are several objectives to be achieved, namely:
1. To investigate the dynamics of interaction and conflicts among agents using drama theory in Citarum river basin problems.
2. To develop agent‐based simulation model of the dynamic of confrontation based on interaction among autonomous agents, who have different interests and act based on their emotion. The drama theory will be used as a framework of the negotiation process.
3. To develop agent’s learning procedure in order to accommodate their learning processes under dynamic situation and the changes of their emotion based on previous experience.
4. To study the feasibility of simulation results based on qualitative research in Citarum river basin conflict.
5. To obtain suggestions for encouraging greater collaboration in Citarum River Basin
To meet these objectives there are several research questions that need to be answered in this research, i.e;
1. How is the development of conflict situations in the Citarum River Basin? 2. How to model negotiation process among autonomous agents who have
emotional state in Citarum river basin conflict? 3. How to combine emotional model and learning algorithm into
negotiation process in Citarum river basin conflict? 4. What kinds of suggestions (e.g. behavior or policy implication) that can be
inferred from the simulation results? 5. How is the feasibility of simulation results compare to the qualitative
study result in Citarum river basin conflict?
4
THEORETICAL BACKGROUND
This chapter discusses the theoretical foundations relating to the construction of the model in this study. The discussion in this chapter is divided into three sections, first section discusses the drama theory, the second section discusses the agent‐based simulation and the third section discusses the emotions in negotiations. The first section discusses the definition and the understanding of drama theory, the drama theory perspective on the dynamics of a conflict and why drama theory is considered suitable as a foundation of the proposed model in this study. The second section discusses the understanding of agent‐based simulation, the elements of agent‐based simulation and why agent‐based simulation model is suitable to construct a model of conflict. The third section discusses the role of emotions in a negotiation of conflict, the PAD emotion model and why this model is considered suitable to be used in this research.
The Drama Theory
Drama theory was proposed (Howard, Bennett, Bryant, & Bradley, 1992) and developed as a generalization of game theory (Howard, Drama theory and its relation to game theory. Part 1: Dramatic resolution vs rational solution, 1994; Howard, Drama theory and its relation to game theory Part 2: Formal Model of the Resolution Process, 1994).
In any collaboration each involving agent will demand a solution that suits them: these solutions may be compatible (the situation in which collaboration is achieved) or they may not (the situation in which conflicts emerges). In the latter case, drama theory is able to anticipate the specific pressures – in the form of dilemmas – felt by each agent, and to describe how these pressures might be changed. To identify dilemmas that may occur, drama theory posits that each autonomous agent in a situation proposes a particular solution (called as ‘position’) in terms of what it and others should do. It presses for this outcome by indicating the unilateral action (its ‘fallback’) that it will take if the proposed solution is not agreed. The so‐called ‘threatened future’ is the outcome that will occur if each agent carries out their fallback actions.
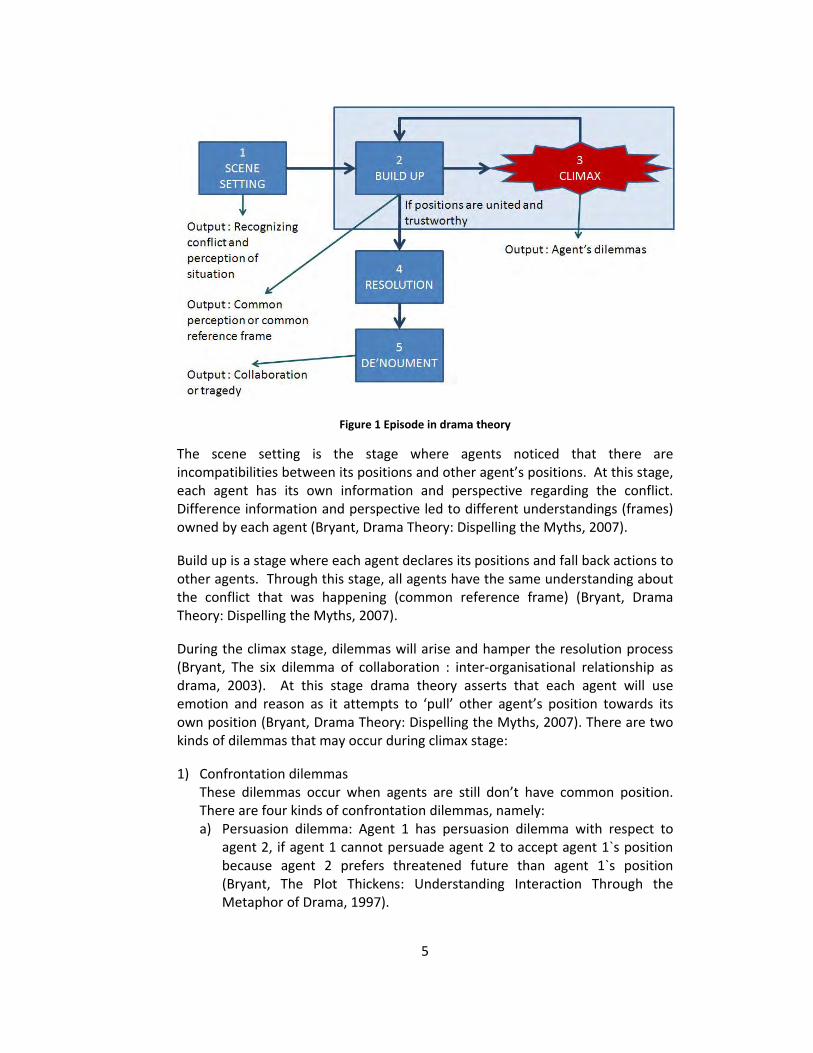
According to drama theory perspective, the dynamics in a conflict can be analogized as episodes of a drama that is illustrated described in Figure 1.
5
Figure 1 Episode in drama theory
The scene setting is the stage where agents noticed that there are incompatibilities between its positions and other agent’s positions. At this stage, each agent has its own information and perspective regarding the conflict. Difference information and perspective led to different understandings (frames) owned by each agent (Bryant, Drama Theory: Dispelling the Myths, 2007).
Build up is a stage where each agent declares its positions and fall back actions to other agents. Through this stage, all agents have the same understanding about the conflict that was happening (common reference frame) (Bryant, Drama Theory: Dispelling the Myths, 2007).
During the climax stage, dilemmas will arise and hamper the resolution process (Bryant, The six dilemma of collaboration : inter‐organisational relationship as drama, 2003). At this stage drama theory asserts that each agent will use emotion and reason as it attempts to ‘pull’ other agent’s position towards its own position (Bryant, Drama Theory: Dispelling the Myths, 2007). There are two kinds of dilemmas that may occur during climax stage:
1) Confrontation dilemmas These dilemmas occur when agents are still don’t have common position. There are four kinds of confrontation dilemmas, namely: a) Persuasion dilemma: Agent 1 has persuasion dilemma with respect to
agent 2, if agent 1 cannot persuade agent 2 to accept agent 1`s position because agent 2 prefers threatened future than agent 1`s position (Bryant, The Plot Thickens: Understanding Interaction Through the Metaphor of Drama, 1997).
6
b) Rejection dilemma: Agent 1 has rejection dilemma with respect to agent 2, if agent 1`s rejection of agent 2’s position is not credible according to agent 2, because agent 2 knows that agent 1 prefers agent 2’s position than the threat (Bryant, The Plot Thickens: Understanding Interaction Through the Metaphor of Drama, 1997).
c) Threat dilemma: Agent 1 has threat dilemma with respect to agent 2, if agent 1`s threat is not credible according to agent 2, because agent 2 knows that agent 1 prefers another scenario than the threat (Bryant, The Plot Thickens: Understanding Interaction Through the Metaphor of Drama, 1997).
d) Positioning dilemma: Agent 1 has positioning dilemma with respect to agent 2, if party 1 cannot persuade agent 2 to accept its position because it prefers agent 2’s position than agent own position (Bryant, The Plot Thickens: Understanding Interaction Through the Metaphor of Drama, 1997).
2) Collaboration Dilemmas If the confrontation dilemmas are successfully eliminated, then agents will have a common position but, they could still face collaboration dilemmas, i.e. there are still possibilities for agents to not to trust one another commitments over the common position. There are two kinds of collaboration dilemmas, namely: a) Cooperation dilemma: Agent 1 has cooperation dilemma with respect to
agent 2, if agent 1 has incentives not to commit with the common position, because another scenario is better than the common position (Bryant, The Plot Thickens: Understanding Interaction Through the Metaphor of Drama, 1997).
b) Trust dilemma: Agent 1 has trust dilemma with respect to agent 2, if agent 1 cannot believe that agent 2 will commit with the common position, because agent 1 knows that there is another scenario preferred by agent 2 than the common position (Bryant, The Plot Thickens: Understanding Interaction Through the Metaphor of Drama, 1997).
At the resolution stage there are two possible conditions that can be faced by the agents. The first condition is called a crisis, in which agents publicly undertake to carry out their fall back actions. The second condition is called commitment, in which agents publicly undertake to carry out their shared agreement (Bryant, Drama Theory: Dispelling the Myths, 2007).
At the stage De'noument agents implement the resolutions obtained in the resolution stage. At this stage there are two conditions that may occur. The first condition is called a conflict, in which agents implement committed fall back actions or decide to flunk their fall back actions. The second condition is called a cooperation, in which agents implement agreed actions or decide to cheat (Bryant, Drama Theory: Dispelling the Myths, 2007).
7
From the discussion in this section it can be concluded that drama theory generally aims to understand how a situation unfold under the internal pressures that brought by agents. It primarily focuses on dilemma or paradox arising from rational goal seeking behavior. As a development from game theory, drama theory (Howard, Bennett, Bryant, & Bradley, 1992; Bryant, Using drama theory: concepts and cases, 1997) reflects an increasing interest in how a conflict might change, rather than just the analysis of fixed games. Different from Game Theory, Drama Theory focuses on how the conflict that happens during pre‐play game may change due to agent’s efforts to eliminate dilemmas using positive or negative emotions therefore, Drama theory can explain how an irrational behavior arises. With these reasons, drama theory is considered to be suitable to model the dynamics of conflict that involves emotion and learning.
AgentBased Simulation
Generally, the term to simulate can be defined to imitate a process by another process (Hartmann, 1996). Therefore, simulation can be defined as driving a model of a system with suitable inputs and observing the corresponding outputs (Axelrod R. , 2003). What is an agent based simulation? An Agent based simulation can be defined as a simulation of a system that consists of a number of software individuals, called agents. In this simulation, agents can interact with each other and with their environment (Gilbert N. , 2004; Smith & Conrey, 2007). In agent based model, an agent can have one to one relationship with an actor in the real world while, interactions among agents can likewise correspond to the interactions between real world actors (Gilbert N. , 2004).
In agent based simulation, agents are programmed to have the following characteristics:
a) Discrete: An agent is self contained individual with identifiable boundaries (Smith & Conrey, 2007).
b) Interdependent:Agents live in an environment that is inhabited other agents (Smith & Conrey, 2007). The behavior of an agent will change some aspect of the inveronment which in turn affect the behavior of other agents (Macy & Willer, 2002).
c) Active: Each agent have their own rules and strategies to interact with anoher agents and the environment (Jennings, Faratin, Johnson, Norman, O'Brien, & Wiegand, 1996; Epstein J. M., 1999; Smith & Conrey, 2007).
d) Limited information: Each agents have only limited information. They are only able to gaher informations from their local environment (for example: neighboring agents) (Epstein J. M., 1999; Smith & Conrey, 2007).
e) Autonomous: An agent has its own internal goals and is self directed in choosing behaviors to pursue those goals (Jennings, Faratin, Johnson, Norman, O'Brien, & Wiegand, 1996; Epstein J. M., 1999; Macy & Willer, 2002; Smith & Conrey, 2007).
8
f) Agent follow simple rule: Agents are assumed to gather information and generate behaviors by relatively simple rules (Macy & Willer, 2002; Smith & Conrey, 2007).
g) Adaptation: Some models assume that agent can modify their rules based on agent’s experience (Jennings, Faratin, Johnson, Norman, O'Brien, & Wiegand, 1996; Macy & Willer, 2002; Smith & Conrey, 2007).
The first advantage of agent based simulation lays on its communicative ability. Basically, any researcher who tries to make a projection or imagining a social dynamics is running a model (Epstein J. M., 2008). The most important thing for a researcher is, whether he/she is able to make an explicit model or not (Epstein J. M., 2008). Before simulations method become famous, there are two general ways to specify a model namely, verbal representation and mathematical equation. The difficulty with verbal representation is that is it hard for the researcher and the reader to determine precisely the implication of the ideas being put forward (Gilbert & Terna, How to Build and Use Agent‐based Models in Social Science, 2000). Mathematical equations can communicate a model with much more precision than the verbal representation. But, this kind of representation also has weakness. Many of the mathematical equations are too complicated to be analytically tractable (Gilbert & Terna, How to Build and Use Agent‐based Models in Social Science, 2000). The common solution is to make simplifications (for example, by ignoring the heterogeneity of the actual population an only looking for the mean behavior) until the equations become solvable (Gilbert & Terna, How to Build and Use Agent‐based Models in Social Science, 2000; Axtell R. L., 2003). Unfortunately, sometimes these assumptions are implausible and can make the resulted theories seriously misleading (Gilbert & Terna, How to Build and Use Agent‐based Models in Social Science, 2000). These problems also occur in conflict and negotiation researches (Sycara & Dai, 2010).
Agent based simulation can minimize the number of simplifications used by its ability to fully represents individuals (Axtell R. L., 2003) and model bounded rational behavior (Axelrod R. , 2003). Besides, there is no difficulty to represent non linear interaction within a computer simulation (Gilbert & Terna, How to Build and Use Agent‐based Models in Social Science, 2000). In short, agent based simulation can offer alternative solution when mathematical equation is intractable (Axelrod R. , 2005).
Many social phenomena require multidisciplinary study (Epstein J. M., 1999; Axelrod R. , 2005). The nature of programming language that is more expressive than verbal language and less abstract than mathematical equation (Srbljinović & Škunca, 2003), enable researcher to model both quantitative and qualitative theories (Gilbert & Terna, How to Build and Use Agent‐based Models in Social Science, 2000).Therefore, agent based simulation can facilitate the collaboration among disciplines (Axelrod R. , 2005).
9
Another advantage of agent based simulation is that it places much lower demands on data. It is very difficult to acquire appropriate data to understand the dynamics within the society (Gilbert, 2004). Qualitative data from interviews, records and observations can describe effectively the emergence institution from individual actions. But, due the nature of the data most analysis inevitably remains somewhat impressionistic (Gilbert N. , 2004; Johnson & Onwuegbuzie, 2004; Johnson & Christensen, 2007). Studies based on quantitative data can provide more precision (Gilbert N. , 2004; Johnson & Onwuegbuzie, 2004). But, most survey data treats peoples as isolated atom and pay little attention to the interactions among people (Gilbert N. , 2004). Another weakness of survey method is that they come from measurements made at one moment of time (Gilbert N. , 2004). This way, individual changes and effect of these changes are invisible for the analysis (Gilbert N. , 2004; Zawawi, 2007).
Agents based approach start with the deductive perspective by constructing simulation correspond to one’s theory about society (Gilbert N. , 2004). In constructing a simulation, input data can be calibrated from whatever data is available and then used to derive testable propositions and relationships (Gilbert N. , 2004). Data generated by the simulation runs then summarized, so it can be tested against the real data (inductive part of agent based approach) (Carley, 1999; Gilbert N. , 2004). This way, agent based simulation approach places much lower demands on the data while, the models can truly reflect the complex nature of the society (Epstein J. M., 1999; Gilbert N. , 2004).
Of course agent based model approach also has weaknesses. Most agent based model and the theory on which they are based, are stochastic (they are based in part on random chance) (Carley, 1999; Gilbert N. , 2004). Its means that it will be difficult to determine whether, the observed pattern is the general pattern or just anomalies.
Besides, many different agent‐based models can show the same emergence pattern. Therefore, similarity between the pattern in the real world and one that emerges from the model is not sufficient to conclude that, mechanism used in the model is the same mechanism that applies in the real world (Gilbert N. , 2004).
By considering the benefits and advantages of agent‐based simulation that are described in this section, this approach is considered to be appropriate to build a model of conflict that involves emotion and learning.
AgentBased Simulation Research Metodology
Until now, there is no standard methodology to create an agent based simulation (Gilbert, 2004). But, there are several steps that usually carried out to create a good agent based simulation. The first step is to identify the target system clearly. A target system is a real phenomenon that wants to be understood
10
better (Gilbert N. , Agent‐Based Models, 2008). It is important to refine the general research topic into specific research objectives (Gilbert N. , 2004). After the research objectives are defined, the body of theory regarding the target system must be gathered. Theory about the dynamics and process about social phenomena are better than static or equilibrium relationship (Gilbert N. , 2004). By the way any theories are better than none (Gilbert N. , 2004). Finally, the scope of the model must be defined. In this process, all assumptions in the model should be specified very clearly. Simulation usually begins from a simple model that is easy to implement (Gilbert N. , 2004).
In the second step, the simulation design is started. In this step, first all types of objects in the simulation are defined (Gilbert N. , 2004). Usually, there will be two type of objects in the simulation namely; a) agents and b) environment. If, one object consists of several sub‐objects, these objects should be arranged into a hierarchical class (Gilbert N. , 2004). After that, attributes for all objects are specified. An attributes is a characteristic or feature of an objects (Gilbert N. , 2004; Gilbert N. , Agent‐Based Models, 2008). An attribute can serve as object’s identity or, varies over time (Gilbert N. , 2004).
The third step is to design interactions among objects. First, all possible actions that can be carried out by each object are listed (Gilbert, 2004). After that, rules that are used by an object to execute each action need to be specified. The simplest technique to design object rules is the production system. In the production system technique, an object should be equipped with (Gilbert & Terna, 2000; Gilbert, 2008):
1. A set of rules of behavior: Rules that determine what the object will do. One or more rules from the set can be selected depending on the current state of the object.
2. A working memory: Variables that store object’s current state. 3. A rule interpreter: A programming code that uses working memory to
select which action should be activated. 4. An input process: A programming code that collects messages and
perception from the environment and stores them in the working memory.
5. An output process: A programming code that transmit messages to the environment.
After all possible actions are specified, we should also consider when each action happened. In most models, the simulations run using discrete time steps. There are three issues that need to be considered when designing agent based simulation using discrete time step (Gilbert N. , Agent‐Based Models, 2008):
1) Synchronicity: the arrangements of action sequence. With an ordinary computer agents cannot engage in action simultaneously therefore, the
11
simulation output will determine by the sequence of agents action. There are three types of synchronicity technique: a) Sequential asynchronous execution: Invoke each agent in sequential
order. For example: agent 1, agent 2, agent 3, agent 4, then repeated again to agent 1, agent 2 and so on.
b) Random asynchronous execution: Invoke each agent in different random order at each time step.
c) Simulated synchronous execution: Invoke each agent in any convenient order but buffer all interactions with the agents’ environment so that all inputs to agents are completed before all outputs.
2) Event driven simulation: In an event driven design only those agents that need to take action are invoked.
3) Calibrating time: We need to consider the way to match the simulation time to the real world time.
In the fourth step, we need to consider how to verify and validate the model. Verification process aims to getting rid of bugs (Gilbert N. , Agent‐Based Models, 2008). To avoid bug in the simulation program and to make finding them easier, there are several techniques that can be used (Ramanath & Gilbert, 2004) for example:
1) Include lots of outputs and diagnostic: we may not only display the final result of the simulation, but also should display the intermediate values of the calculation.
2) Add assertions: for variables that have specific range of values, we should code warning message if the value of the variable is out of range.
3) Use unit testing: we divide our simulation into several units. We supply a series of input to each unit then; compare unit’s output with the expected output of the given unit. Usually, the expected output can be calculated manually.
4) Test parameter values for known scenarios: if there are scenarios for which the parameter and outputs are know with some degree of certainty, we can test whether the simulation can reproduces the expected behavior.
5) Use corner testing: We can test whether the simulation can produce reasonable outputs at extremes scenarios.
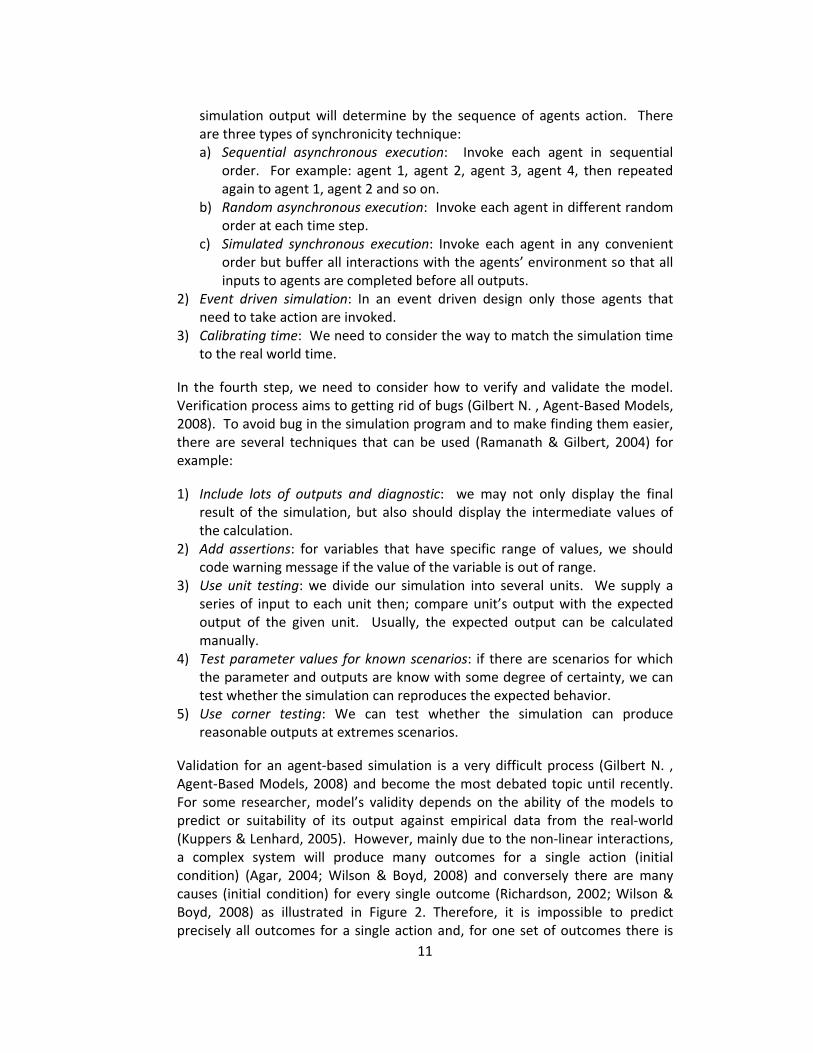
Validation for an agent‐based simulation is a very difficult process (Gilbert N. , Agent‐Based Models, 2008) and become the most debated topic until recently. For some researcher, model’s validity depends on the ability of the models to predict or suitability of its output against empirical data from the real‐world (Kuppers & Lenhard, 2005). However, mainly due to the non‐linear interactions, a complex system will produce many outcomes for a single action (initial condition) (Agar, 2004; Wilson & Boyd, 2008) and conversely there are many causes (initial condition) for every single outcome (Richardson, 2002; Wilson & Boyd, 2008) as illustrated in Figure 2. Therefore, it is impossible to predict precisely all outcomes for a single action and, for one set of outcomes there is
12
also impossible to predict precisely which action will produce it (Wilson & Boyd, 2008). This implies that there is a possibility that the pattern observed in the real world is only a subset of all possible patterns generated by a complex system under a certain initial conditions.
Figure 2 Relationship between initial condition and the resulted outcome in a complex system
By considering the relationship between initial conditions and outcomes that may occur then, there are at least three types of prediction that can be produce by a simulation model (Troitzsch, 2009):
1) Which kinds of behavior can be expected [from a system like this] under arbitrarily given parameter combinations and initial conditions? In this type of a prediction, the model is able to mimic some of observable outcomes generated by sets of initial conditions that are calibrated arbitrarily (randomly). Arbitrarily can mean that all elements of the initial condition are set randomly or, some elements of the Initial condition can be set so that they have the same quality with real‐world conditions.
2) Which kind of behavior will a given target system (whose parameters and previous states may or may not have been precisely measured) display in the near future? In this type of a prediction, the model is able to mimic some of observable outcomes when at least some elements of the initial condition can be set so that they have the same quantity with real‐world conditions.
3) Which state will the target system reach in the near future, again given parameters and previous states which may or may not have been precisely measured? The prediction of type 3 can even be subdivided in a stochastic or statistical version and a deterministic one: a) Which are the expected value and the confidence interval around the
expected value of the state the target system will reach in the near future, again given parameters and previous states which may or may not have been precisely measured?
b) Which exact value will the state of the target system have at a certain point of time in the near future, again given parameters and previous states which have been precisely measured?
13
Furthermore, the agent based model (prediction) validity can be classified into several levels (Axtell & Epstein, Agent Based Modeling: Understanding Our Creations, 1994):
1. Level 0: the model is caricature of reality that able to visualize agent’s movement.
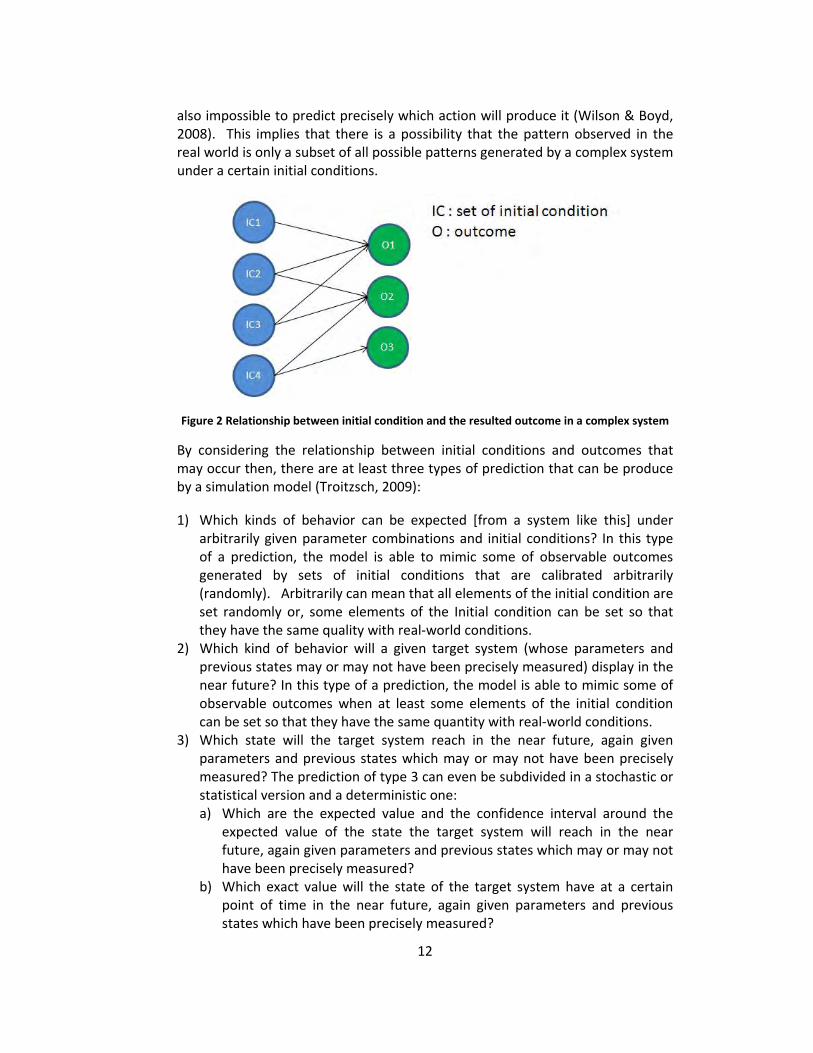
2. Level 1: The model is in qualitative agreement with empirical macro structure. For example the segregation model by Schelling (Schelling, 1971). The simulation result can show that, there is always a pattern of clusters of adjacent households of the same color. Although this model cannot show any numerical measure, the similar pattern can be observed in the real world.
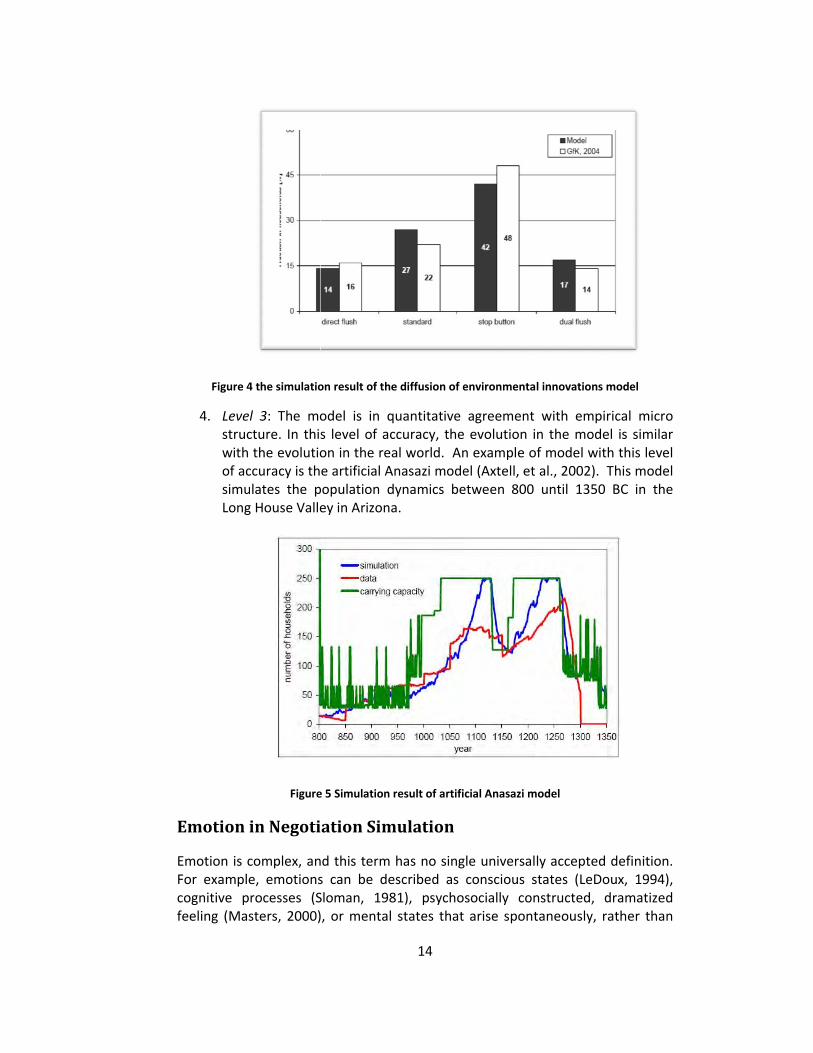
3. Level 2: The model is in quantitative agreement with empirical macro structure. In this level, the pattern in the real world can be estimated by the model. For example, in the simulation of environmental innovations diffusion, Schwarz can show that in the year of 2004 the majority of household in Germany used stop button tank, followed by standard, direct flush and dual flush tank (Schwarz, 2007). This pattern is similar with the pattern in the real world for the given year and we can also measure the difference between the simulation result and the real system.
Figure 3 The simulation result of segregation model by Schelling
cf
Figure 4
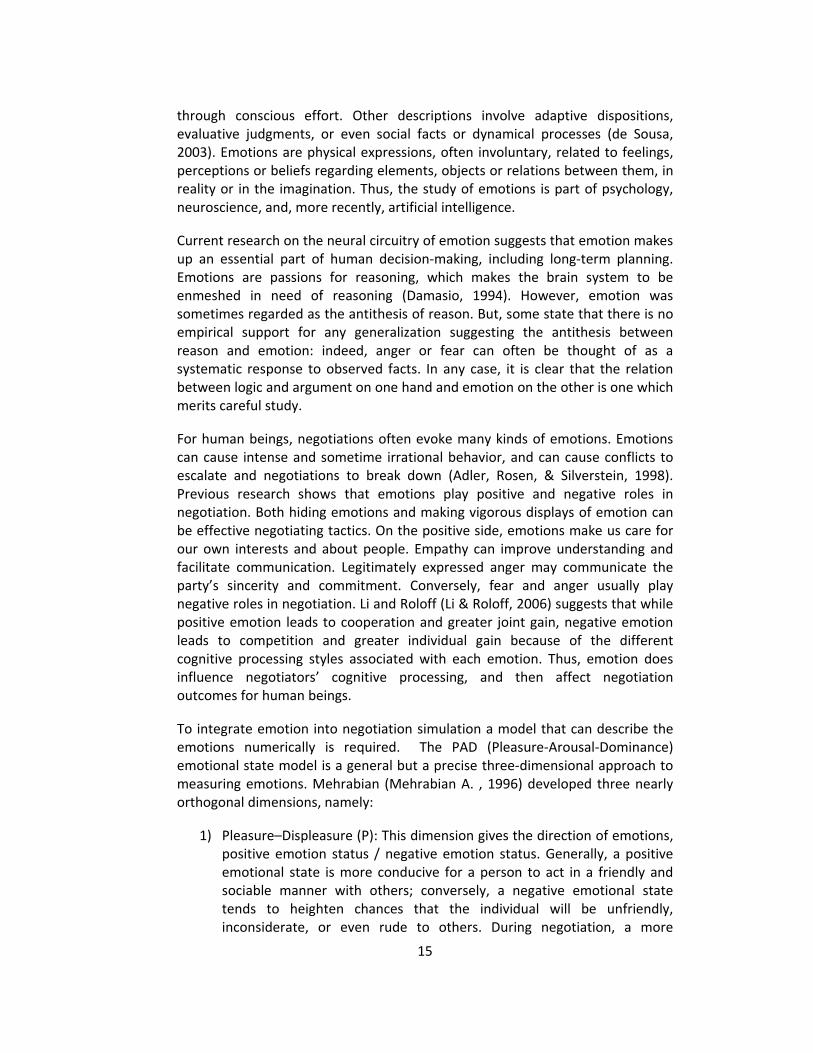
4. Levestrucwith of acsimuLong
Emotion
Emotion is cFor examplecognitive pfeeling (Mas
4 the simulatio
l 3: The mocture. In thisthe evolutio
ccuracy is thulates the pg House Valle
Figure
in Negoti
complex, ane, emotionsrocesses (Ssters, 2000)
on result of the
odel is in qs level of acon in the reae artificial Apopulation dey in Arizona
e 5 Simulation
ation Sim
d this term s can be deSloman, 198, or mental
14
e diffusion of e
quantitative ccuracy, theal world. AnAnasazi modedynamics bea.
result of artifi
mulation
has no singescribed as 81), psychostates that
environmenta
agreement evolution in example oel (Axtell, et etween 800
cial Anasazi m
gle universalconscious ssocially con arise spont
l innovations m
with empin the modeof model wital., 2002). Tuntil 1350
model
ly accepted states (LeDonstructed, dtaneously, r
model
rical micro el is similar h this level This model BC in the
definition. oux, 1994), dramatized ather than
15
through conscious effort. Other descriptions involve adaptive dispositions, evaluative judgments, or even social facts or dynamical processes (de Sousa, 2003). Emotions are physical expressions, often involuntary, related to feelings, perceptions or beliefs regarding elements, objects or relations between them, in reality or in the imagination. Thus, the study of emotions is part of psychology, neuroscience, and, more recently, artificial intelligence.
Current research on the neural circuitry of emotion suggests that emotion makes up an essential part of human decision‐making, including long‐term planning. Emotions are passions for reasoning, which makes the brain system to be enmeshed in need of reasoning (Damasio, 1994). However, emotion was sometimes regarded as the antithesis of reason. But, some state that there is no empirical support for any generalization suggesting the antithesis between reason and emotion: indeed, anger or fear can often be thought of as a systematic response to observed facts. In any case, it is clear that the relation between logic and argument on one hand and emotion on the other is one which merits careful study.
For human beings, negotiations often evoke many kinds of emotions. Emotions can cause intense and sometime irrational behavior, and can cause conflicts to escalate and negotiations to break down (Adler, Rosen, & Silverstein, 1998). Previous research shows that emotions play positive and negative roles in negotiation. Both hiding emotions and making vigorous displays of emotion can be effective negotiating tactics. On the positive side, emotions make us care for our own interests and about people. Empathy can improve understanding and facilitate communication. Legitimately expressed anger may communicate the party’s sincerity and commitment. Conversely, fear and anger usually play negative roles in negotiation. Li and Roloff (Li & Roloff, 2006) suggests that while positive emotion leads to cooperation and greater joint gain, negative emotion leads to competition and greater individual gain because of the different cognitive processing styles associated with each emotion. Thus, emotion does influence negotiators’ cognitive processing, and then affect negotiation outcomes for human beings.
To integrate emotion into negotiation simulation a model that can describe the emotions numerically is required. The PAD (Pleasure‐Arousal‐Dominance) emotional state model is a general but a precise three‐dimensional approach to measuring emotions. Mehrabian (Mehrabian A. , 1996) developed three nearly orthogonal dimensions, namely:
1) Pleasure–Displeasure (P): This dimension gives the direction of emotions, positive emotion status / negative emotion status. Generally, a positive emotional state is more conducive for a person to act in a friendly and sociable manner with others; conversely, a negative emotional state tends to heighten chances that the individual will be unfriendly, inconsiderate, or even rude to others. During negotiation, a more
16
pleasant agent tends to cooperate with others or tends to accept others’ offers; in contrast, a more unpleasant agent tends to reject others’ offers. We can reflect this relationship to the value system by assuming that pleasure makes the agent increase the evaluation value and displeasure makes the agent decrease the value (Jiang, 2007).
2) Arousal–Non‐arousal (A). This dimension represents the degree of effects on the pleasure dimension. Arousal means to rouse or stimulate to action or to physiological readiness for activity. This dimension magnifies or minimizes P’s affection. For example, if an agent is in pleasure status this emotion makes the agent increase the evaluation value a little; if the agent is also on arousal, it increases even more. But, if the agent is in displeasure, then arousal will make the agent decrease the value more (Jiang, 2007).
3) Dominance–Submissiveness (D): This dimension reflects the degree of the ability of being commanding, controlling, or prevailing over all others, or degree to yield oneself to the authority or will of another. The agent in a dominant state or with more power tends to persist in its own proposal and benefit more in negotiation. This dimension can be related to the value system of negotiation by assuming that since a dominant agent tends to persist in its own proposal it will tend to decrease the evaluation value. On the other hand, if the agent is submissive, it will tend to yield and accept the other agent’s proposal (Jiang, 2007).
Specific emotions can be represented by points in a three‐dimensional PAD emotion space. If the PAD scale scores are standardized then, each emotion can be described concisely in terms of its values on the pleasure ‐ displeasure, arousal – non‐arousal, and dominance‐submissiveness axes. For example, when emotions are scored on each PAD scale range from ‐1 to +1: angry (‐.51, .59, .25), bored (‐.65, ‐.62, ‐.33), curious (.22, .62, ‐.01), dignified (.55, .22, .61), elated (.50, .42, .23), hungry (‐.44, .14, ‐.21), inhibited (‐.54, ‐.04, ‐.41), loved (.87, .54, ‐.18), puzzled (‐.41, .48, ‐.33), sleepy (.20,‐.70, ‐.44), unconcerned (‐.13, ‐.41, .08), violent (‐.50, .62, .38).
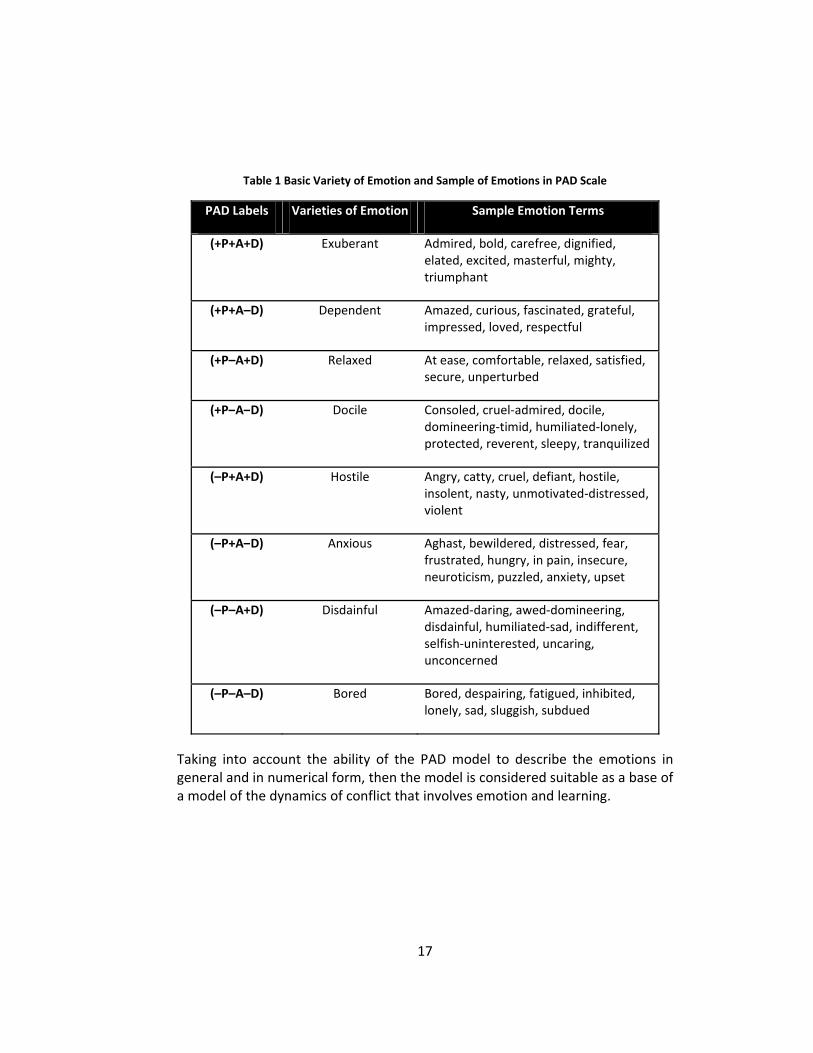
In the PAD Model, there are eight basic and common varieties of emotion, as defined by all possible combinations of high versus low pleasure (+P and –P), high versus low arousal (+A and –A) and high versus low dominance (+D and –D) (Mehrabian A. , 1996; Mehrabian A. , Relationships among Three General Approaches to Personality Description, 1995; Mehrabian A. , Framework for a Comprehensive Description and Measurement of Emotional States, 1995). These combinations are specified in Table 1.
17
Table 1 Basic Variety of Emotion and Sample of Emotions in PAD Scale
PAD Labels Varieties of Emotion Sample Emotion Terms
(+P+A+D) Exuberant Admired, bold, carefree, dignified, elated, excited, masterful, mighty, triumphant
(+P+A–D) Dependent Amazed, curious, fascinated, grateful, impressed, loved, respectful
(+P–A+D) Relaxed At ease, comfortable, relaxed, satisfied, secure, unperturbed
(+P–A–D) Docile Consoled, cruel‐admired, docile, domineering‐timid, humiliated‐lonely, protected, reverent, sleepy, tranquilized
(–P+A+D) Hostile Angry, catty, cruel, defiant, hostile, insolent, nasty, unmotivated‐distressed, violent
(–P+A–D) Anxious Aghast, bewildered, distressed, fear, frustrated, hungry, in pain, insecure, neuroticism, puzzled, anxiety, upset
(–P–A+D) Disdainful Amazed‐daring, awed‐domineering, disdainful, humiliated‐sad, indifferent, selfish‐uninterested, uncaring, unconcerned
(–P–A–D) Bored Bored, despairing, fatigued, inhibited, lonely, sad, sluggish, subdued
Taking into account the ability of the PAD model to describe the emotions in general and in numerical form, then the model is considered suitable as a base of a model of the dynamics of conflict that involves emotion and learning.
18
METHODOLOGY
This study begins with literature review of the previous studies, which aims to identify the latest developments of the Citarum river basin conflict, concepts relating to drama theory, agent‐based simulation and the PAD emotional model. Based on the results of this literature review new important information about the Citarum river basin conflict can be added and the limitations in the previous simulation mechanism can be improved.
The second step of this research is to conduct field observations and focus group discussion with stake holders in Citarum river basin conflict. Stakeholders involved in this process come from government, NGOs, community members, public enterprises, and business. This step aims to obtain a description of the current condition of Citarum river basin conflict. Based on the obtained data, common reference frames of Citarum river basin conflict were constructed. These common reference frames describe the historical dynamics of Citarum river basin conflict. To test model’s robustness to the dynamics of common reference frame and the emergence of new options, the the conflict’s chronological history is divided into two different milestones (resulting two scenarios). Each scenario consists of two common reference frame that is the common reference frame before the milestone and the common reference frame after the milestone. By using two common reference frames for each scenario, agent’s efforts to reduce the dilemmas at that time period can be identified. In addition, the emotional dynamics of each agent toward the other agents can also be estimated.
In the third stage of the research the proposed mechanism is constructed. The construction of the proposed model begins by defining agents and its attributes (Gilbert N. , 2004) such as agent’s positions, emotions and payoffs. After that, the interaction mechanisms among agents are deductively constructed (Gilbert & Terna, How to Build and Use Agent‐based Models in Social Science, 2000). The interaction mechanisms consist of several modules such as, negotiation protocol module, emotional dynamic module, learning module etc.
The next fourth stage is to conduct verification of the simulation. Verification process is intended to test the internal consistency of the simulation mechanism (Gilbert N. , 2004). In this process test are conducted to evaluate whether the behavior shown by the simulation is purely caused by the constructed mechanism and not caused by programming errors/bugs. To avoid bugs in the proposed model, unit testing and corner testing technique are used. In unit testing technique, the proposed model is divided into several units. A series of input for each unit is then supplied; the unit’s outputs are then compared to the expected output of the given unit (Ramanath & Gilbert, 2004). Usually, the expected output can be calculated manually. In corner testing technique, the proposed model is tested whether it can produce reasonable outputs at extremes scenarios or not (Ramanath & Gilbert, 2004).
19
After the simulation is verified, the next stage is to conduct virtual experiments. The virtual experiments in this study consist of three parts. The first part of the experiment aims to analyze model’s sensitivity. The sensitivity analysis is important to determine whether the dynamics shown by the proposed model are caused by the variation of supplied inputs or just an effect of random nature of the model. The sensitivity analysis is also important to determine the robustness of model analysis. The second part of the experiment aims to test the validity of the proposed model’s predictions. In this process the model is tested whether its outputs can show qualitative or quantitative agreement with empirical macro structure in the real world (Gilbert N. , 2004) or not. If the proposed model predictions are valid, then it is fesible to produce suggestion for the decision maker in the real world conflict. The third part of the experiment aim to explore patterns that can be generated by the proposed model. Based on these patterns, possible suggestions in order to achieve resolution in Citarum river basin conflict are inferred. These suggestions can take form of policy recommendations or identification of types of agent's behavior that support collaboration.
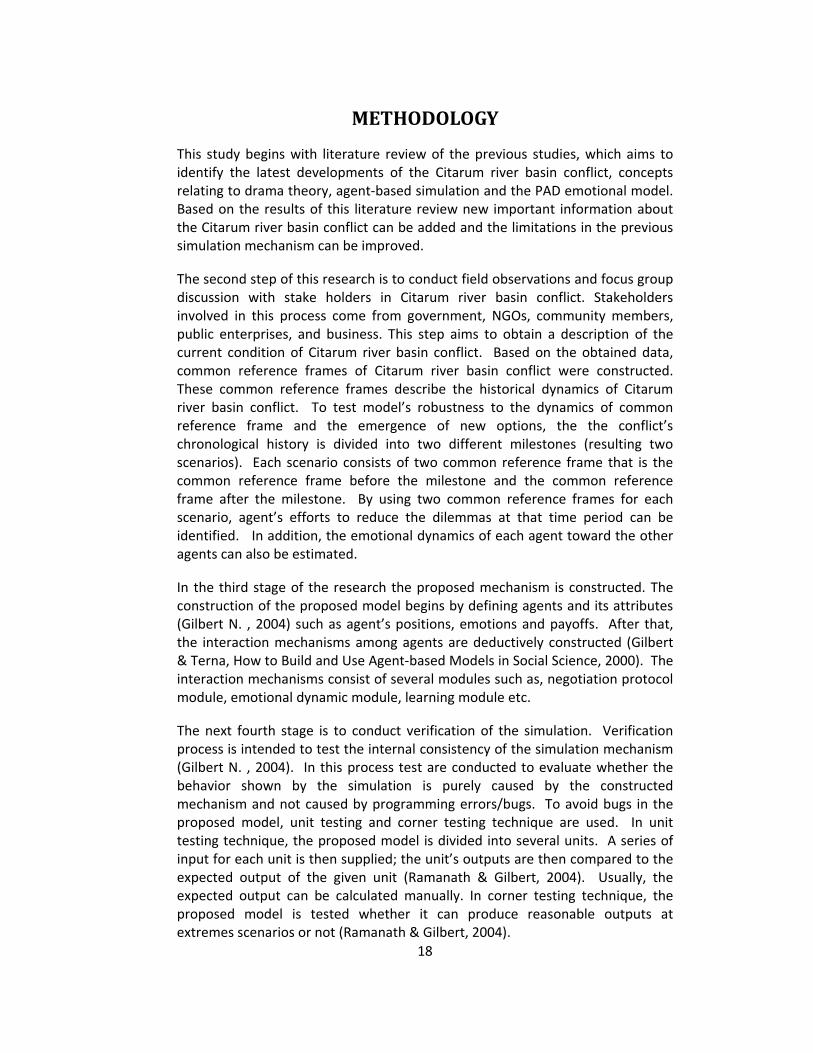
The general description of the research methodology is shown in Figure 6.
Figure 6 research Process Flow Chart
20
CASE STUDY
Case Background
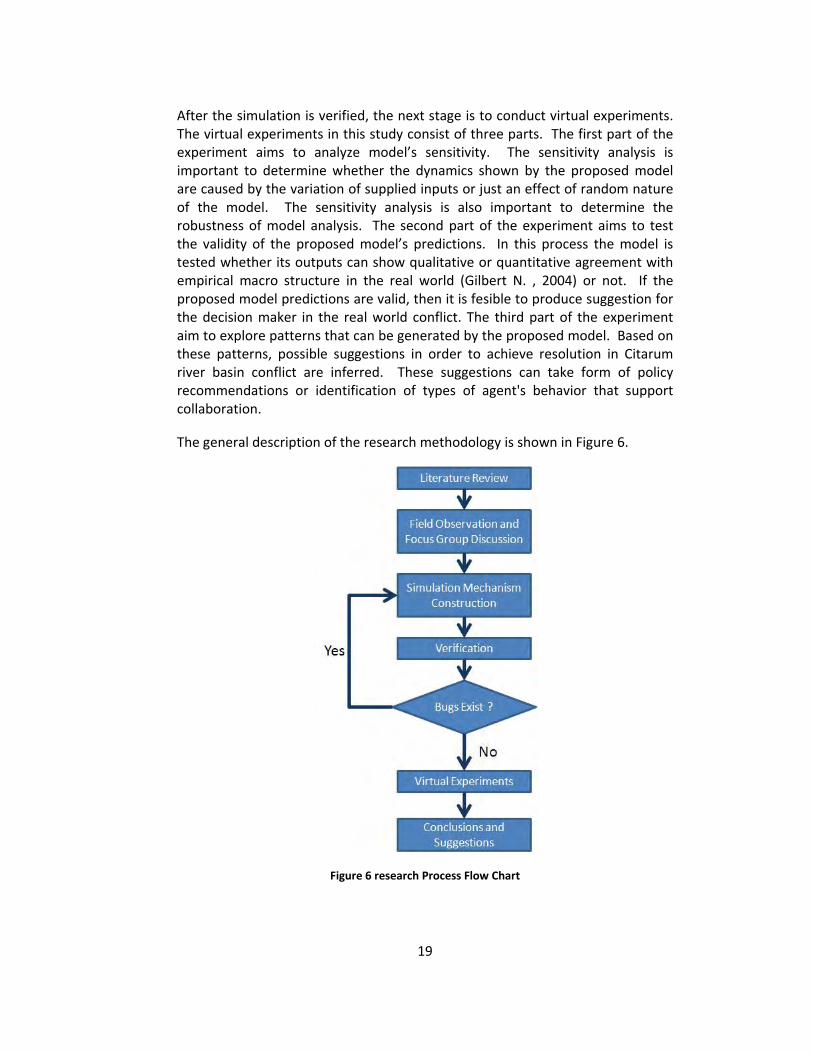
Citarum River basin is a region in Java Island, Indonesia, with 6,080 km2 area crossing three provinces, i.e., West Java, Banten, and Jakarta. Citarum upstream located in Wayang Mountain, in south Bandung and the downstream is located in Karawang, with total length of 225 km (citarum.org). Citarum River flows through ten regencies and the cities i.e. Bandung Regency, Bandung City, Purwakarta Regency, Cianjur, Garut, Sukabumi, Sumedang, Karawang, Bogor and Bekasi (Balai PSDA Wilayah Sungai Citarum, 2004). Citarum River is connected with 4 rivers to the west and 4 rivers to the east in West Java. The annual precipitation depth is 3,000 mm/year in the mountain and 2,500 mm/year in lowland. Relative humidity is 80% and daily temperature is 25oC in the lowland and 18oC in the mountain. Figure 7 shows the vast area covered by the Citarum river basin. Point A in Figure 7 shows the upstream area of Citarum River while point B shows the downstream area of the Citarum River.
Figure 7 Citarum River Basin Area
Citarum River is one of the strategic rivers in Indonesia. Almost everyone along Citarum River utilize its water to support their life. Citarum river water used for drinking water, industry, agriculture, power generation, flood control and river keepers. Citarum River generates 1,350 MW of electric power, irrigates 240,000 ha of rice fields, provides 45.75 billion cubic of water for industry, 43.3 billion m3 of water for fisheries, and 400.5 billion m3 of water for domestic purposes
21
(Puslitbang Sumber Daya Air, 2005). In addition, Citarum River also became the recreation object for the community.
In the past Citarum River can perform these functions well, but those conditions have now changed completely (Sungkono, 2005). Floods always occur during the rainy season because of sedimentation at Citarum river downstream region, and the increasing number of barren land (Umar, 2005). Citarum River even takes seventh position of the ten dirtiest rivers in the world, in 2010 (Tribun, 2010).
There are several causes of the Citarum River Basin problem. The first is the population explosion that occurred at the upper stream region (Maulana, 2003) that led to an increase in illegal lodging and deforestation in the upper stream region. Second is household waste into the river. Along the Citarum River there are ± 8 million residents who could potentially produce household waste (Pemerintah Propinsi Jawa Barat, 2002). Nowadays, at least 200 tons of household wastes are thrown away into Citarum. In addition, many of industries do not perform waste treatment before throwing them away into Citarum River (Sungkono, 2005). In the Citarum river basin there are 1000 industries that use surface water, as well as producing industrial waste (Pemerintah Propinsi Jawa Barat, 2002). The flood and the dirty river water in have caused many kinds of diseases suffered by the community along the Citarum River.
The problem in Citarum River basin involves many agents. In fact there are hundreds of agents involved in the conflict in the Citarum River Basin. These agents consist of central government agencies, provincial government agencies, city agencies / counties and villages, state‐owned enterprises, NGOs at the regional level and NGOs at local level. Through literature studies conducted on mass media, reports and previous studies hundreds of agents that play significant role in Citarum River Basin Conflict from 2007 until now are identified. These agents can be classified as follows:
1. Business Sector: This group consists of investors and private business such as, real estate entrepreneurs, factory outlets of textile industries. The group is interested in using the Citarum River Basin area as their business establishment e.g. factories, factory outlets, hotels, etc. Their business establishments sometimes violate the established provisions for example; covering the city drainage to build parking lots. They are also significant users of surface water in Citarum River and frequently also dispose their waste in to the Citarum River.
2. Community: Groups of community such as farmer alliance, woodlander alliance, merchant alliance, etc. This group needs the land in Citarum River Basin for housing and agriculture. This group utilizes Citarum river water for irrigation, domestic usage and sometimes they also produce household waste that is dumped into the river Citarum. Because they lived close to the Citarum River this group also become the main victims of flood and contamination that occurred in the Citarum River. The members of this group
22
among other are, farmers in the upperstream of Citarum river, residents in Bale Endah, residents in Andir district, farmers in the northern coast of Java island etc.
3. Government: Group of agents who have authorities to make official policies, e.g. central government agencies, provincial government agencies, city agencies / counties agencies. The interest of this group members are to prevent floods in the area, to preserve nature in the Citarum River Basin, to maintain the availability of water supplies, to improve the welfare of the people in the Citarum river basin and to earn regional revenue. The members of this group among other are, the government of Bandung city, the government of Bandung regency, the government of West Bandung Regency, the Ministry of Public Works, BAPEDA (Regional Development Agency), BBWS (Central River Region Agency) Citarum, Perhutani (Indonesian Forestry Agency), PSDA (Natural Resources Development Agency), etc.
4. NGO: Group of nonprofit institutions that consists of professionals, community leaders, environmentalist, academicians and humanist. Members of this group are eager to prevent floods in the area, to preserve the nature in the Citarum River Basin, and to improve community welfare and health. The members of this group among other are, DPLKTS (Board of Forestry and Environmental Observer in Tatar Sunda), Bandung Green and Clean, Bina Mitra, Walhi, Arum, Kruha, etc.
5. Public Enterprise: A group of agent that consists of State owned enterprises and regional owned enterprises that are responsible to serve the public and to gain profit for the company. The members of this group among other are, PDAM (Regional Drinking Water Company), PJT (Perum Jasa Tirta (National Drinking Water Company)), and Indonesian Power (Electricity Company). Citarum river water is a resource for the agents in this group. PDAM and PJT require Citarum river water to be converted into drinking water while Indonesia Power requires Citarum river flow to generate electricity. The decline in water quality and sedimentation of the river Citarum diminish the quality of the resources obtained by the public enterprises and automatically reduce their ability to serve the community and making profit.
There are many programs and proposals that have been produced through the interaction and negotiation among these agents. As one example is Citarum Bergetar program that was initiated in 2001. This program consists of general policy and law to control, to restore and to conserve Citarum River and also involving community empowerment programs (BPLDH Jawa Barat, 2001). However, because each agent has different interests, these programs and proposals cannot produce a significant impact on the improvement of Citarum River Basin conditions. Another example is Integrated Water Resources Management (IWRM) program in 2008 (Santono & Goeltom, 2011). This program aims to manage sustainable development, allocation and monitoring of water resource use in the context of social, economic and environmental objectives systematically.
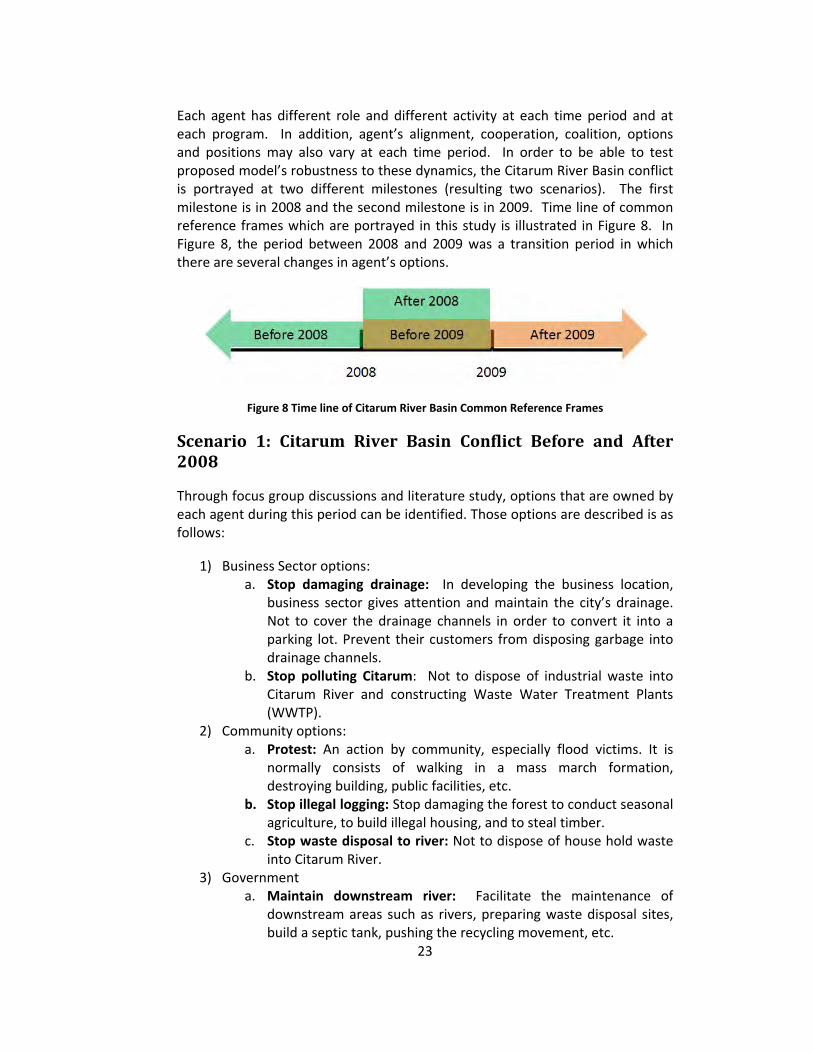
23
Each agent has different role and different activity at each time period and at each program. In addition, agent’s alignment, cooperation, coalition, options and positions may also vary at each time period. In order to be able to test proposed model’s robustness to these dynamics, the Citarum River Basin conflict is portrayed at two different milestones (resulting two scenarios). The first milestone is in 2008 and the second milestone is in 2009. Time line of common reference frames which are portrayed in this study is illustrated in Figure 8. In Figure 8, the period between 2008 and 2009 was a transition period in which there are several changes in agent’s options.
Figure 8 Time line of Citarum River Basin Common Reference Frames
Scenario 1: Citarum River Basin Conflict Before and After 2008
Through focus group discussions and literature study, options that are owned by each agent during this period can be identified. Those options are described is as follows:
1) Business Sector options: a. Stop damaging drainage: In developing the business location,
business sector gives attention and maintain the city’s drainage. Not to cover the drainage channels in order to convert it into a parking lot. Prevent their customers from disposing garbage into drainage channels.
b. Stop polluting Citarum: Not to dispose of industrial waste into Citarum River and constructing Waste Water Treatment Plants (WWTP).
2) Community options: a. Protest: An action by community, especially flood victims. It is
normally consists of walking in a mass march formation, destroying building, public facilities, etc.
b. Stop illegal logging: Stop damaging the forest to conduct seasonal agriculture, to build illegal housing, and to steal timber.
c. Stop waste disposal to river: Not to dispose of house hold waste into Citarum River.
3) Government a. Maintain downstream river: Facilitate the maintenance of
downstream areas such as rivers, preparing waste disposal sites, build a septic tank, pushing the recycling movement, etc.
24
b. Give sanction to people: give strict and clear sanction to community member who steal timber, conduct seasonal agriculture, dispose household waste into the river, or build illegal housing.
c. Give sanction to business sector: give strict and clear sanction to business sector that destroy city’s drainage, doesn’t have WWTP, or dispose industrial waste into the river.
d. Give real estate license: give permission to construct real estate and villas in Citarum’s upper stream area.
e. Giving More Authorities for green and Public Enterprises: There are limited authorities for Green and Public Enterprises to do their job. Green needs authority to handle curative programs of Citarum, and public enterprises need authority to develop some programs independently to gain more income without government intervention. The programs need to be carried out by public enterprises including the Citarum river conservation program by empowering the community. These programs are necessary because of the Citarum River is one of resources for public enterprises.
4) NGO a. Protest: confrontationally against government policies that do not
support the preservation of nature. 5) Public Enterprise
a. Proactively protect the environment: Participate actively in efforts to maintain the Citarum River Basin, both in the upstream and downstream area.
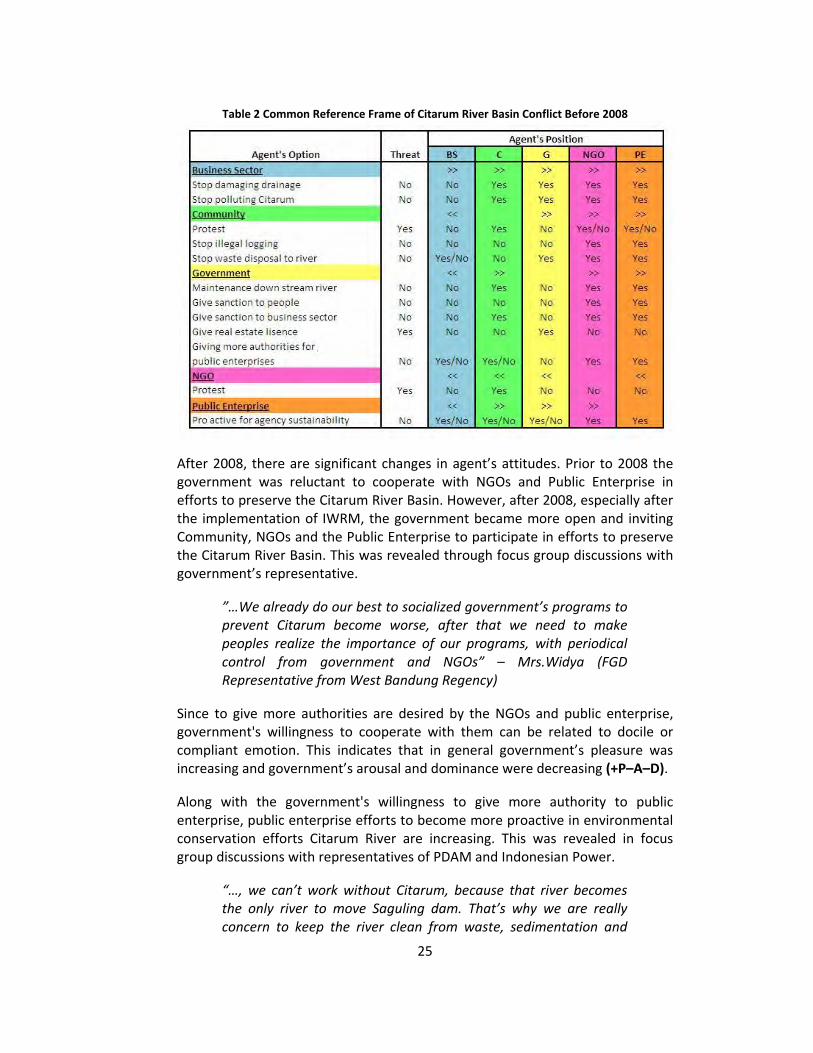
Based on observation, focus group discussion and literature study, the positions taken by each agent before 2008 are described by the common reference in Table 2.
25
Table 2 Common Reference Frame of Citarum River Basin Conflict Before 2008
After 2008, there are significant changes in agent’s attitudes. Prior to 2008 the government was reluctant to cooperate with NGOs and Public Enterprise in efforts to preserve the Citarum River Basin. However, after 2008, especially after the implementation of IWRM, the government became more open and inviting Community, NGOs and the Public Enterprise to participate in efforts to preserve the Citarum River Basin. This was revealed through focus group discussions with government’s representative.
”…We already do our best to socialized government’s programs to prevent Citarum become worse, after that we need to make peoples realize the importance of our programs, with periodical control from government and NGOs” – Mrs.Widya (FGD Representative from West Bandung Regency)
Since to give more authorities are desired by the NGOs and public enterprise, government's willingness to cooperate with them can be related to docile or compliant emotion. This indicates that in general government’s pleasure was increasing and government’s arousal and dominance were decreasing (+P–A–D).
Along with the government's willingness to give more authority to public enterprise, public enterprise efforts to become more proactive in environmental conservation efforts Citarum River are increasing. This was revealed in focus group discussions with representatives of PDAM and Indonesian Power.
“…, we can’t work without Citarum, because that river becomes the only river to move Saguling dam. That’s why we are really concern to keep the river clean from waste, sedimentation and
26
seasonal agriculture. ….. We still don’t have enough budget and capability, but now we can always try to make Citarum condition better. As an example, now we have a reforestation program in Manglayang” – Mr.Alimin (FGD Representative from Indonesia Power)
”…now we can do the conservation project, we have the budget for that, we have the CSR also, give the support to peoples, NGO and research….” – Mr.Yusuf (FGD Representative from PDAM)
Attitude shown by the public enterprise in this interval reflects that they are eager to do conservation in Citarum River Basin. Their eagerness can be related to excited or elated emotions. This indicates that in general public enterprise’s pleasure, arousal and dominance were increasing (+P+A+D).
Community, in the period before 2008, often carried out protest that was intended primarily to the industries that dump industrial waste into Citarum River. However, they did not get serious responses they eventually top these efforts. This was revealed through focus group discussions with community’s representative.
”…we used to do some protest, but the industries were not care with us, so we are angry and damage the factory’s pipes” – Mr.Arif (FGD Representative from Community)
Attitude shown by the community at this time interval reflects that they have become frustrated against industries that are in the Citarum River Basin. This attitude can be related to distressed or frustrated emotion. This indicates that in this period community’s pleasure and dominance were decreasing while their arousal was increasing (–P+A–D).
Taking into account the actions taken by each agent, then changes occur in the common reference frame after 2008. The positions taken by each agent after 2008 are described by the common reference in Table 3.
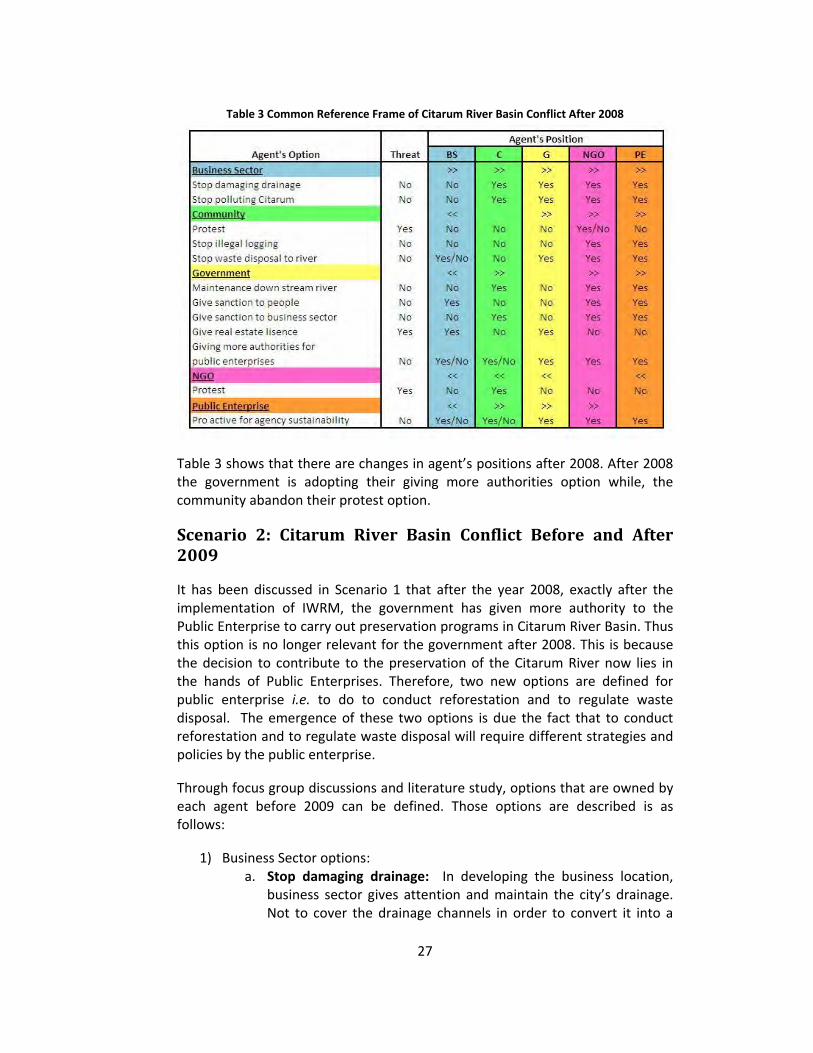
27
Table 3 Common Reference Frame of Citarum River Basin Conflict After 2008
Table 3 shows that there are changes in agent’s positions after 2008. After 2008 the government is adopting their giving more authorities option while, the community abandon their protest option.
Scenario 2: Citarum River Basin Conflict Before and After 2009
It has been discussed in Scenario 1 that after the year 2008, exactly after the implementation of IWRM, the government has given more authority to the Public Enterprise to carry out preservation programs in Citarum River Basin. Thus this option is no longer relevant for the government after 2008. This is because the decision to contribute to the preservation of the Citarum River now lies in the hands of Public Enterprises. Therefore, two new options are defined for public enterprise i.e. to do to conduct reforestation and to regulate waste disposal. The emergence of these two options is due the fact that to conduct reforestation and to regulate waste disposal will require different strategies and policies by the public enterprise.
Through focus group discussions and literature study, options that are owned by each agent before 2009 can be defined. Those options are described is as follows:
1) Business Sector options: a. Stop damaging drainage: In developing the business location,
business sector gives attention and maintain the city’s drainage. Not to cover the drainage channels in order to convert it into a
28
parking lot. Prevent their customers from disposing garbage into drainage channels.
b. Stop polluting Citarum: Not to dispose of industrial waste into Citarum River and construct Waste Water Treatment Plants (WWTP).
2) Community options: a. Protest: An action by community, especially flood victims. It is
normally consists of walking in a mass march formation, destroying building, public facilities, etc.
b. Stop illegal logging: Stop damaging the forest to conduct seasonal agriculture, to build illegal housing, and to steal timber.
c. Stop waste disposal to river: Not to dispose of house hold waste into Citarum River.
3) Government a. Maintain downstream river: Facilitate the maintenance of
downstream areas such as rivers, preparing waste disposal sites, build a septic tank, pushing the recycling movement, etc.
b. Give sanction to people: give strict and clear sanction to community member who steal timber, dispose household waste into the river, or build illegal housing.
c. Give sanction to business sector: give strict and clear sanction to business sector that destroy city’s drainage, dispose industrial waste into the river.
d. Give real estate license: give permission to construct real estate and villas in Citarum’s upper stream area.
4) NGO a. Protest: confrontationally against government policies that do not
support the preservation of nature. 5) Public Enterprise
a. Regulate the waste disposal: Helps to reduce the amount of waste that goes into the river by building a waste filter in upstream areas, educate the community, invite the community to clean up the river.
b. Reforestation: Carry out reforestation in the upstream areas and encourage people conduct reforestation by holding lectures and develop perennials plantation business.
Based on observation, literature study and focus group discussion, positions taken by each agent before 2009 can be described by the common reference in Table 4.
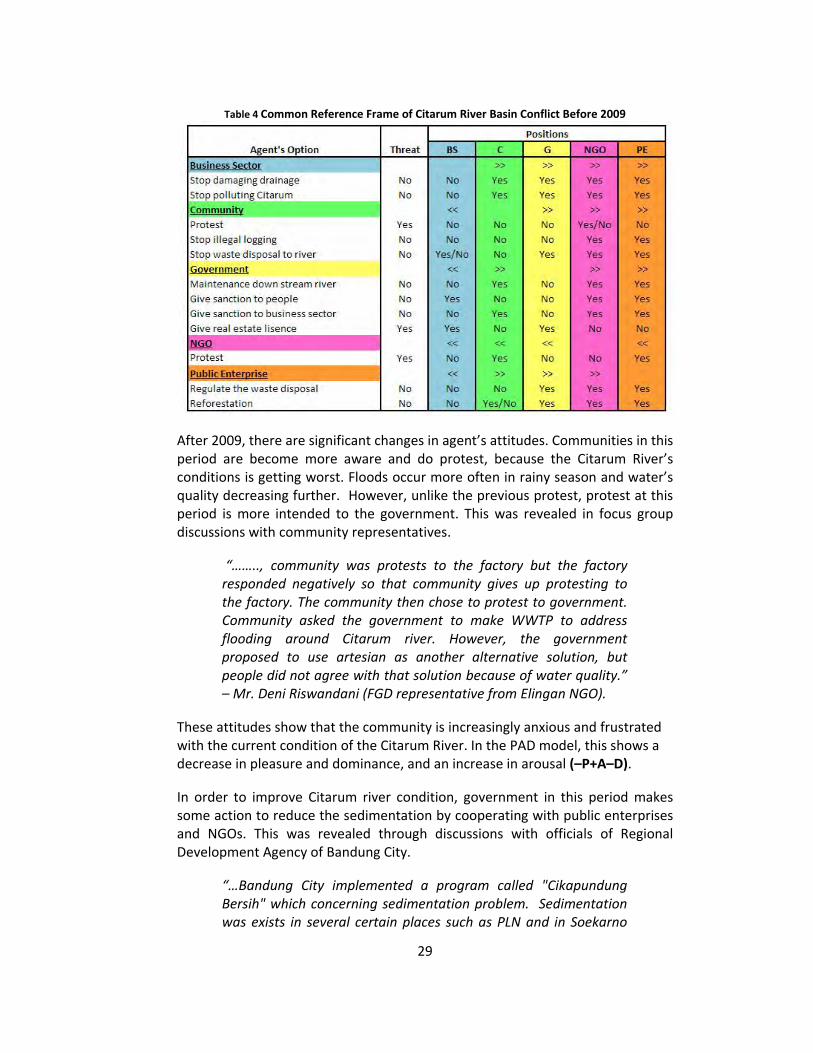
29
Table 4 Common Reference Frame of Citarum River Basin Conflict Before 2009
After 2009, there are significant changes in agent’s attitudes. Communities in this period are become more aware and do protest, because the Citarum River’s conditions is getting worst. Floods occur more often in rainy season and water’s quality decreasing further. However, unlike the previous protest, protest at this period is more intended to the government. This was revealed in focus group discussions with community representatives.
“…….., community was protests to the factory but the factory responded negatively so that community gives up protesting to the factory. The community then chose to protest to government. Community asked the government to make WWTP to address flooding around Citarum river. However, the government proposed to use artesian as another alternative solution, but people did not agree with that solution because of water quality.” – Mr. Deni Riswandani (FGD representative from Elingan NGO).
These attitudes show that the community is increasingly anxious and frustrated with the current condition of the Citarum River. In the PAD model, this shows a decrease in pleasure and dominance, and an increase in arousal (–P+A–D).
In order to improve Citarum river condition, government in this period makes some action to reduce the sedimentation by cooperating with public enterprises and NGOs. This was revealed through discussions with officials of Regional Development Agency of Bandung City.
“…Bandung City implemented a program called "Cikapundung Bersih" which concerning sedimentation problem. Sedimentation was exists in several certain places such as PLN and in Soekarno
30
Hatta. This process is not only done by the city government because it is involves several other stakeholders such as BRI, PLN, and NGOs…”. – Mr. Anwar (FGD representative from Bandung Local Government Agency).
In addition, the government was also review a lot of real estate license and give sanction to business establishments which design violates government provisions. Government’s willingness to cooperate with other agents indicates that in general government’s pleasure, arousal and in dominance are increasing (+P+A+D).
NGOs in this period also make some positive activity such as cleaning, educating and empowering the community to protect the river. This was revealed through discussions with the representatives of Bandung Green and Clean (BGC).
“First, we urge people to improve their participation. This is commonly referred to as the implementation of community empowerment. This is also related to environmental activities that we can know how its progress. Secondly, we are taught how to manage waste in the home. Third, we do greening at home. It is not just an ornamental plant, but also growing vegetables and medicinal plants at home. Fourth, save water when the rainy season and keep the water when the dry season. Waste is not disposed carelessly, and makes better treatment at home.” –Mr. Rohadji (FGD representative from Green and Clean NGO).
NGO’s willingness to empower the people and cooperate with other agents such as business, government and public enterprises indicates increase in pleasure, arousal and in dominance (+P+A+D).
Public Enterprises also made significant efforts to make Citarum become cleaner. Their efforts also involve community member and NGOs. This was revealed through discussions with the representatives of Indonesian Power and PDAM (Regional Water Company).
“……. we are really concern to keep the river clean from waste, sedimentation and seasonal agriculture. ….. As an example, we have a reforestation program in Manglayang [Mountain]” – Mr. Amin Alimin (FGD Representative from Environmental Unit officials of Indonesia Power).
“…beside we taking the water, we also conserve and cooperate with PERHUTANI, to conserve the environment, …... For spring problem, usually we cooperate with PERHUTANI, so we have a special budget for that” – Mr. Ahmad Yusuf (FGD representative from PDAM 2nd production unit)
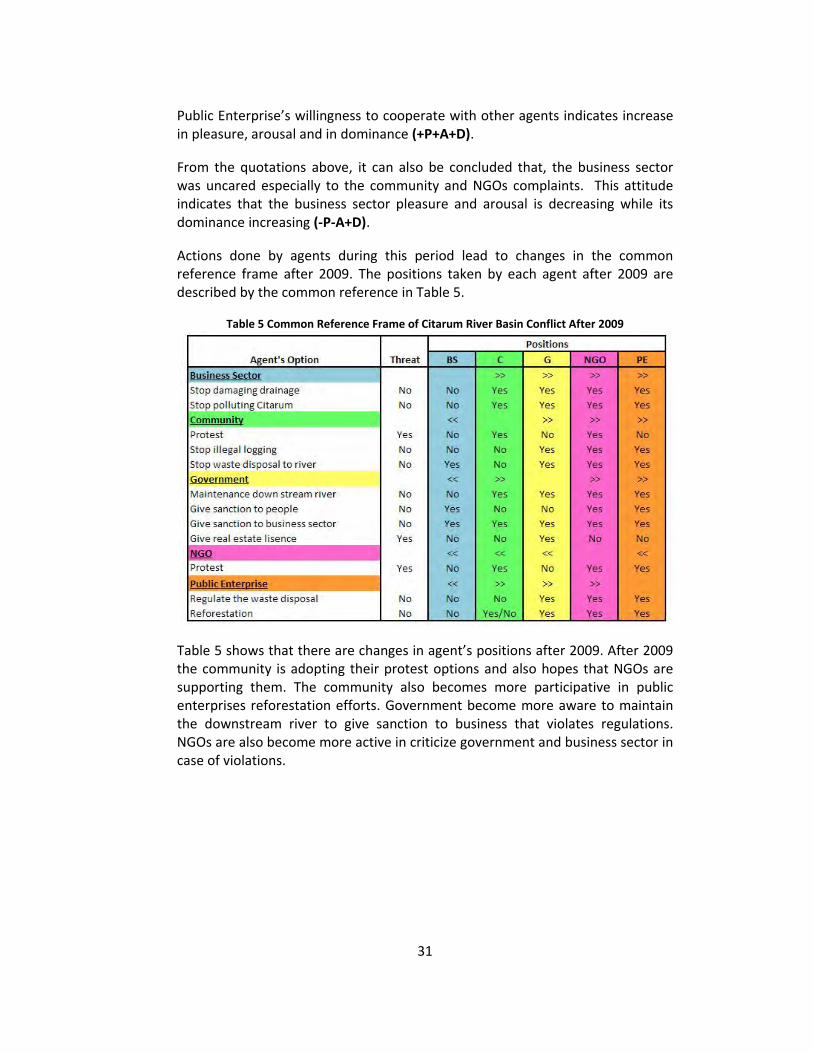
31
Public Enterprise’s willingness to cooperate with other agents indicates increase in pleasure, arousal and in dominance (+P+A+D).
From the quotations above, it can also be concluded that, the business sector was uncared especially to the community and NGOs complaints. This attitude indicates that the business sector pleasure and arousal is decreasing while its dominance increasing (‐P‐A+D).
Actions done by agents during this period lead to changes in the common reference frame after 2009. The positions taken by each agent after 2009 are described by the common reference in Table 5.
Table 5 Common Reference Frame of Citarum River Basin Conflict After 2009
Table 5 shows that there are changes in agent’s positions after 2009. After 2009 the community is adopting their protest options and also hopes that NGOs are supporting them. The community also becomes more participative in public enterprises reforestation efforts. Government become more aware to maintain the downstream river to give sanction to business that violates regulations. NGOs are also become more active in criticize government and business sector in case of violations.
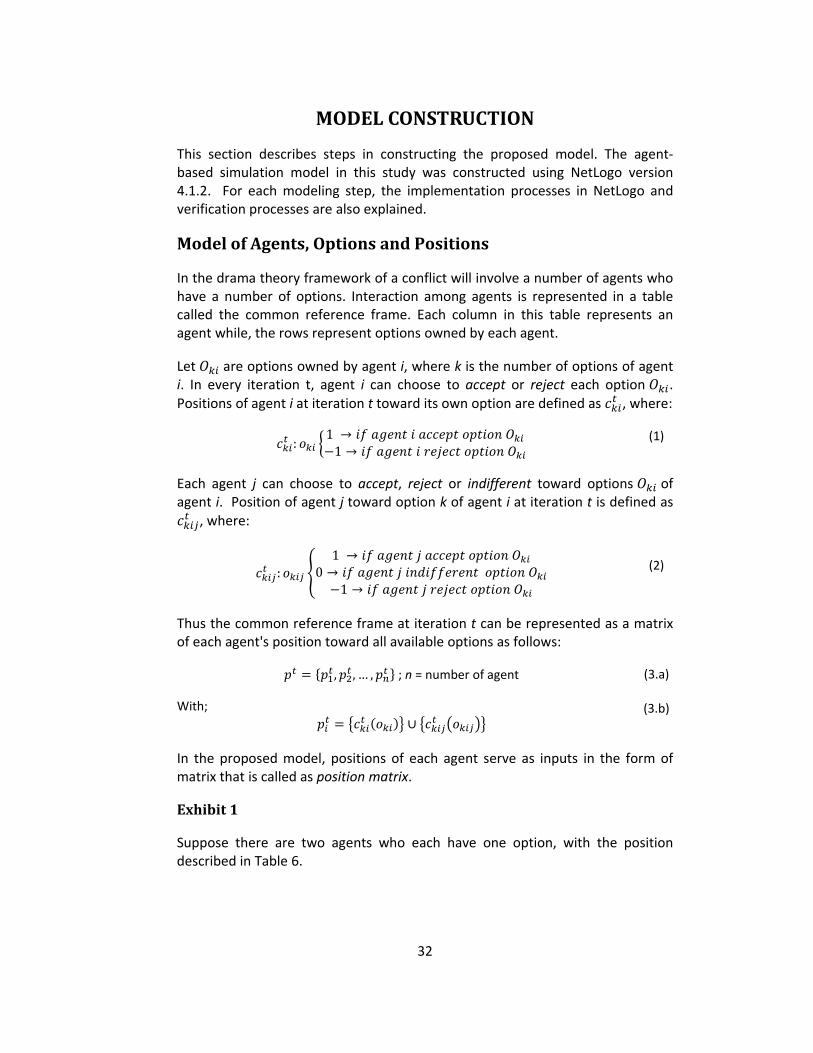
32
MODEL CONSTRUCTION
This section describes steps in constructing the proposed model. The agent‐based simulation model in this study was constructed using NetLogo version 4.1.2. For each modeling step, the implementation processes in NetLogo and verification processes are also explained.
Model of Agents, Options and Positions
In the drama theory framework of a conflict will involve a number of agents who have a number of options. Interaction among agents is represented in a table called the common reference frame. Each column in this table represents an agent while, the rows represent options owned by each agent.
Let are options owned by agent i, where k is the number of options of agent i. In every iteration t, agent i can choose to accept or reject each option . Positions of agent i at iteration t toward its own option are defined as , where:
: 11 (1)
Each agent j can choose to accept, reject or indifferent toward options of agent i. Position of agent j toward option k of agent i at iteration t is defined as
, where:
:1
01
(2)
Thus the common reference frame at iteration t can be represented as a matrix of each agent's position toward all available options as follows:
, , … , ; n = number of agent (3.a)
With;
(3.b)
In the proposed model, positions of each agent serve as inputs in the form of matrix that is called as position matrix.
Exhibit 1
Suppose there are two agents who each have one option, with the position described in Table 6.
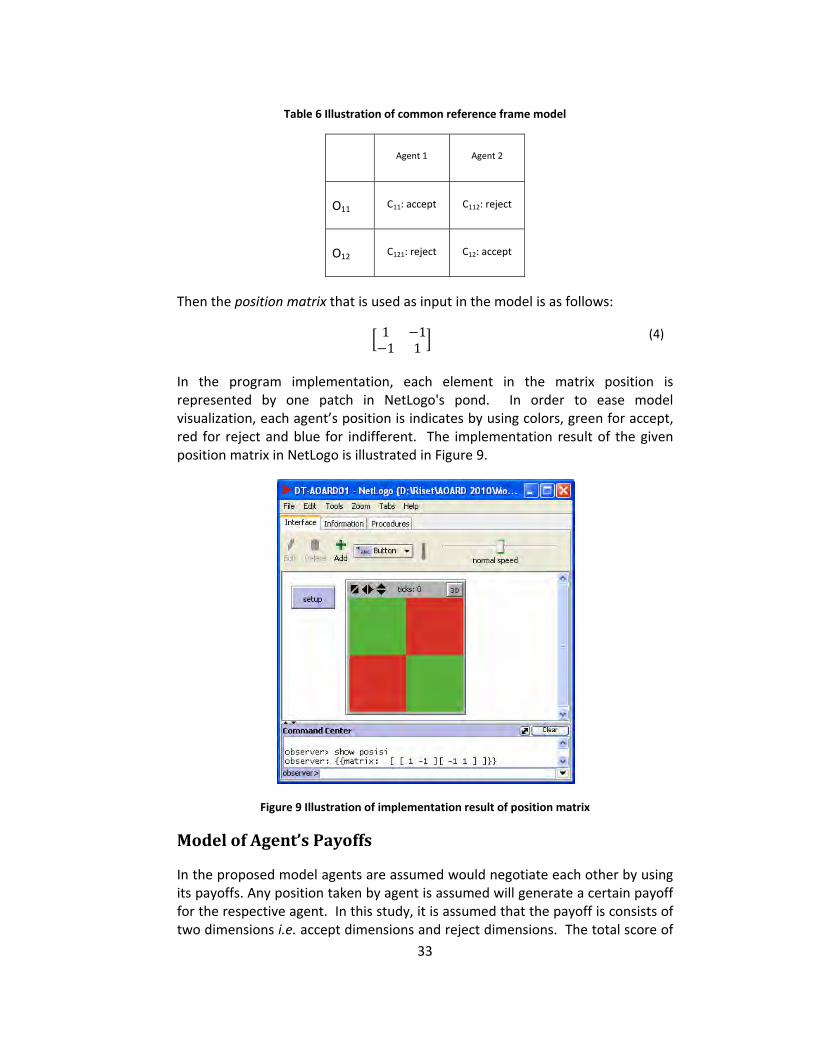
33
Table 6 Illustration of common reference frame model
Agent 1 Agent 2
O11 C11: accept C112: reject
O12 C121: reject C12: accept
Then the position matrix that is used as input in the model is as follows:
1 11 1 (4)
In the program implementation, each element in the matrix position is represented by one patch in NetLogo's pond. In order to ease model visualization, each agent’s position is indicates by using colors, green for accept, red for reject and blue for indifferent. The implementation result of the given position matrix in NetLogo is illustrated in Figure 9.
Figure 9 Illustration of implementation result of position matrix
Model of Agent’s Payoffs
In the proposed model agents are assumed would negotiate each other by using its payoffs. Any position taken by agent is assumed will generate a certain payoff for the respective agent. In this study, it is assumed that the payoff is consists of two dimensions i.e. accept dimensions and reject dimensions. The total score of
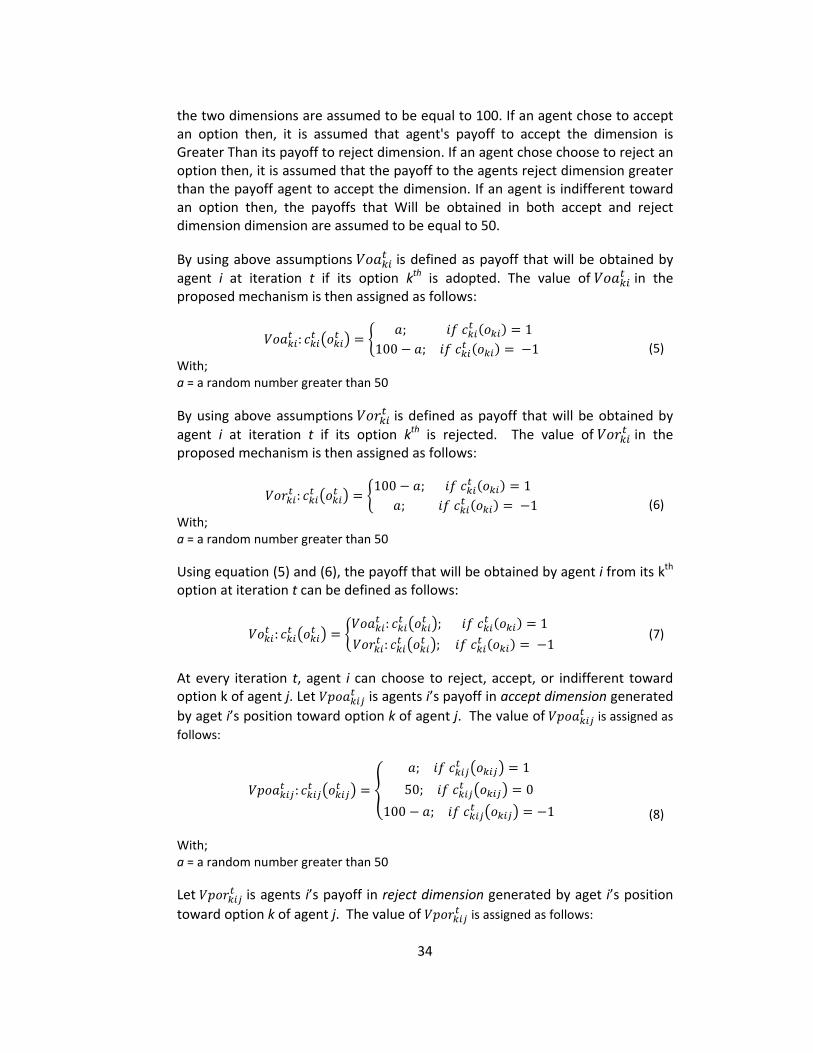
34
the two dimensions are assumed to be equal to 100. If an agent chose to accept an option then, it is assumed that agent's payoff to accept the dimension is Greater Than its payoff to reject dimension. If an agent chose choose to reject an option then, it is assumed that the payoff to the agents reject dimension greater than the payoff agent to accept the dimension. If an agent is indifferent toward an option then, the payoffs that Will be obtained in both accept and reject dimension dimension are assumed to be equal to 50.
By using above assumptions is defined as payoff that will be obtained by agent i at iteration t if its option kth is adopted. The value of in the proposed mechanism is then assigned as follows:
:; 1
100 ; 1
With; a = a random number greater than 50
(5)
By using above assumptions is defined as payoff that will be obtained by agent i at iteration t if its option kth is rejected. The value of in the proposed mechanism is then assigned as follows:
:100 ; 1
; 1
With; a = a random number greater than 50
(6)
Using equation (5) and (6), the payoff that will be obtained by agent i from its kth option at iteration t can be defined as follows:
:: ; 1: ; 1
(7)
At every iteration t, agent i can choose to reject, accept, or indifferent toward option k of agent j. Let is agents i’s payoff in accept dimension generated by aget i’s position toward option k of agent j. The value of is assigned as follows:
:; 1
50; 0100 ; 1
With; a = a random number greater than 50
(8)
Let is agents i’s payoff in reject dimension generated by aget i’s position toward option k of agent j. The value of is assigned as follows:
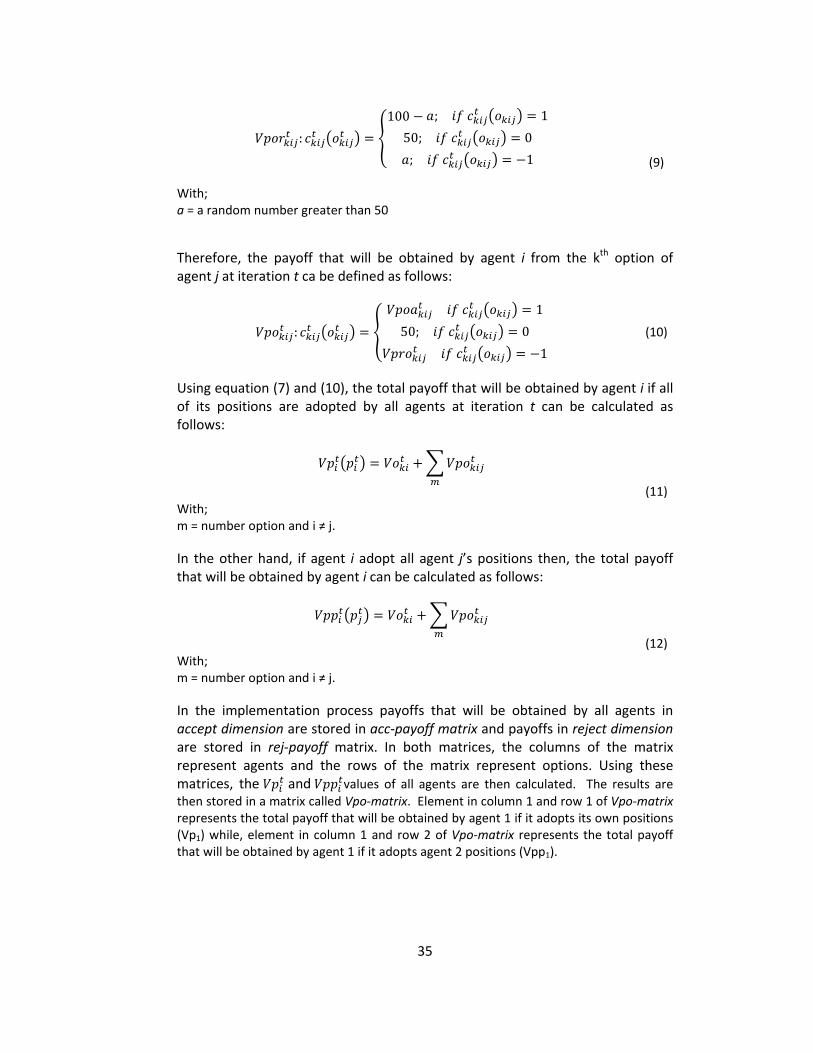
35
:100 ; 1
50; 0; 1
With; a = a random number greater than 50
(9)
Therefore, the payoff that will be obtained by agent i from the kth option of agent j at iteration t ca be defined as follows:
:1
50; 01 (10)
Using equation (7) and (10), the total payoff that will be obtained by agent i if all of its positions are adopted by all agents at iteration t can be calculated as follows:
With; m = number option and i ≠ j.
(11)
In the other hand, if agent i adopt all agent j’s positions then, the total payoff that will be obtained by agent i can be calculated as follows:
With; m = number option and i ≠ j.
(12)
In the implementation process payoffs that will be obtained by all agents in accept dimension are stored in acc‐payoff matrix and payoffs in reject dimension are stored in rej‐payoff matrix. In both matrices, the columns of the matrix represent agents and the rows of the matrix represent options. Using these matrices, the and values of all agents are then calculated. The results are then stored in a matrix called Vpo‐matrix. Element in column 1 and row 1 of Vpo‐matrix represents the total payoff that will be obtained by agent 1 if it adopts its own positions (Vp1) while, element in column 1 and row 2 of Vpo‐matrix represents the total payoff that will be obtained by agent 1 if it adopts agent 2 positions (Vpp1).
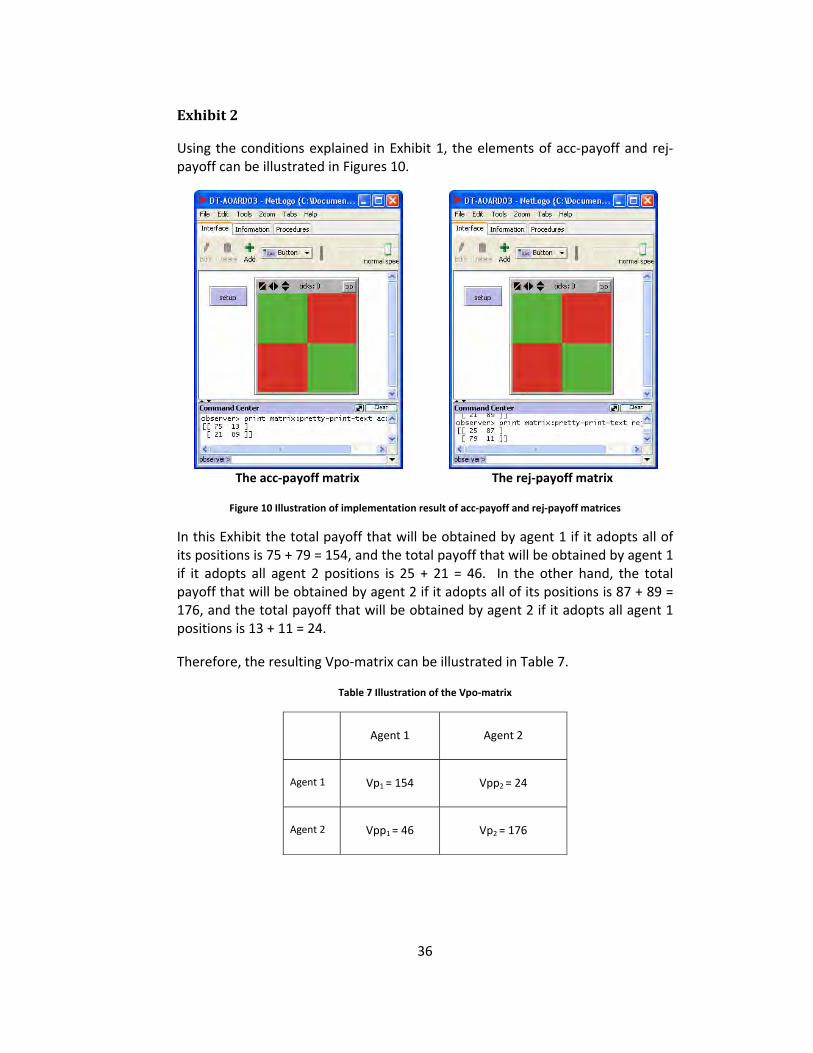
36
Exhibit 2
Using the conditions explained in Exhibit 1, the elements of acc‐payoff and rej‐payoff can be illustrated in Figures 10.
The acc‐payoff matrix
The rej‐payoff matrix
Figure 10 Illustration of implementation result of acc‐payoff and rej‐payoff matrices
In this Exhibit the total payoff that will be obtained by agent 1 if it adopts all of its positions is 75 + 79 = 154, and the total payoff that will be obtained by agent 1 if it adopts all agent 2 positions is 25 + 21 = 46. In the other hand, the total payoff that will be obtained by agent 2 if it adopts all of its positions is 87 + 89 = 176, and the total payoff that will be obtained by agent 2 if it adopts all agent 1 positions is 13 + 11 = 24.
Therefore, the resulting Vpo‐matrix can be illustrated in Table 7.
Table 7 Illustration of the Vpo‐matrix
Agent 1 Agent 2
Agent 1 Vp1 = 154 Vpp2 = 24
Agent 2 Vpp1 = 46 Vp2 = 176
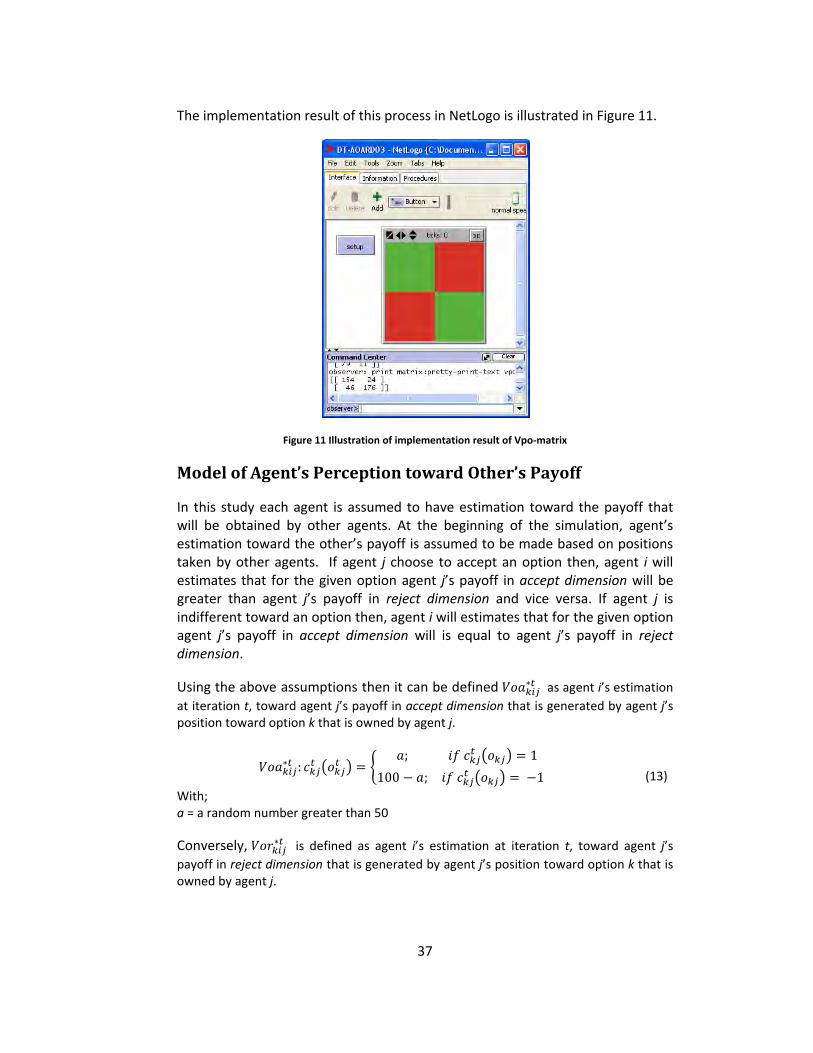
37
The implementation result of this process in NetLogo is illustrated in Figure 11.
Figure 11 Illustration of implementation result of Vpo‐matrix
Model of Agent’s Perception toward Other’s Payoff
In this study each agent is assumed to have estimation toward the payoff that will be obtained by other agents. At the beginning of the simulation, agent’s estimation toward the other’s payoff is assumed to be made based on positions taken by other agents. If agent j choose to accept an option then, agent i will estimates that for the given option agent j’s payoff in accept dimension will be greater than agent j’s payoff in reject dimension and vice versa. If agent j is indifferent toward an option then, agent i will estimates that for the given option agent j’s payoff in accept dimension will is equal to agent j’s payoff in reject dimension.
Using the above assumptions then it can be defined as agent i’s estimation at iteration t, toward agent j’s payoff in accept dimension that is generated by agent j’s position toward option k that is owned by agent j.
:; 1
100 ; 1
With; a = a random number greater than 50
(13)
Conversely, is defined as agent i’s estimation at iteration t, toward agent j’s payoff in reject dimension that is generated by agent j’s position toward option k that is owned by agent j.
38
:100 ; 1
; 1
With; a = a random number greater than 50
(14)
Therefore, agent i’s estimation toward agent j’s payoff that is generated by option k that is owned by agent j, can be calculated as follows:
:: ; 1: ; 1
(15)
At every iteration t, agent i will also estimate the payoff that will be obtained by agent j’s positions toward the other agent’s options. Let is agents i’s estimation toward agent j’s payoff in accept dimension that is generated by agent j’s position toward option belong to agent i. The value of is assigned as follows:
:; 1
50; 0100 ; 1
With; a = a random number greater than 50
(16)
Let is agents i’s estimation toward agent j’s payoff in reject dimension generated by aget j’s position toward option k that are belong to agent i. The value of is assigned as follows:
:100 ; 1
50; 0; 1
With; a = a random number greater than 50
(17)
Therefore, agent i’s estimation toward agent j’s payoffs that are generated by agent j’s positions toward other agent’s options can be calculated as follows:
:1
50; 01 (18)
Using equation (15) and (18), agent i’s estimation the total payoff of agent j’s by adopting all agent j’s positions at iteration t can be calculated as follows:
39
With; m = number option and i ≠ j.
(19)
In the other hand, agent i’s estimation toward agent j’s total payoff if agent j adopt all agent i’s positions then can be calculated as follows:
With; m = number option and i ≠ j.
(20)
In the implementation process, agent i’s estimation toward other agent’s payoffs in accept dimension are stored in per‐acc‐payoff‐i matrix and agent i’s estimation toward other agent’s payoffs in reject dimension are stored in per‐rej‐payoff‐i matrix. The columns of these matrices represent agents and the rows of the matrix represent options. All elements in the column that corresponds agent i, are set as zero.
Exhibit 3
Using conditions that was described in Exhibit 1, the per‐acc‐payoff‐1 matrix and the per‐acc‐payoff‐2 matrix in NetLogo is described in Figure 12.
per‐acc‐payoff‐1
per‐acc‐payoff‐2
Figure 12 Illustration of per‐acc‐payoff‐1 and per‐acc‐payoff‐2
40
While, the Figure 13 describes the implementation results of per‐rej‐payoff‐1 matrix and the per‐rej‐payoff‐2 matrix in NetLogo:
per‐rej‐payoff‐1
per‐rej‐payoff‐2
Figure 13 Illustration of per‐acc‐payoff‐1 and per‐acc‐payoff‐2
Using these matrices, agent 1’s estimation toward agent 2’s total payoff if agent 2 is adopting its own positions ( ) is 85 + 77 = 162. While, agent 1’s estimation toward agent 2’s total payoff if agent 2 is adopting agent 1’s positions ( ) is 15 + 23 = 38. In the other side, agent 2’s estimation toward agent 1’s total payoff if agent 1 is adopting its own positions ( ) is 90 + 70 = 160. While, agent 2’s estimation toward agent 1’s total payoff if agent 1 is adopting agent 2’s positions ( ) is 10 + 30 = 40.
Model of Threat
For each option that is owned by agent i, agent i has a threatened position . Threatened positions of all agents will construct a threat vector that is
described as follows:
, , , … . .
With; n = number of agent
(21)
This threat vector will generates payoff for each agent if all agents carry out their threatened future. Let is the total payoff of agent i if the threatened future is adopted. The value of can be calculated as follows.
41
With; m = number option and i ≠ j.
(22)
In the proposed model, threats of each agent serve as inputs in the form of array that is called as threat vector. Each element in this array represents an option. The total payoff for each agent that is calculated using the threat vector is stored as an array called Vpt‐vector. Each element in this array represents the total payoff obtained by each agent.
Exhibit 4 Suppose in Exhibit 1 the threat of agent 1 is to accept option O11 and the threat of agent 2 is to accept option O12, then the input vector for the simulation can be described as follows:
1 1 (23)
The first element of this array represents option O11 and the second element of this array represents option O12. Suppose the acc‐payoff and the rej‐payoff matrices in the simulation are as described in Figure 14.
Figure 14 Illustration of acc‐payoff and rej‐payoff matrices
Then, using threat vector described in equation (23) the total payoff for agent 1 if the treated future is adopted ( is 61 + 7 = 68. While, the total payoff for agent 2 if the treated future is adopted ( is 49 + 59 = 108. The Vpt‐vector result in this exhibit can be described in Figure 15.
Figure 15 Illustration of Vpt‐vector
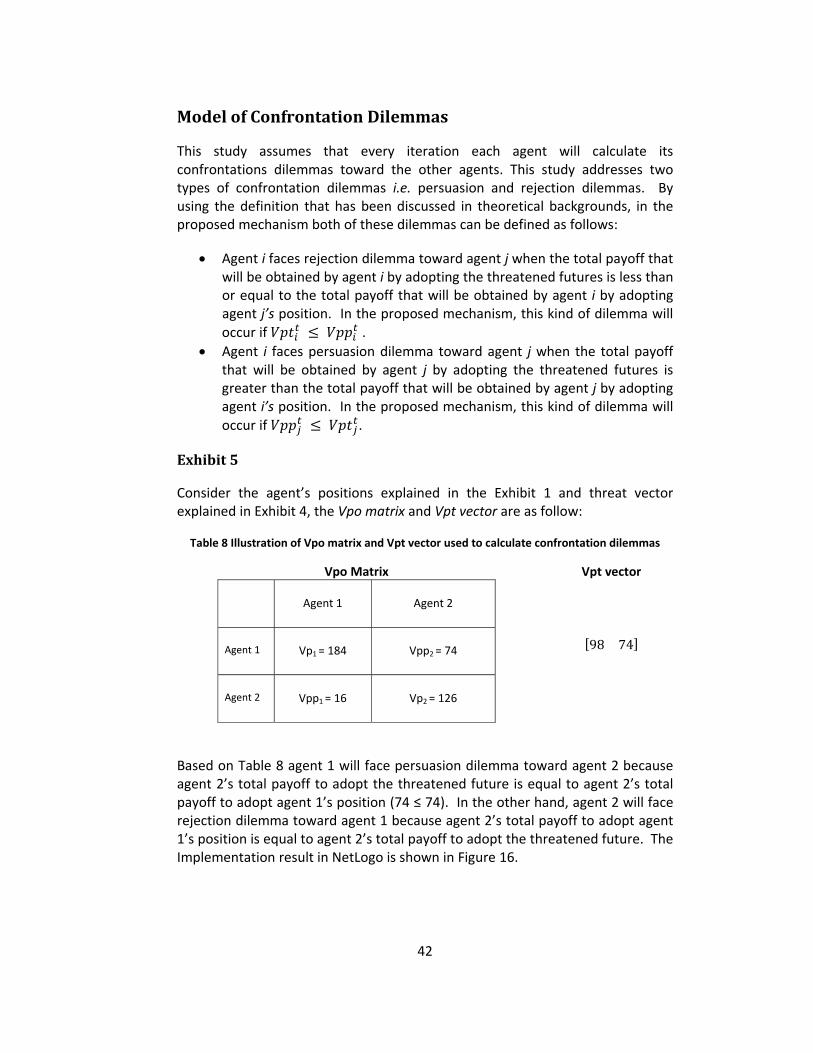
42
Model of Confrontation Dilemmas
This study assumes that every iteration each agent will calculate its confrontations dilemmas toward the other agents. This study addresses two types of confrontation dilemmas i.e. persuasion and rejection dilemmas. By using the definition that has been discussed in theoretical backgrounds, in the proposed mechanism both of these dilemmas can be defined as follows:
• Agent i faces rejection dilemma toward agent j when the total payoff that will be obtained by agent i by adopting the threatened futures is less than or equal to the total payoff that will be obtained by agent i by adopting agent j’s position. In the proposed mechanism, this kind of dilemma will occur if .
• Agent i faces persuasion dilemma toward agent j when the total payoff that will be obtained by agent j by adopting the threatened futures is greater than the total payoff that will be obtained by agent j by adopting agent i’s position. In the proposed mechanism, this kind of dilemma will occur if .
Exhibit 5
Consider the agent’s positions explained in the Exhibit 1 and threat vector explained in Exhibit 4, the Vpo matrix and Vpt vector are as follow:
Table 8 Illustration of Vpo matrix and Vpt vector used to calculate confrontation dilemmas
Vpo Matrix Vpt vector
Agent 1 Agent 2
Agent 1 Vp1 = 184 Vpp2 = 74
Agent 2 Vpp1 = 16 Vp2 = 126
98 74
Based on Table 8 agent 1 will face persuasion dilemma toward agent 2 because agent 2’s total payoff to adopt the threatened future is equal to agent 2’s total payoff to adopt agent 1’s position (74 ≤ 74). In the other hand, agent 2 will face rejection dilemma toward agent 1 because agent 2’s total payoff to adopt agent 1’s position is equal to agent 2’s total payoff to adopt the threatened future. The Implementation result in NetLogo is shown in Figure 16.
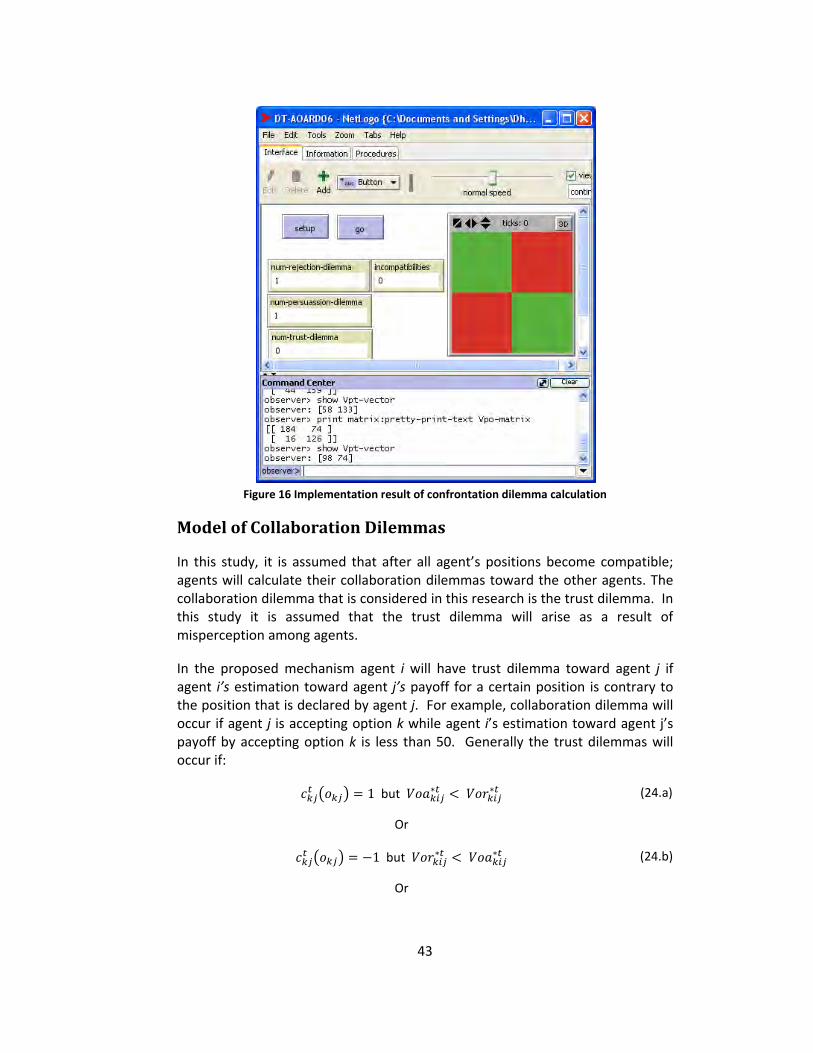
43
Figure 16 Implementation result of confrontation dilemma calculation
Model of Collaboration Dilemmas
In this study, it is assumed that after all agent’s positions become compatible; agents will calculate their collaboration dilemmas toward the other agents. The collaboration dilemma that is considered in this research is the trust dilemma. In this study it is assumed that the trust dilemma will arise as a result of misperception among agents.
In the proposed mechanism agent i will have trust dilemma toward agent j if agent i’s estimation toward agent j’s payoff for a certain position is contrary to the position that is declared by agent j. For example, collaboration dilemma will occur if agent j is accepting option k while agent i’s estimation toward agent j’s payoff by accepting option k is less than 50. Generally the trust dilemmas will occur if:
1 but (24.a)
Or
1 but (24.b)
Or
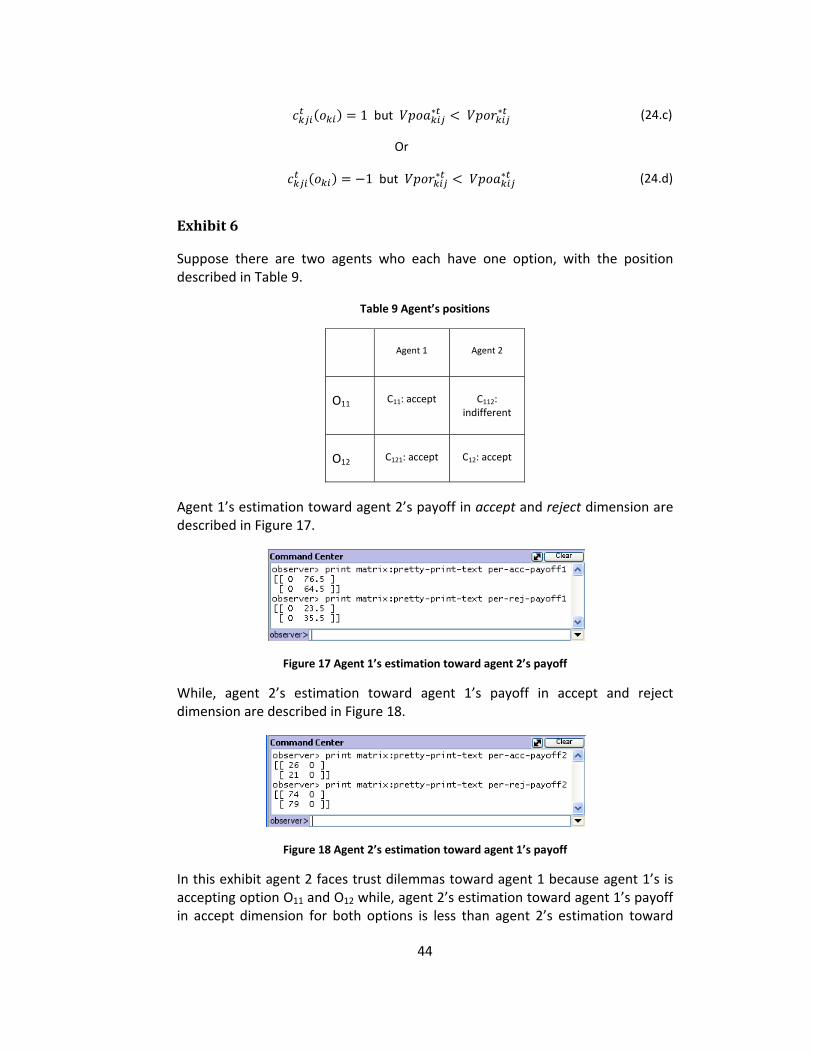
44
1 but (24.c)
Or
1 but (24.d)
Exhibit 6
Suppose there are two agents who each have one option, with the position described in Table 9.
Table 9 Agent’s positions
Agent 1 Agent 2
O11 C11: accept C112: indifferent
O12 C121: accept C12: accept
Agent 1’s estimation toward agent 2’s payoff in accept and reject dimension are described in Figure 17.
Figure 17 Agent 1’s estimation toward agent 2’s payoff
While, agent 2’s estimation toward agent 1’s payoff in accept and reject dimension are described in Figure 18.
Figure 18 Agent 2’s estimation toward agent 1’s payoff
In this exhibit agent 2 faces trust dilemmas toward agent 1 because agent 1’s is accepting option O11 and O12 while, agent 2’s estimation toward agent 1’s payoff in accept dimension for both options is less than agent 2’s estimation toward
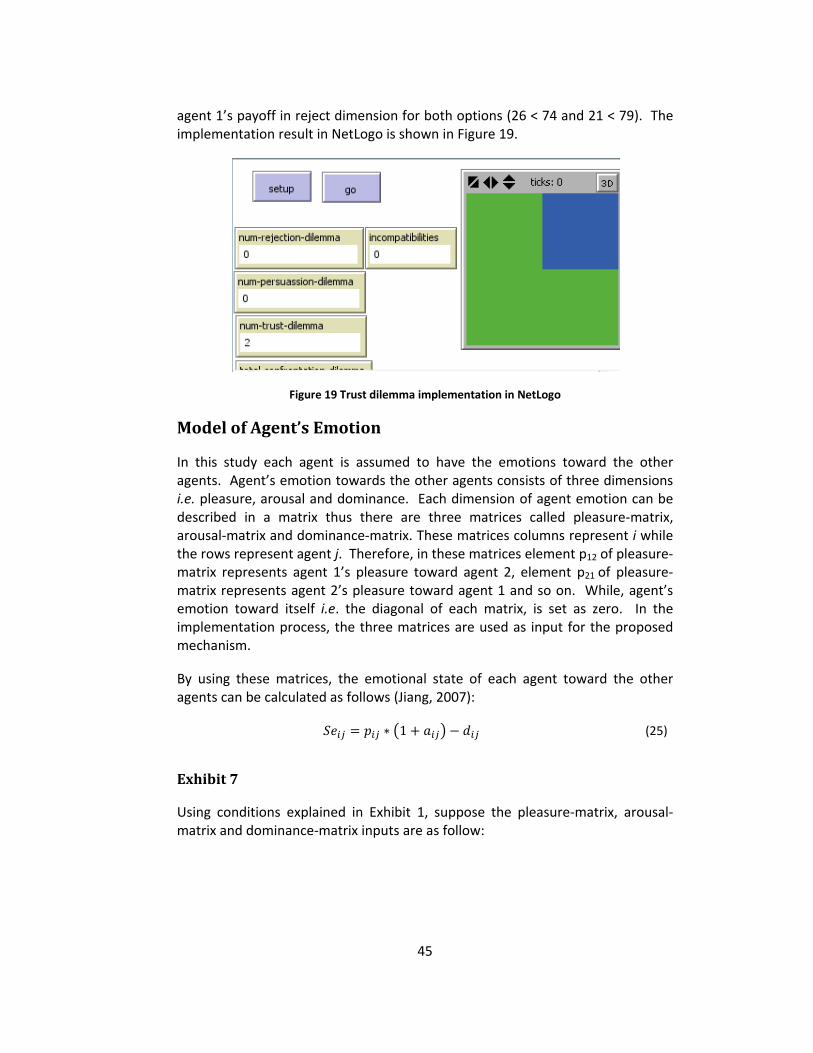
45
agent 1’s payoff in reject dimension for both options (26 < 74 and 21 < 79). The implementation result in NetLogo is shown in Figure 19.
Figure 19 Trust dilemma implementation in NetLogo
Model of Agent’s Emotion
In this study each agent is assumed to have the emotions toward the other agents. Agent’s emotion towards the other agents consists of three dimensions i.e. pleasure, arousal and dominance. Each dimension of agent emotion can be described in a matrix thus there are three matrices called pleasure‐matrix, arousal‐matrix and dominance‐matrix. These matrices columns represent i while the rows represent agent j. Therefore, in these matrices element p12 of pleasure‐matrix represents agent 1’s pleasure toward agent 2, element p21 of pleasure‐matrix represents agent 2’s pleasure toward agent 1 and so on. While, agent’s emotion toward itself i.e. the diagonal of each matrix, is set as zero. In the implementation process, the three matrices are used as input for the proposed mechanism.
By using these matrices, the emotional state of each agent toward the other agents can be calculated as follows (Jiang, 2007):
1 (25)
Exhibit 7
Using conditions explained in Exhibit 1, suppose the pleasure‐matrix, arousal‐matrix and dominance‐matrix inputs are as follow:
46
Pleasure‐matrix
0 0.51 0
arousal‐matrix
0 0.51 0
dominance‐matrix
0 0.51 0
(26)
Using the above matrices the emotional state of agent 1 toward agent 2 is Se12 = 1 ( 1 + 1) – 1 = 1. While, the emotional state of agent 2 toward agent 1 is Se21 = 0.5 (1 + 0.5) – 0.5 = 0.25. The implementation result in NetLogo is shown in Figure 20.
Figure 20 Agent’s emotional state calculation
Model of Negotiation Protocol
In this study, agents are assumed to negotiate each other using rational negotiation approach in which, an agent will sacrifice some of its payoff in order to shift its opponent’s positions. In each iteration , , … agent i and agent j will negotiate each other if there are dilemmas among them. From the present position and agent i and agent j will negotiate options in which they have incompatible positions (agent i accept and agent j reject or vice versa). Agent i will gives offer to agent j using strategy ( ) and emotional state ( ) with value:
With; = agent i’s strategy is a random number between 0 and 10
(27)
This equation shows how much the effect of negotiation conducted by agent i toward the shift of agent i’s payoff. The value of strategy will reduce agent i’s payoff in the dimension that is chosen by agent i and increase agent i’s payoff in the dimension that is not chosen by agent i. Thus, after giving offer to agent j, element of agent i’s payoff in accept dimension will change as follow:
; 1; 1
(28)
While element of agent i’s payoff in reject dimension will change as follow:
47
; 1; 1
(29)
Rules described in equation (28) and (29) also apply when agent i is negotiating options belong to other agents.
After agent i give offer to agent j, agent i’s estimation toward agent j’s payoff will change. The value of strategy will reduce agent i’s estimation toward agent j’s payoff in the dimension that is chosen by agent j and increase agent i’s estimation toward agent j’s payoff in the dimension that is not chosen by agent j. Thus, after giving an offer to agent j, element of agent i’s estimation toward agent j’s payoff in accept dimension will change as follow:
; 1; 1
(30)
While element of agent i’s estimation toward agent j’s payoff in reject dimension will change as follow:
; 1; 1
(31)
Rules described in equation (30) and (31) also apply when agent i is negotiating options belong to other agents.
After receiving agent i’s offer, agent j with emotional state will then perceives agent i’s offer as follows:
(32)
Agent j’s perception toward agent i’s offer will then reduce agent j’s payoff in the dimension that is chosen by agent j and increase agent j’s payoff in the dimension that is not chosen by agent j. Thus, after receiving offer from agent i, element of agent j’s payoff in accept dimension will change as follow:
; 1; 1
(33)
While element of agent j’s payoff in reject dimension will change as follow:
; 1; 1
(34)
Rules described in equation (33) and (34) also apply when agent i is negotiating options belong to other agents.
48
Agent j’s perception toward agent i’s offer will also affect agent j’s estimation toward agent i’s payoff. It will reduce agent j’s estimation toward agent i’s payoff in the dimension that is chosen by agent i and increase agent j’s estimation toward agent i’s payoff in the dimension that is not chosen by agent i. Thus, after receiving offer from agent i, element of agent j’s estimation toward agent i’s payoff in accept dimension will change as follow:
; 1; 1
(35)
While element of agent j’s estimation toward agent i’s payoff in reject dimension will change as follow:
; 1; 1
(36)
Rules described in equation (35) and (36) also apply when agent i is negotiating options belong to other agents.
Exhibit 8
Suppose there are two agents with options that are explained in Exhibit 1. The payoffs of both agents in accept and reject dimensions are described in Figure 21.
Figure 21 Agent’s acc‐payoff and rej‐payoff
Agent 1’s estimation toward agent 2’s payoffs in accept and reject dimension are described in Figure 22.
Figure 22 Agent 1’s estimation toward agent 2’s payoff
While, agent 2’s perception toward agent 1’s payoffs in accept and reject dimension are described in Figure 23.
49
Figure 23 Agent 2’s estimation toward agent 1’s payoff
The pleasure, arousal and dominance dimension of each agent are described in Figure 24.
Figure 24 Pleasure, arousal and dominance dimension of each agent
By using the positions that have been explained in Exhibit 1, then in the first round of negotiation, agent 1 and agent 2 have incompatible position in option O11, which is accepted by agent 1 and is rejected by agent 2. Agent 1 has the first opportunity to give offer to agent 2. By using emotion matrices in Figure 24, then in the first round of negotiation agent 1’s emotional state toward agent 2 (Seij) and agent 2’s emotional state toward agent 1 (Seji) are as follows.
Agent 1 will then give offer to agent 2. Suppose the strategy used by agent 1 is equal to 1. Since agent 1 is accepting option O11 then agent 1’s apayoff will change from 91 to 91 ‐ 1 = 90 in accept dimension and from 9 to 9 + 1 = 10 in reject dimension. The new payoff matrices of agent 1 after it gives offer to agent 2 are described in Figure 25.
Figure 25 Agent 1’s payoff matrices after giving option to agent 2
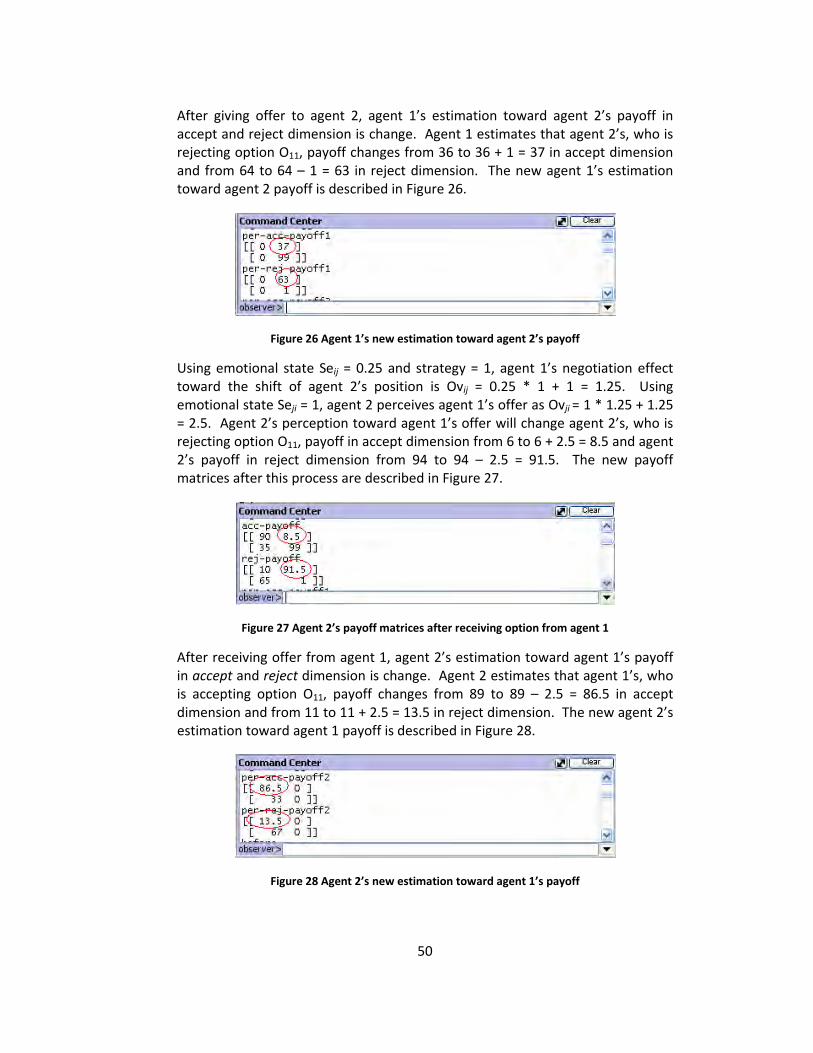
50
After giving offer to agent 2, agent 1’s estimation toward agent 2’s payoff in accept and reject dimension is change. Agent 1 estimates that agent 2’s, who is rejecting option O11, payoff changes from 36 to 36 + 1 = 37 in accept dimension and from 64 to 64 – 1 = 63 in reject dimension. The new agent 1’s estimation toward agent 2 payoff is described in Figure 26.
Figure 26 Agent 1’s new estimation toward agent 2’s payoff
Using emotional state Seij = 0.25 and strategy = 1, agent 1’s negotiation effect toward the shift of agent 2’s position is Ovij = 0.25 * 1 + 1 = 1.25. Using emotional state Seji = 1, agent 2 perceives agent 1’s offer as Ovji = 1 * 1.25 + 1.25 = 2.5. Agent 2’s perception toward agent 1’s offer will change agent 2’s, who is rejecting option O11, payoff in accept dimension from 6 to 6 + 2.5 = 8.5 and agent 2’s payoff in reject dimension from 94 to 94 – 2.5 = 91.5. The new payoff matrices after this process are described in Figure 27.
Figure 27 Agent 2’s payoff matrices after receiving option from agent 1
After receiving offer from agent 1, agent 2’s estimation toward agent 1’s payoff in accept and reject dimension is change. Agent 2 estimates that agent 1’s, who is accepting option O11, payoff changes from 89 to 89 – 2.5 = 86.5 in accept dimension and from 11 to 11 + 2.5 = 13.5 in reject dimension. The new agent 2’s estimation toward agent 1 payoff is described in Figure 28.
Figure 28 Agent 2’s new estimation toward agent 1’s payoff
51
Model of Emotion Dynamics
After agent i give offer to agent j, agent i will evaluate agent j’s response toward its offer. Agent j’s response will affect agent i’s emotional state toward agent j in the next iteration. To model the dynamics of agent’s emotional state, this research adopts the Flow Model of Emotion concept (Morgado & Gaspar, 2003).
In Flow Model of Emotion concept, there are factors that affect the dynamics of emotional state that are:
1. Achievement potential (p), which describes the potential magnitude of change that can be done by agents to the environment in order to achieve the desired conditions. Because in the drama theory framework the desired condition is the dilemma‐free condition, and this condition will be achieved by negotiations among agents, potential achievement owned by agent i at every negotiation is assumed to be proportional to the offer that is given by agent i (Ovij).
2. Achievement conductive (q), which describes the level of conductivity (facilitating, receiving) and resistivity (block, reject) from the environment to the changes proposed by an agent. In this study the resistance experienced by the agent i is assumed to be proportional to the perception of agent j toward agent i’s offer (Ovji).
Using the above definitions the emotional disposition can be defined as:
, , (37)
The possible combination of and is related with the feelings experienced by the agents in the real world that are resulted by the negotiation outcomes. Unfortunately, although it can describe the emotional condition numerically, the PAD model does not map the feelings experienced by the agent into the emotional state. To overcome this problem the Ortony, Clore, Collins (Ortony, Clore, & Collins, 1988) emotion model is adopted. OCC model can facilitate the classification of emotional state based on the feelings experienced by the agent, but cannot describe it numerically therefore the OCC is needs to be mapped back to PAD model (Gebhard, 2005). The mapping process is described in Table 10.
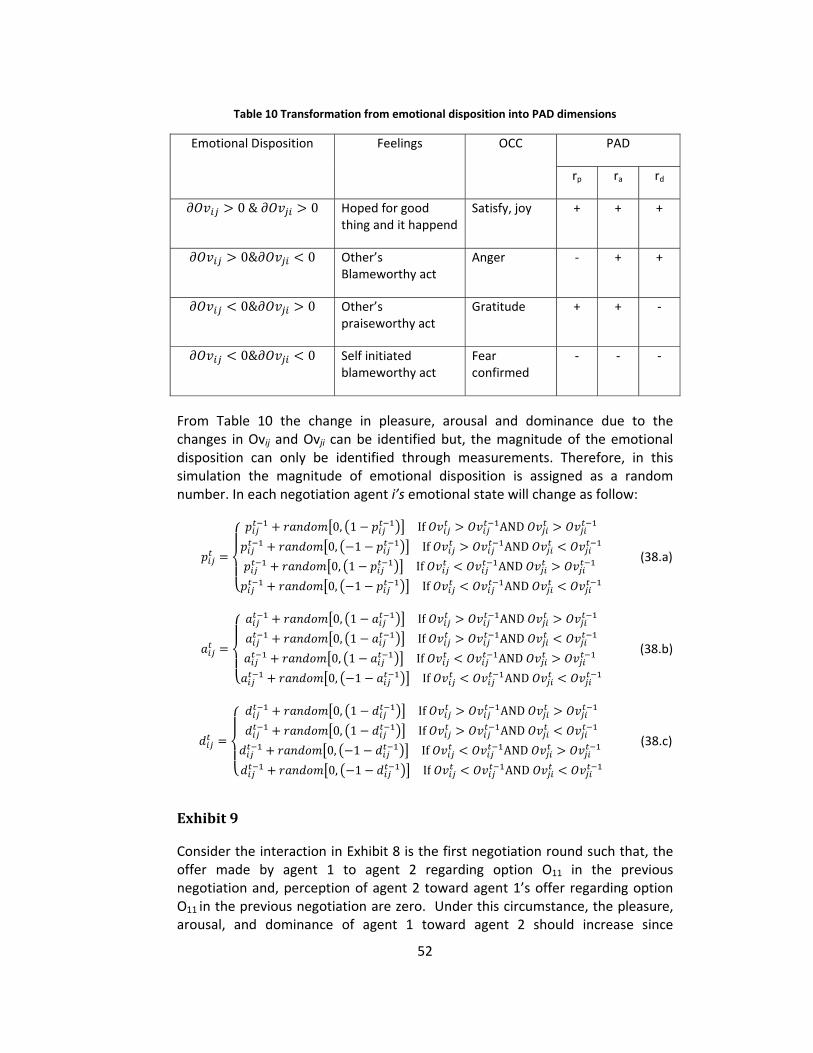
52
Table 10 Transformation from emotional disposition into PAD dimensions
Emotional Disposition Feelings OCC PAD
rp ra rd
0 & 0 Hoped for good thing and it happend
Satisfy, joy + + +
0& 0 Other’s Blameworthy act
Anger ‐ + +
0& 0 Other’s praiseworthy act
Gratitude + + ‐
0& 0 Self initiated blameworthy act
Fear confirmed
‐ ‐ ‐
From Table 10 the change in pleasure, arousal and dominance due to the changes in Ovij and Ovji can be identified but, the magnitude of the emotional disposition can only be identified through measurements. Therefore, in this simulation the magnitude of emotional disposition is assigned as a random number. In each negotiation agent i’s emotional state will change as follow:
0, 1 If AND0, 1 If AND0, 1 If AND
0, 1 If AND
(38.a)
0, 1 If AND0, 1 If AND0, 1 If AND
0, 1 If AND
(38.b)
0, 1 If AND0, 1 If AND
0, 1 If AND 0, 1 If AND
(38.c)
Exhibit 9
Consider the interaction in Exhibit 8 is the first negotiation round such that, the offer made by agent 1 to agent 2 regarding option O11 in the previous negotiation and, perception of agent 2 toward agent 1’s offer regarding option O11 in the previous negotiation are zero. Under this circumstance, the pleasure, arousal, and dominance of agent 1 toward agent 2 should increase since
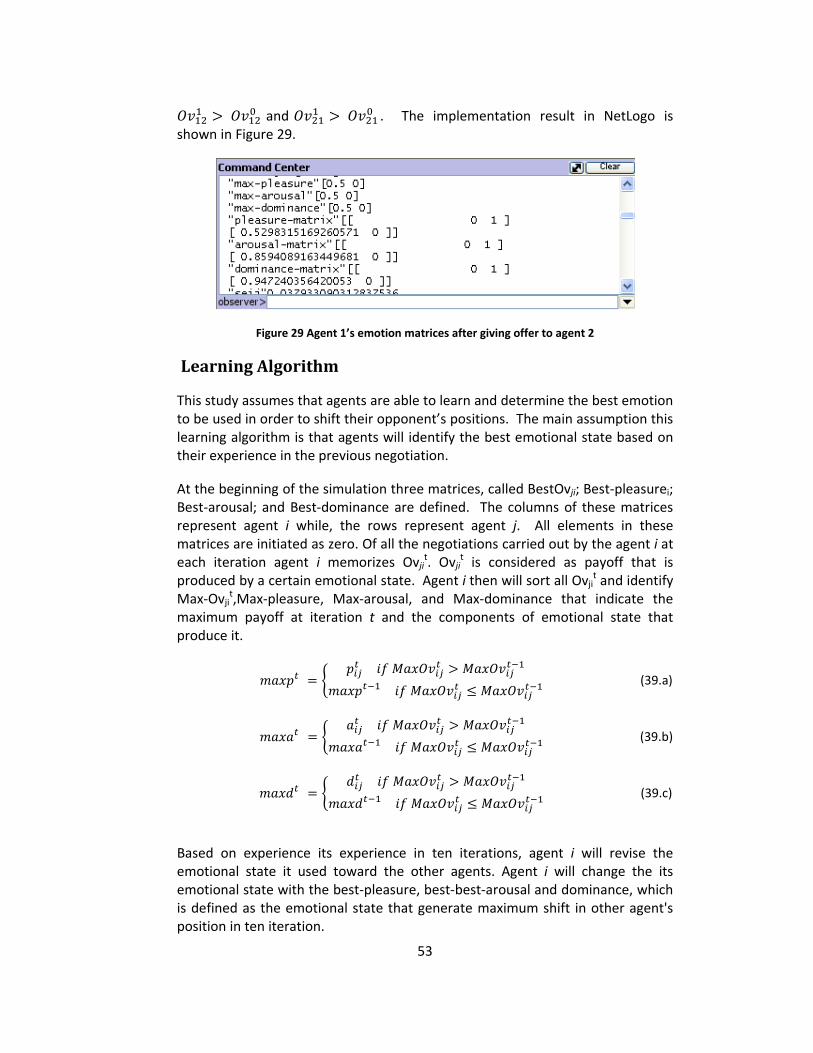
53
and . The implementation result in NetLogo is shown in Figure 29.
Figure 29 Agent 1’s emotion matrices after giving offer to agent 2
Learning Algorithm
This study assumes that agents are able to learn and determine the best emotion to be used in order to shift their opponent’s positions. The main assumption this learning algorithm is that agents will identify the best emotional state based on their experience in the previous negotiation.
At the beginning of the simulation three matrices, called BestOvji; Best‐pleasurei; Best‐arousal; and Best‐dominance are defined. The columns of these matrices represent agent i while, the rows represent agent j. All elements in these matrices are initiated as zero. Of all the negotiations carried out by the agent i at each iteration agent i memorizes Ovji
t. Ovjit is considered as payoff that is
produced by a certain emotional state. Agent i then will sort all Ovjit and identify
Max‐Ovjit,Max‐pleasure, Max‐arousal, and Max‐dominance that indicate the
maximum payoff at iteration t and the components of emotional state that produce it.
(39.a)
(39.b)
(39.c)
Based on experience its experience in ten iterations, agent i will revise the emotional state it used toward the other agents. Agent i will change the its emotional state with the best‐pleasure, best‐best‐arousal and dominance, which is defined as the emotional state that generate maximum shift in other agent's position in ten iteration.
54
EXPERIMENTS
In this study four experiments are conducted. The first experiment aims to examine the model sensitivity to the variations agents’ emotion. This experiment was designed to answer two questions. The first question is whether the variation of agents’ emotion has impacts on the number of iterations required to eliminate confrontation dilemmas and the number of trust dilemma that arise at the end of the conflict. The second question is whether the answer of the first question also applies to the other conflict situations. To answer the second question the results obtained from the first scenario and from the second scenario are compared.
The second and third experiments aim to test the model’s feasibility in describing the trend of agent’s emotion and the majority of agent’s positions that may appear. The model is considered to be feasible if its predictions regarding the trend of agent’s emotion and the majority of agent’s positions are valid generally. Since this model is initiated with arbitrary inputs gathered from observation data then the model is expected to produce prediction type 1 and/or type 2, with accuracy level 1. By assuming that the observed pattern in the real world as a subset of all possible pattern, in this study the model is considered to be valid if at least one of simulation results can mimic the pattern in the real world.
The meaning of feasible in this study is that the proposed models can be used to assist agents in the real world in facing conflict situation. Feasible and valid have overlapping meanings. Generally, valid means something that can be accepted as legitimately and logically (WrodNet Search 3.1; Wikitionary.org) while; feasible means something that is capable of being done with means at hand and circumstances as they are (WrodNet Search 3.1; Wikitionary.org). Not all valid solutions /answers are feasible to be used. But all answers/solutions that are produced by something that is feasible must able to satisfy all constraint (valid answer) (Wikipedia.org). With this understanding, the proposed model will be considered as feasible to be used if the model can produce valid solutions in all cases tested in the experiment. Model’s feasibility is tested by comparing the experiment results from the first scenario and the second scenario in each experiment. If the model is valid for more than one scenario then it is feasible to be used in describing the trend of agent’s emotion and the majority of agent’s positions that may appear and therefore, it can be used to give recommendation for the decision makers in the real world.
In the fourth experiment, recommendations that can be proposed to the agents in Citarum River basin conflict are explored. By using the latest conflict situation, emotions that should be used by agents in order to obtain conflict’s resolution that can help to improve the condition of the Citarum River are examined.
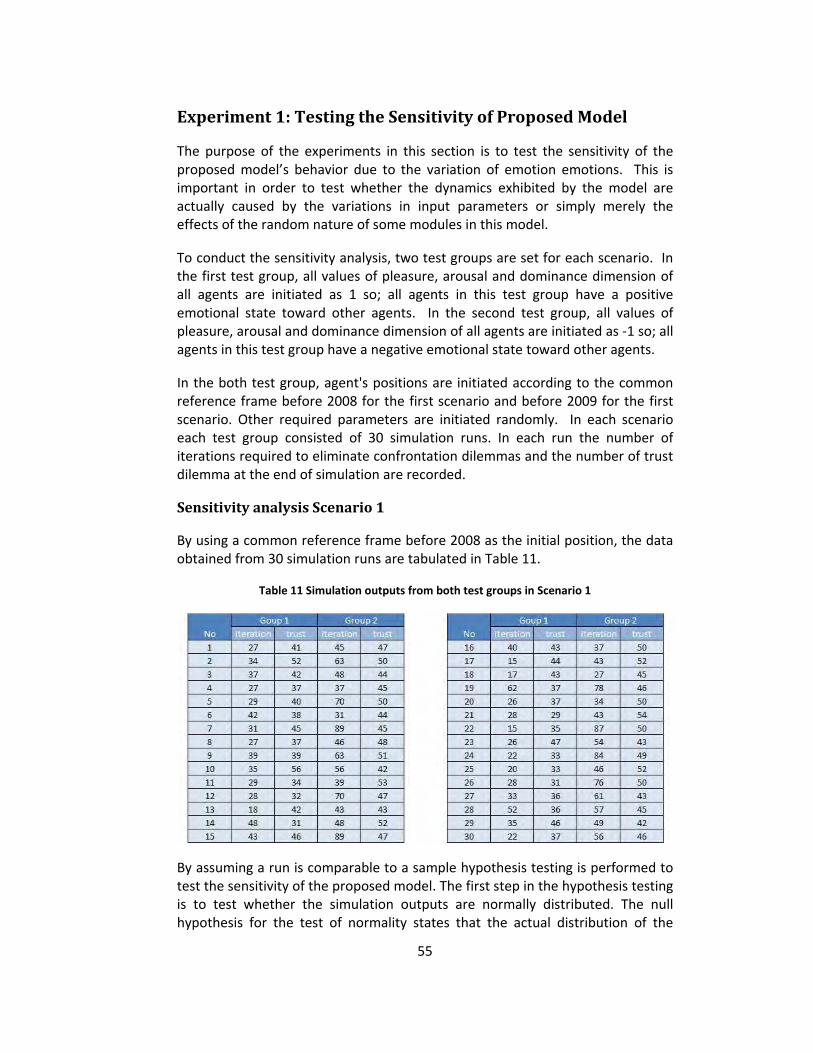
55
Experiment 1: Testing the Sensitivity of Proposed Model
The purpose of the experiments in this section is to test the sensitivity of the proposed model’s behavior due to the variation of emotion emotions. This is important in order to test whether the dynamics exhibited by the model are actually caused by the variations in input parameters or simply merely the effects of the random nature of some modules in this model.
To conduct the sensitivity analysis, two test groups are set for each scenario. In the first test group, all values of pleasure, arousal and dominance dimension of all agents are initiated as 1 so; all agents in this test group have a positive emotional state toward other agents. In the second test group, all values of pleasure, arousal and dominance dimension of all agents are initiated as ‐1 so; all agents in this test group have a negative emotional state toward other agents.
In the both test group, agent's positions are initiated according to the common reference frame before 2008 for the first scenario and before 2009 for the first scenario. Other required parameters are initiated randomly. In each scenario each test group consisted of 30 simulation runs. In each run the number of iterations required to eliminate confrontation dilemmas and the number of trust dilemma at the end of simulation are recorded.
Sensitivity analysis Scenario 1
By using a common reference frame before 2008 as the initial position, the data obtained from 30 simulation runs are tabulated in Table 11.
Table 11 Simulation outputs from both test groups in Scenario 1
By assuming a run is comparable to a sample hypothesis testing is performed to test the sensitivity of the proposed model. The first step in the hypothesis testing is to test whether the simulation outputs are normally distributed. The null hypothesis for the test of normality states that the actual distribution of the
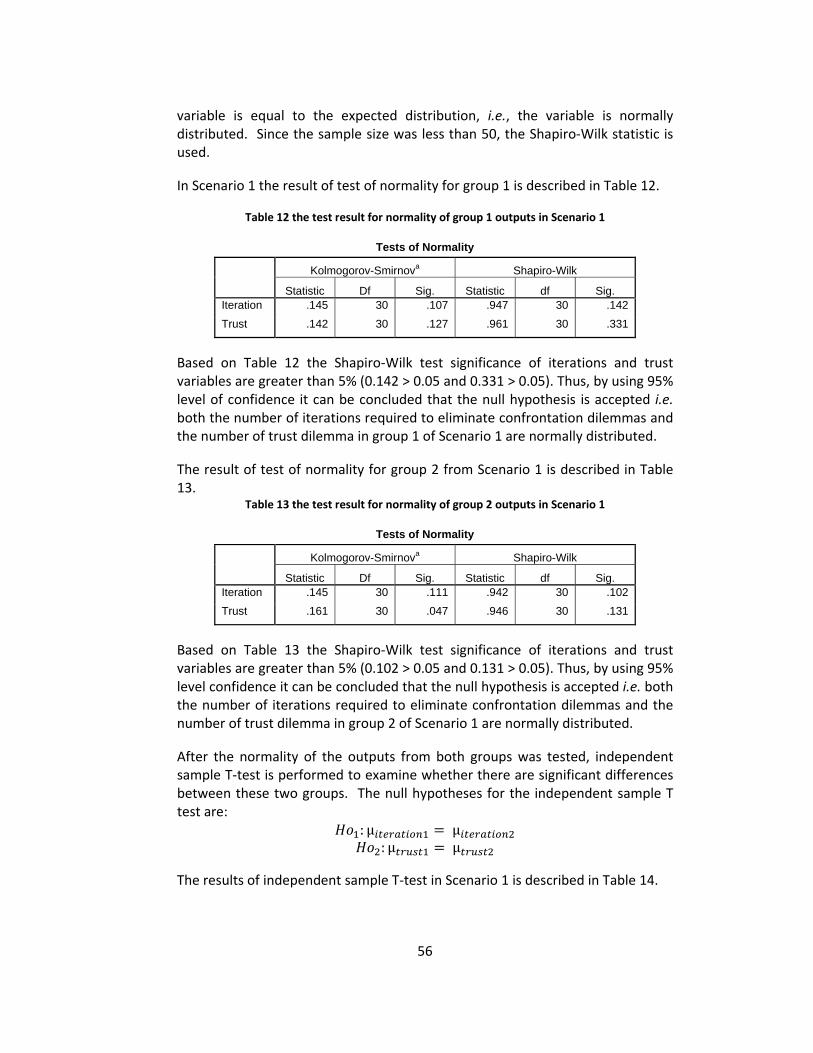
56
variable is equal to the expected distribution, i.e., the variable is normally distributed. Since the sample size was less than 50, the Shapiro‐Wilk statistic is used.
In Scenario 1 the result of test of normality for group 1 is described in Table 12.
Table 12 the test result for normality of group 1 outputs in Scenario 1
Tests of Normality
Kolmogorov-Smirnova Shapiro-Wilk Statistic Df Sig. Statistic df Sig.
Iteration .145 30 .107 .947 30 .142
Trust .142 30 .127 .961 30 .331
Based on Table 12 the Shapiro‐Wilk test significance of iterations and trust variables are greater than 5% (0.142 > 0.05 and 0.331 > 0.05). Thus, by using 95% level of confidence it can be concluded that the null hypothesis is accepted i.e. both the number of iterations required to eliminate confrontation dilemmas and the number of trust dilemma in group 1 of Scenario 1 are normally distributed.
The result of test of normality for group 2 from Scenario 1 is described in Table 13.
Table 13 the test result for normality of group 2 outputs in Scenario 1
Tests of Normality
Kolmogorov-Smirnova Shapiro-Wilk Statistic Df Sig. Statistic df Sig.
Iteration .145 30 .111 .942 30 .102
Trust .161 30 .047 .946 30 .131
Based on Table 13 the Shapiro‐Wilk test significance of iterations and trust variables are greater than 5% (0.102 > 0.05 and 0.131 > 0.05). Thus, by using 95% level confidence it can be concluded that the null hypothesis is accepted i.e. both the number of iterations required to eliminate confrontation dilemmas and the number of trust dilemma in group 2 of Scenario 1 are normally distributed.
After the normality of the outputs from both groups was tested, independent sample T‐test is performed to examine whether there are significant differences between these two groups. The null hypotheses for the independent sample T test are:
: μ μ : μ μ
The results of independent sample T‐test in Scenario 1 is described in Table 14.
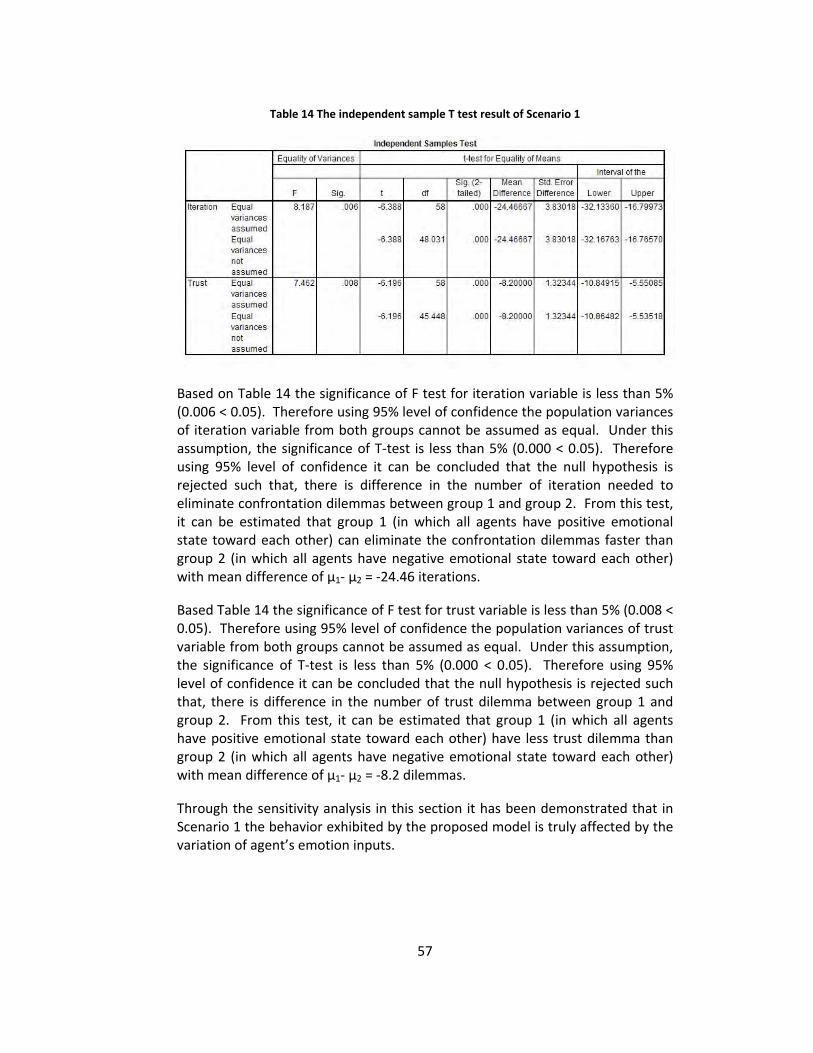
57
Table 14 The independent sample T test result of Scenario 1
Based on Table 14 the significance of F test for iteration variable is less than 5% (0.006 < 0.05). Therefore using 95% level of confidence the population variances of iteration variable from both groups cannot be assumed as equal. Under this assumption, the significance of T‐test is less than 5% (0.000 < 0.05). Therefore using 95% level of confidence it can be concluded that the null hypothesis is rejected such that, there is difference in the number of iteration needed to eliminate confrontation dilemmas between group 1 and group 2. From this test, it can be estimated that group 1 (in which all agents have positive emotional state toward each other) can eliminate the confrontation dilemmas faster than group 2 (in which all agents have negative emotional state toward each other) with mean difference of µ1‐ µ2 = ‐24.46 iterations.
Based Table 14 the significance of F test for trust variable is less than 5% (0.008 < 0.05). Therefore using 95% level of confidence the population variances of trust variable from both groups cannot be assumed as equal. Under this assumption, the significance of T‐test is less than 5% (0.000 < 0.05). Therefore using 95% level of confidence it can be concluded that the null hypothesis is rejected such that, there is difference in the number of trust dilemma between group 1 and group 2. From this test, it can be estimated that group 1 (in which all agents have positive emotional state toward each other) have less trust dilemma than group 2 (in which all agents have negative emotional state toward each other) with mean difference of µ1‐ µ2 = ‐8.2 dilemmas.
Through the sensitivity analysis in this section it has been demonstrated that in Scenario 1 the behavior exhibited by the proposed model is truly affected by the variation of agent’s emotion inputs.
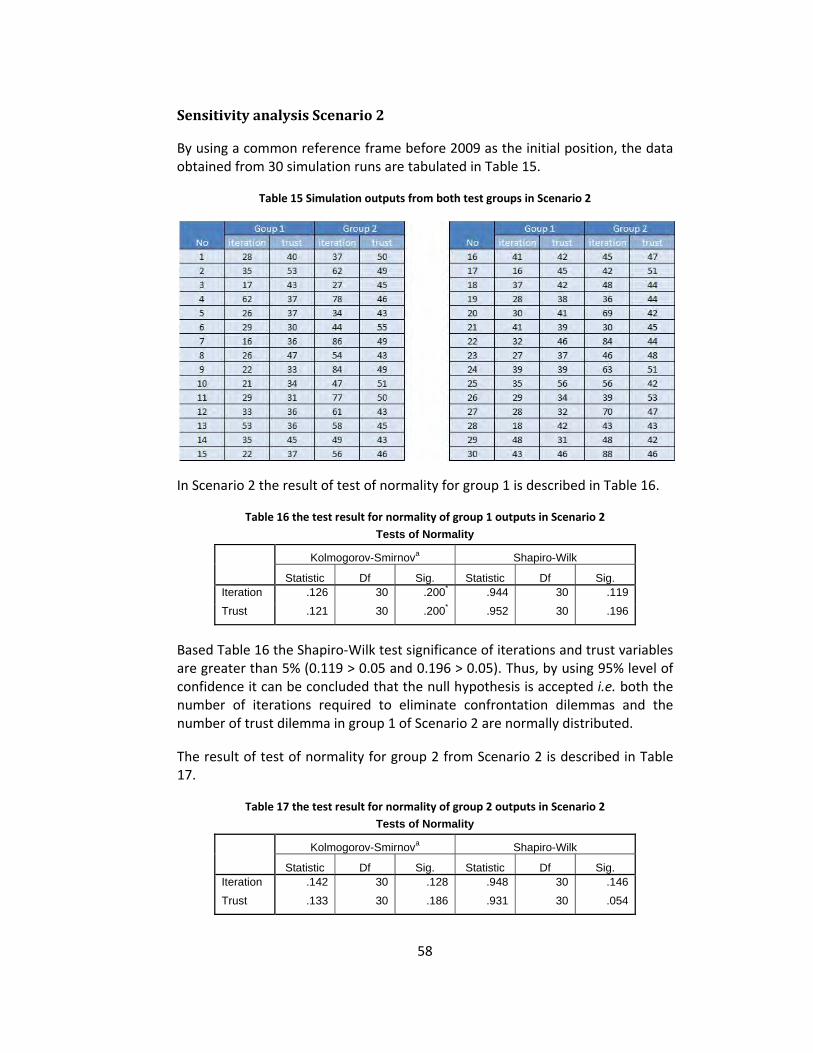
58
Sensitivity analysis Scenario 2
By using a common reference frame before 2009 as the initial position, the data obtained from 30 simulation runs are tabulated in Table 15.
Table 15 Simulation outputs from both test groups in Scenario 2
In Scenario 2 the result of test of normality for group 1 is described in Table 16.
Table 16 the test result for normality of group 1 outputs in Scenario 2 Tests of Normality
Kolmogorov-Smirnova Shapiro-Wilk Statistic Df Sig. Statistic Df Sig.
Iteration .126 30 .200* .944 30 .119
Trust .121 30 .200* .952 30 .196
Based Table 16 the Shapiro‐Wilk test significance of iterations and trust variables are greater than 5% (0.119 > 0.05 and 0.196 > 0.05). Thus, by using 95% level of confidence it can be concluded that the null hypothesis is accepted i.e. both the number of iterations required to eliminate confrontation dilemmas and the number of trust dilemma in group 1 of Scenario 2 are normally distributed.
The result of test of normality for group 2 from Scenario 2 is described in Table 17.
Table 17 the test result for normality of group 2 outputs in Scenario 2 Tests of Normality
Kolmogorov-Smirnova Shapiro-Wilk Statistic Df Sig. Statistic Df Sig.
Iteration .142 30 .128 .948 30 .146
Trust .133 30 .186 .931 30 .054
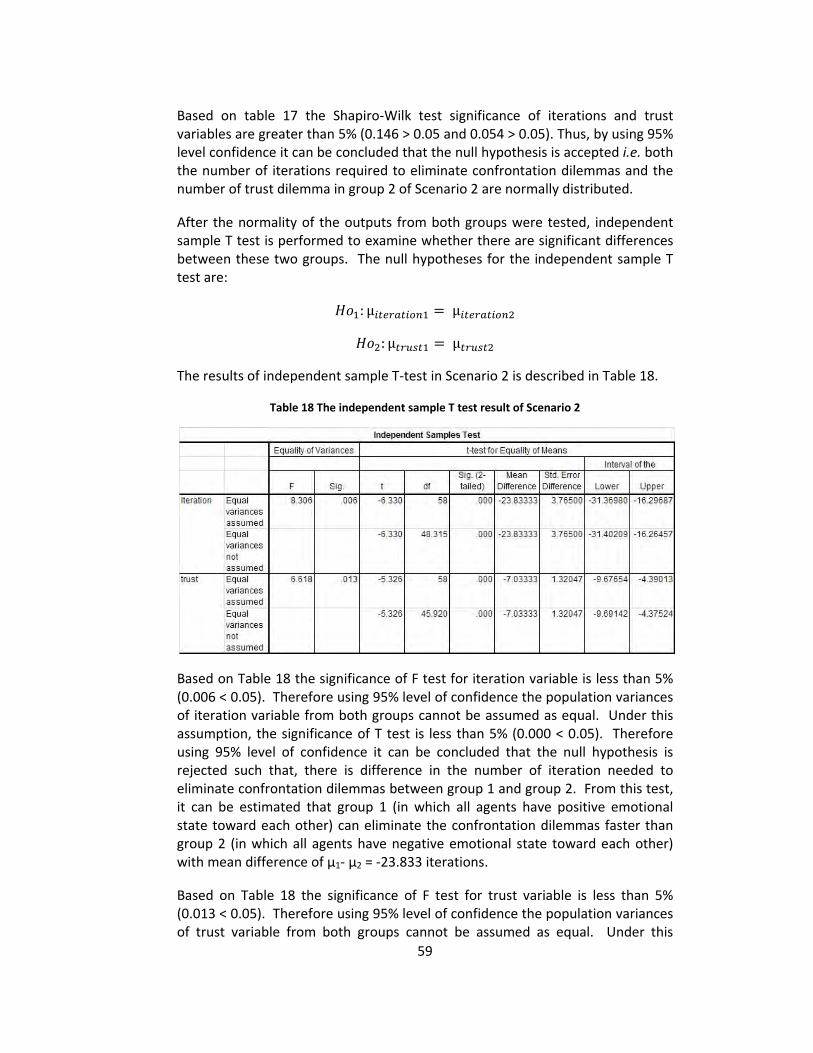
59
Based on table 17 the Shapiro‐Wilk test significance of iterations and trust variables are greater than 5% (0.146 > 0.05 and 0.054 > 0.05). Thus, by using 95% level confidence it can be concluded that the null hypothesis is accepted i.e. both the number of iterations required to eliminate confrontation dilemmas and the number of trust dilemma in group 2 of Scenario 2 are normally distributed.
After the normality of the outputs from both groups were tested, independent sample T test is performed to examine whether there are significant differences between these two groups. The null hypotheses for the independent sample T test are:
: μ μ
: μ μ
The results of independent sample T‐test in Scenario 2 is described in Table 18.
Table 18 The independent sample T test result of Scenario 2
Based on Table 18 the significance of F test for iteration variable is less than 5% (0.006 < 0.05). Therefore using 95% level of confidence the population variances of iteration variable from both groups cannot be assumed as equal. Under this assumption, the significance of T test is less than 5% (0.000 < 0.05). Therefore using 95% level of confidence it can be concluded that the null hypothesis is rejected such that, there is difference in the number of iteration needed to eliminate confrontation dilemmas between group 1 and group 2. From this test, it can be estimated that group 1 (in which all agents have positive emotional state toward each other) can eliminate the confrontation dilemmas faster than group 2 (in which all agents have negative emotional state toward each other) with mean difference of µ1‐ µ2 = ‐23.833 iterations.
Based on Table 18 the significance of F test for trust variable is less than 5% (0.013 < 0.05). Therefore using 95% level of confidence the population variances of trust variable from both groups cannot be assumed as equal. Under this
60
assumption, the significance of T‐test is less than 5% (0.000 < 0.05). Therefore using 95% level of confidence it can be concluded that the null hypothesis is rejected such that, there is difference in the number of trust dilemma between group 1 and group 2. From this test, it can be estimated that group 1 (in which all agents have positive emotional state toward each other) have less trust dilemma than group 2 (in which all agents have negative emotional state toward each other) with mean difference of µ1‐ µ2 = ‐7.033 dilemmas.
Through the sensitivity analysis in this section it has been demonstrated that in Scenario 2 the behavior exhibited by the proposed model is truly affected by the variation of agent’s emotion inputs.
By comparing the results obtained in Scenario 1 and Scenario 2, it can be concluded that the proposed model robust to the variations of the initial common reference frame. This means that although the proposed model is supplied with different initial common reference frame the behavior shown by the proposed model will remain consistent. In both scenarios, the proposed model suggests that positive emotions can help eliminate the Confrontation dilemmas faster. In addition, the number of trust dilemma that may arise after the confrontation dilemmas are eliminated is fewer if all agents use positive emotions.
Experiment 2: Testing the Feasibility of Proposed Model to Describe the Dynamics of Agent’s Emotion
The purpose of the experiments in this section is to test the feasibility of the proposed model in describing the dynamics of agent’s emotion. The experiments in this section are divided in two scenarios. In the first scenario the common reference frames is initiated according to the common reference frame before 2008 and in the second scenario the common reference frame is initiated according to the common reference frame before 2009.
In all experiment, agent's payoffs and emotional dimensions are initiated randomly. In each experiment the trends of emotional dynamics are observed. Trends of emotional dynamics are characterized by the average of agent i’s pleasure, arousal and dominance toward all other agents. The trend is then compared to the trend of agent’s emotion in the real world that has been explained in the case study. Using indicators described in the case study, the prediction of the proposed model can be considered as valid if there is at last one of the simulation result that has an interval in which agent’s emotion trends are similar to the agent’s emotion trends in the real world.
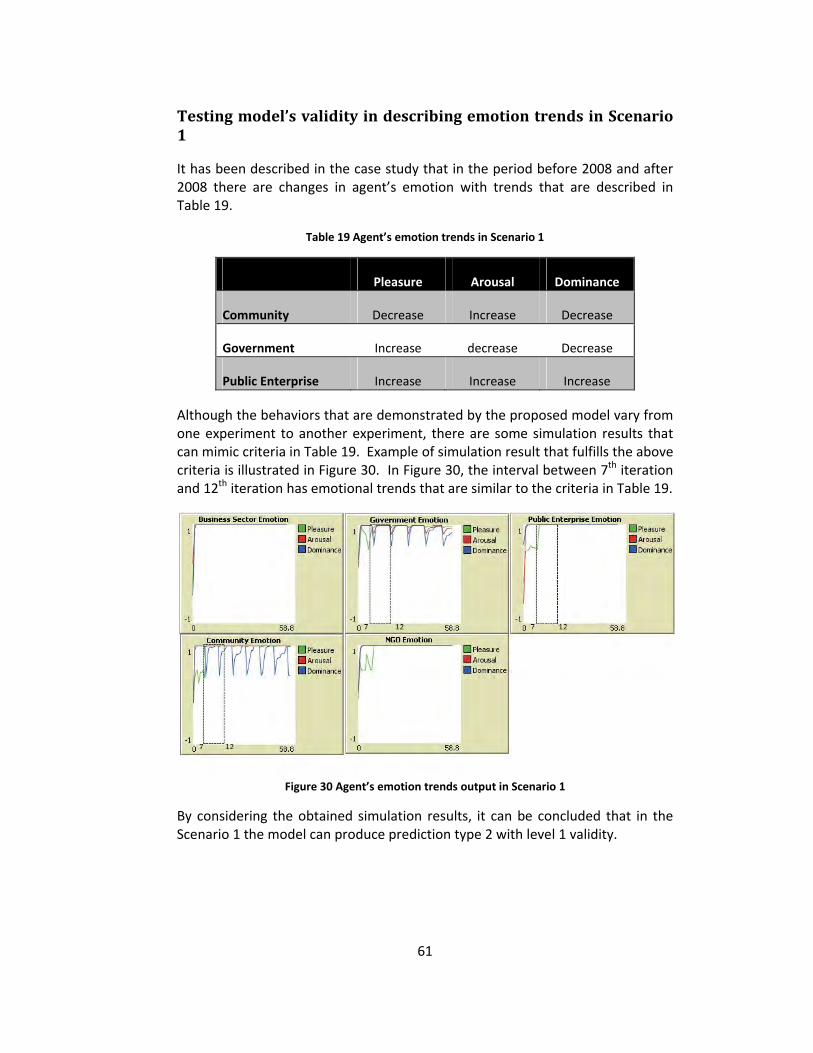
61
Testing model’s validity in describing emotion trends in Scenario 1
It has been described in the case study that in the period before 2008 and after 2008 there are changes in agent’s emotion with trends that are described in Table 19.
Table 19 Agent’s emotion trends in Scenario 1
Pleasure Arousal Dominance
Community Decrease Increase Decrease
Government Increase decrease Decrease
Public Enterprise Increase Increase Increase
Although the behaviors that are demonstrated by the proposed model vary from one experiment to another experiment, there are some simulation results that can mimic criteria in Table 19. Example of simulation result that fulfills the above criteria is illustrated in Figure 30. In Figure 30, the interval between 7th iteration and 12th iteration has emotional trends that are similar to the criteria in Table 19.
Figure 30 Agent’s emotion trends output in Scenario 1
By considering the obtained simulation results, it can be concluded that in the Scenario 1 the model can produce prediction type 2 with level 1 validity.
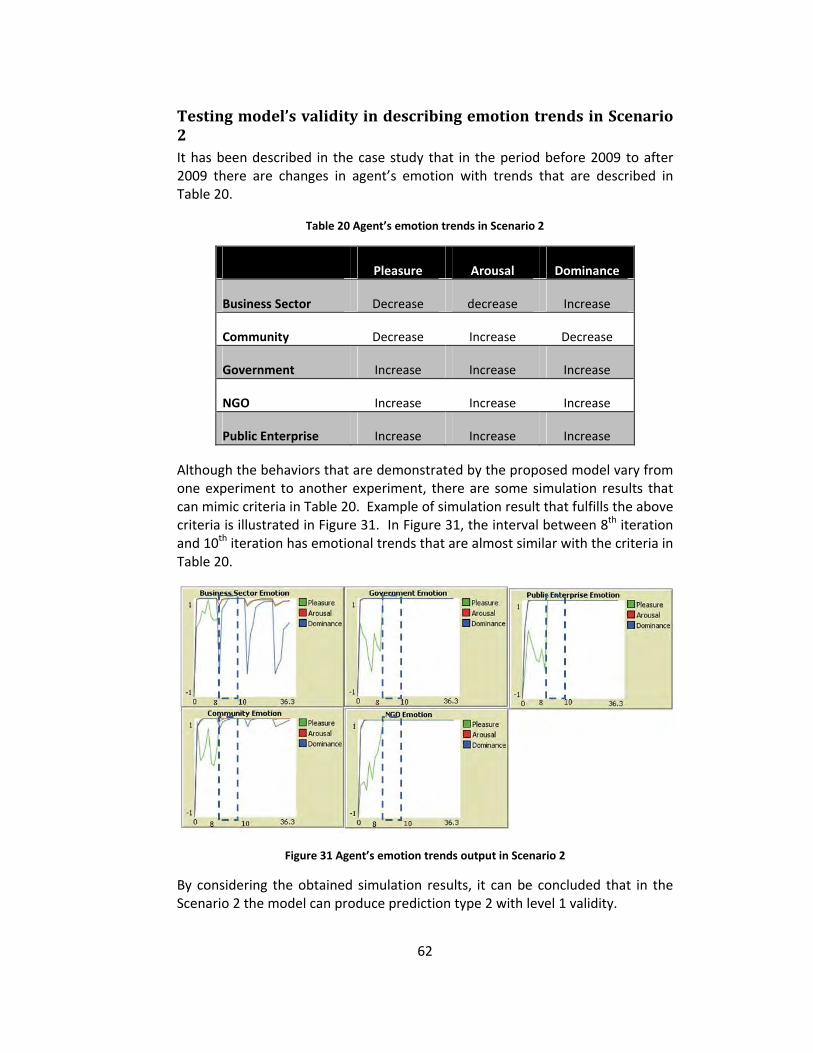
62
Testing model’s validity in describing emotion trends in Scenario 2 It has been described in the case study that in the period before 2009 to after 2009 there are changes in agent’s emotion with trends that are described in Table 20.
Table 20 Agent’s emotion trends in Scenario 2
Pleasure Arousal Dominance
Business Sector Decrease decrease Increase
Community Decrease Increase Decrease
Government Increase Increase Increase
NGO Increase Increase Increase
Public Enterprise Increase Increase Increase
Although the behaviors that are demonstrated by the proposed model vary from one experiment to another experiment, there are some simulation results that can mimic criteria in Table 20. Example of simulation result that fulfills the above criteria is illustrated in Figure 31. In Figure 31, the interval between 8th iteration and 10th iteration has emotional trends that are almost similar with the criteria in Table 20.
Figure 31 Agent’s emotion trends output in Scenario 2
By considering the obtained simulation results, it can be concluded that in the Scenario 2 the model can produce prediction type 2 with level 1 validity.
63
By considering the simulation results from both scenarios, it can be concluded that although agent’s emotional dimensions and a payoff are initiated arbitrarily the proposed model can produce prediction type 2 with level 1 validity. The proposed model can generate output that mimics the trend of agent’s emotion in the real world either when agent's positions are initiated based on the common reference frames before 2008 as well as when the agent's positions are initiated based on the common reference frame before 2009. The model’s validity applies generally for both scenario and therefore the model is feasible to help the decision makers in the real world to anticipate the dynamics of emotion during the conflict.
Experiment 3: Testing the Feasibility of Proposed Model to Describe the Dynamics of Agent’s Positions
This section discusses experiments that are carried out to test whether the proposed model is feasible in describing the dynamics of agent's positions as a result of the negotiation process. The experiments in this section are divided in two scenarios. In the first scenario the common reference frames is initiated according to the common reference frame before 2008 and in the second scenario the common reference frame is initiated according to the common reference frame before 2009. In each experiment, agent's payoffs and emotional dimensions are initiated randomly.
Because there are some parts of the proposed model that have random nature, the probability of occurrence of configuration that is exactly similar to the common reference frame in the real world is very small. Therefore the in this study the proposed model is considered as valid in describing the dynamics of agent’s positions if it can mimic the majority of agent’s position for a certain option. The common reference frames after 2008 and after 2009 are set as the target condition that should be mimicked by the proposed model.
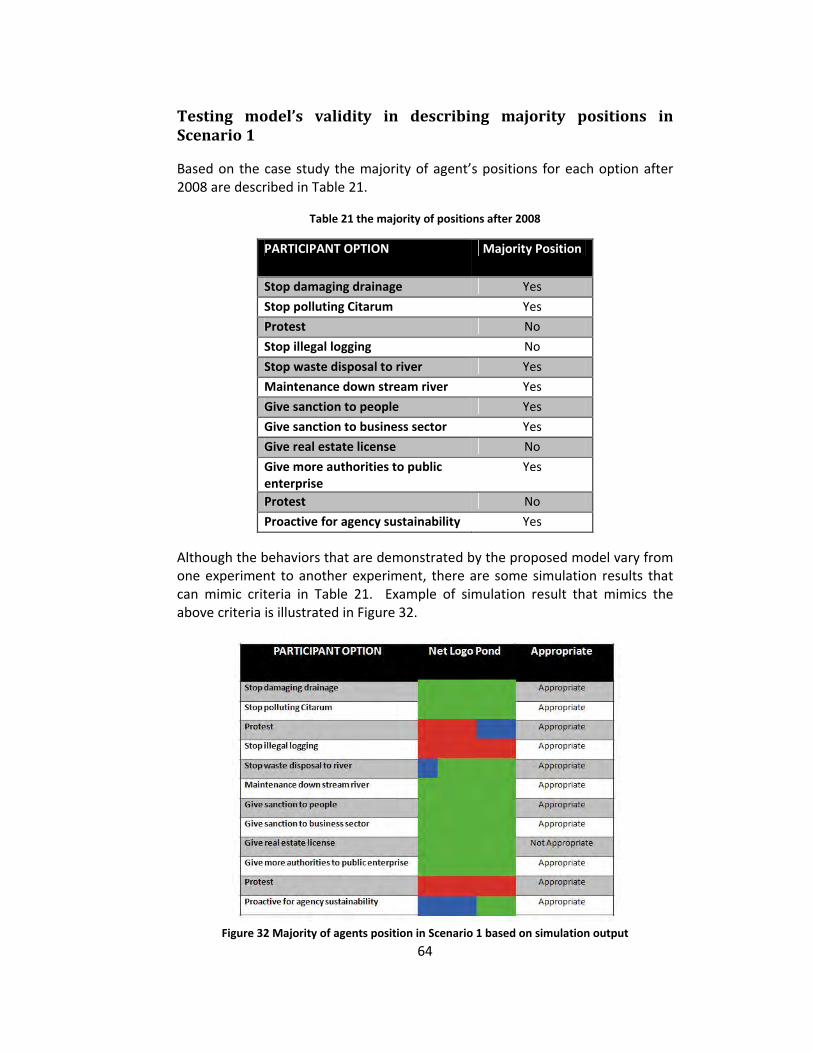
64
Testing model’s validity in describing majority positions in Scenario 1
Based on the case study the majority of agent’s positions for each option after 2008 are described in Table 21.
Table 21 the majority of positions after 2008
PARTICIPANT OPTION Majority Position
Stop damaging drainage Yes
Stop polluting Citarum Yes
Protest No
Stop illegal logging No
Stop waste disposal to river Yes
Maintenance down stream river Yes
Give sanction to people Yes
Give sanction to business sector Yes
Give real estate license No
Give more authorities to public enterprise
Yes
Protest No
Proactive for agency sustainability Yes
Although the behaviors that are demonstrated by the proposed model vary from one experiment to another experiment, there are some simulation results that can mimic criteria in Table 21. Example of simulation result that mimics the above criteria is illustrated in Figure 32.
Figure 32 Majority of agents position in Scenario 1 based on simulation output
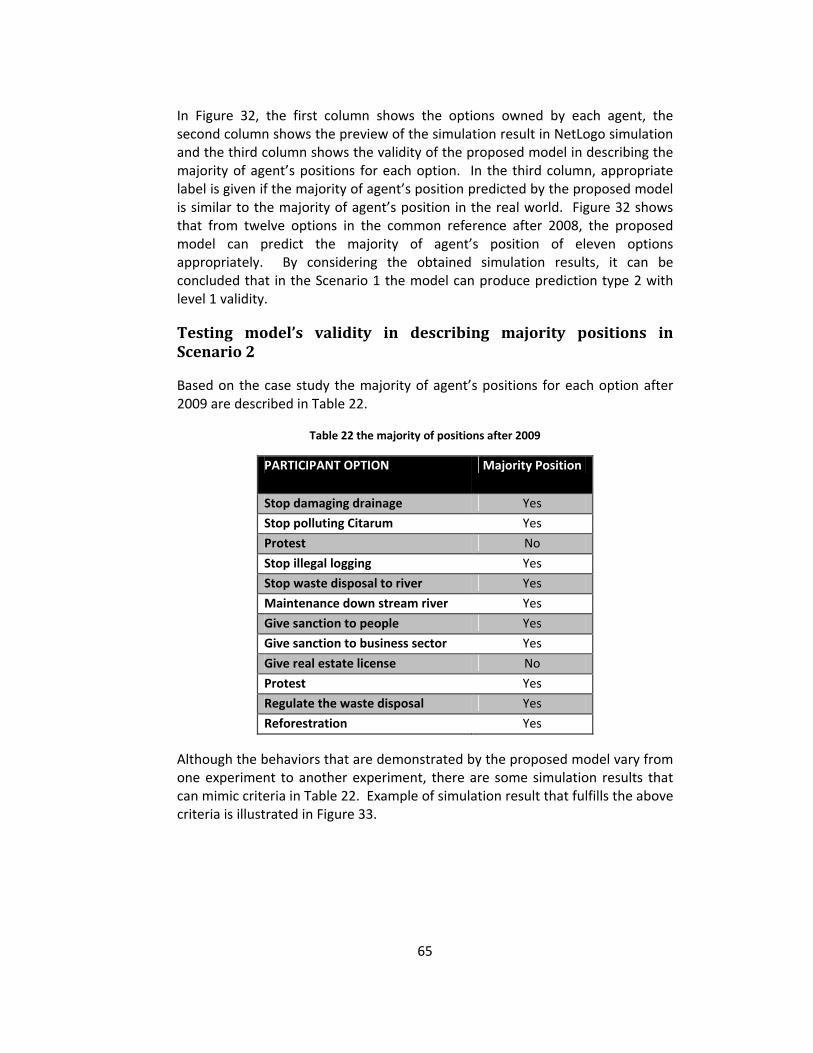
65
In Figure 32, the first column shows the options owned by each agent, the second column shows the preview of the simulation result in NetLogo simulation and the third column shows the validity of the proposed model in describing the majority of agent’s positions for each option. In the third column, appropriate label is given if the majority of agent’s position predicted by the proposed model is similar to the majority of agent’s position in the real world. Figure 32 shows that from twelve options in the common reference after 2008, the proposed model can predict the majority of agent’s position of eleven options appropriately. By considering the obtained simulation results, it can be concluded that in the Scenario 1 the model can produce prediction type 2 with level 1 validity.
Testing model’s validity in describing majority positions in Scenario 2
Based on the case study the majority of agent’s positions for each option after 2009 are described in Table 22.
Table 22 the majority of positions after 2009
PARTICIPANT OPTION Majority Position
Stop damaging drainage Yes
Stop polluting Citarum Yes
Protest No
Stop illegal logging Yes
Stop waste disposal to river Yes
Maintenance down stream river Yes
Give sanction to people Yes
Give sanction to business sector Yes
Give real estate license No
Protest Yes
Regulate the waste disposal Yes
Reforestration Yes
Although the behaviors that are demonstrated by the proposed model vary from one experiment to another experiment, there are some simulation results that can mimic criteria in Table 22. Example of simulation result that fulfills the above criteria is illustrated in Figure 33.

66
Figure 33 Majority of agents position in Scenario 2 based on simulation output
In Figure 33, the first column shows the options owned by each agent, the second column shows the preview of the simulation result in NetLogo simulation and the third column shows the validity of the proposed model in describing the majority of agent’s positions for each option. In the third column, appropriate label is given if the majority of agent’s position predicted by the proposed model is similar to the majority of agent’s position in the real world. Figure 33 shows that from twelve options in the common reference after 2009, the proposed model can predict the majority of agent’s position of ten options appropriately. By considering the obtained simulation results, it can be concluded that in the Scenario 2 the model can produce prediction type 2 with level 1 validity.
Although the model's accuracy in predicting agent’s majority positions that will emerge is not perfect however, the proposed model is quite valid in describing dynamics of changes in agent’s position that may occur during the conflict. In the first scenario the proposed model the model can describe a changing in the majority of agent’s position regarding the give sanction to people option. Before 2008 the majority of agents reject this option but, after 2008 the majority of agents accept this option. In addition, the model can describe a changing in the majority of agent’s position regarding the proactive for agency sustainability option. Before 2008 the majority of agents are indifferent towards this option, but, after 2008 the majority of agents accept this option. In the second scenario, the model can describe a changing in the majority of agent’s position regarding the protest the options owned by the NGO. Before 2009, the majority of the agents reject this option but, after 2009 the majority of the agents accept this option.
By considering the simulation results from both scenarios, it can be concluded that although agent’s emotional dimensions and a payoff are initiated arbitrarily
67
the proposed model can produce prediction type 2 with level 1 validity. The model’s validity applies generally for both scenario and therefore the model is feasible to help the decision makers in the real world to anticipate the changes in agent’s position that may occur during the conflict.
Experiment 4: Inferring Suggestions for Real World Agents
After the sensitivity and feasibility of the proposed model are tested, suggestions that can be proposed to the real world agents, not just to resolve the conflict but also to obtain the final results that can improve the condition of the Citarum River, are explored in this section. Suggestions that will be proposed are taken form of emotional strategy that should be used by the agents during the negotiation with other agents. These suggestions are expected to be valid for the period of 2009 onwards.
It can be judged intuitively that the condition of the Citarum River would improve if all agents agree that:
1. Business sectors are no longer damage the city drainage and no longer dispose of waste into the river Citarum.
2. Community stops illegal logging activity and no longer throws household waste into the Citarum River.
3. Government maintain downstream river and no longer permit real estate construction.
4. Public enterprises help to regulate waste disposal and to do Reforestation.
To identify strategies that can achieve the above criterias, agent’s positions in the simulation are initiated by using common reference frame after 2009. Agent’s payoff and emotions are initiated randomly. The simulation is then run repeatedly. In each simulation the final common reference frame that is obtained and the emotion that produce it are observed.
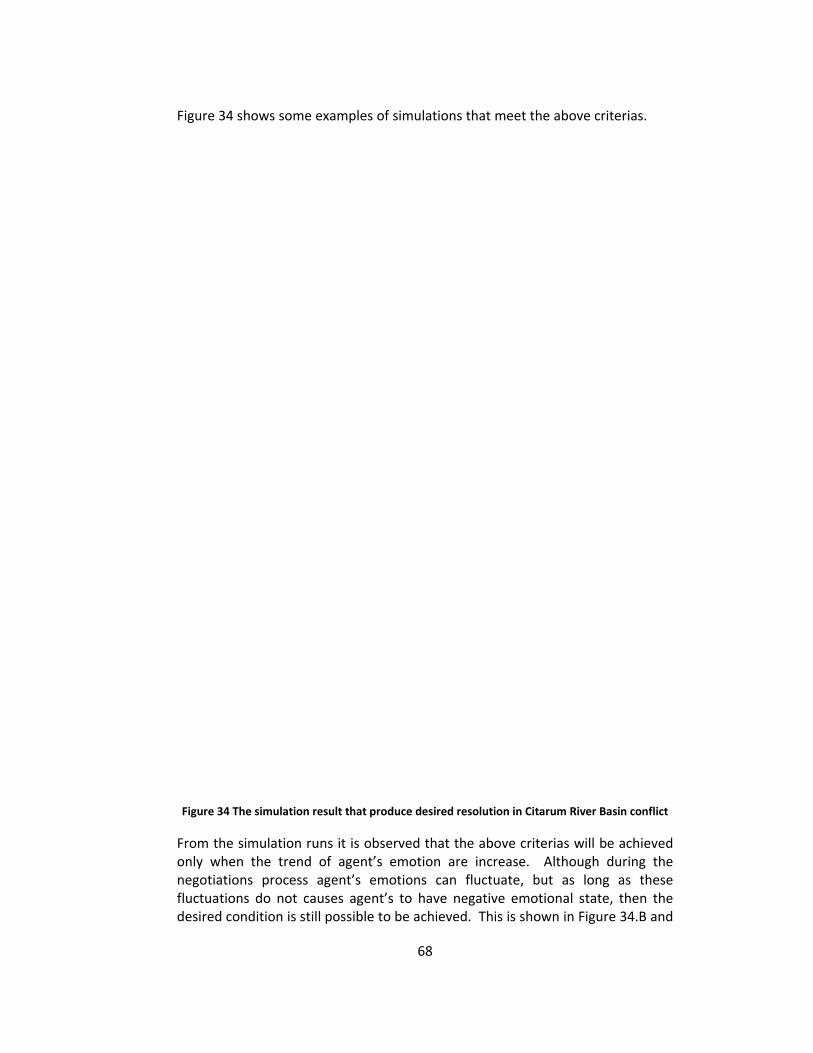
o
fd
Figure 34 sh
Figure 34 The
From the simonly when negotiationsfluctuationsdesired cond
hows some e
e simulation re
mulation runthe trend os process a do not caudition is still
examples of
esult that prod
ns it is obseof agent’s eagent’s emouses agent’s possible to
68
simulations
duce desired re
rved that themotion areotions can s to have nebe achieved
that meet t
esolution in Cit
he above crie increase.fluctuate, begative emod. This is sho
he above cri
tarum River Ba
terias will b Although but as longotional stateown in Figur
iterias.
asin conflict
e achieved during the g as these e, then the re 34.B and
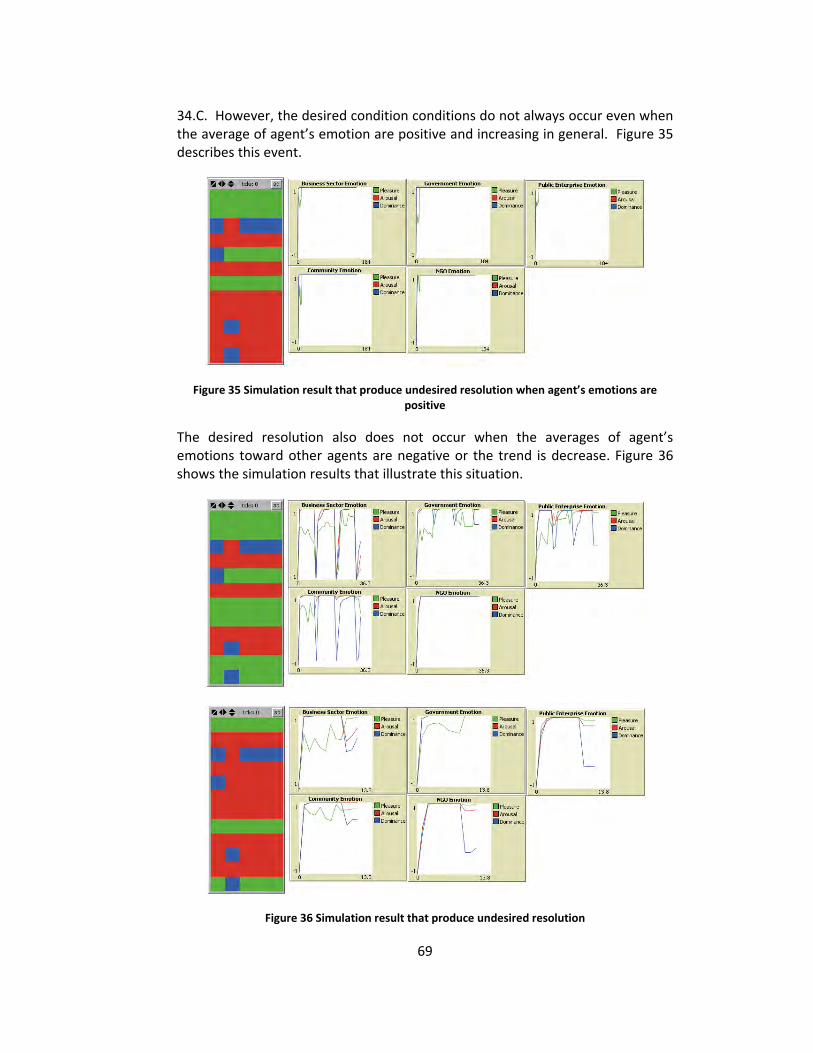
69
34.C. However, the desired condition conditions do not always occur even when the average of agent’s emotion are positive and increasing in general. Figure 35 describes this event.
Figure 35 Simulation result that produce undesired resolution when agent’s emotions are positive
The desired resolution also does not occur when the averages of agent’s emotions toward other agents are negative or the trend is decrease. Figure 36 shows the simulation results that illustrate this situation.
Figure 36 Simulation result that produce undesired resolution
70
CONCLUSIONS AND FURTHER RESEARCH
Conclusions
In this research an agent‐based simulation model of dynamics of confrontation that involves emotion and learning has been constructed. In this model agents are negotiate based on the drama theory concept and have emotion that is modeled using the PAD model.
In this model, agents negotiate in order to attract other agents to adopt its positions. The negotiation process occurs iteratively in accordance with the nature of negotiation in the real world. Negotiation protocol in this model is constructed based on the concept of rational negotiation. In this negotiation protocol, agents can recognize the position declared by other agents but can only estimate the payoff that will be obtained by other agents from their declared position. This is in line with the realities of negotiation in the real world. In the constructed negotiation protocol, emotions play a role in magnifying or diminishing the perception of other agents on the offer given by an agent. This is consistent with the role of emotions in negotiations in the real world. During the negotiation process agent’s emotion can change based on the result of its interaction with other agents. The dynamics of agent's emotion is based on the flow model of emotion concept. By adopting this concept agent's emotion dynamics that occur in the negotiations in the real world can be facilitated. Since the assumptions used in this model are very close to the real world negotiation process, the proposed model can be considered valid as conceptually.
In the proposed model, the negotiation process occurs as long as there are confrontations dilemmas exist among agents. There are two types of confrontation dilemmas in the proposed model i.e. persuasion and rejection dilemma. If the confrontation dilemmas among the agents have been successfully eliminated, there are still possibilities of the emergence of trust dilemma among agents. The number of iterations required to eliminate confrontation dilemmas and the amount of trust dilemma that appears become the main parameters to test the sensitivity of the model. The first experiment shows that the number of iterations required to eliminate the confrontation dilemmas and the number of trust dilemma that arise are significantly lower if all agents have positive emotions towards other agents. This experiment also indicated that the results of the analysis are robust to the initial common reference frame. This means that although the model is calibrated for other conflict situation the analysis results will remain consistent.
In the second experiment the model feasibility to describe the trend of agent's emotion that can arise in the real world is tested. By comparing the trend of agent's emotion generated by the simulation and the trend of agent's emotion obtained through focus group discussion, it can be concluded that there are results of simulations that can mimic the trend of agent's emotion in the real
71
world. Therefore, it can be concluded that the model can produce prediction type 2 with level 1 validity. The validity of the proposed model to describe the trend of agent’s emotion is robust against initial common reference frame. This means that the model will also valid to describe the trend of agent’s emotion that may appear in other conflict situation. Since the validity of the proposed model applied generally, it is feasible to help agents in the real world to anticipate trend of agent’s emotion that may appear during the confrontation. Ofcourse, to give higher level of prediction and validity, more accurate measurements of inputs parameters are required.
In the third experiment the feasibility model to describe the majority of agent's positions that can arise in the real world is tested. By comparing the common reference frames generated by the proposed model with the common reference frames obtained through focus group discussion it can be concluded that there are results of the simulation which can resemble the majority of agent's positions the real world (although the results are not 100% accurate). So, it can be concluded that the model can produce prediction type 2 with level 1 validity. The validity of the proposed model to describe the majority of agent's positions is robust against initial common reference frame. This means that the model will also valid to describe the majority of agent’s position that may appear in other conflict situation. Since the validity of the proposed model applied generally, it is feasible to help agents in the real world to anticipate the final majority of agents’ positions that may occur as the result of the confrontation. Ofcourse, to give higher level of prediction and validity, more accurate measurements of inputs parameters are required.
After testing the model’s feasibility the recommendations for agents in the Citarum river basin conflict are explored in the fourth experiment. The result of this experiment shows that in order to achieve resolution that can help to improve the condition of the Citarum River, it is suggested to the agents in the real world to use positive emotions in negotiation with other agents. In addition, the use of positive emotions accelerates the achievement of conflict resolution, and reduces the possibility of the emergence of trust dilemma, as discussed in the first experiment.
Further Research
The proposed model in this study still has some weaknesses. In the proposed model it is assumed, that an agent is a coalition of a number of actors in the real world. Members of each coalition are considered fixed and not changed during the course of the conflict. Through the qualitative study conducted in this study, it is identified that the members within each coalition can change with during the course of the conflict. To develop this model further it is important to consider the process regarding the formation mechanism and the dynamics of agent's coalition.
72
In the drama theory model there are six drama dilemmas that can arise in a conflict. This model only accommodates three dilemmas among those six dilemmas. This model can be developed further by also model the positioning, threat and cooperation dilemma.
In experiments conducted with the proposed model a number of inputs such as agent's payoff and the agent's emotion are initialized randomly. In order to utilize this model further to assist agents in the real world in anticipating the dynamics of conflict that may occur, instruments that can help to identify the value of these variables need to be constructed.
73
REFERENCES (n.d.). Retrieved from citarum.org.
Adler, R. S., Rosen, B., & Silverstein, E. M. (1998). Emotions in negotiation: How to Manage Fear and Anger. Negotiation Journal , 14 (2), 161–179.
Albin, C., & Druckman, D. (2010). The Role of Justice in Negotiation. In D. Kilgour, & C. Eden, Advances in Group Decision and Negotiation 4 : Handbook of Group Decision and Negotiation (pp. 109‐120). New York: Springer.
Axelrod, R. (2003). Advancing the Art of Simulation in the Social Sciences. Japanese Journal for Management Information System, Special Issue on Agent‐ , 12 (3).
Axelrod, R. (2005). Agent‐Based Modeling as a Bridge Between Disciplines. In K. L. Judd, & L. Tesfatsion (Eds.), Handbook of Computational Economics Vol.2: Agent‐Based Computational Economics. North Holland.
Axtell, R. L. (2003). The New Coevolution of Information Science and Social Science: From Software Agents to Artificial Societies and Back or How More Computing Became Different Computing. Retrieved November 5, 2008, from http://www.econ.iastate.edu/tesfatsi/compsoc.axtell.pdf
Axtell, R., & Epstein, J. (1994). Agent Based Modeling: Understanding Our Creations. The Bulletin of the Santa Fe Institute , 28‐32.
Axtell, R., Epstein, J., Dean, J., Gumerman G, J., Swedlund, A., Harburger, J., et al. (2002). Population Growth and Collapse in a Multi‐Agent Model of the Kayenta Anasazi in Long House Valley. PNAS , 99 (3), 7275‐7279.
Balai PSDA Wilayah Sungai Citarum. (2004). Laporan Akhir Tahun 2004.
BPLDH Jawa Barat. (2001). Action Plan Pengendalian Kerusakan, Pencemaran, dan Upaya Pemulihan Daerah Pengaliran Sungai Citarum. Bandung.
Bryant, J. (2007). Drama Theory: Dispelling the Myths. Journal of the Operational Research Society , 58, 602‐613.
Bryant, J. (1997). The Plot Thickens: Understanding Interaction Through the Metaphor of Drama. Omega , 25 (3), 255‐266.
Bryant, J. (2003). The six dilemma of collaboration : inter‐organisational relationship as drama. Chichester: Wiley.
Bryant, J. (1997). Using drama theory: concepts and cases. OR Insight , 10 (4), 14‐21.
74
Carley, K. M. (1999). On Generating Hypotheses Using Computer Simulations. Proceedings of the 1999 International Symposium on Command and Control Research and Technology. Vienna.
Damasio, A. R. (1994). Descartes’ Error : Emotion, Reason, and the Human. New York: Avon Books.
de Sousa, R. (2003). Emotion. Retrieved from Stanford Encyclopedia of Philosophy.
Epstein, J. M. (1999). Agent‐Based Computational Models And Generative Social Science. Complexity , 4 (5), 41‐60.
Epstein, J. M. (2008). Why Model? Journal of Artificial Societies and Social Simulation , 11 (4).
Gebhard, P. (2005). ALMA: A Layered Model of Affect. Proceedings of AAMAS. New York: ACM Press.
Gilbert, N. (2008). Agent‐Based Models. Los Angeles: SAGE Publications.
Gilbert, N. (2004, December 18). Agent‐based Social Simulation: Dealing with Complexity. Retrieved October 26, 2008, from http://www.agsm.unsw.eduau/bobm/teaching/SimSS/ABSSdealingwithcomplexity‐1‐1.pdf
Gilbert, N., & Terna, P. (2000). How to Build and Use Agent‐based Models in Social Science. Retrieved March 3, 2008, from Facoltà di Economia Torino: http://web.econ.unito.it/terna/deposito/gil_ter.pdf
Hartmann, S. (1996). The World as a Process. Simulations in the Natural and Social Sciences. In Hegselmann, Rainer, U. Müller, & K. Troitzsch (Eds.), Modelling and Simulation in the Social Sciences from the Philosophy of Science Point of View (pp. 77‐100). Dordrecht: Kluwer.
Howard, N. (1994). Drama theory and its relation to game theory Part 2: Formal Model of the Resolution Process. Group Decision and Negotiation , 3, 187‐235.
Howard, N. (1994). Drama theory and its relation to game theory. Part 1: Dramatic resolution vs rational solution. Group Decision and Negotiation , 3, 187‐206.
Howard, N., Bennett, P., Bryant, J., & Bradley, M. (1992). Manifesto for a Theory of Drama and Irrational Choice. J Opl Res Soc , 44 (1), 99‐103.
75
Jennings, N. R., Faratin, P., Johnson, M. J., Norman, T. J., O'Brien, P., & Wiegand, M. E. (1996). Agent‐Based Business Process Management. International Journal of Cooperative Information Systems , 105‐130.
Jiang, H. (2007). From Rational to Emotional Agents. PhD Thesis , University of South Carolina, Department of Computer Science and Engineering.
Johnson, B., & Christensen, L. (2007). Educational Research Quatitative, Qualitative and Mixed Approaches. Thousand Oaks, CA: SAGE Publications Inc.
Johnson, R. B., & Onwuegbuzie, A. J. (2004). Mixed Methods Research: A Research Paradigm Whose Time Has Come. Educational Researcher , 33 (7), 14–26.
Koeszegi, S. T., & Vetschera, R. (2010). Analysis of Negotiataion Process. In D. M. Kilgour, & C. Eden, Advances in Group Decision and Negotiation 4 : Handbook of Group Decision and Negotiation (pp. 121‐138). New York: Springer.
Kuppers, G., & Lenhard, J. (2005). Validation of Simulation: Patterns in the Social and Natural Sciences. Journal of Artifcial Societies and Social Simulation , 8 (4), 3.
LeDoux, J. (1994, June). Emotion, Memory and the Brain. Scientific American , pp. 50–57.
Li, S., & Roloff, M. E. (2006). Strategic Emotion in Negotiation: Cognition, Emotion, and Culture. In Communication to Presence: Cognition, Emotions and Culture towards the Ultimate Communicative Experience. Amsterdam: IOS Press.
Macy, M. W., & Willer, R. (2002). From Factors to Actors: Computational Sociology and Agent‐based Modeling. Annual Review of Sociology , 143‐166.
Martinovski, B. (2010). Emotion in Negotiation. In D. M. Kilgour, & C. Eden, in Advances in Group Decision and Negotiation 4 : Handbook of Group Decision and Negotiation (pp. 65‐86). New York: Springer.
Masters, R. (2000). Compassionate Wrath: Transpersonal Approaches to Anger. The Journal of Transpersonal Psychology , 32 (1), 31‐51.
Maulana, F. (2003, May 12). Menyelamatkan Hutan Tatar Sunda. Kompas Online .
Mehrabian, A. (1995). Framework for a Comprehensive Description and Measurement of Emotional States. Genetic, Social, and General Psychology Monographs , 121 (3), 339–361.
76
Mehrabian, A. (1996). Pleasure‐Arousal‐Dominace: a general framework for Describing and measuring individual differences in temperament. Current Psychology: Developmental, Learning, Personality, Social , 14 (4), 261‐292.
Mehrabian, A. (1995). Relationships among Three General Approaches to Personality Description. Journal of Psychology , 129, 565–581.
Morgado, L., & Gaspar, G. (2003). Emotion in Intelligent Virtual Agents:the Flow Model of Emotion. Proceeding Intelligent virtual agents: 4th International Workshop.
Obeidi, A., Kilgour, D. M., & Hipel, K. W. (2009). Perceptual Graph Model Systems. Group Decision and Negotiation .
Ortony, A., Clore, G., & Collins, A. (1988). The Cognitive Structure of Emotions. Cambridge: Cambridge Univ. Press.
Pemerintah Propinsi Jawa Barat. (2002). Kerangka Acuan Pola Induk Program Citarum Bergetar. Bandung.
Puslitbang Sumber Daya Air. (2005). Katalog Sungai di Indonesia (Vol. 1).
Putro, U., Hermawan, P., Siallagan, M., Novani, S., & Utomo, D. (2010). Agent‐Based Simulation of Negotiation Process in Citarum River Basin Conflict. Proceedings PAN‐PACIFIC Conference XXVII May31 – June 2 2010, (pp. 63‐65). Bali.
Putro, U., Siallagan, M., & Novani, S. (2007). Agen based simulation of negotiation process using drama theory. Proceedings of the 51st Annual Meeting of the International Society for the Systems Sciences. Tokyo.
Putro, U., Siallagan, M., Novani, S., & Utomo, D. (2008). Managing Collaboration Using Agent Based Simulation. Proceedings PRIMA, (pp. 348‐356). Hanoi.
Ramanath, A., & Gilbert, N. (2004). Tehcniques for the Construction and Evaluation of Participatory Simulations. Journal of Artificial Societies and Social Simulation , 7 (4), 1.
Santono, H., & Goeltom, D. (2011, March 13). Citarum and IWRM: A Guinea Pig for ADB. Retrieved July 22, 2011, from Kruha.org: http://www.kruha.org/page/id/dinamic_detil/20/84/Artikel/Citarum_and_IWRM__A_Guinea_Pig_for_ADB.html
Schelling, T. (1971). Dynamic Models of Segregation. Journal of Mathematical Sociology , 1 (2), 143‐186.
77
Schwarz, N. (2007). Agent‐based Modelling of the Diffusion of Environmental Innovation. Proceeding 5th International EMAEE Conference on Innovation. Manchester: Manchester Metropolitan University.
Sloman, A. (1981). Why Robots Will Have Emotions. Proceeding of IJCAI. Sussex: University of Sussex.
Smith, E. R., & Conrey, F. R. (2007). Agent‐Based Modeling: A New Approach for Theory Building in Social Psychology. Personality and Social Psychology Review , 11 (87), 87‐104.
Smith, E. R., & Conrey, F. R. (2007). Agent‐Based Modeling: A New Approach for Theory Building in Social Psychology. Personality and Social Psychology Review , 11 (87), 87‐104.
Srbljinović, A., & Škunca, O. (2003). An Introduction to Agent Based Modelling and Simulation of Social Process. Interdisciplinary Description of Complex Systems , 1, 1‐8.
Sungkono, E. (2005, April 17). Citarum. Pikiran Rakyat .
Sycara, K., & Dai, T. (2010). Agent Reasoning in Negotiation. In D. Kilgour, & C. Eden, Advances in Group Decision and Negotiation 4 : Handbook of Group Decision and Negotiation (pp. 437‐451). New York: Springer.
Tribun. (2010, September 2). Aduh... Citarum Sungai Terkotor di Dunia. Retrieved July 18, 2011, from Tribunnews.com: http://www.tribunnews.com/2010/09/02/aduh...‐citarum‐sungai‐terkotor‐di‐dunia
Troitzsch, K. G. (2009). Not All Explanations Predict Satisfactorily, and Not All Good Predictions Explain. Journal of Artificial Societies and Social Simulation , 12 (1), 10.
Umar, S. (2005, March 25). Meminimalisasi Banjir Citarum. Pikiran Rakyat .
Wikipedia.org. (n.d.). Feasible Region. Retrieved from Wikipedia.org: http://en.wikipedia.org/wiki/Feasible_region
Wikitionary.org. (n.d.). Wikitionary.org. Retrieved from http://en.wiktionary.org/wiki/feasible
Wilson, S., & Boyd, C. (2008). Structured Assessment of Complex systems. Canberra: Aerospace Concepts Pty Ltd.
WrodNet Search 3.1. (n.d.). Retrieved from http://wordnetweb.princeton.edu/

78
Zawawi, D. (2007). Quantitative Versus Qualitative Methods in Social Sciences: Bridging the Gap. Integration & Dissemination , 3‐4.
79
Appendix A Proceedings of International Industrial Engineering and Service Science Conference 2011 To be presented at International Industrial Engineering and Service Science Conference (IESS) 2011, Solo, Indonesia, on September 20th – 22nd 2011
80
Promoting Collaboration among Stakeholders in Citarum River Basin Problem
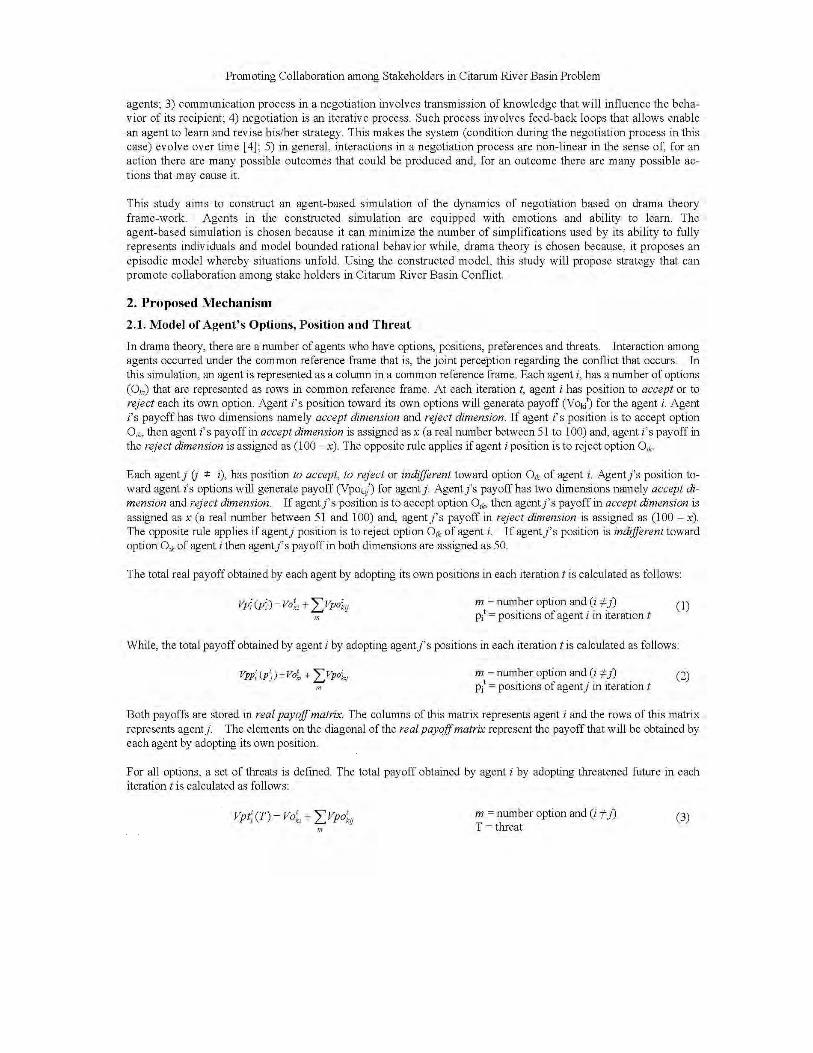
81
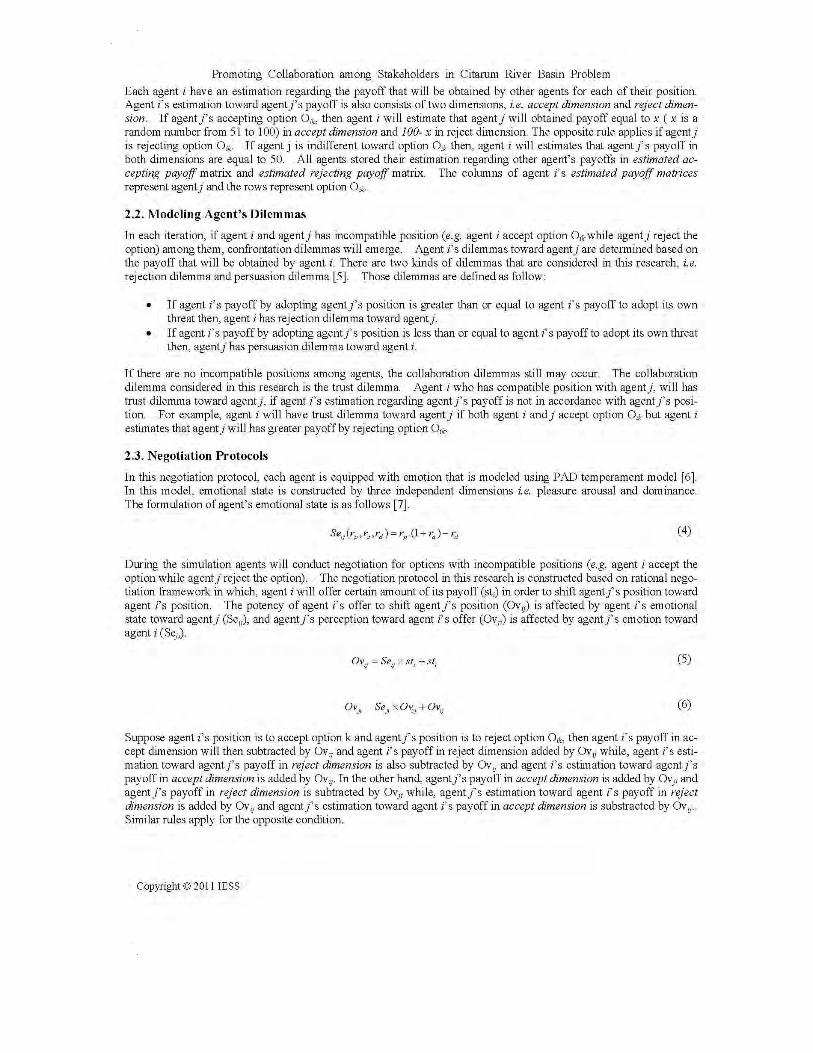
82
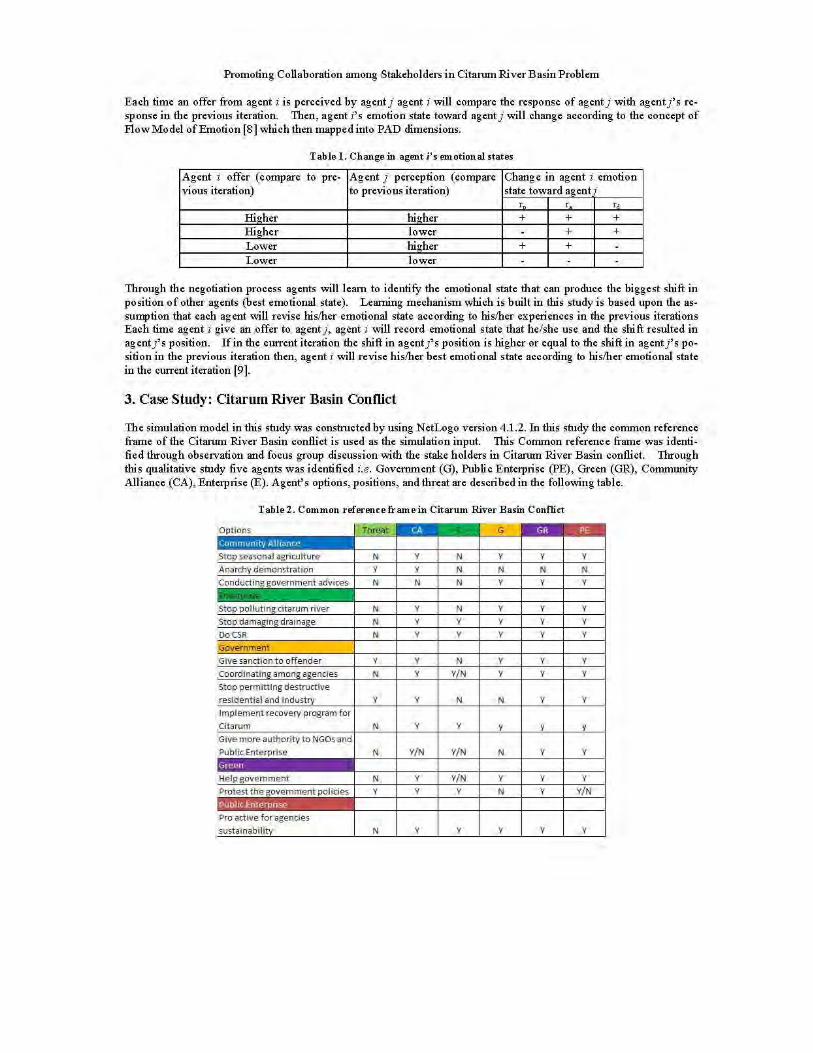
83
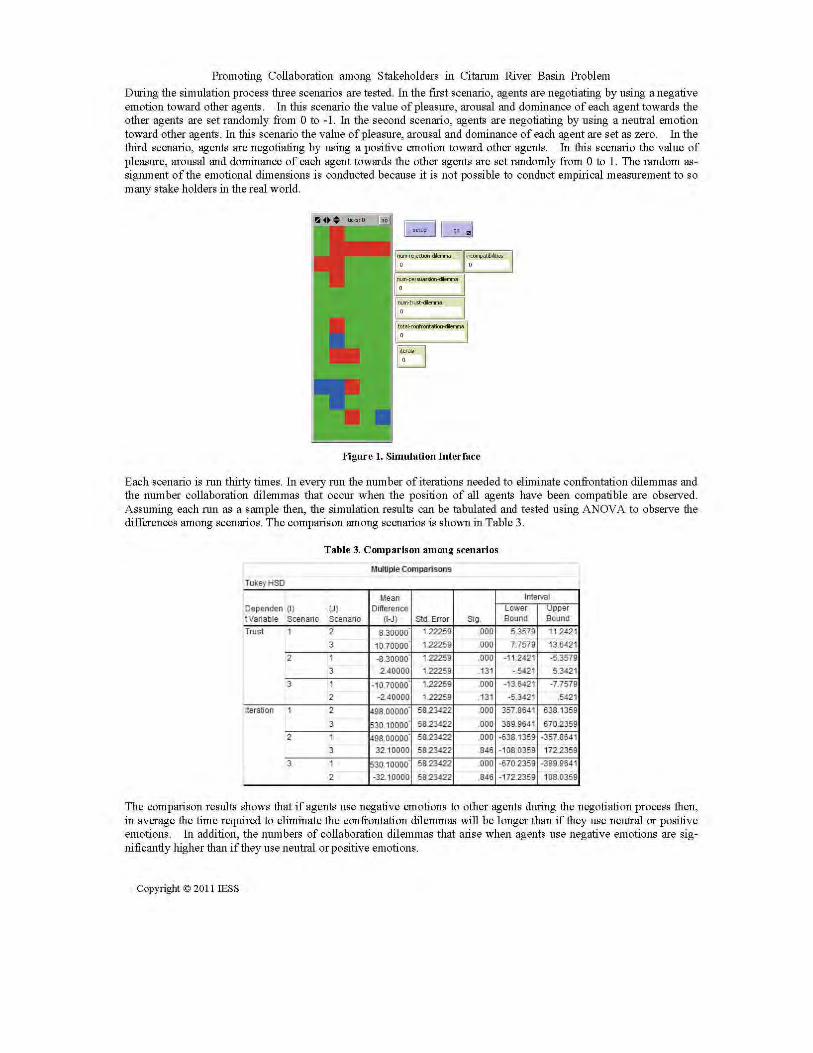
84
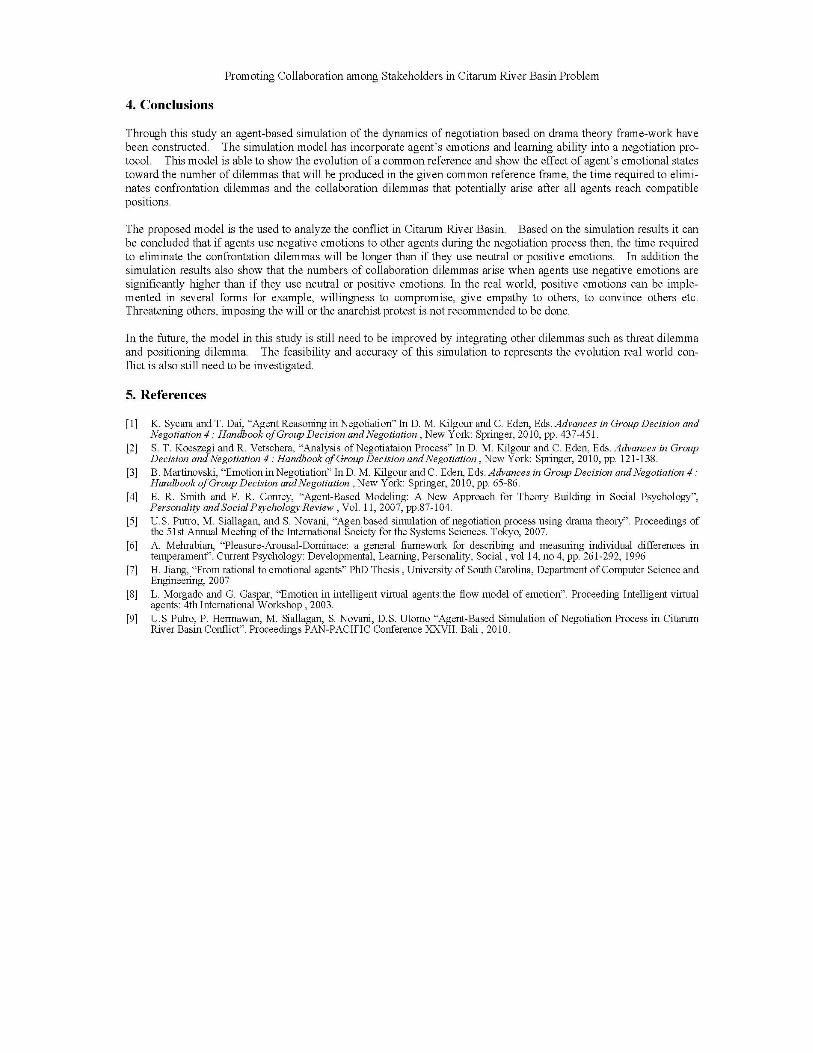
85
86
A Drama Theoretical Approach of Stakeholder Analysis of Citarum River Pollution Problem in Indonesia
87
88
89
90
91
92
Appendix B Proceedings of the World Congress on Engineering and Technology (CET) 2011
To be presented at The World Congress on Engineering and Technology (CET) Shanghai, China, on October 28th 2011
93
Environmental Management Using Drama Theory
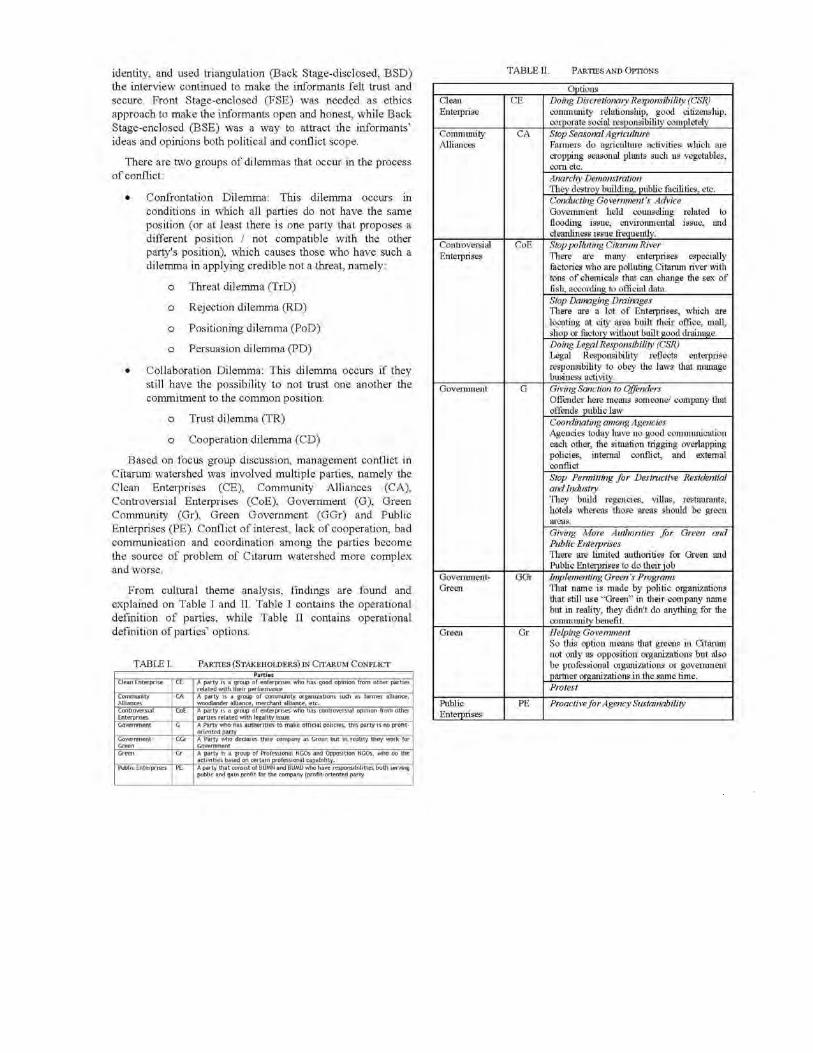
94
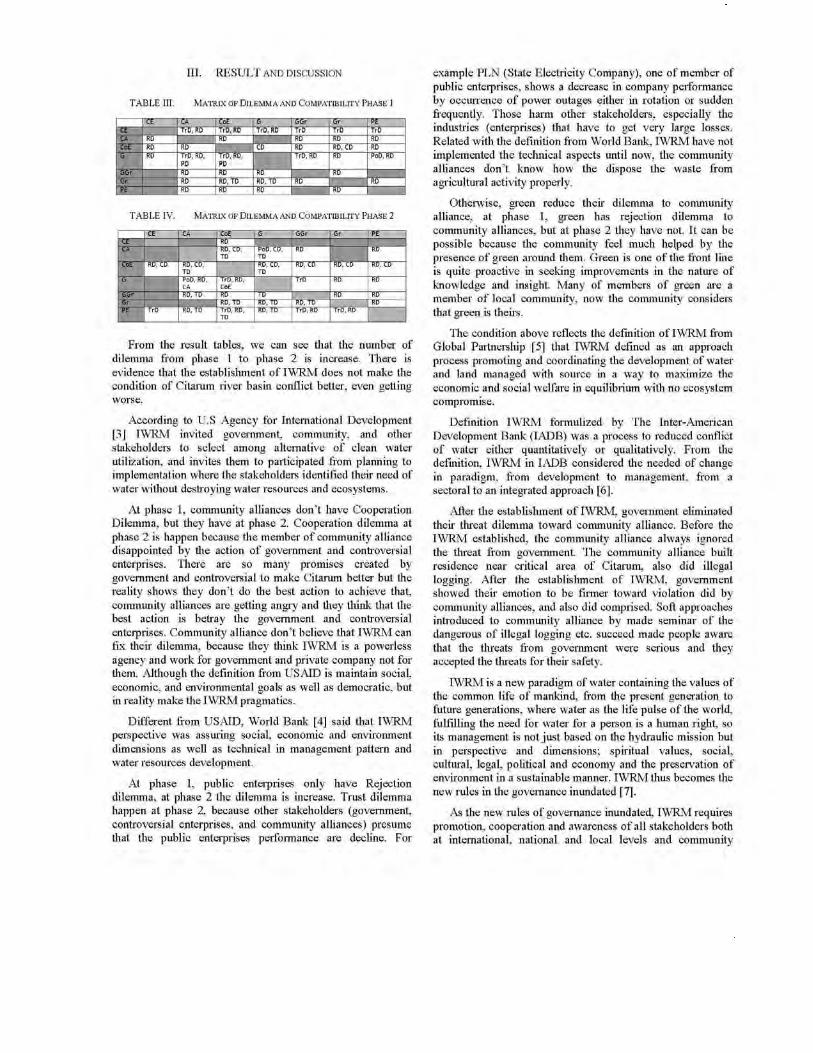
95
96
97
How Can Agent Learn Other Agent’s Emotion in Dynamic Negotiation Process?
98
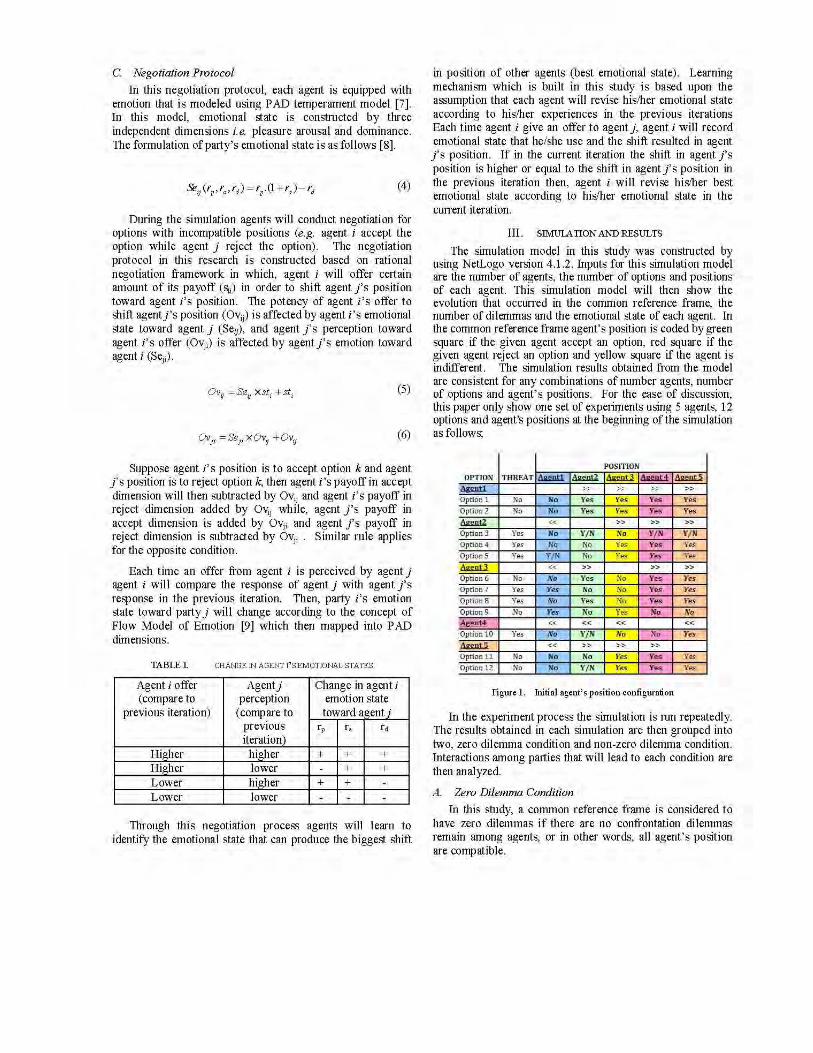
99
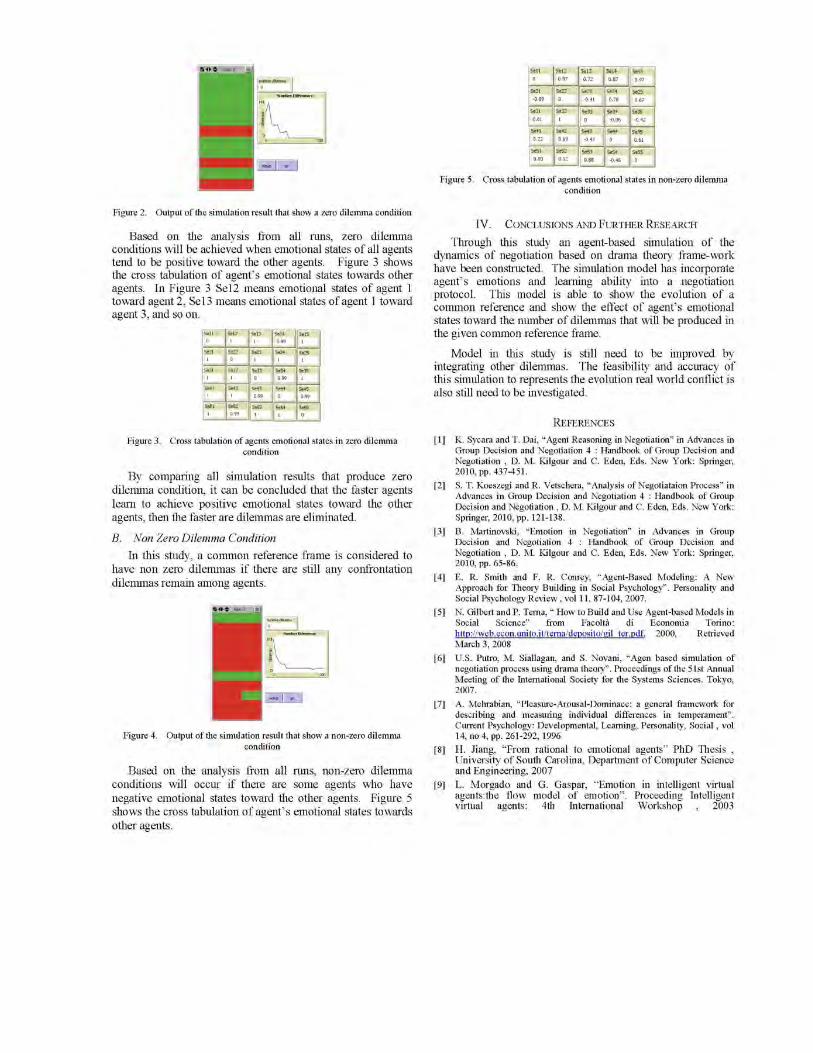
100
101
Rehearsing Initiatives to Facilitate Collaboration in Environmental Conflict
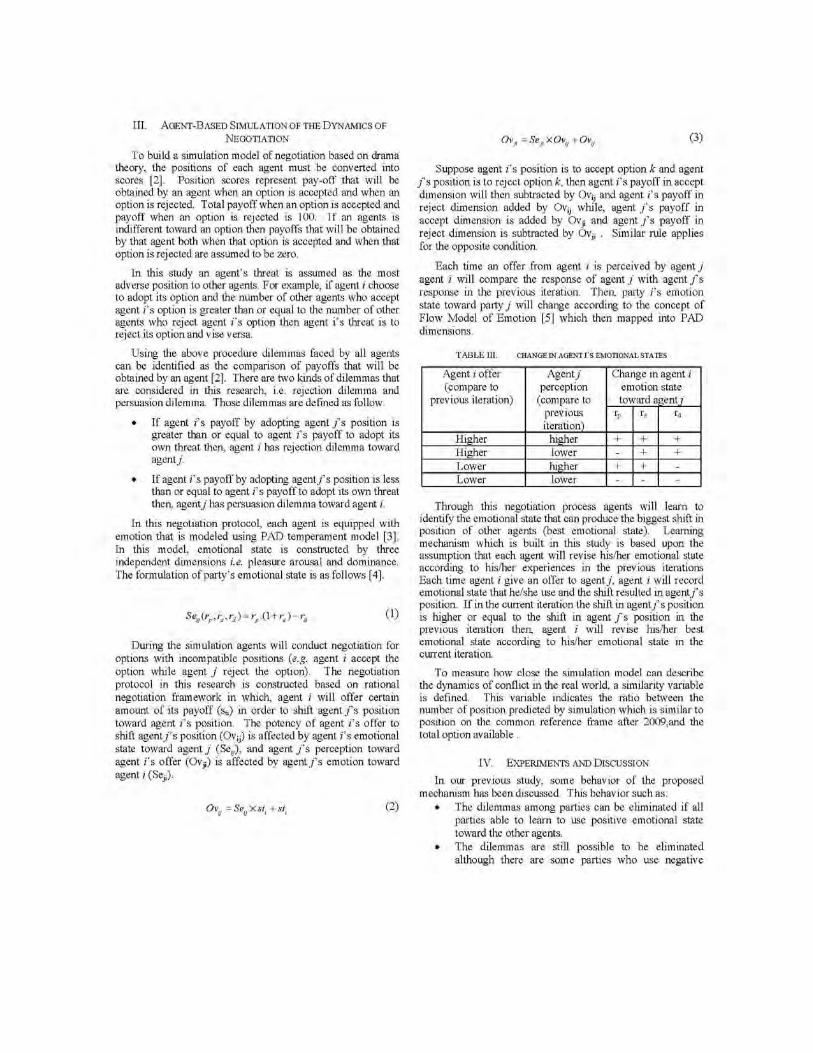
102
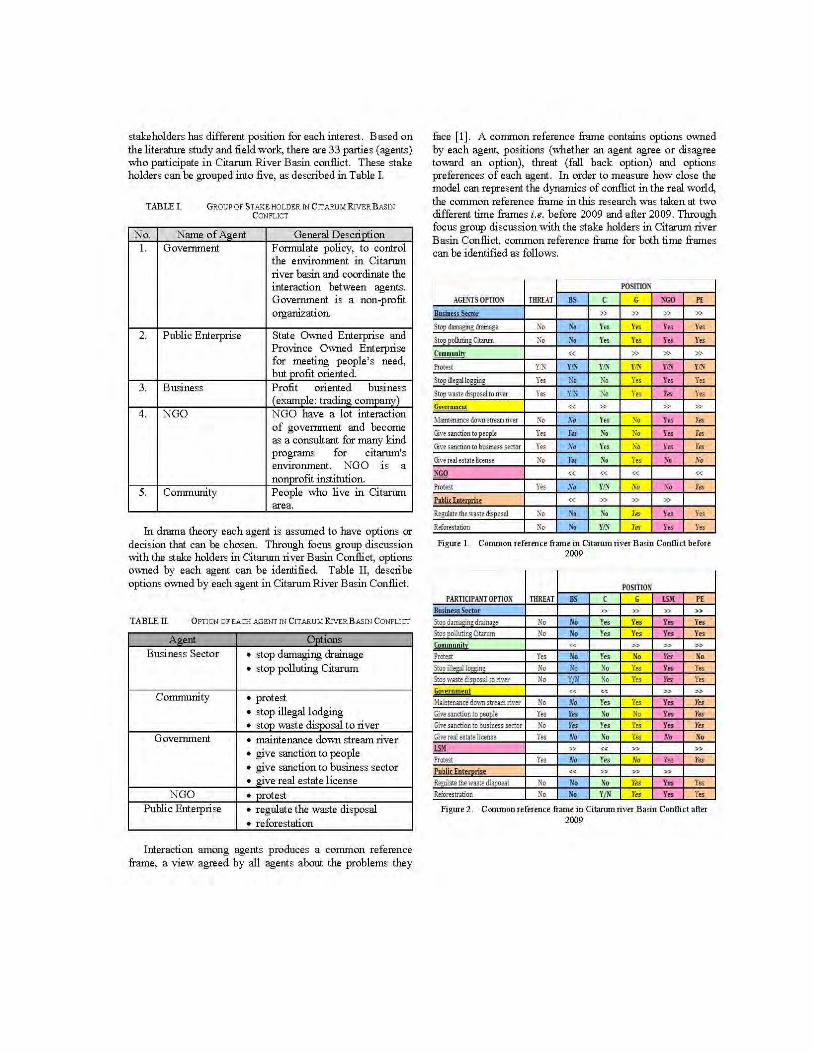
103
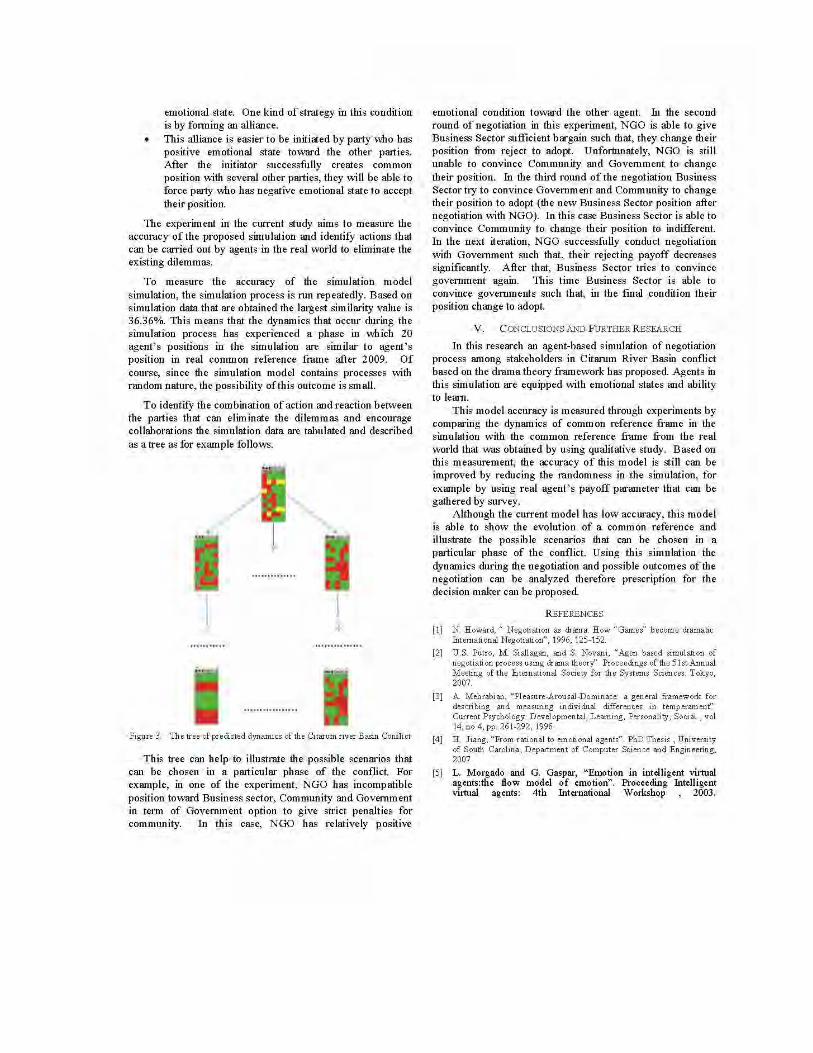
104