Embed Size (px)
Citation preview
Asian Macro & Market Outlook
SMAM monthly comments & views December 2015
Asian Economy The Chinese economy shows an increasing sign toward stabilization in the short term led by a modest rise in investments for infrastructure projects and order improvements by the construction sector. However, a sagging economic growth is highly likely to continue in the first half of 2016. The current pace of infrastructure investment, nearly 20% YoY, may not be sustainable from a perspective of constraint in financial resource. Therefore, we foresee the economic growth would stagnate to +5% dragged by investments in the medium term.
In Asian region, the central banks maintain monetary easing amid economic slowdown as China’s downturn and each country’s political or economic issues have hit Asian economies. An expectation for rate hike in U.S. emerged again, however the paces of currency depreciation vary by country. We raised real GDP growth forecasts in several Asian countries considering upwardly-revised China’s GDP growth estimate and expectation for effective use of “Off-budget”.
Asian Stock Markets We expect mild upside for the market given gradual recovery of the global macro economy, accommodative monetary policy and relatively low valuation.
Macro economies in most of Asian countries remain weak and likely to show gradual recovery towards next year. Especially the outlook for Chinese economy remains quite unclear. Risks for cash outflow and weaker currency continue.
The recovery of corporate earnings is delayed. Concerns continue for tighter liquidity conditions across Asia due to US rate hike. These are key concerns for Asian markets and these will create volatility in the near term. However accommodative monetary policy and relatively low valuation will support the market. Market will go up in line
with slow recovery of corporate earnings.
Executive summary
1 Note: Economy and Stock markets comments are as of November 16th and 29th 2015 respectively.

Outlook for Asian Economy
2
3
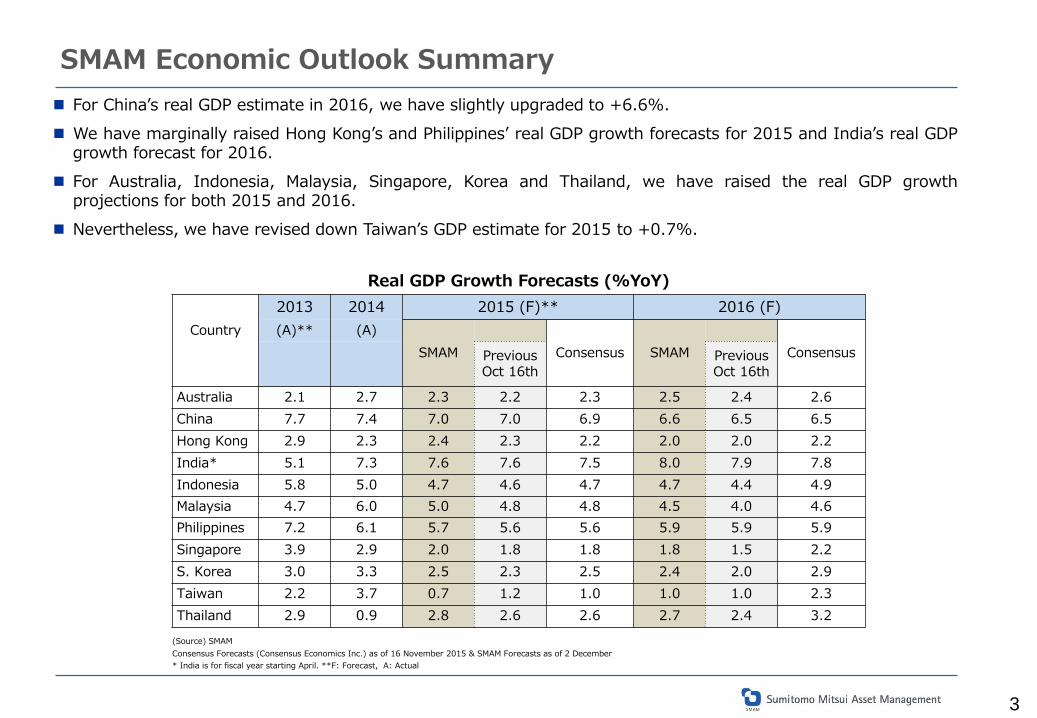
SMAM Economic Outlook Summary For China’s real GDP estimate in 2016, we have slightly upgraded to +6.6%. We have marginally raised Hong Kong’s and Philippines’ real GDP growth forecasts for 2015 and India’s real GDP
growth forecast for 2016. For Australia, Indonesia, Malaysia, Singapore, Korea and Thailand, we have raised the real GDP growth
projections for both 2015 and 2016. Nevertheless, we have revised down Taiwan’s GDP estimate for 2015 to +0.7%.
Real GDP Growth Forecasts (%YoY) 2013 2014 2015 (F)** 2016 (F)
Country (A)** (A) SMAM
Consensus SMAM
Consensus
Previous Oct 16th
Previous Oct 16th
Australia 2.1 2.7 2.3 2.2 2.3 2.5 2.4 2.6 China 7.7 7.4 7.0 7.0 6.9 6.6 6.5 6.5 Hong Kong 2.9 2.3 2.4 2.3 2.2 2.0 2.0 2.2 India* 5.1 7.3 7.6 7.6 7.5 8.0 7.9 7.8 Indonesia 5.8 5.0 4.7 4.6 4.7 4.7 4.4 4.9 Malaysia 4.7 6.0 5.0 4.8 4.8 4.5 4.0 4.6 Philippines 7.2 6.1 5.7 5.6 5.6 5.9 5.9 5.9 Singapore 3.9 2.9 2.0 1.8 1.8 1.8 1.5 2.2 S. Korea 3.0 3.3 2.5 2.3 2.5 2.4 2.0 2.9 Taiwan 2.2 3.7 0.7 1.2 1.0 1.0 1.0 2.3 Thailand 2.9 0.9 2.8 2.6 2.6 2.7 2.4 3.2 (Source) SMAM Consensus Forecasts (Consensus Economics Inc.) as of 16 November 2015 & SMAM Forecasts as of 2 December * India is for fiscal year starting April. **F: Forecast, A: Actual
4
Outlook for Economy in China
5
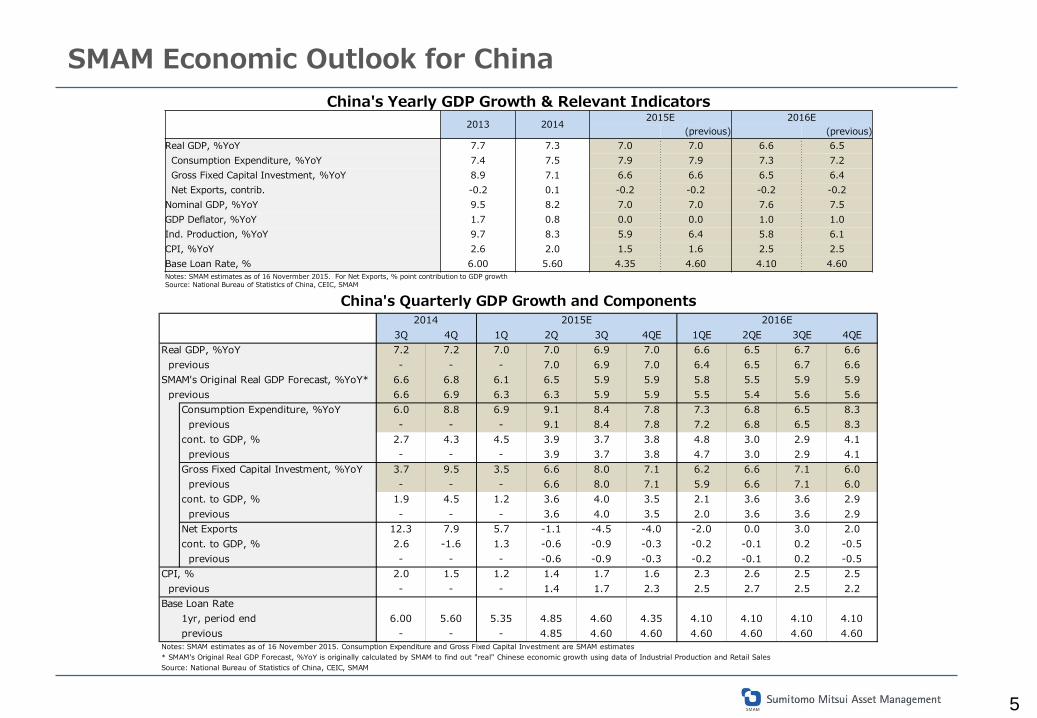
SMAM Economic Outlook for China China's Yearly GDP Growth & Relevant Indicators
2013 2014 2015E 2016E
(previous) (previous) Real GDP, %YoY 7.7 7.3 7.0 7.0 6.6 6.5 Consumption Expenditure, %YoY 7.4 7.5 7.9 7.9 7.3 7.2 Gross Fixed Capital Investment, %YoY 8.9 7.1 6.6 6.6 6.5 6.4 Net Exports, contrib. -0.2 0.1 -0.2 -0.2 -0.2 -0.2 Nominal GDP, %YoY 9.5 8.2 7.0 7.0 7.6 7.5 GDP Deflator, %YoY 1.7 0.8 0.0 0.0 1.0 1.0 Ind. Production, %YoY 9.7 8.3 5.9 6.4 5.8 6.1 CPI, %YoY 2.6 2.0 1.5 1.6 2.5 2.5 Base Loan Rate, % 6.00 5.60 4.35 4.60 4.10 4.60 Notes: SMAM estimates as of 16 Novermber 2015. For Net Exports, % point contribution to GDP growth Source: National Bureau of Statistics of China, CEIC, SMAM
3Q 4Q 1Q 2Q 3Q 4QE 1QE 2QE 3QE 4QEReal GDP, %YoY 7.2 7.2 7.0 7.0 6.9 7.0 6.6 6.5 6.7 6.6 previous - - - 7.0 6.9 7.0 6.4 6.5 6.7 6.6SMAM's Original Real GDP Forecast, %YoY* 6.6 6.8 6.1 6.5 5.9 5.9 5.8 5.5 5.9 5.9 previous 6.6 6.9 6.3 6.3 5.9 5.9 5.5 5.4 5.6 5.6
Consumption Expenditure, %YoY 6.0 8.8 6.9 9.1 8.4 7.8 7.3 6.8 6.5 8.3 previous - - - 9.1 8.4 7.8 7.2 6.8 6.5 8.3cont. to GDP, % 2.7 4.3 4.5 3.9 3.7 3.8 4.8 3.0 2.9 4.1 previous - - - 3.9 3.7 3.8 4.7 3.0 2.9 4.1Gross Fixed Capital Investment, %YoY 3.7 9.5 3.5 6.6 8.0 7.1 6.2 6.6 7.1 6.0 previous - - - 6.6 8.0 7.1 5.9 6.6 7.1 6.0cont. to GDP, % 1.9 4.5 1.2 3.6 4.0 3.5 2.1 3.6 3.6 2.9 previous - - - 3.6 4.0 3.5 2.0 3.6 3.6 2.9Net Exports 12.3 7.9 5.7 -1.1 -4.5 -4.0 -2.0 0.0 3.0 2.0cont. to GDP, % 2.6 -1.6 1.3 -0.6 -0.9 -0.3 -0.2 -0.1 0.2 -0.5 previous - - - -0.6 -0.9 -0.3 -0.2 -0.1 0.2 -0.5
CPI, % 2.0 1.5 1.2 1.4 1.7 1.6 2.3 2.6 2.5 2.5 previous - - - 1.4 1.7 2.3 2.5 2.7 2.5 2.2Base Loan Rate
1yr, period end 6.00 5.60 5.35 4.85 4.60 4.35 4.10 4.10 4.10 4.10previous - - - 4.85 4.60 4.60 4.60 4.60 4.60 4.60
Source: National Bureau of Statistics of China, CEIC, SMAM
China's Quarterly GDP Growth and Components
Notes: SMAM estimates as of 16 November 2015. Consumption Expenditure and Gross Fixed Capital Investment are SMAM estimates* SMAM's Original Real GDP Forecast, %YoY is originally calculated by SMAM to find out "real" Chinese economic growth using data of Industrial Production and Retail Sales
2014 2015E 2016E
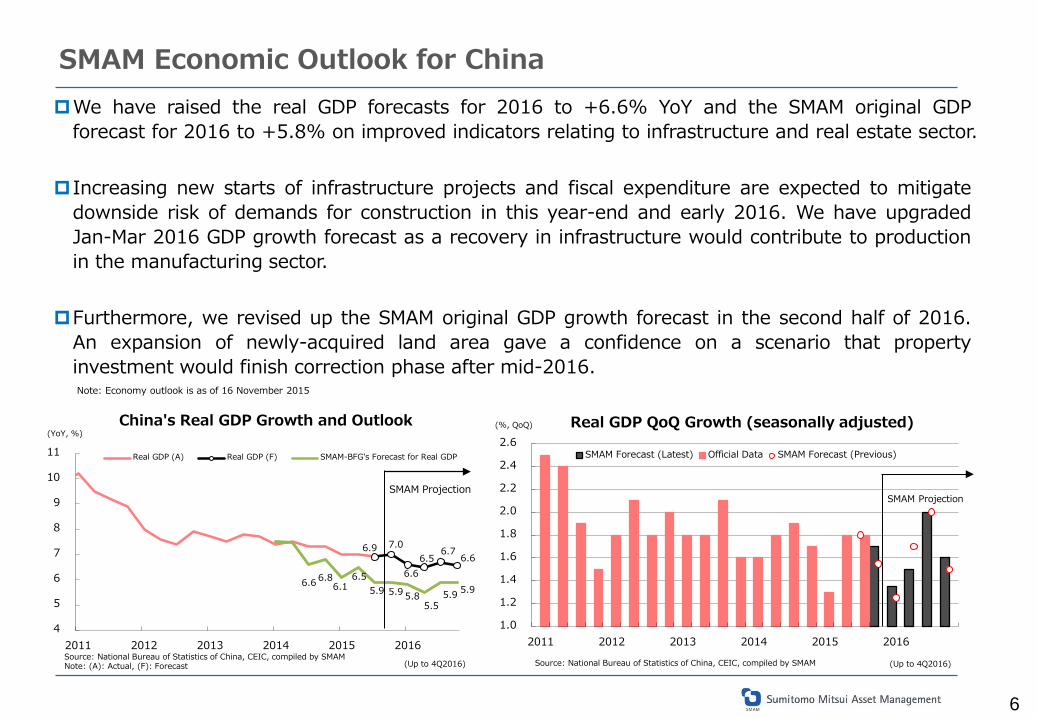
We have raised the real GDP forecasts for 2016 to +6.6% YoY and the SMAM original GDP forecast for 2016 to +5.8% on improved indicators relating to infrastructure and real estate sector.
Increasing new starts of infrastructure projects and fiscal expenditure are expected to mitigate downside risk of demands for construction in this year-end and early 2016. We have upgraded Jan-Mar 2016 GDP growth forecast as a recovery in infrastructure would contribute to production in the manufacturing sector.
Furthermore, we revised up the SMAM original GDP growth forecast in the second half of 2016. An expansion of newly-acquired land area gave a confidence on a scenario that property investment would finish correction phase after mid-2016.
SMAM Economic Outlook for China
6
Note: Economy outlook is as of 16 November 2015
China's Real GDP Growth and Outlook
Source: National Bureau of Statistics of China, CEIC, compiled by SMAM Note: (A): Actual, (F): Forecast
Real GDP QoQ Growth (seasonally adjusted)
Source: National Bureau of Statistics of China, CEIC, compiled by SMAM (Up to 4Q2016) (Up to 4Q2016)
1.0
1.2
1.4
1.6
1.8
2.0
2.2
2.4
2.6
2011 2012 2013 2014 2015 2016
SMAM Forecast (Latest) Official Data SMAM Forecast (Previous)
(%, QoQ)
SMAM Projection
6.9 7.0
6.6 6.5
6.7 6.6
6.6 6.8 6.1
6.5 5.9 5.9 5.8
5.5 5.9 5.9
4
5
6
7
8
9
10
11
2011 2012 2013 2014 2015 2016
Real GDP (A) Real GDP (F) SMAM-BFG's Forecast for Real GDP
(YoY, %)
SMAM Projection
7
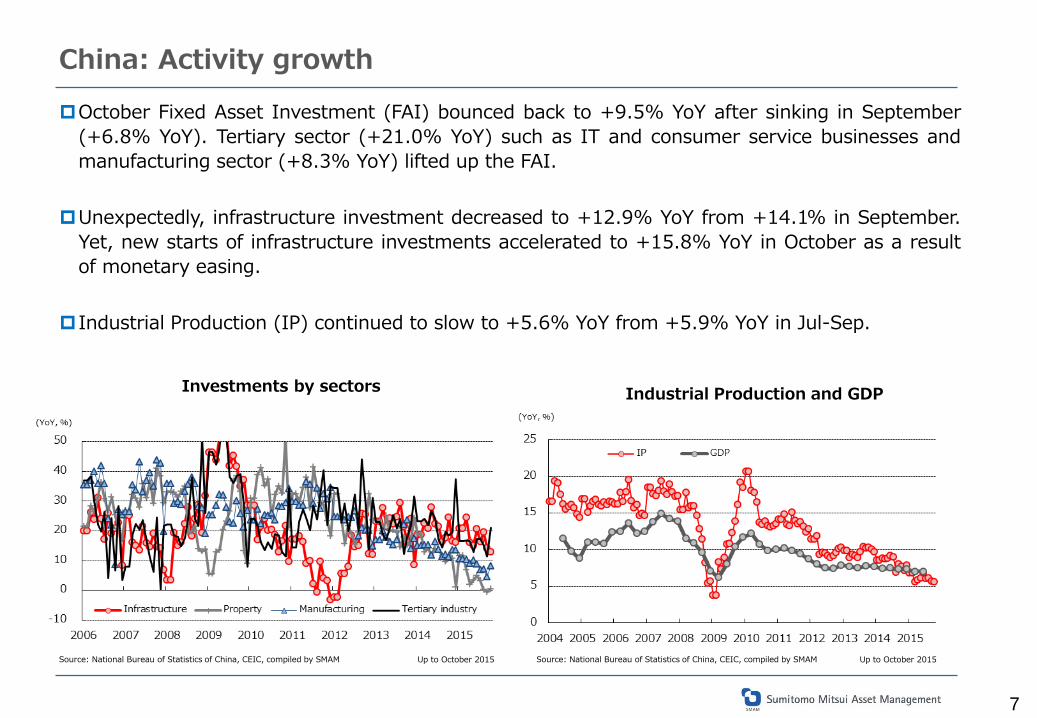
China: Activity growth
Source: National Bureau of Statistics of China, CEIC, compiled by SMAM
Industrial Production and GDP
October Fixed Asset Investment (FAI) bounced back to +9.5% YoY after sinking in September (+6.8% YoY). Tertiary sector (+21.0% YoY) such as IT and consumer service businesses and manufacturing sector (+8.3% YoY) lifted up the FAI.
Unexpectedly, infrastructure investment decreased to +12.9% YoY from +14.1% in September. Yet, new starts of infrastructure investments accelerated to +15.8% YoY in October as a result of monetary easing.
Industrial Production (IP) continued to slow to +5.6% YoY from +5.9% YoY in Jul-Sep.
Investments by sectors
Source: National Bureau of Statistics of China, CEIC, compiled by SMAM Up to October 2015 Up to October 2015
8
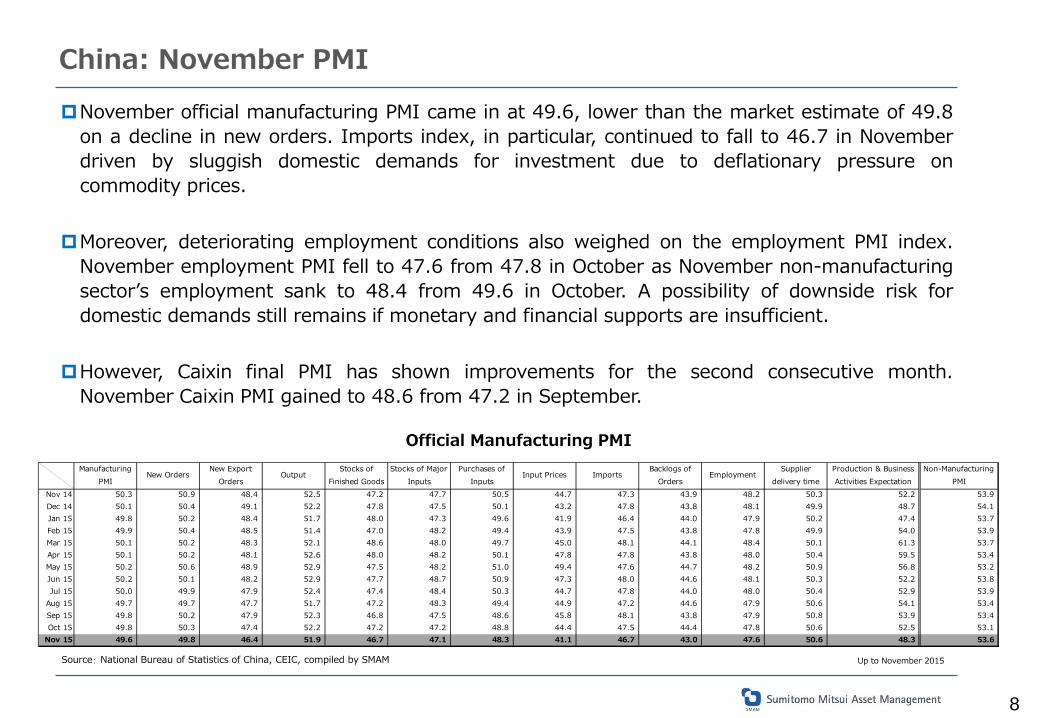
China: November PMI
November official manufacturing PMI came in at 49.6, lower than the market estimate of 49.8 on a decline in new orders. Imports index, in particular, continued to fall to 46.7 in November driven by sluggish domestic demands for investment due to deflationary pressure on commodity prices.
Moreover, deteriorating employment conditions also weighed on the employment PMI index. November employment PMI fell to 47.6 from 47.8 in October as November non-manufacturing sector’s employment sank to 48.4 from 49.6 in October. A possibility of downside risk for domestic demands still remains if monetary and financial supports are insufficient.
However, Caixin final PMI has shown improvements for the second consecutive month. November Caixin PMI gained to 48.6 from 47.2 in September.
Source: National Bureau of Statistics of China, CEIC, compiled by SMAM
Official Manufacturing PMI
Up to November 2015
ManufacturingPMI
New OrdersNew Export
OrdersOutput
Stocks ofFinished Goods
Stocks of MajorInputs
Purchases ofInputs
Input Prices ImportsBacklogs of
OrdersEmployment
Supplierdelivery time
Production & BusinessActivities Expectation
Non-ManufacturingPMI
Nov 14 50.3 50.9 48.4 52.5 47.2 47.7 50.5 44.7 47.3 43.9 48.2 50.3 52.2 53.9Dec 14 50.1 50.4 49.1 52.2 47.8 47.5 50.1 43.2 47.8 43.8 48.1 49.9 48.7 54.1Jan 15 49.8 50.2 48.4 51.7 48.0 47.3 49.6 41.9 46.4 44.0 47.9 50.2 47.4 53.7Feb 15 49.9 50.4 48.5 51.4 47.0 48.2 49.4 43.9 47.5 43.8 47.8 49.9 54.0 53.9Mar 15 50.1 50.2 48.3 52.1 48.6 48.0 49.7 45.0 48.1 44.1 48.4 50.1 61.3 53.7Apr 15 50.1 50.2 48.1 52.6 48.0 48.2 50.1 47.8 47.8 43.8 48.0 50.4 59.5 53.4May 15 50.2 50.6 48.9 52.9 47.5 48.2 51.0 49.4 47.6 44.7 48.2 50.9 56.8 53.2Jun 15 50.2 50.1 48.2 52.9 47.7 48.7 50.9 47.3 48.0 44.6 48.1 50.3 52.2 53.8Jul 15 50.0 49.9 47.9 52.4 47.4 48.4 50.3 44.7 47.8 44.0 48.0 50.4 52.9 53.9
Aug 15 49.7 49.7 47.7 51.7 47.2 48.3 49.4 44.9 47.2 44.6 47.9 50.6 54.1 53.4Sep 15 49.8 50.2 47.9 52.3 46.8 47.5 48.6 45.8 48.1 43.8 47.9 50.8 53.9 53.4Oct 15 49.8 50.3 47.4 52.2 47.2 47.2 48.8 44.4 47.5 44.4 47.8 50.6 52.5 53.1
Nov 15 49.6 49.8 46.4 51.9 46.7 47.1 48.3 41.1 46.7 43.0 47.6 50.6 48.3 53.6

9
Outlook for Economies in Asia
10
Australia
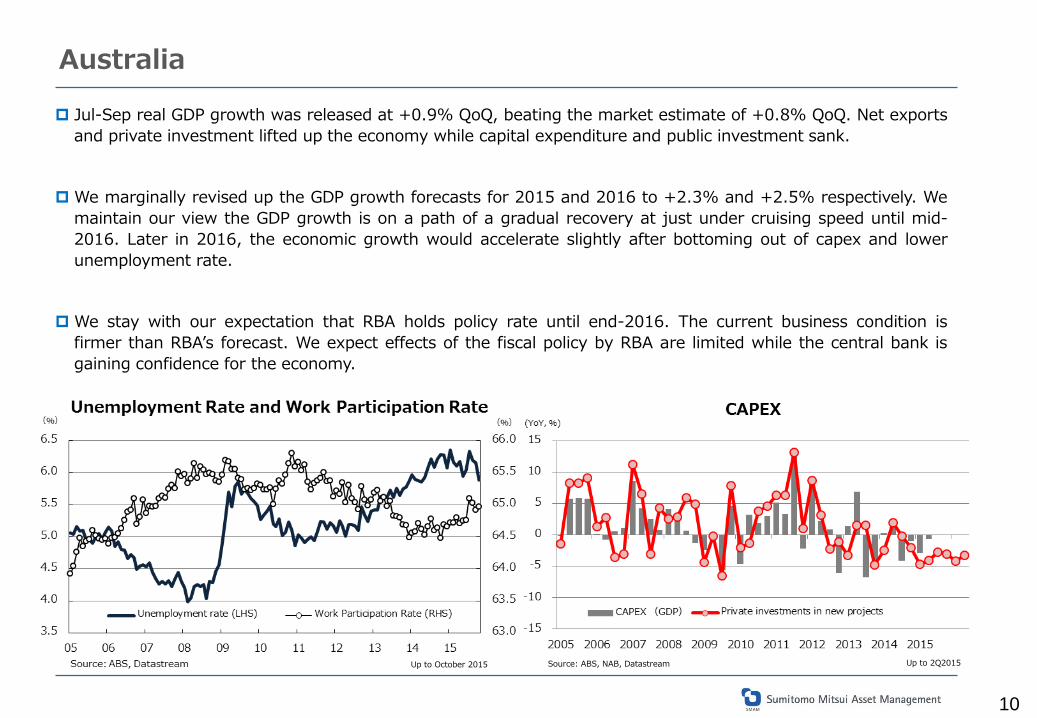
Jul-Sep real GDP growth was released at +0.9% QoQ, beating the market estimate of +0.8% QoQ. Net exports and private investment lifted up the economy while capital expenditure and public investment sank.
We marginally revised up the GDP growth forecasts for 2015 and 2016 to +2.3% and +2.5% respectively. We maintain our view the GDP growth is on a path of a gradual recovery at just under cruising speed until mid-2016. Later in 2016, the economic growth would accelerate slightly after bottoming out of capex and lower unemployment rate.
We stay with our expectation that RBA holds policy rate until end-2016. The current business condition is firmer than RBA’s forecast. We expect effects of the fiscal policy by RBA are limited while the central bank is gaining confidence for the economy.
Up to October 2015 Up to 2Q2015 Source: ABS, NAB, Datastream
11
Hong Kong
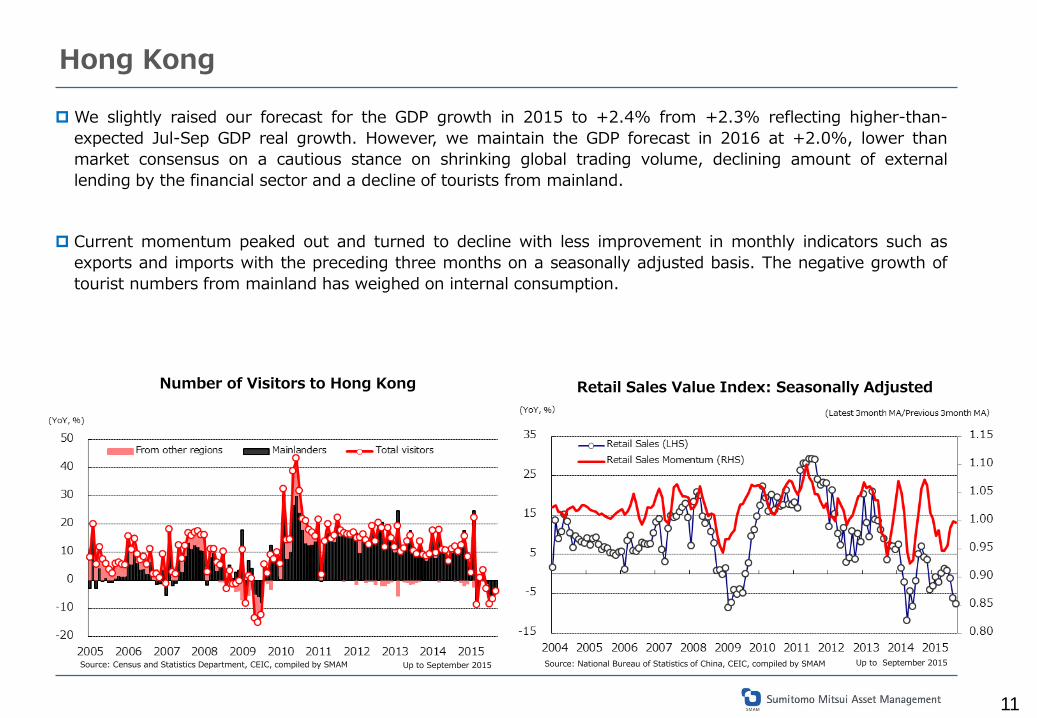
We slightly raised our forecast for the GDP growth in 2015 to +2.4% from +2.3% reflecting higher-than-expected Jul-Sep GDP real growth. However, we maintain the GDP forecast in 2016 at +2.0%, lower than market consensus on a cautious stance on shrinking global trading volume, declining amount of external lending by the financial sector and a decline of tourists from mainland.
Current momentum peaked out and turned to decline with less improvement in monthly indicators such as exports and imports with the preceding three months on a seasonally adjusted basis. The negative growth of tourist numbers from mainland has weighed on internal consumption.
Source: National Bureau of Statistics of China, CEIC, compiled by SMAM
Number of Visitors to Hong Kong Retail Sales Value Index: Seasonally Adjusted
Up to September 2015 Up to September 2015 Source: Census and Statistics Department, CEIC, compiled by SMAM
Source: CEIC, SMAM
12
India
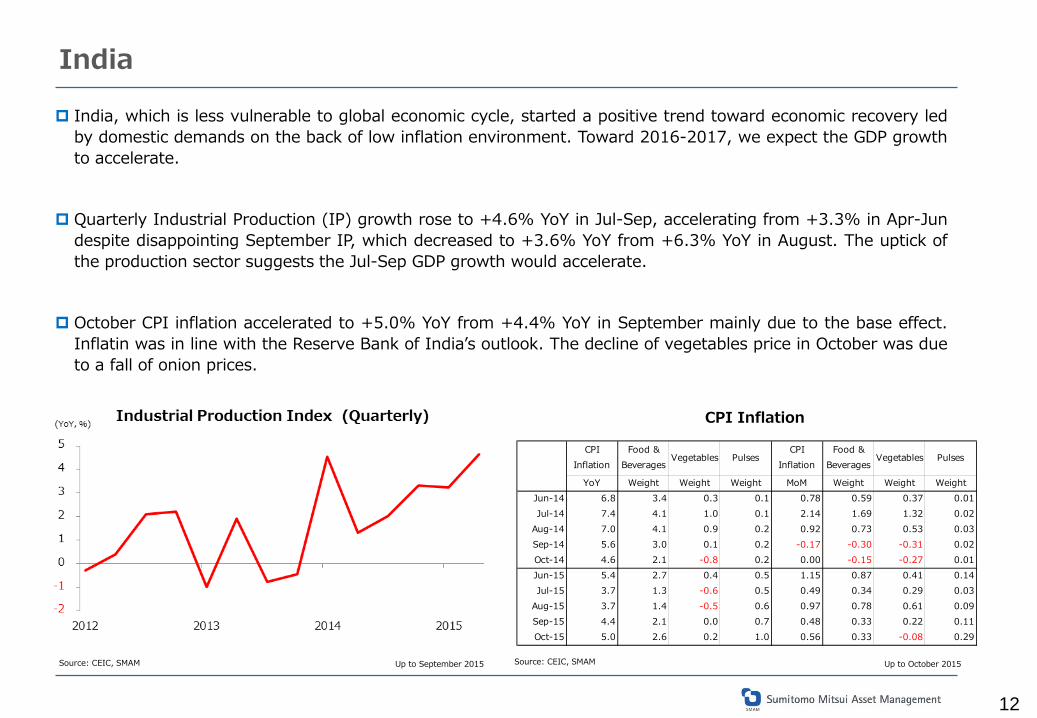
India, which is less vulnerable to global economic cycle, started a positive trend toward economic recovery led by domestic demands on the back of low inflation environment. Toward 2016-2017, we expect the GDP growth to accelerate.
Quarterly Industrial Production (IP) growth rose to +4.6% YoY in Jul-Sep, accelerating from +3.3% in Apr-Jun despite disappointing September IP, which decreased to +3.6% YoY from +6.3% YoY in August. The uptick of the production sector suggests the Jul-Sep GDP growth would accelerate.
October CPI inflation accelerated to +5.0% YoY from +4.4% YoY in September mainly due to the base effect. Inflatin was in line with the Reserve Bank of India’s outlook. The decline of vegetables price in October was due to a fall of onion prices.
Up to October 2015 Source: CEIC, SMAM Up to September 2015
CPI Inflation
CPIInflation
Food &Beverages
Vegetables PulsesCPI
InflationFood &
BeveragesVegetables Pulses
YoY Weight Weight Weight MoM Weight Weight WeightJun-14 6.8 3.4 0.3 0.1 0.78 0.59 0.37 0.01Jul-14 7.4 4.1 1.0 0.1 2.14 1.69 1.32 0.02
Aug-14 7.0 4.1 0.9 0.2 0.92 0.73 0.53 0.03Sep-14 5.6 3.0 0.1 0.2 -0.17 -0.30 -0.31 0.02Oct-14 4.6 2.1 -0.8 0.2 0.00 -0.15 -0.27 0.01Jun-15 5.4 2.7 0.4 0.5 1.15 0.87 0.41 0.14Jul-15 3.7 1.3 -0.6 0.5 0.49 0.34 0.29 0.03
Aug-15 3.7 1.4 -0.5 0.6 0.97 0.78 0.61 0.09Sep-15 4.4 2.1 0.0 0.7 0.48 0.33 0.22 0.11Oct-15 5.0 2.6 0.2 1.0 0.56 0.33 -0.08 0.29
13
Indonesia
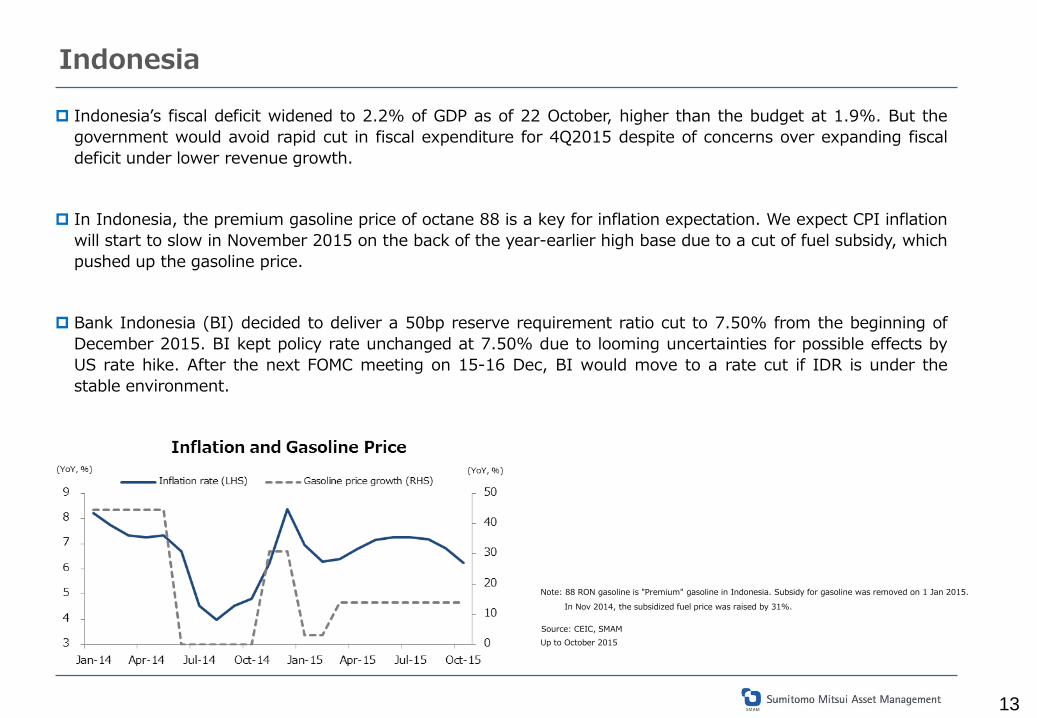
Indonesia’s fiscal deficit widened to 2.2% of GDP as of 22 October, higher than the budget at 1.9%. But the government would avoid rapid cut in fiscal expenditure for 4Q2015 despite of concerns over expanding fiscal deficit under lower revenue growth.
In Indonesia, the premium gasoline price of octane 88 is a key for inflation expectation. We expect CPI inflation will start to slow in November 2015 on the back of the year-earlier high base due to a cut of fuel subsidy, which pushed up the gasoline price.
Bank Indonesia (BI) decided to deliver a 50bp reserve requirement ratio cut to 7.50% from the beginning of December 2015. BI kept policy rate unchanged at 7.50% due to looming uncertainties for possible effects by US rate hike. After the next FOMC meeting on 15-16 Dec, BI would move to a rate cut if IDR is under the stable environment.
Source: CEIC, SMAM Up to October 2015
Note: 88 RON gasoline is "Premium" gasoline in Indonesia. Subsidy for gasoline was removed on 1 Jan 2015.
In Nov 2014, the subsidized fuel price was raised by 31%.
14
Malaysia
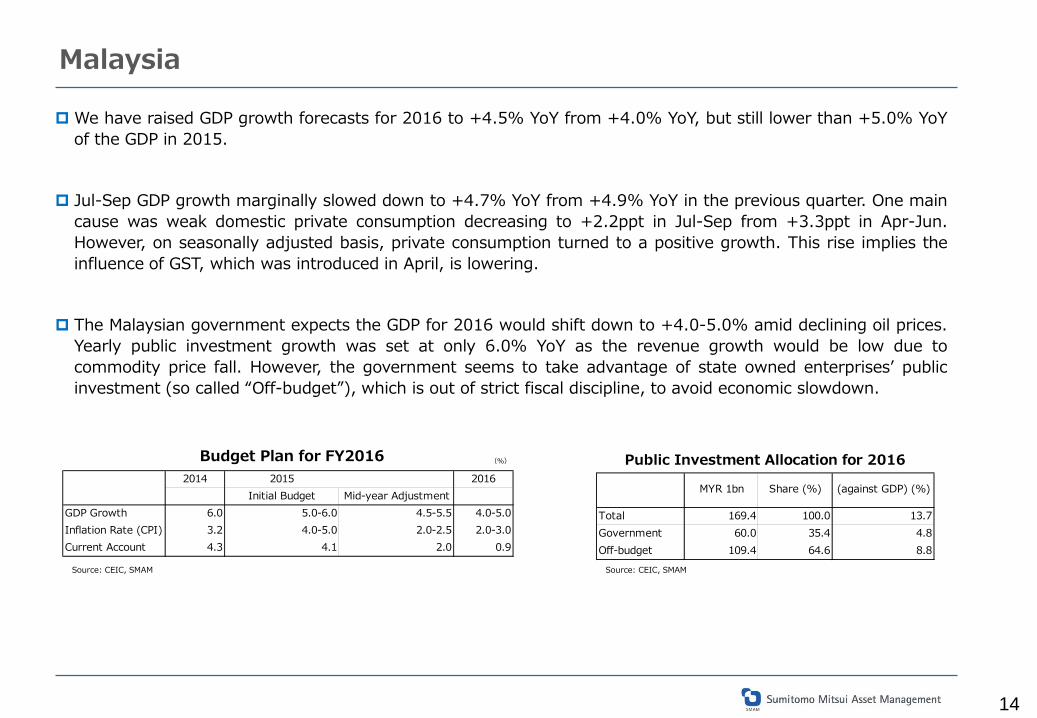
We have raised GDP growth forecasts for 2016 to +4.5% YoY from +4.0% YoY, but still lower than +5.0% YoY of the GDP in 2015.
Jul-Sep GDP growth marginally slowed down to +4.7% YoY from +4.9% YoY in the previous quarter. One main cause was weak domestic private consumption decreasing to +2.2ppt in Jul-Sep from +3.3ppt in Apr-Jun. However, on seasonally adjusted basis, private consumption turned to a positive growth. This rise implies the influence of GST, which was introduced in April, is lowering.
The Malaysian government expects the GDP for 2016 would shift down to +4.0-5.0% amid declining oil prices. Yearly public investment growth was set at only 6.0% YoY as the revenue growth would be low due to commodity price fall. However, the government seems to take advantage of state owned enterprises’ public investment (so called “Off-budget”), which is out of strict fiscal discipline, to avoid economic slowdown.
Source: CEIC, SMAM Source: CEIC, SMAM
(%)
2014 2015 2016Initial Budget Mid-year Adjustment
GDP Growth 6.0 5.0-6.0 4.5-5.5 4.0-5.0Inflation Rate (CPI) 3.2 4.0-5.0 2.0-2.5 2.0-3.0Current Account 4.3 4.1 2.0 0.9
Budget Plan for FY2016
Total 169.4 100.0 13.7Government 60.0 35.4 4.8Off-budget 109.4 64.6 8.8
Public Investment Allocation for 2016
MYR 1bn Share (%) (against GDP) (%)
15
Philippines
Up to October 2015
Up to September 2015
Source: CEIC, SMAM
Source: CEIC, SMAM
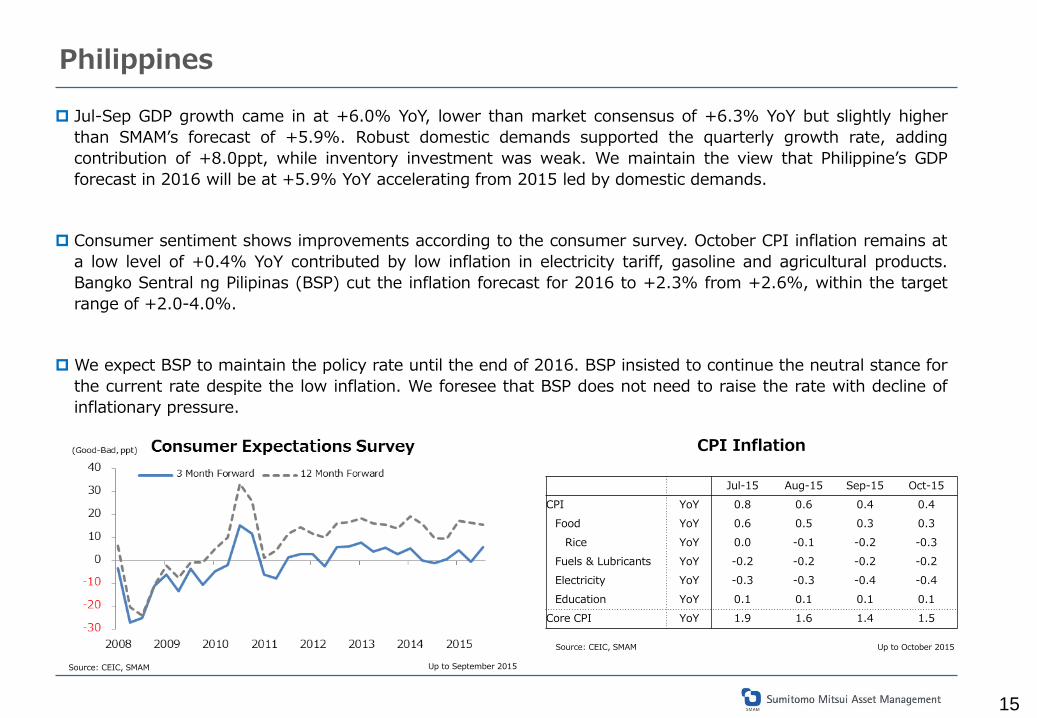
Jul-Sep GDP growth came in at +6.0% YoY, lower than market consensus of +6.3% YoY but slightly higher than SMAM’s forecast of +5.9%. Robust domestic demands supported the quarterly growth rate, adding contribution of +8.0ppt, while inventory investment was weak. We maintain the view that Philippine’s GDP forecast in 2016 will be at +5.9% YoY accelerating from 2015 led by domestic demands.
Consumer sentiment shows improvements according to the consumer survey. October CPI inflation remains at a low level of +0.4% YoY contributed by low inflation in electricity tariff, gasoline and agricultural products. Bangko Sentral ng Pilipinas (BSP) cut the inflation forecast for 2016 to +2.3% from +2.6%, within the target range of +2.0-4.0%.
We expect BSP to maintain the policy rate until the end of 2016. BSP insisted to continue the neutral stance for the current rate despite the low inflation. We foresee that BSP does not need to raise the rate with decline of inflationary pressure.
CPI Inflation
Jul-15 Aug-15 Sep-15 Oct-15 CPI YoY 0.8 0.6 0.4 0.4 Food YoY 0.6 0.5 0.3 0.3 Rice YoY 0.0 -0.1 -0.2 -0.3 Fuels & Lubricants YoY -0.2 -0.2 -0.2 -0.2 Electricity YoY -0.3 -0.3 -0.4 -0.4 Education YoY 0.1 0.1 0.1 0.1 Core CPI YoY 1.9 1.6 1.4 1.5
16
Singapore
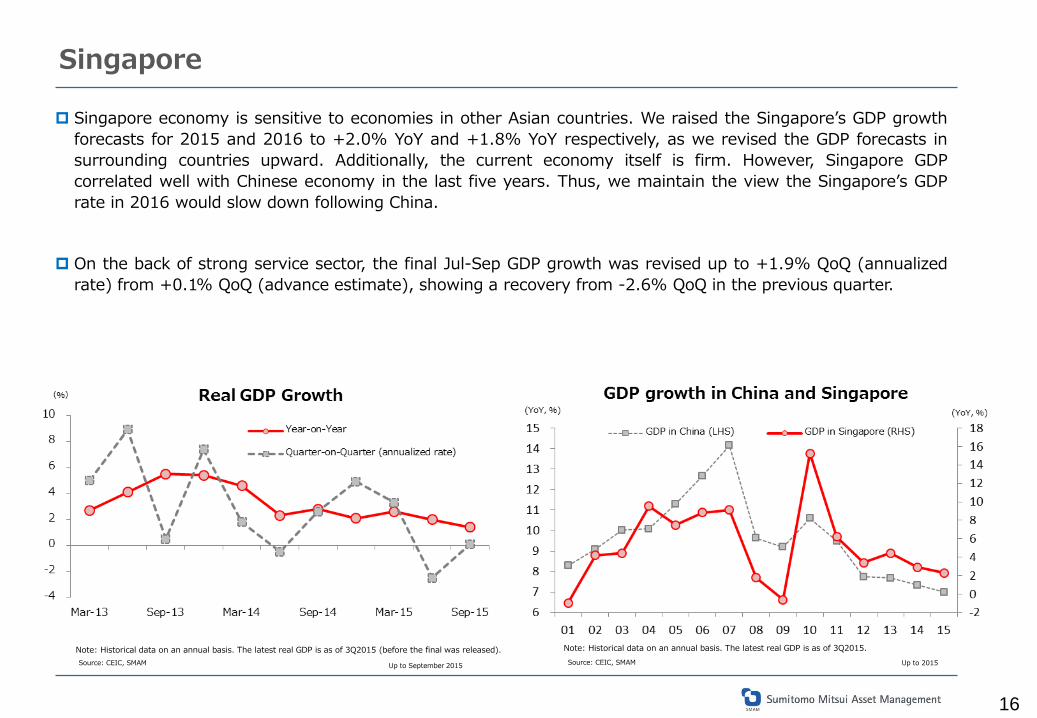
Singapore economy is sensitive to economies in other Asian countries. We raised the Singapore’s GDP growth forecasts for 2015 and 2016 to +2.0% YoY and +1.8% YoY respectively, as we revised the GDP forecasts in surrounding countries upward. Additionally, the current economy itself is firm. However, Singapore GDP correlated well with Chinese economy in the last five years. Thus, we maintain the view the Singapore’s GDP rate in 2016 would slow down following China.
On the back of strong service sector, the final Jul-Sep GDP growth was revised up to +1.9% QoQ (annualized rate) from +0.1% QoQ (advance estimate), showing a recovery from -2.6% QoQ in the previous quarter.
Source: CEIC, SMAM Source: CEIC, SMAM Up to September 2015 Up to 2015
Note: Historical data on an annual basis. The latest real GDP is as of 3Q2015 (before the final was released). Note: Historical data on an annual basis. The latest real GDP is as of 3Q2015.
17
South Korea
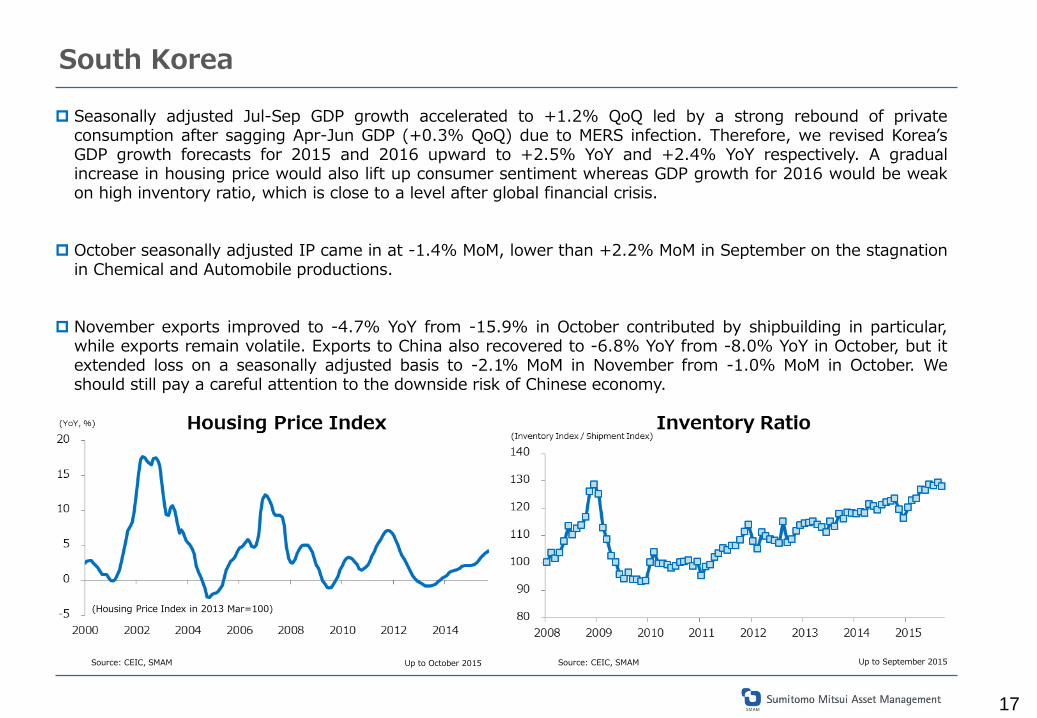
Seasonally adjusted Jul-Sep GDP growth accelerated to +1.2% QoQ led by a strong rebound of private consumption after sagging Apr-Jun GDP (+0.3% QoQ) due to MERS infection. Therefore, we revised Korea’s GDP growth forecasts for 2015 and 2016 upward to +2.5% YoY and +2.4% YoY respectively. A gradual increase in housing price would also lift up consumer sentiment whereas GDP growth for 2016 would be weak on high inventory ratio, which is close to a level after global financial crisis.
October seasonally adjusted IP came in at -1.4% MoM, lower than +2.2% MoM in September on the stagnation in Chemical and Automobile productions.
November exports improved to -4.7% YoY from -15.9% in October contributed by shipbuilding in particular, while exports remain volatile. Exports to China also recovered to -6.8% YoY from -8.0% YoY in October, but it extended loss on a seasonally adjusted basis to -2.1% MoM in November from -1.0% MoM in October. We should still pay a careful attention to the downside risk of Chinese economy.
Up to September 2015 Source: CEIC, SMAM
(Housing Price Index in 2013 Mar=100)
Source: CEIC, SMAM Up to October 2015
18
Taiwan
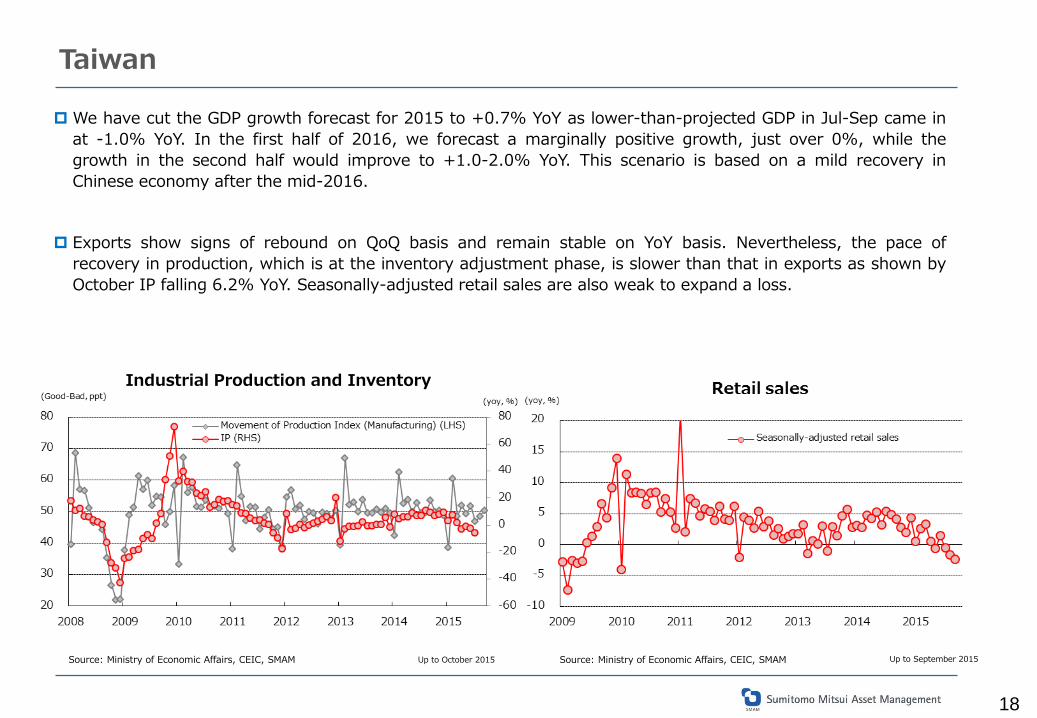
We have cut the GDP growth forecast for 2015 to +0.7% YoY as lower-than-projected GDP in Jul-Sep came in at -1.0% YoY. In the first half of 2016, we forecast a marginally positive growth, just over 0%, while the growth in the second half would improve to +1.0-2.0% YoY. This scenario is based on a mild recovery in Chinese economy after the mid-2016.
Exports show signs of rebound on QoQ basis and remain stable on YoY basis. Nevertheless, the pace of recovery in production, which is at the inventory adjustment phase, is slower than that in exports as shown by October IP falling 6.2% YoY. Seasonally-adjusted retail sales are also weak to expand a loss.
Industrial Production and Inventory
Source: Ministry of Economic Affairs, CEIC, SMAM Source: Ministry of Economic Affairs, CEIC, SMAM Up to October 2015 Up to September 2015
19
Thailand
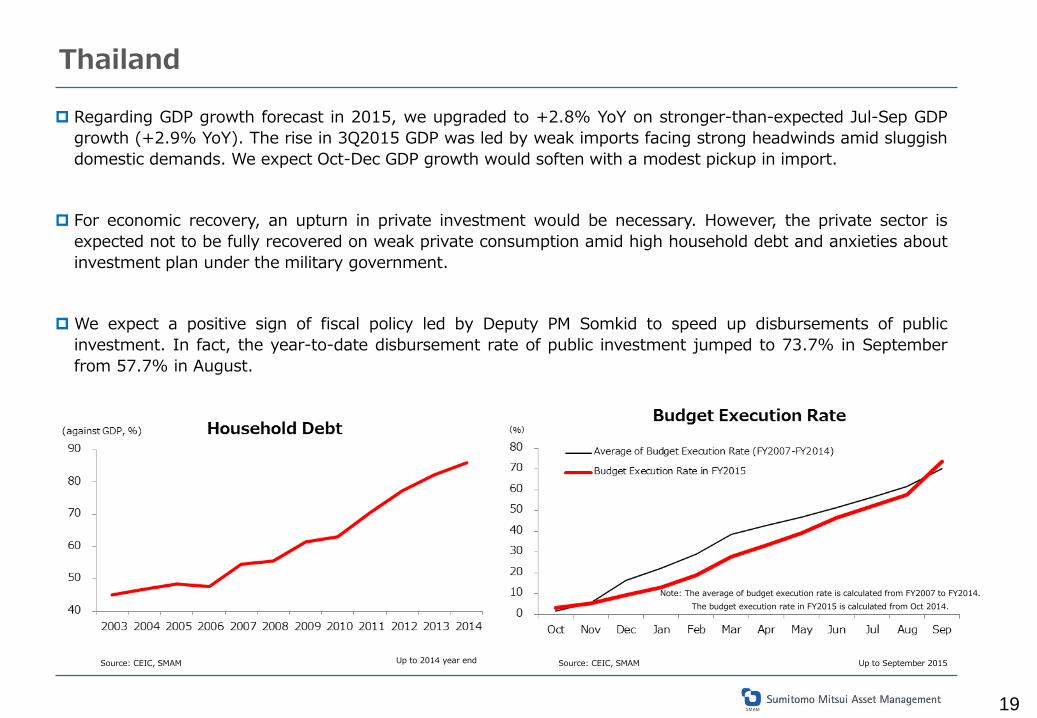
Regarding GDP growth forecast in 2015, we upgraded to +2.8% YoY on stronger-than-expected Jul-Sep GDP growth (+2.9% YoY). The rise in 3Q2015 GDP was led by weak imports facing strong headwinds amid sluggish domestic demands. We expect Oct-Dec GDP growth would soften with a modest pickup in import.
For economic recovery, an upturn in private investment would be necessary. However, the private sector is expected not to be fully recovered on weak private consumption amid high household debt and anxieties about investment plan under the military government.
We expect a positive sign of fiscal policy led by Deputy PM Somkid to speed up disbursements of public investment. In fact, the year-to-date disbursement rate of public investment jumped to 73.7% in September from 57.7% in August.
Up to September 2015 Up to 2014 year end Source: CEIC, SMAM Source: CEIC, SMAM
Note: The average of budget execution rate is calculated from FY2007 to FY2014. The budget execution rate in FY2015 is calculated from Oct 2014.

20
Outlook for Asian Stock Markets
21
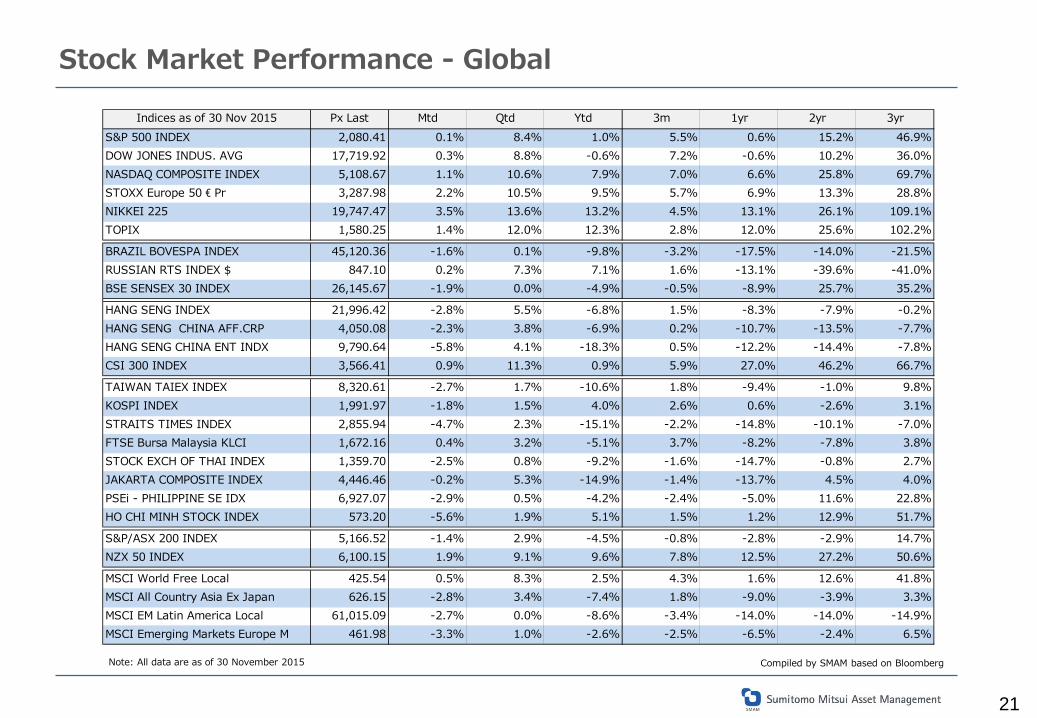
Stock Market Performance - Global
Compiled by SMAM based on Bloomberg Note: All data are as of 30 November 2015
Indices as of 30 Nov 2015 Px Last Mtd Qtd Ytd 3m 1yr 2yr 3yrS&P 500 INDEX 2,080.41 0.1% 8.4% 1.0% 5.5% 0.6% 15.2% 46.9%DOW JONES INDUS. AVG 17,719.92 0.3% 8.8% -0.6% 7.2% -0.6% 10.2% 36.0%NASDAQ COMPOSITE INDEX 5,108.67 1.1% 10.6% 7.9% 7.0% 6.6% 25.8% 69.7%STOXX Europe 50 € Pr 3,287.98 2.2% 10.5% 9.5% 5.7% 6.9% 13.3% 28.8%NIKKEI 225 19,747.47 3.5% 13.6% 13.2% 4.5% 13.1% 26.1% 109.1%TOPIX 1,580.25 1.4% 12.0% 12.3% 2.8% 12.0% 25.6% 102.2%
BRAZIL BOVESPA INDEX 45,120.36 -1.6% 0.1% -9.8% -3.2% -17.5% -14.0% -21.5%RUSSIAN RTS INDEX $ 847.10 0.2% 7.3% 7.1% 1.6% -13.1% -39.6% -41.0%BSE SENSEX 30 INDEX 26,145.67 -1.9% 0.0% -4.9% -0.5% -8.9% 25.7% 35.2%
HANG SENG INDEX 21,996.42 -2.8% 5.5% -6.8% 1.5% -8.3% -7.9% -0.2%HANG SENG CHINA AFF.CRP 4,050.08 -2.3% 3.8% -6.9% 0.2% -10.7% -13.5% -7.7%HANG SENG CHINA ENT INDX 9,790.64 -5.8% 4.1% -18.3% 0.5% -12.2% -14.4% -7.8%CSI 300 INDEX 3,566.41 0.9% 11.3% 0.9% 5.9% 27.0% 46.2% 66.7%
TAIWAN TAIEX INDEX 8,320.61 -2.7% 1.7% -10.6% 1.8% -9.4% -1.0% 9.8%KOSPI INDEX 1,991.97 -1.8% 1.5% 4.0% 2.6% 0.6% -2.6% 3.1%STRAITS TIMES INDEX 2,855.94 -4.7% 2.3% -15.1% -2.2% -14.8% -10.1% -7.0%FTSE Bursa Malaysia KLCI 1,672.16 0.4% 3.2% -5.1% 3.7% -8.2% -7.8% 3.8%STOCK EXCH OF THAI INDEX 1,359.70 -2.5% 0.8% -9.2% -1.6% -14.7% -0.8% 2.7%JAKARTA COMPOSITE INDEX 4,446.46 -0.2% 5.3% -14.9% -1.4% -13.7% 4.5% 4.0%PSEi - PHILIPPINE SE IDX 6,927.07 -2.9% 0.5% -4.2% -2.4% -5.0% 11.6% 22.8%HO CHI MINH STOCK INDEX 573.20 -5.6% 1.9% 5.1% 1.5% 1.2% 12.9% 51.7%
S&P/ASX 200 INDEX 5,166.52 -1.4% 2.9% -4.5% -0.8% -2.8% -2.9% 14.7%NZX 50 INDEX 6,100.15 1.9% 9.1% 9.6% 7.8% 12.5% 27.2% 50.6%
MSCI World Free Local 425.54 0.5% 8.3% 2.5% 4.3% 1.6% 12.6% 41.8%MSCI All Country Asia Ex Japan 626.15 -2.8% 3.4% -7.4% 1.8% -9.0% -3.9% 3.3%MSCI EM Latin America Local 61,015.09 -2.7% 0.0% -8.6% -3.4% -14.0% -14.0% -14.9%MSCI Emerging Markets Europe M 461.98 -3.3% 1.0% -2.6% -2.5% -6.5% -2.4% 6.5%
22
Note: As of 27 November 2015 Source: SMAM
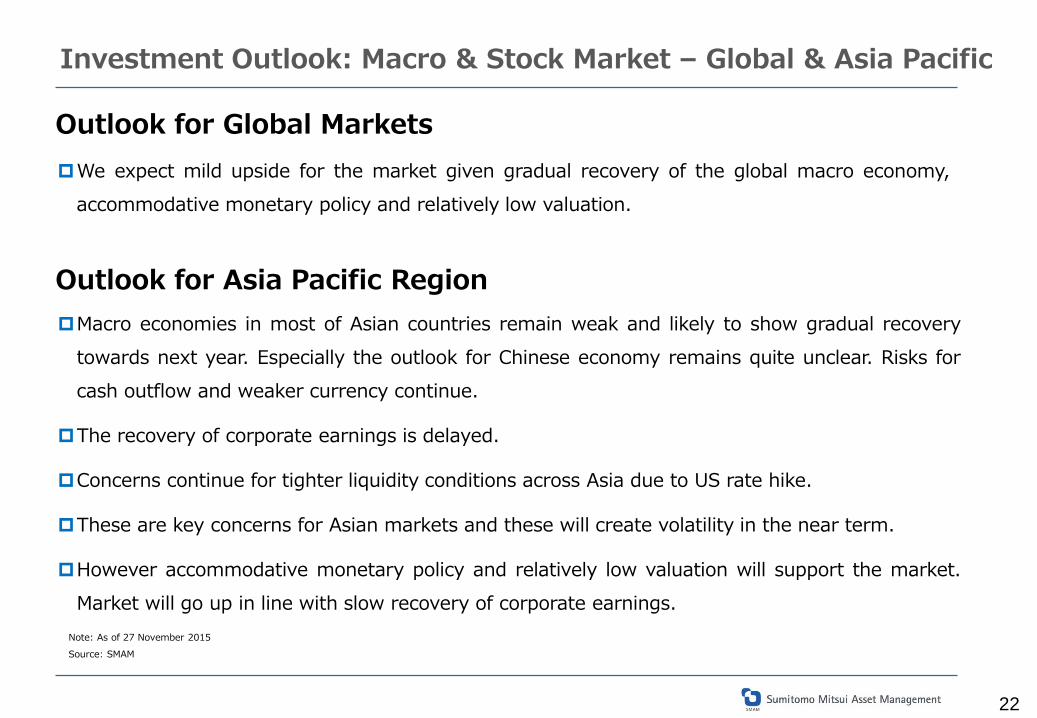
Outlook for Global Markets
Investment Outlook: Macro & Stock Market – Global & Asia Pacific
Outlook for Asia Pacific Region Macro economies in most of Asian countries remain weak and likely to show gradual recovery
towards next year. Especially the outlook for Chinese economy remains quite unclear. Risks for cash outflow and weaker currency continue.
The recovery of corporate earnings is delayed.
Concerns continue for tighter liquidity conditions across Asia due to US rate hike.
These are key concerns for Asian markets and these will create volatility in the near term.
However accommodative monetary policy and relatively low valuation will support the market. Market will go up in line with slow recovery of corporate earnings.
We expect mild upside for the market given gradual recovery of the global macro economy, accommodative monetary policy and relatively low valuation.
23
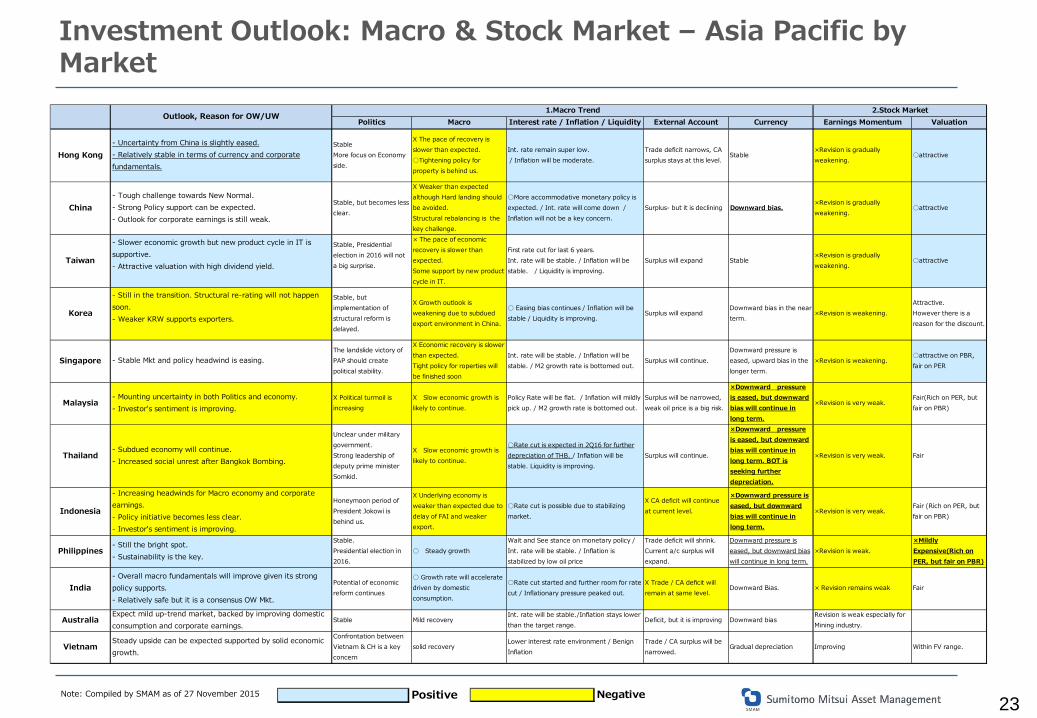
Investment Outlook: Macro & Stock Market – Asia Pacific by Market
Note: Compiled by SMAM as of 27 November 2015 Positive Negative
Politics Macro Interest rate / Inflation / Liquidity External Account Currency Earnings Momentum Valuation
Hong Kong- Uncertainty from China is slightly eased.- Relatively stable in terms of currency and corporatefundamentals.
StableMore focus on Economyside.
X The pace of recovery isslower than expected.○Tightening policy forproperty is behind us.
Int. rate remain super low. / Inflation will be moderate.
Trade deficit narrows, CAsurplus stays at this level.
Stable×Revision is graduallyweakening.
○attractive
China- Tough challenge towards New Normal.- Strong Policy support can be expected.- Outlook for corporate earnings is still weak.
Stable, but becomes lessclear.
X Weaker than expectedalthough Hard landing shouldbe avoided.Structural rebalancing is thekey challenge.
○More accommodative monetary policy isexpected. / Int. rate will come down /Inflation will not be a key concern.
Surplus- but it is declining Downward bias.×Revision is graduallyweakening.
○attractive
Taiwan
- Slower economic growth but new product cycle in IT issupportive.- Attractive valuation with high dividend yield.
Stable, Presidentialelection in 2016 will nota big surprise.
× The pace of economicrecovery is slower thanexpected.Some support by new productcycle in IT.
First rate cut for last 6 years.Int. rate will be stable. / Inflation will bestable. / Liquidity is improving.
Surplus will expand Stable×Revision is graduallyweakening.
○attractive
Korea
- Still in the transition. Structural re-rating will not happensoon.- Weaker KRW supports exporters.
Stable, butimplementation ofstructural reform isdelayed.
X Growth outlook isweakening due to subduedexport environment in China.
○ Easing bias continues / Inflation will bestable / Liquidity is improving.
Surplus will expandDownward bias in the nearterm.
×Revision is weakening.Attractive.However there is areason for the discount.
Singapore - Stable Mkt and policy headwind is easing.The landslide victory ofPAP should createpolitical stability.
X Economic recovery is slowerthan expected.Tight policy for roperties willbe finished soon
Int. rate will be stable. / Inflation will bestable. / M2 growth rate is bottomed out.
Surplus will continue.Downward pressure iseased, upward bias in thelonger term.
×Revision is weakening.○attractive on PBR,fair on PER
Malaysia- Mounting uncertainty in both Politics and economy.- Investor's sentiment is improving.
X Political turmoil isincreasing
X Slow economic growth islikely to continue.
Policy Rate will be flat. / Inflation will mildlypick up. / M2 growth rate is bottomed out.
Surplus will be narrowed,weak oil price is a big risk.
×Downward pressureis eased, but downwardbias will continue inlong term.
×Revision is very weak.Fair(Rich on PER, butfair on PBR)
Thailand- Subdued economy will continue.- Increased social unrest after Bangkok Bombing.
Unclear under militarygovernment.Strong leadership ofdeputy prime ministerSomkid.
X Slow economic growth islikely to continue.
○Rate cut is expected in 2Q16 for furtherdepreciation of THB. / Inflation will bestable. Liquidity is improving.
Surplus will continue.
×Downward pressureis eased, but downwardbias will continue inlong term. BOT isseeking furtherdepreciation.
×Revision is very weak. Fair
Indonesia
- Increasing headwinds for Macro economy and corporateearnings.- Policy initiative becomes less clear.- Investor's sentiment is improving.
Honeymoon period ofPresident Jokowi isbehind us.
X Underlying economy isweaker than expected due todelay of FAI and weakerexport.
○Rate cut is possible due to stabilizingmarket.
X CA deficit will continueat current level.
×Downward pressure iseased, but downwardbias will continue inlong term.
×Revision is very weak.Fair (Rich on PER, butfair on PBR)
Philippines- Still the bright spot.- Sustainability is the key.
Stable.Presidential election in2016.
○ Steady growthWait and See stance on monetary policy /Int. rate will be stable. / Inflation isstabilized by low oil price
Trade deficit will shrink.Current a/c surplus willexpand.
Downward pressure iseased, but downward biaswill continue in long term.
×Revision is weak.×MildlyExpensive(Rich onPER, but fair on PBR)
India- Overall macro fundamentals will improve given its strongpolicy supports.- Relatively safe but it is a consensus OW Mkt.
Potential of economicreform continues
○ Growth rate will acceleratedriven by domesticconsumption.
○Rate cut started and further room for ratecut / Inflationary pressure peaked out.
X Trade / CA deficit willremain at same level.
Downward Bias. × Revision remains weak Fair
Australia Stable Mild recoveryInt. rate will be stable./Inflation stays lowerthan the target range.
Deficit, but it is improving Downward biasRevision is weak especially forMining industry.
VietnamSteady upside can be expected supported by solid economicgrowth.
Confrontation betweenVietnam & CH is a keyconcern
solid recoveryLower interest rate environment / BenignInflation
Trade / CA surplus will benarrowed.
Gradual depreciation Improving Within FV range.
Expect mild up-trend market, backed by improving domesticconsumption and corporate earnings.
Outlook, Reason for OW/UW1.Macro Trend 2.Stock Market
24
Market Focus (i): Korea – Underweight continued
【Summary】
As the global economy is restoring stability, the downside of a slowdown in corporate earnings would be limited. However, structural issue is expected to weigh on the market in the medium- to long-term.
The weakening KRW supports exporting companies and the sharp depreciation of the JPY seems to end.
Competitive pressures on the Korean companies with Japanese and Chinese peers continue.
Corporate earnings are expected to be weak and market expectation still seems too high.
Valuation is very attractive.
However, weak corporate governance and investor-unfriendly activities by big chaebols are likely to continue.
We have positive outlook for consumer discretionary (Hotel and environment-related goods) and consumer staples (Cigarette and CVS) and negative outlook for financials, telecommunication services, utilities, automobiles, capital goods and materials.
Note: Compiled by SMAM as of 27 November 2015
25
Market Focus (ⅱ): Taiwan – Overweight continued
【Summary】
We maintain a view that a recovery of the global economy is weak. We take a careful stance to select stocks with a growth driver.
Slower growth mainly from export side. Especially, China is a key concern.
However, the worst seems to be over for IT related production thanks to the new product cycle (for iPhone6S/Plus).
Relatively immune from US rate hike.
Attractive valuation with high dividend yield.
There will be no surprise in the Presidential election in 2016. Tsai Ing-Wen of the Democratic Progressive Party will win the election. There are some chances to address domestic issues by the new government.
We have positive outlook for IT, consumer discretionary and telecommunication services and negative outlook for energy, materials, consumer staples and financials.
Note: Compiled by SMAM as of 27 November 2015
26
Disclaimer
Please read this disclaimer carefully. This material is for non-Japanese institutional investors only. The research and analysis included in this report, and those opinions or judgments as outcomes thereof, are intended to introduce or
demonstrate capabilities and expertise of Sumitomo Mitsui Asset Management Company, Ltd. (hereinafter “SMAM”), or to provide information on investment strategies and opportunities. Therefore this material is not intended to offer or solicit investments, provide investment advice or service, or to be considered as disclosure documents under the Financial Instruments and Exchange Law of Japan.
The expected returns or risks in this report are calculated based upon historical data and/or estimated upon the economic outlook at present, and should be construed no warrant of future returns and risks.
Past performance is not necessarily indicative of future results. The simulated data or returns in this report besides the fund historical returns do not include/reflect any investment management fees,
transaction costs, or re-balancing costs, etc. The investment products or strategies do not guarantee future results nor guarantee the principal of investments. The investments may suffer
losses and the results of investments, including such losses, belong to the client. The recipient of this report must make its own independent decisions regarding investments. The opinions, outlooks and estimates in this report do not guarantee future trends or results. They constitute SMAM’s judgment as of the date of
this material and are subject to change without notice. The awards included in this report are based on past achievements and do not guarantee future results. The intellectual property and all rights of the benchmarks/indices belong to the publisher and the authorized entities/individuals. This material has been prepared by obtaining data from sources which are believed to be reliable but SMAM can not and does not guarantee its
completeness or accuracy. All rights, titles and interests in this material and any content contained herein are the exclusive properties of SMAM, except as otherwise stated.
It is strictly prohibited from using this material for investments, reproducing/copying this material without SMAM’s authorization, or from disclosing this material to a third party.
Registered Number: Kanto Local Finance Bureau (KINSHO) No.399 Member of Japan Investment Advisers Association, The Investment Trusts Association, Japan and Type Ⅱ Financial Instruments Firms Association © Sumitomo Mitsui Asset Management Company, Limited