Embed Size (px)
Citation preview

ASIAN DEVELOPMENT BANK PCR: PRC 25267
PROJECT COMPLETION REPORT
ON THE
QINGDAO ENVIRONMENT IMPROVEMENT PROJECT(Loan 1205-PRC)
IN THE
PEOPLE’S REPUBLIC OF CHINA
December 2001

CURRENCY EQUIVALENTS
Currency Unit – Yuan (Y)
At Appraisal At Project Completion(as of 27 October 1992) (as of 31 July 2001)
Y1.00 = $0.1805 $0.121$1.00 = Y5.54 Y8.29
ABBREVIATIONS
ADB – Asian Development BankBME – benefits monitoring and evaluationDSCR – debt-service coverage ratioEIRR – economic internal rate of returnFIRR – financial internal rate of returnPCR – project completion reviewPIA – project implementing agencyPRC – People's Republic of ChinaQDC – Qingdao Drainage CompanyQEIP – Qingdao Environment Improvement ProjectQGC – Qingdao Gas Group companyQHPC – Qindao Heat and Power CompanyQMG – Qingdao municipal governmentQPP – Qingdao Power Plant
WEIGHTS AND MEASURES
W (watt) – Unit of currentkW (kilowatt) – 1,000 WMW (megawatt) – 1,000 kWWh (watt-hour) – Unit of energykWh (kilowatt-hour) – 1,000 Whhr – hourm – meterm2 – square metersm3 – cubic meterskm – kilometert – metric ton
NOTES
(i) The fiscal year (FY) of the Government and the executing agency ends on31 December. FY before a calendar year denotes the year in which the fiscal yearends, e.g., FY2000 ends on 31 December 2000.
(ii) In this report, "$" refers to US dollars.

CONTENTS
Page
BASIC DATA ii
I. PROJECT DESCRIPTION 1
II. EVALUATION OF IMPLEMENTATION 2
A. Project Components 2B. Implementation Arrangements 3C. Project Costs and Financing 3D. Project Schedule 4E. Engagement of Consultants and Procurement of Goods and Services 4F. Performance of Consultants, Contractors, and Suppliers 5G. Conditions and Covenants 6H. Disbursements 7I. Environmental and Social Impacts 7J. Performance of the Borrower and the Executing Agency 9K. Performance of the Asian Development Bank 9
III. EVALUATION OF INITIAL PERFORMANCE AND BENEFITS 10
A. Financial Performance 10B. Economic Performance 10C. Attainment of Benefits 11
IV. CONCLUSIONS AND RECOMMENDATIONS 11
A. Conclusions 11B. Lessons Learned 12C. Recommendations 12
APPENDIXES 14

ii
BASIC DATA
A. Loan Identification
1. Country : The People’s Republic of China2. Loan Number : 1205-PRC3. Project Title : Qingdao Environmental Improvement4. Borrower : The People’s Republic of China5. Executing Agency : Qingdao Municipal Government6. Amount of Loan : $103 million7. PCR Number : PCR: PRC 641
B. Loan Data
1. Appraisal- Date Started : 11 August 1992
- Date Completed : 25 August 1992
2. Loan Negotiations - Date Started : 26 October 1992
- Date Completed : 28 October 1992
3. Date of Board Approval : 10 December 1992
4. Date of Loan Agreement : 10 March 1993
5. Date of Loan Effectiveness - In Loan Agreement : 7 June 1993 - Actual : 6 August 1993 - Number of Extensions : One
6. Closing Date - In Loan Agreement : 30 June 1998 - Actual : 19 July 2000 - Number of Extensions : Two
7. Terms of Loan - Interest Rate : Pool-based variable lending rate - Maturity (number of years) : 25 years - Grace Period (number of years) : 5 years
8. Terms of Relending (if any) - Interest Rate : Pool-based variable lending rate - Maturity (number of years) : 25 years - Grace Period (number of years) : 5 years - Second Step Borrower : Qingdao Municipal Government

iii
9. Disbursements
a. Dates
Initial Disbursement Final Disbursement Time Interval1 December 1993 19 July 2000 6.6 years
Effective Date Original Closing Date Time Interval6 August 1993 30 June 1998 4.9 years
b. Amount ($ million)
CategoryOriginal
AllocationRevised
AllocationAmount
DisbursedAmount
Canceled
01A Machinery and Equipment 40.48 40.48 45.05 (4.57)02A Consultant Services 0.11 0.11 0.06 0.0403A Training 0.11 0.11 0.07 0.0304A Interest and Commitment Charges During Construction 8.77 0.00 0.00 0.0005A Unallocated 4.53 4.53 0.00 4.5301B Machinery and Equipment 9.07 9.07 7.73 1.3302B Consultant Services 0.21 0.21 0.19 0.0103B Training 0.31 0.31 0.15 0.1504B Interest and Commitment Charges During Construction 1.74 0.00 0.00 0.0005B Unallocated 1.67 1.67 0.00 1.6701C Machinery and Equipment 11.13 11.13 7.88 3.2402C Consultant Services 0.30 0.30 0.16 0.1303C Training 0.20 0.20 0.11 0.0804C Interest and Commitment Charges During Construction 2.38 0.00 0.00 0.0005C Unallocated 1.99 1.99 0.00 1.9901D Machinery and Equipment 13.83 13.83 15.28 (1.45)02D Consultant Services 0.60 0.60 0.32 0.2703D Training 0.24 0.24 0.00 0.2404D Interest and Commitment Charges During Construction 2.90 0.00 0.00 0.0005D Unallocated 2.43 2.43 0.00 2.4306 Interest During Construction 0.00 15.79 15.79 0.00
Total 103.00 103.00 92.84 10.16

iv
C. Project Data
1. Project Cost ($ million)
Appraisal Estimate Actual
Foreign Exchange Cost 103.00 92.84Local Cost 116.00 129.60 Total Cost 219.00 222.44
2. Financing Plan ($ million)
Appraisal Estimate Actual a
Component Foreign Local Total Foreign Local Total
Part A
ADB 54.00 0.00 54.00 53.97 0.00 53.97 Own Source 0.00 39.00 39.00 0.00 16.00 16.00 QMG Equity 0.00 18.00 18.00 0.00 32.80 32.80 Other Source 0.00 0.00 0.00 0.00 23.59 23.59 Subtotal 54.00 57.00 111.00 53.97 72.39 126.36
Part B
ADB 13.00 0.00 13.00 9.83 0.00 9.83 Commercial Sources 0.00 10.00 10.00 0.00 22.95 22.95 Subtotal 13.00 10.00 23.00 9.83 22.95 32.78
Part C
ADB 16.00 0.00 16.00 10.54 0.00 10.54 Own Source 0.00 6.00 6.00 0.00 14.51 14.51 QMG Equity 0.00 10.00 10.00 0.00 0.00 0.00 Subtotal 16.00 16.00 32.00 10.54 14.51 25.05
Part D
ADB 20.00 0.00 20.00 18.50 0.00 18.50 Own Source 0.00 12.00 12.00 0.00 0.00 0.00 QMG Equity 0.00 21.00 21.00 0.00 19.75 19.75 Subtotal 20.00 33.00 53.00 18.50 19.75 38.25
Total 103.00 116.00 219.00 92.84 129.60 222.44
ADB = Asian Development Bank; QMG = Qingdao municipal government.a ADB's financing of IDC is included in the respective parts A to D.

v
3. Cost Breakdown by Project Components ($ million)
Appraisal Estimate ActualForeign Local Total Foreign Local Total
PART A 54.00 57.00 111.00 53.97 72.39 126.36
PART B 13.00 10.00 23.00 9.83 22.95 32.78
PART C 16.00 16.00 32.00 10.54 14.51 25.05
PART D 20.00 33.00 53.00 18.50 19.75 38.25
Total 103.00 116.00 219.00 92.84 129.60 222.44
4. Project Schedule
Milestone Appraisal Estimate Actual
(a) Date of Contract with Consultants:- Part A- Part B- Part C- Part D
Oct 1993Oct 1993Oct 1993Oct 1993
(b) Completion of Engineering Designs:- Part A- Part D
Mar 1995Jun 1994
Dec 1997Jun 1994
(c) Civil Works Contract:
Date of Award:- Part A- Part D
Completion of Work:- Part A- Part D
Apr 1995Jan 1995
Jun 1996Jun 1996
Oct 1995Jul 1996
Dec 1998Jul 1997
(d) Equipment and Supplies Dates
First procurement:- Part A- Part B- Part C- Part D
Last procurement:- Part A- Part B- Part C- Part D
Oct 1994Jan 1994Jan 1995Jan 1995
Jun 1996Dec 1994Dec 1995Mar 1995
Jul 1993Sep 1994Jun 1995Sep 1995
Jan 1997Jun 1996April 1999Jun 2000

vi
Milestone Appraisal Estimate Actual
Completion of equipment installation:- Part A- Part B- Part C- Part D
Jun 1997Jun 1997Jun 1997Jun 1997
Jun 1999Mar 2001Dec 2000Dec 2000
(e) Start of Operations
Completion of tests and commissioning:- Part A- Part D
Beginning of operations:- Part D
Sep 1997Dec 1996
Apr 1997
Dec 1999Dec 1996
Oct 1997
D. Data on Bank Missions
Name of Mission DateNo. of
PersonsNo. of
Person-daysSpecializationof Members a
Fact-Finding 7–25 Apr 1992 8 152 a, b,Appraisal 11–26 Aug 1992 9 144 a, b, c, eInceptionb 15–28 Mar 1993 1 7 aReview 1b 25 Oct–1 Nov 1993 1 2 aReview 2 b 24 Feb–1 Mar 1994 1 3 aSpecial Review 25–27 Feb 1995 1 3 aReview 3 17–23 Apr 1997 2 14 a, fReview 4 6–13 Oct 1997 2 16 a, fReview 5 10–15 May 1998 2 14 a, fReview 6 b 16–23 Aug 1999 1 3 AReview 7 30 May–1 Jun 2000 2 6 a, fPCR 17–26 Jun 2001 3 30 a,b,f
PCR = project completion review.a a–engineer, b–financial analyst, c–counsel, e–programs officer, f–support staff.b Combined with other projects in the People's Republic of China.

I. PROJECT DESCRIPTION
1. Qingdao municipality, as in other coastal cities in the People’s Republic of China (PRC),experienced rapid economic growth and development after the Government embarked on rapidindustrialization in the 1960s. Rapid growth and industrialization, combined with heavy relianceon coal for meeting its energy needs, led to adverse environmental conditions in Qingdao andother major cities in the PRC. The lack of adequate measures to mitigate environmentalimpacts, and inappropriate economic policies, including low administered prices for rawmaterials and energy, further contributed to the situation. In recognition of the adverse impactsof pollution on human health and environment, the Government formulated a national policyframework for environmental protection and pollution control. Along with other major cities, theQingdao municipal government (QMG) developed a comprehensive plan to address theworsening environment, clean up the serious air and water pollution problems, and amelioratefuture pollution in the municipality. The Qingdao Environment Improvement Project (QEIP) wasan integral part of this plan.
2. The main objective of the QEIP was to improve the air quality in old Qingdao City andthe water quality in the coastal waters of Jiaozhouwan Bay, where the pollution problems weremost severe. The QEIP aimed to reduce air and water pollution by introducing environmentallysound technology, substituting cleaner coal-based energy forms for direct coal burning, andimproving the efficiency of plant operation. The QEIP also supported the strengthening ofinstitutional capacity for environmental management and monitoring, the upgrading ofmanagerial and technical skills in the relevant agencies, the introduction of commercialpractices, and improved efficiency and accountability.
3. The QEIP as appraised consisted of four parts. Part A comprised replacement of the oldcoal gasification plant with a larger, modern coal gasification plant at the Qingdao Gas GroupCompany (QGC). Part B comprised renovation and conversion of the thermal power plant at theQingdao Power Plant (QPP) to a combined heat and power plant to supply process steam andheat to industries and heating for residential districts. Part C comprised the installation of apipeline network system by the Qingdao Heat and Power Company (QHPC) for thetransmission and distribution of steam and hot water from QPP to industrial, commercial, andresidential consumers in the districts of Sifang and Taidong in old Qingdao City. Part Dcomprised the construction by the Qingdao Drainage Company (QDC) of a wastewatertreatment plant at the mouth of the Licun River, to treat sewage and industrial wastewaterdischarged into the river before it empties into Jiaozhouwan Bay.
4. In December 1992, the Asian Development Bank (ADB) approved a loan of $103 millionfor the QEIP from its ordinary capital resources. The loan carried a term of 25 years, including agrace period of 5 years, with interest rate determined according to ADB’s pool-based variablelending rate system for US dollar loans. The loan proceeds were re-lent to the subprojectenterprises at the same terms and conditions as the ADB loan, with the subproject enterprisestaking on the foreign exchange and interest variation risks..5. All four subprojects of the QEIP, with the exception of the sludge digester under Part D,were completed by December 1999, with delays ranging from 15 to 42 months. The loan wasclosed on 19 July 2000, 25 months after the original closing date of 30 June 1998, because ofdelays in project implementation. A total of $92.84 million in loan funds was disbursed and$10.16 million was canceled. The Government started loan repayment on 1 June 1998, and by30 June 2001, had repaid principal of $6.71 million.

2
II. EVALUATION OF IMPLEMENTATION
A. Project Components
6. The chronology of major events in QEIP implementation is listed in Appendix 1. Part A(Coal Gasification Plant) involved the replacement of the first-phase, 140,000-cubic-meter (m3)-per-day coal gasification plant (constructed as a pilot project in 1987) with a modern 750,000m3/day coal gasification plant, thereby increasing the coal gas supply to cover about 73 percentof the households in old Qingdao City and reducing air pollution to an acceptable level. Theplant is adjacent to the old plant. The new plant was implemented with a reduced capacitybecause the demand for coal gas grew at a rate lower than the appraisal estimate. Accordingly,the daily gas production capacity of the plant was reduced from 750,000 m3 to 400,000 m3. Thisreduction in scope resulted in the deferring of the construction of 12 gas producers and one165,000 m3 gas holder. The average daily gas consumption up to 2000 was 262,000 m3. Themaximum daily gas consumption recorded was 380,000 m3. Gas demand is projected to reachthe plant capacity of 400,000 m3/day by the end of 2001. To ensure sufficient supply to meetthis anticipated increased demand by 2001, QGC has successfully negotiated with QingdaoPetroleum Company for the diversion of about 20,000 tons (t) of flare gas per year from itspetroleum refinery by the end of 2001. QGC is now also examining the possibility of tappingnatural gas from the offshore Bohai gas field to augment its gas supply. If natural gas becomesavailable, the 12 deferred gas producers will no longer be needed. Otherwise, these producerswill need to be completed by the end of 2003 to meet projected demand and ensure anadequate and uninterrupted gas supply.1
7. Part B involved the conversion of the old 100-megawatt (MW) power plant, located at theQPP complex, to a cogeneration plant. The conversion required overhauling six boilers andreplacing the inefficient generators with three 12 MW back-pressure turbogenerators. Thisconversion was intended to provide 400 t per hour (hr) of steam and 25 MW of heat for part C.The subproject was implemented as envisaged, except that the implementation was delayed by1.5 years. The delay resulted from a dispute about arrangements to meet the shortfall in powersupply produced by the conversion.2 Although all three turbogenerators were provided usingloan proceeds, only one of the three, with a maximum capacity of 250 t/hr of steam, has so farbeen installed. This was primarily because of weak demand at first for steam and heat underpart C. The second unit is now being installed since the first unit has recently been operatingnear full capacity. The third unit will be installed only when steam and heat demand approachesthe full combined capacity of the first two units. This is projected to happen in 2003, at theearliest. Financing for the installation of the remaining two units is being provided by QPP.
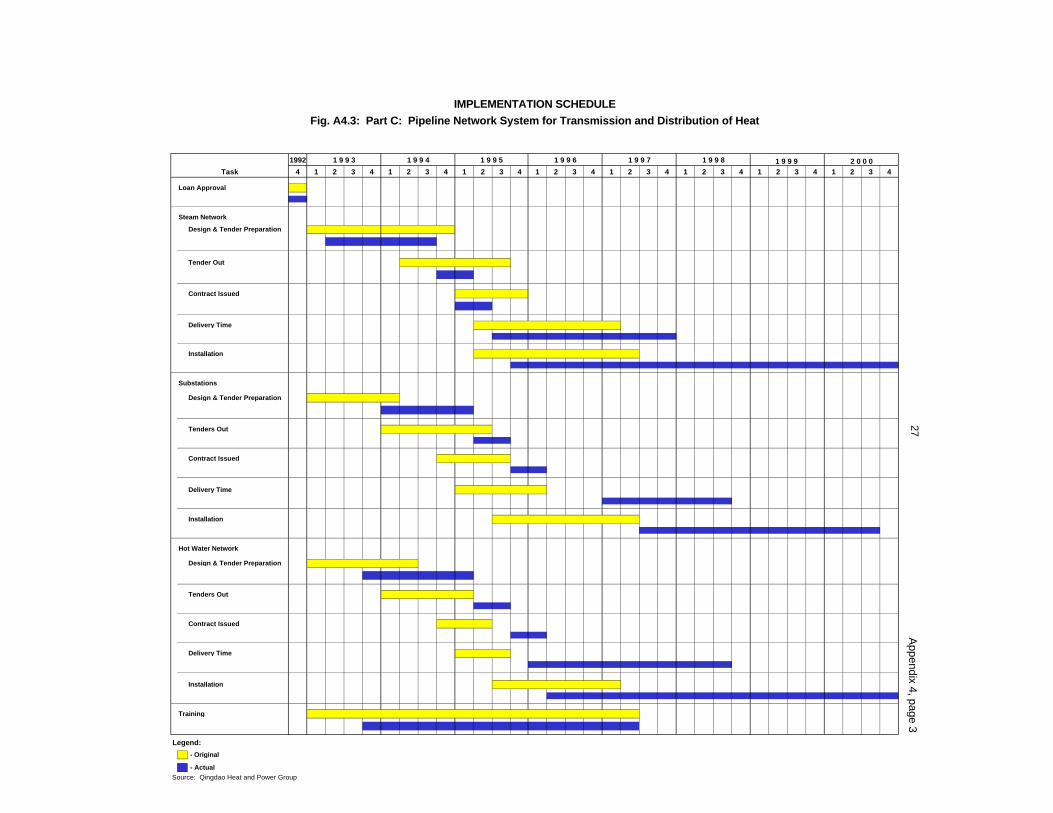
8. Part C involved the installation of a pipeline network system for the transmission anddistribution of steam and heat from QPP (in part B) to industrial, commercial, and residentialusers in the districts of Sifang and Taidong in old Qingdao City. These districts are close toQPP. Because of lower-than-projected steam demand and the dispute (para. 7), implementationof part C, along with part B, was delayed by more than 3.5 years. In the meantime, QHPC wassupplying steam and heat using its own smaller steam plant. The completed facilities arecurrently supplying about 200 t/hr of steam and heat to 45 industrial and commercial users and25,000 households.
1 If the gas producers are to be completed by end 2003, the construction will need to commence shortly.2 QPP's power plant of 100 MW, which was supplying its entire power generation to QMG, was converted to a
cogeneration plant that would provide 36 MW of power and 400 t/hr of steam. Since QMG would be faced with apower shortfall on completion of part C, it allowed the work to proceed only after satisfactory arrangements formeeting the shortfall were signed with Shangdong Electric Power Corporation, the owner of QPP.

3
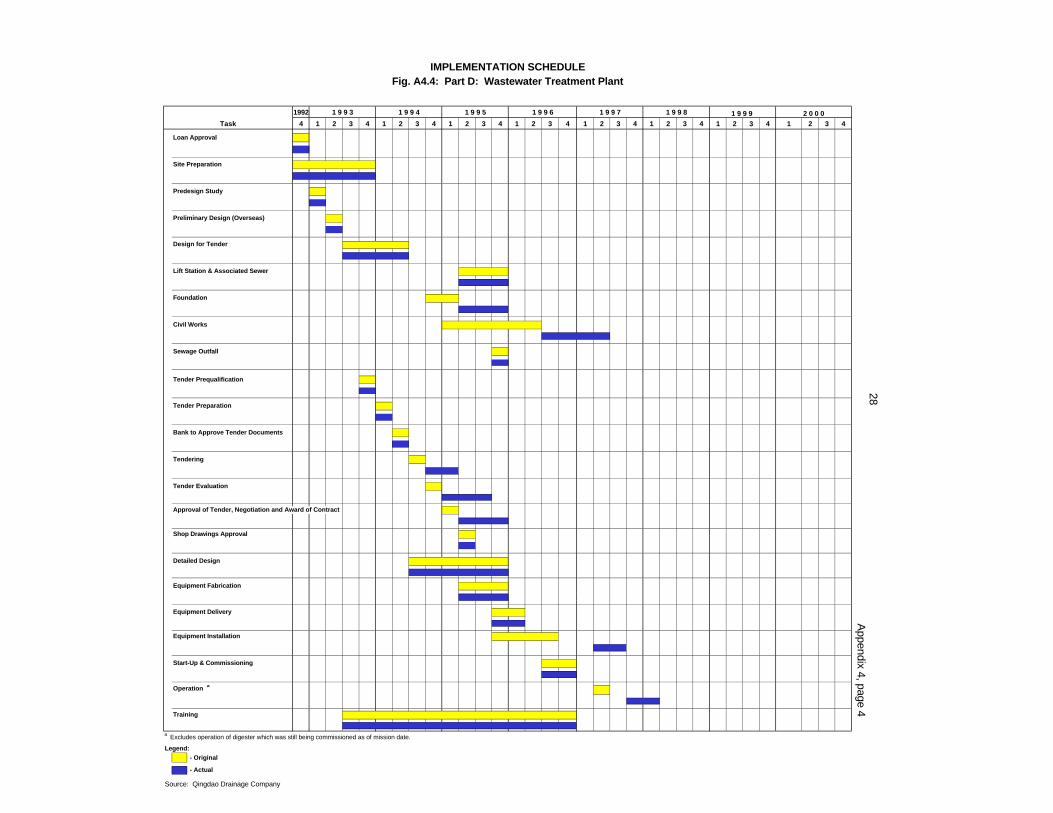
9. Part D involved the construction of an 80,000 m3/day wastewater treatment plant at themouth of the Licun River to treat about 53,000 m3/day of industrial wastewater and 27,000m3/day of domestic sewage, collected from both sides of the river, before these are dischargedinto Jiaozhouwan Bay in Qingdao municipality. The subproject was implemented as envisaged,except that the proposed lift pumping station on the north bank of the Licun River was replacedby an underground sewage pipe crossing the river, in order to reduce cost. The new facilitieswere completed by the end of 1997 and commenced commercial operation in April 1998.However, the sludge digesters were only completed at the end of 2000, as there was insufficientsludge available for effective treatment. Prior to the commissioning of the sludge digesters,sludge generated was disposed of in a landfill site, together with municipal garbage.
B. Implementation Arrangements
10. As envisaged at appraisal, QMG through its Qingdao Municipal Administration Office ofthe QEIP (financed by ADB) was the Executing Agency (EA) for the Project. QMG provided theoverall supervision of subproject implementation and the coordination of policy and institutionalmeasures in support of the QEIP. The individual enterprises were the project implementingagencies (PIAs): QGC for part A, QPP for part B, QHPC for part C, and QDC for part D. EachPIA was headed by a factory manager and staffed with well-qualified and experiencedpersonnel to supervise the day-to-day implementation as envisaged at appraisal (Appendix 2).These arrangements proved to be effective, as problems encountered during implementationwere appropriately addressed, although delays in completion were still experienced.
C. Project Costs and Financing
11. At appraisal, the total cost of QEIP was estimated at $219 million equivalent, including aforeign exchange component of $103 million representing 47 percent of the project cost. Atcompletion, the actual cost was $222.4 million consisting of $92.8 million in foreign exchangecost, and $129.6 million in local currency cost, resulting in a cost overrun of $3.4 million, or1.6 percent more than the original estimate. However, the actual foreign exchange cost waslower than the appraisal estimate by $10.2 million because of the scaled-down project scopeand the lower cost of imported equipment that resulted from strong international competitivebidding. The higher local currency cost of $13.6 million comprised local currency cost increasesin part A ($15.4 million) and Part B ($12.9 million) which were partly compensated by savingsunder Part C ($1.5 million) and Part D ($13.2 million) The local cost overruns were financed byadditional equity contributions from QMG and by domestic borrowing. The QEIP's cost asestimated during appraisal and the actual cost are compared in Appendix 3.
12. The actual cost of part A amounted to $126.4 million, which is 14 percent higher than theappraisal estimate of $111 million. The higher cost was brought about by a higher-than-expected cost of civil works, and by the need to provide utilities and auxiliary facilities incongested and undulating terrain in the older part of the city. The actual cost of part B was$32.8 million, about 43 percent higher than the appraisal estimate of $23 million. The mainreasons for the cost overruns, all in local currency, were (i) more expensive civil works, broughtabout by the need to strengthen the buildings housing the boilers and expand the power plantarea; and (ii) the construction of a new water treatment plant, which was not anticipated. Theactual cost for part C was $25.0 million, compared to the appraisal estimate of $32.0 million.The lower cost was mainly due to the scaled-down project scope that came about after thesteam and heat demand proved lower than projected. The lower demand was due to the closureor relocation of some industries that were originally intended to be the major consumers.The actual cost of part D was $38.3 million, against the appraisal estimate of $53.0 million.

4
The lower cost was brought about by utilizing part of the wasteland adjacent to the treatmentplant, necessitating a smaller reclaimed land area, and lower construction costs than anticipatedfor the sludge digestion tanks.
D. Project Schedule
13. The loan was approved on 10 December 1992 and became effective on 6 August 1993.Due to implementation delays, the loan closing date of 30 June 1998 was extended twice:initially to 30 June 1999, and finally to 19 July 2000. The actual and projected implementationschedules are given in Appendix 4. The four subprojects were completed with delays rangingfrom 15 to 42 months.
14. Site work for part A commenced in January 1993 and was completed in June 1998.The new facilities were put into commercial operation in December 1998, 27 months later thanexpected. Boiler overhaul in part B commenced in April 1995, but the installation of theturbogenerator was completed only in September 1998, after satisfactory resolution of thedispute on arrangements to meet the power shortfall from conversion of the thermal power plantinto a cogeneration plant with a lower power output. This dispute delayed part B by 15 months.Installation of the second and third turbogenerators was also deferred to 2001, as there wasinsufficient demand for process steam and heating. Pipeline laying for part C started in June1995 and was basically completed by December 2000. Part C was delayed by 42 months, partlyas a result of the dispute over the power shortfall, and partly as a result of deferred constructionin view of the low demand for steam at the time. Site work for part D commenced in October1994 and was completed in June 1997, except for sludge digesters. Overall, part D suffered adelay of 25 months, even though the wastewater treatment plant was put into operation inMarch 1998 because the lack of sufficient sludge for treatment deferred the start of constructionof the sludge digesters. Fine tuning of the digesters and the related wastegas recovery systemwas still in progress at the time of the Project Completion Review (PCR) Mission.
E. Engagement of Consultants and Procurement of Goods and Services
15. Each PIA engaged one or more of its own domestic design institutes to carry outpreliminary design and detailed engineering. The Anshan Coking Refractory Material Designand Research Institute was engaged for part A, the Shandong Electric Power Design Institutefor part B, the Shenyang Power Engineering Design Institute and Beijing Gas and ThermalEngineering Design Institute for part C, and the North China Municipal Engineering DesignInstitute for part D. These domestic design institutes were experts in their fields, andexperienced in the engineering and construction of coal gas and thermal power plants andwastewater management systems. China International Tendering Company was engaged by allfour PIAs to assist in the preparation of bidding documents, bidding and bid evaluation, andcontract management. The arrangement of using a domestic tendering company to assist inprocurement, because the EA and PIAs were not familiar with ADB’s Guidelines forProcurement, proved to be sound and effective, as no contractual disputes arose. Equipmentprocured generally performed as expected, except for the sludge centrifuges. These domesticconsulting firms were engaged directly by each PIA and the costs of their services were paid bythe individual PIAs from the local currency account of the QEIP. In addition, internationalconsulting firms were engaged to provide technical advice and support. QGC engaged twointernational firms for part A to provide process license and technical specifications for the cokeoven gas treatment plant, and to review bidding documents. QPP engaged an international firmfor part B, to provide technical advice on boiler upgrading, and overseas training for their staff.QHPC hired an international firm to provide the primary design and review the detailed design of
5
the district heating system for part C. QDC engaged an international firm to review the designand technical requirements of the wastewater treatment plant for part D. All of the internationalconsulting firms were engaged by the PIAs in accordance with ADB’s Guidelines on the Use ofConsultants, and the costs of the international consulting services were paid from the ADB loanproceeds.
16. All equipment and materials financed by ADB were procured in accordance with ADB’sGuidelines for Procurement. Equipment and materials valued at more than $0.5 million wereprocured through international competitive bidding. Hinged expansion joints were procuredthrough direct purchase because these joints were urgently needed for commissioning of thesteam lines.The details of the contracts financed by ADB and the mode of procurement aregiven in Appendix 5. Civil works and equipment installation contractors were engaged throughthe PRC Government’s own bidding procedures, which were acceptable to ADB.
F. Performance of Consultants, Contractors, and Suppliers
17. The international consultants and engineering firms completed their assignments on timeand in a satisfactory manner. Beside providing the coke oven gas treatment technology andlicense for part A, the international consultants and engineering firms assisted the PIAs inpreparing technical specifications, reviewing and evaluating bidding documents, and training.The technical review was thorough and no complaints on restrictive technical requirements werereceived from bidders. The equipment procured was appropriate and functioned as specified,except for the sludge centrifuges, which were still not handed over to the PIA by the supplier atthe time of the PCR mission. The training programs arranged by the consultants were wellreceived by the PIA staff, and the knowledge gained was put to effective use upon their return.About 88 PIA staff received overseas training in operation and maintenance, and shortmanagement courses (Appendix 6). Another 496 staff received in-country training in operationsand maintenance. The services provided by the domestic design institutes were consideredgenerally satisfactory, except for the delay in the submission of a detailed design for part A.Detailed design of the pipeline network for part A was delayed when a fault line was detectedduring the geological survey of the pipeline network for the coal gas. The presence of the faultline necessitated a revision in the design of the gas network, and delayed the issuance ofdetailed engineering drawings by six months. This subsequently delayed site preparation workby 33 months. The technical designs provided by the domestic design institutes wereappropriate and took into account the site conditions and specific requirements, except that thedesign for the coal preparation yard for part A appeared to be more complicated than required.This was spotted at an early stage during bidding. As a consequence, two coal transfer stationswere eliminated during construction, resulting in an estimated savings of Y2.5 million. Theconstruction area was likewise reduced by about 500 m2. The services rendered by theprocurement agency were satisfactory: all procurement activities were carried out smoothly andno contract disputes were reported. The requirement that a procurement agency assist QMG toprocure ADB-financed packages proved to be sound and effective since QMG and the PIAswere not familiar with ADB’s Guidelines for Procurement. As a result, no major problems wereencountered in the packaging of contracts, bidding, or contract management.
18. The civil works contractors and equipment installation contractors were competent andexperienced, and were able to complete their works in accordance with the implementationschedule. However, the civil works contractor for part A did not plan and coordinate its siteexcavation work properly, resulting in damage to some foundations. Some minor revisions in thedesign and further reinforcements had to be made at additional cost. Nevertheless, the qualityof their contractor's work was good and the PIA was satisfied with its performance. Similarly, the

6
equipment suppliers generally complied with their contract terms, including delivery schedules.The only exception was the delivery of electrostatic precipitators for part A, which was delayedby about 18 months because the supplier was experiencing financial difficulties. All theequipment procured performed as required, except the two sludge centrifuges for part D whichcould not perform at the rated capacity. The supplier agreed to rectify the centrifuges at no costto QDC. The rectification work was still ongoing during the PCR Mission. All completed facilitieswere subjected to performance tests conducted independently by domestic experts, and wererated as having either met or exceeded the design performance. As the rectified sludgetreatment plant is still to be commissioned, its performance test will be carried out at a laterdate.
G. Conditions and Covenants
19. The loan and project agreements were signed within 90 days after loan approval, butloan effectivity took 60 days longer than expected, due to delay in finalizing the loan subsidiaryagreements. Loan conditions other than the financial covenants were generally met. Mostfinancial covenants were not complied with, as shown in Appendix 7. The key financialcovenants agreed to under the loan were the following:
(i) the tariffs charged by the PIAs will be set at levels that allow full recovery ofoperating and capital costs, and provide an adequate return on investment;
(ii) the Borrower, the Shandong Electric Power Corporation, and QMG will not provideany subsidy to any of the PIAs after 31 December 1992;
(iii) accounts receivable will be kept within three months of billings; and (iv) the debt-service coverage ratio (DSCR) will be maintained at not less than 1.3:1 and
the debt/equity ratio will not be higher than 70:30.
20. None of the four PIAs has been allowed to charge utility rates based on full costrecovery. Accordingly, they were still receiving subsidies from QMG to sustain their operations,and to service their debts to ADB and to the domestic commercial banks. The DSCR for each ofthe four PIAs does not meet the minimum requirement. The DSCR for the first two years thatthe projects have been in operation has been lower than 1:1 after the repayment on principal isconsidered. This is not expected to improve in the near future due to the policy of promoting theuse of the Project services through low tariffs and the infusion of subsidies from the Governmentis likely to continue. QDC keeps its level of accounts receivable within three months of billings,but QPP exceeds its level. The receivable accounts of QGC and QHPC are combined with otheraccounts, and the accounts receivable level in comparison to sales cannot be computed. On theother hand, the debt/equity ratio is being met, except by QPP. No loan covenant was modifiedor waived during implementation. The old gas making plant in part A was closed in 1998, afterthe new facilities were successfully commissioned and began commercial operation.
21. Audited financial statements were submitted regularly and on time, except that these stilldo not include income statements for QHPC and QDC, and except that the cash flowstatements had to be restated to conform with ADB's format. The required financial ratios werealso not computed. The submission of progress reports was irregular. Their project completionreports were also submitted late and only after repeated reminders from ADB. These reportswere brief and did not include information on their recent financial performance. In addition,none of the PIAs has submitted its annual benefit monitoring and evaluation (BME) reports.After several follow-ups by ADB, the PIAs have indicated that the first BME reports will besubmitted before the end of 2001.

7
H. Disbursements
22. The first disbursement under the ADB loan was made in December 1993, 4 months afterthe loan became effective. The loan was closed on 19 July 2000, 25 months later thanexpected. Disbursements were mainly made through letter of credit and direct paymentprocedures. By the loan closing date, disbursements amounted to $92.8 million. The remainingunutilized amount of $10.2 million was canceled. Overall utilization of the ADB loan wastherefore about 90 percent. Contract awards and disbursements were slow during the first twoyears because of delayed project implementation. However, this picked up in the third year andpeaked in 1996 and 1997 (Appendix 8). No imprest account was considered necessary andnone was established.
I. Environmental and Social Impacts
23. During implementation, mitigating measures identified in the environmental impactassessment were carried out to minimize the adverse environmental impact of the QEIP. Landacquired for the QEIP was either existing vacant land or reclaimed land owned by the PIAs, orwasteland provided by QMG. Hence, no resettlement of people was involved. Once theconstruction was completed, excavated areas were promptly filled and exposed areas wereproperly restored and landscaped. The premises were planted with grass and flowering plants.The operation of the new facilities provided under the QEIP has been a major factor in thesubstantial improvement in the air quality in Qingdao municipality and the water quality inJiaozhouwan Bay, as shown by the steady reduction in levels of air and water pollutants(Appendixes 9 and 10). As a result, the air quality index in Qingdao City has been around 50 forover 70 percent of the days and the air quality has never fallen below class II.3 This wasalthough (i) the city population has increased by 4.93 percent from 1991 to 1999; (ii) annualeconomic growth has been at a very high rate of about 10 percent; and (iii) there is a heavyinflux of foreign and domestic tourists, currently about 11.3 million annually. Because of thecommendable improvements in environment quality, the city was cited by the state as a modelcity for environmental protection in 2000.
24. The new facilities for part A were able to supply clean coal gas to 262,704 households(equivalent to about 90 percent of the targeted population), and about 838 industrial andcommercial users. Average daily consumption is about 261,400 m3, with a specific calorificvalue of 17,000 kilojoules/m3. The number of gas users and the daily gas consumption werebelow the appraisal estimates because of difficulties in extending gas distribution to the old cityarea which has no provision for a distribution network. Demand projections used at appraisaloptimistically assumed full-capacity utilization within one to two years of project completion. Thetarget and actual achievements are compared in Appendix 11. The number of householdsconnected to coal gas increased by about 24,800 households per year. Maximum dailyconsumption reached 380,000 m3. Gas demand is expected to reach a daily averageconsumption of 400,000 m3 by the end of 2001, so coal gas production needs to be increased.QMG is currently exploring the possibility of tapping the Bohai offshore natural gas field tosupplement the gas supply. If this additional supply materializes, the 12 gas producers will notbe needed. Otherwise, the construction of the 12 deferred gas producers and the 165,000 m3
gas holder in Tuandao district will need to commence shortly. Meanwhile, QGC is augmentingits gas supply by tapping the flare-gas from the nearby Qingdao petroleum refinery. With the
3 Class I standard is for tourist, historic and conservation areas; Class II is for urban and rural residential areas;
Class III is for industrial areas and locations with heavy traffic.

8
completion of part A, QMG has banned the open burning of coal in the city. The operation of thenew facilities complied with the air and water discharge standards established by the municipalenvironmental protection bureau. QGC was accordingly awarded an ISO 9002 certificate for itsoperation. QGC's by-product, metallurgical coke (with an annual production of about 420,000 t),is being exported to five countries. Another by-product, coal tar (with an annual production ofabout 23,000 t), was rated of first-class quality and is sold to neighboring chemical plants. Ash,also a by-product, is sold to a brick-making factory as raw material. QGC employs 1,622 staff, ofwhich about 27 percent are women. During project implementation, temporary employment ofabout 1,000 people was generated.
25. With the complete overhaul of the old boilers in part B and the conversion from a thermalpower plant to a cogeneration plant, the plant was able to continue its operation at a higherenergy efficiency (from an average coal consumption of 555 grams (gm)/kilowatt-hour (kWh) to330 g/kWh). At the same time, its operation complied with air discharge standards. Failure to doso would have caused the shutdown of the facilities. The current workforce of 1,640, including21 women, would have been laid off and QMG would have had to deal with the social problemsassociated with mass layoffs. In addition, the temporary employment created for 800 personsduring implementation would not have happened. The newly installed dust electrostaticprecipitator, which is capable of removing over 99 percent of the dust emitted, is nowcontributing positively to the overall improvement in air quality in Qingdao municipality.
26. The new facilities provided under part C were distributing steam to 28 industrialestablishments and district heating to 8 residential blocks (with an estimated 25,000households) covering an area of more than 9.2 square kilometers in Sifang, Taidong, and Shibeidistricts. Daily steam consumption at peak is about 200 t/hr. Steam demand will likely reach250 t/hr by the end of 2001. The demand for steam and heating envisaged at appraisal did notmaterialize because some intended major users have either relocated or have shut down theiroperations. The actual achievement as compared to the original targets is given in Appendix 11.About 240 small boilers with a combined capacity of 540 t/hr were shut down, thus eliminating amajor air pollution source. As a result, the air quality in the city has improved. QHPC currentlyemploys 97 staff, of which 21 are women. Another 200 temporary employments were createdduring implementation. In addition, coal savings of about 180,000 t/year have been realized.
27. The new facilities under part D are able to treat all wastewater discharged from factories,commercial buildings and residential housing. The catchment area covers 29 square kilometersof the Licun River in Cangkou District. A total of 45,000 m3 of wastewater (15,000 m3 fromindustries and 27,000 m3 of domestic seweage) is treated per day. The lower volume ofwastewater treated, compared to the appraisal estimate, occurred because some of the sewagelines are still not connected to the main line. The treatment process reduced biological oxygendemand (BOD), chemical oxygen demand (COD), and suspended solids by 14,000 t, 48,000 tand 36,000 t per year, respectively, thus improving water quality to class II standard fromclass V standard before the treatment. The water quality in Jiaozhouwan Bay has improved, asshown in Appendix 10. A number of marine species have actually returned to the area. QDChas 97 employees of whom 40 percent are women. About 100 temporary jobs were createdduring construction.
28. A comparison of the physical targets and actual achievements for all the subprojects isshown in Appendix 11.

9
J. Performance of the Borrower and the Executing Agency
29. The performance of the Government, initially through the People’s Bank of China andlater through the Ministry of Finance, was generally satisfactory. The ministry took an active partin resolving the dispute over the power shortfall that resulted from the conversion of the QPPthermal power plant to a cogeneration plant. The performance of the QMG, as the ExecutingAgency of the QEIP, was also generally satisfactory. QMG assisted the participating PIAs inarranging for domestic loans, in addition to contributing a significant portion of the domesticfunds. QMG also assisted in monitoring project implementation by actively participating in ADB’sproject review missions. However, QMG has had to continue subsidies to the four PIAs,because the utility tariffs they are charging are not sufficient for full cost recovery. The four PIAsperformed in a generally satisfactory way, and project implementation was carried out in asystematic manner. However, prolonged delays were still encountered in all four subprojects(para. 14). In hindsight, closer and more frequent coordination between QMG and the PIAsshould have been carried out to minimize such delays. All technical problems encounteredduring commissioning were either resolved in-house or with the assistance of domesticengineering supervisory firms. The knowledge gained by senior staff in the PIAs, through jointreview of design and specifications with international and domestic consulting firms, coupledwith the training provided under the QEIP (Appendix 6), have enabled them to operate the newfacilities competently and in a more professional manner than before. The project facilities wereobserved to be generally operating as designed, except for the sludge treatment plants in partD, which are being rectified. The technology adopted is technically and commercially sound,and trained personnel are in place to handle operational and technical problems. However,communication with ADB was infrequent and response to ADB requests was generally slow.Only the audited financial statements were submitted on time. Although the auditor’s reportswere generally unqualified, no income statements were included for either QHPC or QDC.Submission of quarterly progress reports was irregular. The BME reports remain unsubmitted,although all four PIAs have indicated that such reports will be submitted before the end of 2001.The financial sustainability of the subprojects also remains a concern, and the PIAs need tocontinue efforts to address this.
K. Performance of the Asian Development Bank
30. ADB made considerable effort to monitor the implementation of the QEIP throughregular project review missions. Over the six-year implementation period, nine missions werefielded. These review missions spent adequate time reviewing physical progress and discussingoutstanding implementation issues with QEIP staff. ADB staff took an active role in helping toresolve the dispute on power shortfall under part B. QMG and the four PIAs appreciated theassistance rendered by the missions. ADB acted promptly on QGC’s request to rebid theprocurement of the coal feed stamping machine and to change the procurement mode frominternational competitive bidding to restricted bidding. This was after the earlier bidding attractedonly domestic bidders, whose proposed stamping machine could not meet the technicalrequirements. The performance of ADB is considered satisfactory.

10
III. EVALUATION OF INITIAL PERFORMANCE AND BENEFITS
A. Financial Performance
31. As a result of ADB policy dialogue during loan processing, the four subprojectenterprises have been restructured into limited liability corporations with their core businessescentered on the QEIP. Hence, the financial performance analysis is focused on the restructuredcorporations. The financial performance of the four subproject enterprises for the initial years ofoperation is summarized in Appendix 12. The financial performance for these years has beenlower than projected, principally due to the combination of higher input costs and lower outputprices than originally anticipated, and lower demand for products and services. All fourenterprises are charging tariffs—based on the tariffs authorized by the price regulatory body—that are barely sufficient to recover their operating costs. The financial projections provided forthe next 10 years likewise show that their income level will not be adequate to cover their debtservice requirements, and they will have to rely on continued government support to honor theirrepayment obligations. The four enterprises have been implementing measures to reduceoperating costs. However, this is not sufficient to turn the companies around financially.A substantial increase in cost recovery will be needed to achieve this. Moreover, to improvetheir financial performance, all four enterprises need to generate stronger demand for theirproducts and services and increase tariffs. Reasonable tariff levels that allow for full recovery ofoperating and capital costs, and provide an adequate return on investment, are essential for thefinancial sustainability of the QEIP, as ADB has repeatedly advised QMG. Such tariffs will alsoencourage energy and water conservation, and rationalize the use of scarce resources.
32. The financial internal rate of return (FIRR) was reevaluated for the individualsubprojects. Calculations were made on the basis of the financial projections provided by thefour enterprises. Capital costs were based on actual investments made for the QEIP.Incremental revenues were based on sales of products and services associated with theinvestments made under the QEIP, and were assumed to increase from the current productionlevels to full capacity in the next several years. Operation and maintenance costs were basedon the actual costs presented in the financial statements, adjusted to take into account growth insales volume. All revenues and expenditures were recomputed in 2000 prices. The FIRRs ofthe four subprojects were recalculated at 2.5 percent for part A, 4.2 percent for part B,3.6 percent for part C, and 2.7 percent for part D (Appendix 13), compared with FIRRs of 12.4percent, 10.4 percent, 10.5 percent, and 6.4 percent, respectively, estimated at appraisal. Thelower FIRRs are mainly due to the lower-than expected-demand for products and servicescombined with approved tariffs that are inadequate. The higher actual investment costs (exceptfor part C, which has lower costs due to the reduction in project scope), coupled with prolongedproject implementation delays, have likewise contributed to the lower FIRRs. The FIRRs arelower than the weighted average costs of capital except for part B, as shown in Appendix 13.
B. Economic Performance
33. The economic reevaluation was based on incremental costs and benefits following themethodology used in the appraisal. The economic life of the QEIP assumed at appraisal to be20 years, is maintained. All costs and benefits are expressed in year 2000 constant prices.Financial costs of nontradable items were converted to their economic values using conversion

11
factors4 commonly used for projects in the PRC. For tradable items, the costs were translatedinto their border prices by using international market prices plus transport and handling costsfrom the port to the project site. Taxes, import duties, and all financial charges, including interestduring construction, have been excluded. The economic benefits were valued in terms of (i) coalsavings, which were derived by deducting the coal consumed by the subproject in theproduction of gas or steam from the total coal that was consumed before the QEIP, andapplying the economic prices of coal; (ii) reduction in transportation cost by avoiding longdistance and in-city transport and handling charges; and (iii) local environmental benefits. Theeconomic internal rate of return (EIRR) is reevaluated at 7.7 percent for part A, and 19.7 percentfor parts B and C (Appendix 14). As at appraisal, no EIRR was estimated for part D. The EIRRsestimated at appraisal were 12.7 percent for part A and 34.1 percent for combined parts B andC. The lower EIRRs are primarily due to reduced benefits as a result of lower actual capacityinstalled and, consequently, lower production; and higher investment costs, coupled withimplementation delays.
C. Attainment of Benefits
34. The operation of the new facilities provided under the QEIP has enabled QMG to banthe open burning of coal and shut down about 590 small boilers in the municipality. Theoperation of the new facilities has substantially improved the air and water quality in Qingdaomunicipality and contributed to the city's being cited as a model city for environmentalprotection. About 34,000 t of sulfur dioxide (SO2), 3,800 t of nitrogen oxides (NOx), 18,000 t ofcarbon monoxide (CO), 356,000 t of carbon dioxide (CO2), and 28,000 t of particulate matter(PM10) were eliminated. The air quality in Qingdao City is now consistently rated class II orbetter, thus allowing its 7 million residents and the 11.3 million annual visitors to enjoy clean air.The reduced CO2 emission from the Project will also have transnational environmental benefits.The wastewater treatment plant under the QEIP together with three other treatment plants in themunicipality, were able to treat over 70 percent of the wastewater generated in the municipalitybefore its discharge into the Jiaozhouwan Bay. As a result, the water quality in the bay area hasimproved and a number of marine species that previously inhabited the vicinity have returned.The ban on open coal burning in the city has also reduced dust associated with the openhandling and storage of coal, and freed up unsightly coal storage areas for other uses. Thisenabled QMG to embark on the beautification and greening of the city landscape. The ability toattract large numbers of tourists, both domestic and foreign, attests to the clean, landscapednature of the city, in addition to its mild and pleasant weather. The QEIP has reduced coalconsumption by about 1.1 million t per year. This was made possible by the providing moreefficient and cleaner fuel and heating sources, and eliminating about 100,000 domestic stovesand 590 small and inefficient boilers.
IV. CONCLUSIONS AND RECOMMENDATIONS
A. Conclusions
35. The QEIP is rated as successful based on criteria of relevance, efficacy, efficiency,sustainability, and institutional development and other impacts as shown in Appendix 15. TheQEIP achieved its primary objective of improving the environment. The air and water quality inQingdao municipality improved to at least class II or better, and contributed to Qingdaomunicipality being named a model city for environmental improvement. The consistently good
4 The conversion factors used in this evaluation are 0.94 for civil works, 2.00 for skilled labor, 0.67 for unskilled labor,
and 0.95 for others.

12
air quality allows the city to maintain its position as a leading tourist destination and, moreimportantly, allows its residents to enjoy a cleaner atmosphere. In recognition of itsachievement, Qingdao was recently chosen as the only city in PRC, aside from Beijing, to hostsome of the Olympic Games events in 2008. The QEIP reduces emission of greenhouse andacid rain- causing gases annually by over 400,000 t and coal consumption by 1.1 million t. Thetraining provided under the QEIP has enabled the participating enterprises to restructure andadopt modern management techniques and operation.
36. The reevaluated FIRRs are low, reflecting low utilization of the PIAs' capacities and theinadequate tariff levels that are allowed by the regulatory board. This has made the fourparticipating enterprises dependent on government subsidies to fulfill their loan repaymentobligations. The financial performance of the four enterprises is expected to improve with bettercapacity utilization, but will remain weak until the Government allows cost recovery throughtariffs. The reevaluated EIRRs are higher than the FIRRs, considering the expanded economicbenefits of the environmental project. However, these are still lower than those estimated atappraisal, due to the reduced benefits brought about by the lower capacity installed and lowercapacity utilization.
B. Lessons Learned
37. While the QEIP's objectives were substantially met, prolonged delays could have beenavoided with better planning and coordination at the design and implementation stages. Moreextensive survey and preparatory work could have anticipated the changes that were neededbefore the actual construction. The additional time that would have been spent for thesepreparatory activities could have outweighed the adverse repercussions of design errors interms of cost and time.
38. Hiring a domestic tendering company to assist QMG in the procurement process provedadvantageous, particularly since QMG was not familiar with ADB's Guidelines for Procurement.The tendering company provided expertise in the preparation of bidding documents, bidding andbid evaluation, and contract management in accordance with ADB's requirements. Thisfacilitated the bidding process and averted contractual disputes at a later stage.
39. The financial performance of the project enterprises is not satisfactory. This is primarilydue to lower capacity utilization on account of reduced actual demand and the low utility tariffsapproved by the regulatory board which are inadequate to cover operating and capital costs.While the enterprises took the right decision to scale down the project scope when they realizedthat the demand for their products and services was much weaker than anticipated, they did notreduce the costs correspondingly, and this has affected the financial viability of the QEIP.Unless the utilization of existing plant capacities improves and utility tariffs allow full costrecovery, the borrowing enterprises may not be able to sustain their operations without someform of government subsidy.
C. Recommendations
1. Project-Related
40. A more conservative approach is recommended in estimating demand, and the outlookfor the market for outputs of such a project, as also a more realistic assessment of the financialforecast during project preparation and appraisal. This would ensure that the project scope isbetter aligned with market conditions and is flexible enough to meet variations in demand. Also,
13
measures to enforce adequate tariffs should be ensured, so that the proposed project isfinancially robust.
41. Analysis of additional potential markets and a vigorous customer awareness campaignto promote demand for the products and services, especially during off-peak periods, should beundertaken. Capacity utilization can be optimized by creating more demand, particularly duringoff-peak periods.
42. QMG and the PRC Government should be again advised that low tariffs for utilities are amajor cause for the continued weak performance of the four enterprises, and that this should beaddressed. Also, the Government should be advised of the need to eliminate governmentsubsidies in the interest of enterprise reforms, so that the enterprises can be self-sustaining.
43. QMG should be reminded to submit the required annual BME reports so that ADB cancontinue to monitor the impact of the QEIP.
44. The project performance audit could be undertaken in 2002, after receipt of the first BMEreport and of additional data, particularly on the performance of the sludge digesters.
2. General
45. More such clean air and industrial pollution control projects are needed to improve theenvironmental standards in PRC. But such projects should be designed and implemented, inorder to ensure economic and financial viability.

14
APPENDIXES
Number Title Page Cited on(page, para.)
1 Chronology of Major Events 15 2, 6
2 Organization Chart of the Executing Agency andthe Project Implementation Enterprises
17 3, 10
3 Projected and Actual Project Cost 22 3, 11
4 Implementation Schedule 25 4, 13
5 Major Items Financed under the Project 29 5, 16
6 Training Provided under the Project 32 5, 17
7 Compliance with Loan Covenants 33 6, 19
8 Loan Disbursements 36 7, 22
9 Air Pollution Indices from 1990 to 2000 39 7, 23
10 Wastewater Analysis and Water Quality 40 8, 27
11 Comparison of Targets and Actual Achievements 41 8, 28
12 Financial Performance of Subproject Enterprises 45 10, 31
13 Financial Evaluation 50 10, 32
14 Economic Evaluation 54 11, 33
15 Project Performance Rating Assessment 57 11, 35

Appendix 1, page 1
CHRONOLOGY OF MAJOR EVENTS
7–25 April 1992 Fact-finding mission fielded
15 June 1992 Management review meeting
10 August 1992 Approval of summary environmental impact assessment(SEIA) report
11–26 August 1992 Appraisal mission fielded
16 October 1992 Staff review committee meeting.
26–28 October 1992 Loan negotiations held at Asian Development Bank (ADB)headquarters
10 December 1992 ADB loan of $103 million approved from ordinary capitalresources to the People’s Republic of China for theQingdao Environmental Improvement Project (Loan 1205-PRC)
10 March 1993 Loan signing
8 June1993 Approval for the extension of loan effectiveness for twomonths up to 9 August 1993
8 July 1993 Consultants Selection Committee meeting to review theBorrower’s proposed shortlists of consulting firms andinvitation documents
6 August 1993 Loan effectiveness
12 August 1993 Approval for procurement of a license covering processdesign for gas purification at the Qingdao Heat and PowerCompany
17 September 1993 Approval for contract negotiations with the first-rankedconsulting firms for parts A, B, C, and D
27 January 1994 Approval of revised procurement packages under parts B,C and D
26 December 1997 Inauguration and start of operations of Phase 2 underQingdao gas making project
15

Appendix 1, page 2
21 August 1998 Approval for the extension of loan closing date from30 June 1998 to 31 December 1999 to allow theconcerned project implementing agencies to complete theirrespective subprojects
29 October 1999 Approval for further extension of loan closing date from31 December 1999 to 30 Jun 2000 to allow the respectiveproject implementing agencies to complete remainingdisbursements under the Loan
19 July 2000 Cancellation of the undisbursed loan amount ofUS$10,160,272.93 and official closing of the loan account
17 – 26 June 2001 Project completion review mission fielded
16

Fig. A2.1: Organization Chart of Qingdao Municipal Government
MAYOR
DEPUTY MAYOR
ADB PROJECTOFFICE
SHANDONG ELECTRICITYPOWER COMPANY
HEALTHBUREAU
FINANCEBUREAU
ECONOMY
COMMISSION
CONSTRUCTIONCOMMISSION
CIBEPBPLANNING
COMMISSION
MUNICIPAL ENGINEERINGGENERAL CORPORATION
DRAINAGEADMINISTRATION GAS MAKING
PLANT
MUNICIPALMANAGEMENT
BUREAU
WASTEWATER
TREATMENTPLANT(ADB)
WASTEWATER
TREATMENTPLANT
(AUSTRIA)
FUTUREWASTEWATER
TREATMENTPLANT
(GERMANY)
FUTUREWASTEWATER
TREATMENTPLANT
HEATINGCOMPANY
FUTUREWASTEWATER
TREATMENTPLANT
QINGDAOPOWERPLANT
Appendix 2, page 1ADB = Asian Development Bank; CIB = Chemical Industry Bureau; EPB = Environment Protection Bureau.
Source: Qingdao municipal government
17

Fig. A2.2: Organization Chart of Qingdao Gas Group Company
MANAGING BOARD
SUPERVISORY BOARD
GENERAL ENGINEERVICE GENERAL
MANAGER
User
Developing
Department
Administration
Department
Production
and
Technique
Department
Managing
And
Planning
Department
Labor
Department
Finance
Department
Administration
Office
GENERAL MANAGER
Supervisor
Room
Hotline
Service
Center
Gas
Sale
Company
Pipeline
Management
Company
Thermal
Power
Company
QingdaoGas
EquipmentMaintenance
Co., Ltd.
QingdaoShinan
District PipeInstallationCompany
QingdaoGas Labor
ServiceCompany
Qingdao GasChemicalProducts
DevelopmentCompany
QingdaoCoking Gas
Co., Ltd.
QingdaoRan Tong
Da Co., Ltd.
QingdaoGas Material
BusinessCo., Ltd.
QingdaoGas
DesigningCompany
Appendix 2, page 2
Source: Qingdao municipal government
18

Fig. A2.3: Organization Chart of Qingdao Power Plant
DIRECTOR
Qingdao EnvironmentalProtection Bureau
CHIEFECONOMIST
GENERALMANAGER
ACCOUNTS &BUDGET
GENERALMANAGER
OPERATIONS
CHIEFENVIRONMENT
ENGINEER
ElectricManagment
MachineBoiler
CivilEngineering
ConstructionManagement
EquipmentMaterial
Purchasing
EnvironmentSupervision
Accountant Budget StatisticsPlanning Appendix 2, page 3
19
Source: Qingdao municipal government

Fig. A2.4: Organization Chart of Qingdao Heat and Power Company
BOARD OF DIRECTORS
VICE GENERAL MANAGER
MANAGEMENTSECTION
HEADQUARTEROFFICE
PRODUCTIONAND PLANSECTION
PLAN ANDFINANCESECTION
GENERALSTATION FOR
HEATEXCHANGER
ENGINEERINGTEAM
GENERAL MANAGER
Running ofSteam Pipe
NetNo, 1
Hai Po HeNo. 2
Hai Po HeNo. 20
Field StationTai DongStation
En BoStation
Ju HaoStation
Appendix 2, page 4
20
Source: Qingdao Municipal government

Fig. A2.5: Organization Chart of Qingdao Drainage Company
MANAGER
LABOR’SUNION
FINANCIALDEPARTMENT
EQUIPMENTDEPARTMENT
PRODUCTIONDEPARTMENT
LABOR ANDSECURITY
DEPARTMENT
POLITICALWORK
DEPARTMENTPLANTOFFICE
CENTERCONTROL
ROOM
DEPUTY MANAGER DEPUTY MANAGER
SEWAGETREATMENTWORKSHOP
SLUDGETREATMENTWORKSHOP
REPAIRINGWORKSHOP A
ppendix 2, page 5
21
Source: Qingdao Municipal government

Part A: Coal Gasification PlantLand Acquisition 19.82 19.82 14.58 14.58 (5.24) (26) (5.24) (26) Coal Handling Plant 2.31 0.98 3.29 2.12 1.86 3.98 (0.19) (8) 0.88 27 0.69 21 Coke Making Plant 6.98 5.90 12.88 11.52 2.48 14.00 4.54 65 (3.42) (27) 1.12 9 Gas Purification Plant 5.66 2.47 8.13 7.17 1.23 8.40 1.51 27 (1.24) (15) 0.27 3 Gas Storage and Distribution Stations 9.40 1.67 11.07 4.73 5.17 9.90 (4.67) (50) 3.50 32 (1.17) (11) Boiler and Power Station 2.18 3.04 5.22 1.26 2.12 3.38 (0.92) (42) (0.92) (18) (1.84) (35) Gas Producer Station 1.89 1.52 3.41 1.53 1.53 (0.36) (19) (1.52) (45) (1.88) (55) Instrumentation 5.49 0.06 5.55 4.53 4.53 (0.96) (17) (0.06) (1) (1.02) (18) Electricity and Communication 1.48 2.96 4.44 9.63 1.18 10.81 8.15 551 (1.78) (40) 6.37 143 Utilities and Auxiliary Facilities 0.94 1.88 2.82 2.47 13.85 16.32 1.53 163 11.97 424 13.50 479 Laboratory Equipment 0.45 0.45 (0.45) (100) (0.45) (100) Training 0.11 0.57 0.68 0.11 0.12 0.23 (0.45) (66) (0.45) (66) Consultants 0.11 0.11 0.13 0.13 0.02 18 0.02 18 Civil works 5.07 5.07 16.92 16.92 11.85 234 11.85 234 Base Cost 37.00 45.94 82.94 45.20 59.51 104.71 8.20 22 13.57 16 21.77 26 Physical Contingency 3.70 4.59 8.29 (3.70) (100) (4.59) (55) (8.29) (100) Price Contingency 4.53 6.47 11.00 (4.53) (100) (6.47) (59) (11.00) (100) Interest During Construction 8.77 8.77 8.77 12.88 21.65 12.88 147 12.88 147 Subtotal (Part A) 54.00 57.00 111.00 53.97 72.39 126.36 (0.03) (0) 15.39 14 15.36 14
Part B: Heat Generation at Qingdao Power Plant for District Heating SystemThermal Power System 2.82 0.48 3.30 3.79 4.92 8.71 0.97 34 4.44 135 5.41 164 Water Treatment System 1.84 1.08 2.92 0.15 4.77 4.92 (1.69) (92) 3.69 126 2.00 69 Electrical System 1.17 0.58 1.75 1.02 1.67 2.69 (0.15) (13) 1.09 62 0.94 54 Thermal Control System 0.56 0.36 0.92 0.21 0.81 1.02 (0.35) (63) 0.45 49 0.10 11 Boiler Overhaul 0.89 1.17 2.06 2.43 2.43 (0.89) (100) 1.26 61 0.37 18 New Boiler Chimney 0.62 0.31 0.93 (0.62) (100) (0.31) (33) (0.93) (100) Transportation Equipment 0.20 0.20 0.19 0.19 (0.01) (4) (0.01) (4) Water Service Enlargement 0.32 0.32 2.28 5.75 8.03 2.28 5.43 1,697 7.71 2,408 Pollution Monitoring System 0.10 0.10 0.10 0.10 (0.00) (4) (0.00) (4) Domestic Design, Training, etc. 0.10 1.79 1.89 (0.10) (100) (1.79) (95) (1.89) (100) Foreign Consultant Services 0.21 0.21 0.24 0.24 0.03 14 0.03 14 Foreign Training 0.21 0.21 0.11 0.11 (0.10) (47) (0.10) (47) Base Cost 8.72 6.09 14.81 8.09 20.35 28.44 (0.63) (7) 14.26 96 13.63 92 Physical Contingency 0.87 0.61 1.48 (0.87) (100) (0.61) (41) (1.48) (100) Price Contingency 1.67 1.92 3.59 (1.67) (100) (1.92) (53) (3.59) (100) Interest During Construction 1.74 1.38 3.12 1.74 2.60 4.34 - - 1.22 39 1.22 39 Subtotal (Part B) 13.00 10.00 23.00 9.83 22.95 32.78 (3.17) (24) 12.95 56 9.78 43
PROJECTED AND ACTUAL PROJECT COST
Item %FXFX LC TotalFX LC TotalActual Cost
($ million)
Appraisal Estimates Change from Appraisal%Total%LC
Appendix 3, page 1
22

PROJECTED AND ACTUAL PROJECT COST
Item %FXFX LC TotalFX LC TotalActual Cost
($ million)
Appraisal Estimates Change from Appraisal%Total%LC
Part C: Pipeline System for Transmission and Distribution of HeatSteam Network (22 km) 4.42 2.65 7.07 2.47 7.20 9.67 (1.95) (44) 4.55 64 2.60 37 Monitoring and Control System 0.41 0.15 0.56 2.04 1.75 3.79 1.63 398 1.60 285 3.23 576 Communication System 0.02 0.02 0.04 0.28 0.24 0.52 0.26 1,292 0.22 550 0.48 1,196 Substations (Heat Exchangers and Meters) 1.60 0.91 2.51 1.79 0.50 2.29 0.19 12 (0.41) (16) (0.22) (9) Hot Water Network (43 km) 3.62 1.93 5.55 1.20 0.60 1.80 (2.42) (67) (1.33) (24) (3.75) (68) Peak Demand Boilers 1.82 1.82 (1.82) (100) (1.82) (100) Central Dispatching Building 0.21 0.21 0.68 0.68 0.47 224 0.47 224 Maintenance of Vehicles, etc. 0.21 0.21 0.10 0.10 0.20 0.10 (0.11) (52) (0.01) (5) Domestic Design, Training, etc. 2.32 2.32 1.52 1.52 (0.80) (35) (0.80) (35) Foreign Consultant Services 0.30 0.30 0.17 0.17 (0.13) (44) (0.13) (44) Foreign Training 0.20 0.20 0.11 0.11 (0.09) (44) (0.09) (44) Workers' Apartments 1.06 1.06 1.92 1.92 0.86 81 0.86 81 Base Cost 10.57 11.28 21.85 8.16 14.51 22.66 (2.41) (23) 3.23 15 0.81 4 Physical Contingency 1.06 1.13 2.19 (1.06) (100) (1.13) (52) (2.19) (100) Price Contingency 1.99 3.59 5.58 (1.99) (100) (3.59) (64) (5.58) (100) Interest During Construction 2.38 2.38 2.38 2.38 Subtotal (Part C) 16.00 16.00 32.00 10.54 14.51 25.04 (5.46) (34) (1.49) (5) (6.96) (22)
Part D: Wastewater Treatment PlantMobilization and Demobilization 0.14 0.14 (0.14) (100) (0.14) (100) Site Reclaim and Preparation 9.36 9.36 1.59 1.59 (7.77) (83) (7.77) (83) Licun River North Sewage - Lift Station 0.60 0.64 1.24 1.24 1.24 (0.60) (100) 0.60 48 0.00 0 - Sewer Mains from Pump Stations to Treatment Plant 1.38 1.38 1.95 1.95 0.57 41 0.57 41 - Power Supply and Associated Works 0.63 0.63 0.11 0.82 0.93 0.11 0.19 29 0.30 47 - Screening Plant (including fine screen) 0.31 0.12 0.43 1.15 0.34 1.49 0.84 272 0.22 51 1.06 247 - Inlet Life Station 0.35 0.44 0.79 1.10 0.42 1.51 0.75 213 (0.02) (3) 0.72 91 - Grit Chamber 0.18 0.18 0.38 0.34 0.73 0.20 113 0.34 190 0.55 303 - Aeration Plant 3.00 1.39 4.39 2.45 2.29 4.74 (0.55) (18) 0.90 21 0.35 8 - Blower House 0.12 0.12 1.74 0.67 2.41 1.74 0.55 458 2.29 1,908 - Clarification 1.50 2.45 3.95 1.56 1.80 3.36 0.06 4 (0.65) (17) (0.59) (15) - Sludge Thickness 0.50 0.64 1.14 0.29 0.26 0.55 (0.21) (41) (0.38) (33) (0.59) (51) - Sludge Digestion 2.70 2.96 5.66 2.02 0.78 2.81 (0.68) (25) (2.18) (38) (2.85) (50) - Gas Holding Tank 0.29 0.29 0.48 0.38 0.86 0.48 0.09 31 0.57 197 - Sludge Dewatering System 1.00 0.10 1.10 1.25 0.32 1.57 0.25 25 0.22 20 0.47 43 - Chlorination 0.07 0.29 0.36 0.17 0.10 0.27 0.10 138 (0.19) (53) (0.09) (26) Boiler Room 0.11 0.11 (0.11) (100) (0.11) (100) Miscellaneous Buildings 1.20 1.20 3.38 3.38 2.18 182 2.18 182 Yard Piping and Cable 0.88 0.88 0.11 0.54 0.65 0.11 (0.34) (39) (0.23) (27) Instrumentation 1.20 1.20 1.18 0.18 1.36 (0.02) (1) 0.18 15 0.16 14 Electrical Works 0.36 0.25 0.61 0.06 0.21 0.27 (0.30) (83) (0.04) (7) (0.34) (56) Power Station 0.72 0.72 0.69 0.43 1.12 0.69 (0.29) (40) 0.40 56 Sewage Outfall 0.38 0.38 0.14 0.14 (0.24) (62) (0.24) (62) Laboratory Equipment 0.35 0.35 0.21 0.01 0.21 (0.14) (41) 0.01 2 (0.14) (40)
Appendix 3, page 2
23

PROJECTED AND ACTUAL PROJECT COST
Item %FXFX LC TotalFX LC TotalActual Cost
($ million)
Appraisal Estimates Change from Appraisal%Total%LC
Tools and Miscellaneous 0.14 0.14 0.01 0.01 (0.13) (91) (0.13) (91) Spare Parts 0.38 0.38 (0.38) (100) (0.38) (100)
Equipment for Transportation 0.13 0.13 0.33 0.20 0.53 0.33 0.07 57 0.40 311 Landscape 0.10 0.10 0.24 0.24 0.14 144 0.14 144 Predesign Study 0.02 0.02 0.02 0.02 (0.00) (22) (0.00) (22) Site Survey, Geothecnology Service and Detailed Design 0.43 0.43 (0.43) (100) (0.43) (100) including specification, Preparation and Tender Evaluation 0.67 0.67 0.67 0.67 Project Management 0.39 0.39 0.36 0.36 (0.03) (9) (0.03) (9) Commissioning 0.14 0.14 0.06 0.06 (0.08) (54) (0.08) (54) Training 0.24 0.04 0.28 (0.24) (100) (0.04) (14) (0.28) (100) Consulting Services from Abroad 0.60 0.60 0.32 0.32 (0.28) (47) (0.28) (47) Base Cost 13.34 25.88 39.22 15.60 19.76 35.36 2.26 17 (6.12) (16) (3.86) (10) Physical Contingency 1.33 2.59 3.92 (1.33) (100) (2.59) (66) (3.92) (100) Price Contingency 2.43 4.53 6.96 (2.43) (100) (4.53) (65) (6.96) (100) Interest During Construction 2.90 - 2.90 2.90 2.90 Subtotal (Part D) 20.00 33.00 53.00 18.50 19.76 38.26 (1.50) (7) (13.24) (25) (14.74) (28)
TOTAL 103.00 116.00 219.00 92.84 129.60 222.44 (10.16) (10) 13.60 6 3.44 2
km = kilometerSource: Qingdao Municipal Government and Project Implementation Agencies
Appendix 3, page 3
24

1 9 9 2 1 9 9 3 1 9 9 4 1 9 9 5 1 9 9 6
Task 4 1 2 3 4 1 2 3 4 1 2 3 4 1 2 3 4 1 2 3 4
Loan Approval
Site Preparation
Basic Design
Approval of Basic Design
Detailed Design
Civil Construction
Preparation ofTender Documents
Tender Issue, Evaluationand Appraisal
Supply of Equipmentand Materials
Erection
Commissioning
Training
Legend:
- Original
- Actual
Source: Qingdao Gas Group Company
1 2 3
Fig. A4.1: Part A: Coal Gasification Plant
4 1 2 3
1 9 9 8
1 2 31 4
1 9 9 9 2 0 0 0
IMPLEMENTATION SCHEDULE
2 3 4
1 9 9 7
4
1991
Appendix 4, page 1
25

1992 1 9 9 3 1 9 9 4 1 9 9 5 1 9 9 6 1 9 9 7 1 9 9 8
Task 4 1 2 3 4 1 2 3 4 1 2 3 4 1 2 3 4 1 2 3 4 1 2 3 4 1 2 3 4 1 2 3 4 1 2 3 4
Loan Approval
Turbo generator Sets
Design & Tender Preparation
Tender Out
Contract Issued
Deliver y Time
Installation
Water Treatment S ystem
Design & Tender Preparation
Tenders Out
Contract Issued
Deliver y Time
Installation
Boiler Overhaul
Tenders Out
Contract Issued
Deliver y Time
Installation
Trainin g
Legend:
- Original
- Actual
Source: Qingdao Power Plant
1st Unit 2nd Unit
2 0 0 1
IMPLEMENTATION SCHEDULEFig. A4.2: Part B: Heat Generation at Qingdao Power Plant for District Heating System
1 9 9 9 2 0 0 0
Appendix 4, page 2
26
1992 1 9 9 3 1 9 9 4 1 9 9 5 1 9 9 6 1 9 9 7 1 9 9 8
Task 4 1 2 3 4 1 2 3 4 1 2 3 4 1 2 3 4 1 2 3 4 1 2 3 4 1 2 3 4 1 2 3 4
Loan Approval
Steam Network
Design & Tender Preparation
Tender Out
Contract Issued
Deliver y Time
Installation
Substations
Design & Tender Preparation
Tenders Out
Contract Issued
Deliver y Time
Installation
Hot Water Network
Design & Tender Preparation
Tenders Out
Contract Issued
Deliver y Time
Installation
Trainin g
Legend:
- Original
- ActualSource: Qingdao Heat and Power Group
1 9 9 9 2 0 0 0
IMPLEMENTATION SCHEDULEFig. A4.3: Part C: Pipeline Network System for Transmission and Distribution of Heat
Appendix 4, page 3
27
1992 1 9 9 3 1 9 9 4 1 9 9 5 1 9 9 6 1 9 9 7 1 9 9 8
Task 4 1 2 3 4 1 2 3 4 1 2 3 4 1 2 3 4 1 2 3 4 1 2 3 4 1 2 3 4 1 2 3 4
Loan Approval
Site Preparation
Predesign Study
Preliminary Design (Overseas)
Design for Tender
Lift Station & Associated Sewer
Foundation
Civil Works
Sewage Outfall
Tender Prequalification
Tender Preparation
Bank to Approve Tender Documents
Tendering
Tender Evaluation
Approval of Tender, Negotiation and Award of Contract
Shop Drawings Approval
Detailed Design
Equipment Fabrication
Equipment Delivery
Equipment Installation
Start-Up & Commissioning
Operation a
Training
a Excludes operation of digester which was still being commissioned as of mission date.
Legend: - Original
- Actual
Source: Qingdao Drainage Company
1 9 9 9 2 0 0 0
IMPLEMENTATION SCHEDULEFig. A4.4: Part D: Wastewater Treatment Plant
Appendix 4, page 4
28

Contractor/ Mode of Date ofItem Supplier Procurement Contract
Part A: Coal Gasification Plant
0005 Design, Consruction, and Operation Krupp Koppers GmbH IS 10/7/93 0.500 0.500 - of the Gas Treatment Plant -
0010 Gas Supply and Distribution System China Meheco I&E Corp. ICB 20/1/95 0.626 0.626 - 0011 Gas Holder Shandong Machinery & Equipment ICB 20/1/95 4.081 4.081 - 0027 Computers and Accessories Shandong Instruments DIR 28/6/95 0.025 0.025 - 0030 Electrostatic Tar Precipitator, etc. Shandong Machinery & Equipment ICB 31/8/95 0.750 0.750 - 0031 Gas Purification Plant Liaoning Machinery ICB 31/8/95 0.831 0.831 - 0032 Instrument and Auxiliary Equipment Shandong Machinery & Equipment IS 2/6/95 0.412 0.412 - 0033 Coal Preparation Unit Shandong Machinery & Equipment ICB 3/11/95 1.510 1.510 - 0034 Belt Conveyor Shandong Machinery & Equipment ICB 3/11/95 0.615 0.615 - 0035 Coking Equipment, etc. Shandong Machinery & Equipment ICB 3/11/95 1.883 1.883 - 0036 Stamp-charging Coke Oven, etc Beijing Machinery & Equipment ICB 3/11/95 2.713 2.713 - 0037 Boiler House Liaoning Machinery ICB 3/11/95 1.255 1.255 - 0039 Coke Oven Machine Shandong Machinery & Equipment ICB 29/11/96 3.063 3.063 - 0051 Programmable Controller China Natl Mach & Equipment IS 8/4/96 0.224 0.224 - 0053 Stamping Machine Saarberg-Interplan ICB 12/2/96 3.442 3.442 - 0056 Special Equipment Shandong Machinery & Equipment ICB 9/8/96 1.819 1.819 - 0057 DCS and Transmitters CETEC-Intl Eco Coop Co ICB 9/8/96 0.737 0.737 - 0059 General Electric Device Shandong Machinery I&E ICB 12/9/96 9.410 9.410 - 0060 Control Valves, Analyzers, etc. Shandong Machinery & Equipment ICB 3/9/96 3.378 3.378 - 0061 Valves and Auxiliary Equipment Shandong Machinery & Equipment ICB 13/1/97 3.779 3.779 - 0062 Producer Gas Station Shandong Machinery & Equipment ICB 13/1/97 1.533 1.533 - 0063 Ventilation, Dust Removal, etc. Liaoning Mach & Equip I&E Grp ICB 11/12/96 1.221 1.221 - 0064 Transportation and Facilities for Shandong Machinery & Equipment ICB 11/12/96 1.249 1.249 -
Water Supply & Drainage
Subtotal (Part A) 45.056 45.056 -
ContractAmount
AmountDisbursed
MAJOR ITEMS FINANCED UNDER THE PROJECT($ million)
PCSSNo.
LoanAmount
Cancelled
Appendix 5, page 1
29

Contractor/ Mode of Date ofItem Supplier Procurement Contract
ContractAmount
AmountDisbursed
MAJOR ITEMS FINANCED UNDER THE PROJECT($ million)
PCSSNo.
LoanAmount
Cancelled
Part B: Heat Generation at Qingdao Power Plant
0006 Diaphragm Valves Nisho Iwai IS 27/9/94 0.491 0.491 - 0007 Butterfly and Ball Valves Keystone Valve HKG Ltd IS 17/9/94 0.251 0.251 - 0008 Sequencing Control System SEM Electronic Co Ltd IS 21/9/94 0.500 0.500 - 0009 Backpressure Turbine Generator Units China Mach & Equip I&E Co ICB 20/2/95 1.788 1.788 - 0012 Dearator Andac Engineering Corp IS 2/3/95 0.231 0.231 - 0013 Desuper Heating and Pressure Reducing sy Keystone Valve HK Ltd IS 24/2/95 0.295 0.295 - 0017 Feed Water Tanks Under Dearators Qingdao Asso Textiles I&E Corp IS 11/5/95 0.095 0.095 - 0018 Magnetic Drive Pump Meccaya Enterprises Co IS 14/6/95 0.071 0.071 - 0019 Ion Chromatograph Techcomp Ltd IS 24/4/95 0.080 0.080 - 0020 Power Transformer China Natl Electronics I&E Anhui IS 22/4/95 0.246 0.246 -
0021 Pressure Type Mixer, etc. Qingdao Metals, Minerals & Machinery IS 21/4/95 0.405 0.405 - 0022 Ion Exchange Resin Qingdao Metals, Minerals & Machinery IS 21/4/95 0.387 0.387 - 0023 Qingdao Metals Mach & Equip Qingdao Metals, Minerals & Machinery IS 21/4/95 0.243 0.243 - 0024 Current Limiting Reactors, etc Shanghai Elec Engg Co Ltd IS 21/4/95 0.115 0.115 - 0025 Butterfly Valves China Resources National Corp IS 3/8/95 0.178 0.178 - 0026 Boiler Water Feed Pumps, etc Shandong Technical I&E Corp IS 12/5/95 0.240 0.240 - 0028 Valves China United Electric I&E Corp IS 8/8/95 0.125 0.125 - 0029 Valves United (FE) Co Ltd IS 8/8/95 0.141 0.141 - 0042 35 kV Circuit Breaker Schneider Electric Group SA IS 5/12/95 0.173 0.173 - 0049 Environment Protection Instrument Shandong Tech I&E Corp IS 29/3/96 0.096 0.096 - 0050 Microcomputer Monitoring Unit, etc. China United Electric I&E Corp IS 26/3/96 0.223 0.215 0.008 0052 Trucks and Coaster Qingdao Metals, Minerals & Machinery IS 19/3/96 0.193 0.193 - 0055 Pipes and Tubes SSPUC ICB 28/6/96 0.966 0.966 - 0058 Instrument Panel Shanghai Automation Instrument Co IS 4/5/96 0.208 0.208 -
Subtotal (Part B) 7.741 7.733 0.008
kV = kilovolt
Appendix 5, page 2
30

Contractor/ Mode of Date ofItem Supplier Procurement Contract
ContractAmount
AmountDisbursed
MAJOR ITEMS FINANCED UNDER THE PROJECT($ million)
PCSSNo.
LoanAmount
Cancelled
PART C: PIPELINE NETWORK FOR INDUSTRIAL STEAM AND DISTRICT HEATING
0014 Steel Pipes Shandong Steel Pipes United Co ICB 22/6/95 1.132 1.132 - 0015 Valves Keystone Valve HKG Ltd IS 28/4/95 0.303 0.303 - 0016 Expansion Joints Qingdao Metals Minerals & Mach IS 21/6/95 0.192 0.192 - 0044 Hinged Expansion Joints Qindao Metals Mineral & Machinery DP 18/1/96 0.122 0.122 - 0045 Heat Exchangers China DC Tech I&E Corp ICB 8/2/96 0.188 0.188 - 0046 Seamless Steel Pipes Shandong Mach & Equip I&E Corp ICB 8/2/96 1.202 1.202 - 0047 Pumps China DC Tech I&E Corp ICB 8/2/96 0.077 0.077 - 0048 Valves China Natl Automation Control ICB 8/2/96 0.535 0.535 - 0054 Transportation & Engineering Vehicles Qingdao Metals Minerals & Mach IS 17/4/96 0.106 0.106 - 0065 Thermal Insulation Shandong Steel Pipes United Co ICB 7/8/96 0.720 0.720 - 0068 Test Meters Shandong Instruments I&E Corp ICB 10/7/97 1.237 0.099 1.138 0069 Control Equipment China Heavy Duty Truck I&E Corp ICB 10/7/97 0.184 - 0.184 0073 Auto-control System Beijing Huaneng Control System ICB 8/4/99 2.316 2.316 -
Subtotal (Part C) 8.315 6.993 1.322
PART D: LICUN RIVER WASTEWATER TREATMENT PLANT
0038 35 kV & 10 kV Transformer Substation China Natl Electric Equip Corp ICB 15/9/95 0.558 0.558 - 0040 Hot-Rolled Low Carbon Steel Wire Rod, etc. Shandong Steel Pipes Uni corp ICB 14/11/95 1.886 1.886 - 0041 Hot-Rolled Plain Steel Bars Shandong Metals Minerals I&E ICB 14/11/95 0.233 0.233 - 0043 Sewage Electrical & Mechanical Equip PURAC AB ICB 20/12/95 5.485 5.485 - 0043 Sewage Electrical & Mechanical Equip PURAC AB ICB 20/12/95 1.628 1.628 - 0066 Korean Pine Shandong Steel Pipes Uni corp ICB 20/9/96 0.522 0.522 - 0067 Yellow Pine Shandong Machinery I&E Grp Corp ICB 20/9/96 0.184 0.184 - 0070 Instruments Sunkongao Co Ltd IS 2/6/98 0.403 0.403 - 0071 Wheel Loader, Forklift, Truck, etc. China North Inds Qingdao Corp IS 26/9/98 0.105 0.105 - 0072 Heavy Duty Self-Dump Truck China North Inds Qingdao Corp IS 20/7/98 0.360 0.360 - 0074 Steel Shandong Mach & Equip I&E Corp IS 27/4/99 0.332 0.332 - 0075 Mech & Elec Equip for Sludge Digester Passavant-Roediger Anlagenbau ICB 26/7/99 4.363 2.139 2.224 0076 Digital Control Facilities Satellite S&T Pty Ltd IS 22/2/00 0.479 0.479 - 0077 Concrete Pipes China North Inds Qingdao Corp IS 12/6/00 0.476 0.476 - 0078 Iron Pipe China North Inds Qingdao Corp IS 12/6/00 0.489 0.489 -
Subtotal (Part D) 17.503 15.280 2.224 Total 78.615 75.061 3.554
DCS = Data Communication System; DP = direct purchase; kV = kilovolt.
Source: Qingdao Gas Group Company, Qingdao Power Plant, Qingdao Heat and Power Group, and Qingdao Drainage Company
Appendix 5, page 3
31

Appendix 6
TRAINING PROVIDED UNDER THE PROJECT
No. of Staff Person-Days Location
A. Overseas Training
1. Part A
a. Coke Oven 14 294 Germanyb. Stamping Charging Machine Operation and Maintenance 6 126 Germanyc. Computer 4 60 Singapored. Finance Management 2 24 Australia
2. Part B
a. Finance Management 8 158 USAb. Cogeneration Plant operation
and Maintenance 22462
USA
3. Part C
a. Management 8 168 Korea, Rep. ofb. Design 10 210 Korea, Rep. ofc. Operation and Maintenance 10 210 Korea, Rep. of
B. Domestic Training
1. Part A
Production Process, AutomaticControl, Environmental Monitoring,Operation and Maintenance 484 58,080 PRC
2. Part C
Automatic Control 8 168 PRC
3. Part D
Operation and Maintenance 4 84 PRC
PRC = People's Republic of China; USA = United States of America.
32

Appendix 7, page 1
COMPLIANCE WITH LOAN COVENANTS
Covenant Reference toLoan Agreement
Status of Compliance
1. Emission levels for sulfur dioxide at theProject facilities will not exceed 0.5milligrams (mg) per standard cubic meter(m3) and shall not exceed a daily average of0.15 mg per standard m3 or a yearly averageof 0.06 mg per standard m3.
Loan AgreementSchedule 6.3(e)
Complied with. Emissionlevel for sulfur dioxide iswithin 0.5 mg/cu m.
2. Before any sludge generated through theoperation of the wastewater treatment plantis used as fertilizer or soil conditioner, theconcentration of any polycyclic aromatichydrocarbon (PAH) compound in suchsludge must not exceed 3 milligrams perkilogram. If the sludge is contaminated byPAHs, the sludge must be disposed of in anappropriately designed landfill site.
Loan AgreementSchedule 6.3(f)
Not applicable as sludgegenerated prior to theoperation of the sludgedigesters was disposed in alandfill site and sludgegenerated later was furthertreated in digesters toproduce methane gas forpower and heating.
3. Subsidy to any of the project implementingagencies (PIAs) will not be provided after31 December 1992.
Loan AgreementSchedule 6.6
Not complied with. Subsidy continues to be provided.
4. Effective 31 January 1993, the QingdaoPower Plant (QPP) will be allowed to retaindepreciation funds and retain profits after taxand dividend payments.
Loan AgreementSchedule 6.7
Complied with.
5. Tariffs charged by QPP for steam sales toQingdao Heat and Power Company (QHPC)and by QHPC for steam and district heatingto end-users will be at levels that allow fullrecovery of operating and capital coststhroughout the year and provide an adequatereturn on investment.
Loan AgreementSchedule 6.8
Not complied with. Tariffsare low and insufficient forfull cost recovery. Recoverylevel is 50 percent for QPPand 100 percent for QHPC.Also tariffs are notdifferentiated betweennonheating periods andpeak heat demand periods.
6. Ensure that contractual arrangementsbetween QPP and QHPC clearly establishthat a reliable steam supply to QHPC isensured.
Loan AgreementSchedule 6.9
Complied with.
33

Appendix 7, page 2
Covenant Reference toLoan Agreement
Status of Compliance
7. Ensure that Qingdao Drainage Company's(QDC) tariffs for water treatment are set atlevels that allow full recovery of operatingand capital costs and provide an adequatereturn on investment.
Loan AgreementSchedule 6.10
Not complied with.Insufficient tariffs for fullcost recovery. Recoverylevel is only 70%.
8 QHPC and QDC will set their connectionfees at levels adequate to ensure that theyhave the financial resources to fund theirrespective anticipated contributions to thecost of the Project.
Loan AgreementSchedule 6.11
Partly complied with, asQDC does not charge anyconnection fees.
9. Within one year of the start of commercialoperations of the proposed coal gasificationplant to be established under part A of theProject, the existing Phase I gas makingplant will be closed without delay.
Loan AgreementSchedule 6.12
Complied with. Old plantclosed down.
10. Each PIA will investigate the feasibility ofentering into subcontracting arrangementswith nonstate enterprises and will offeropportunities to non-state enterprises toassume certain existing functions of such PIA.
Loan AgreementSchedule 6.13
Under study.
11. Customers will be billed within one month ofthe end of each billing period and will ensurethat accounts receivable do not at any timeexceed an amount equivalent to the last threemonths' billings.
Loan AgreementSchedule 6.14
Complied with.
12. Not later than 31 December 1992, the priceof coal inputs for QPP and Qingdao GasGroup Company (QGC) will be determinedby the market.
Loan AgreementSchedule 6.15
Complied with.
13. No form of subsidy to the price of coal forindustrial users or domestic householdconsumers will be introduced in Qingdaomunicipality.
Loan AgreementSchedule 6.16
Complied with.
14. Not later than 31 December 1992, theaverage price of gas charged to consumerswill be increased to not less than 550 yuanper thousand m3.
Loan AgreementSchedule 6.17
Complied with.
34
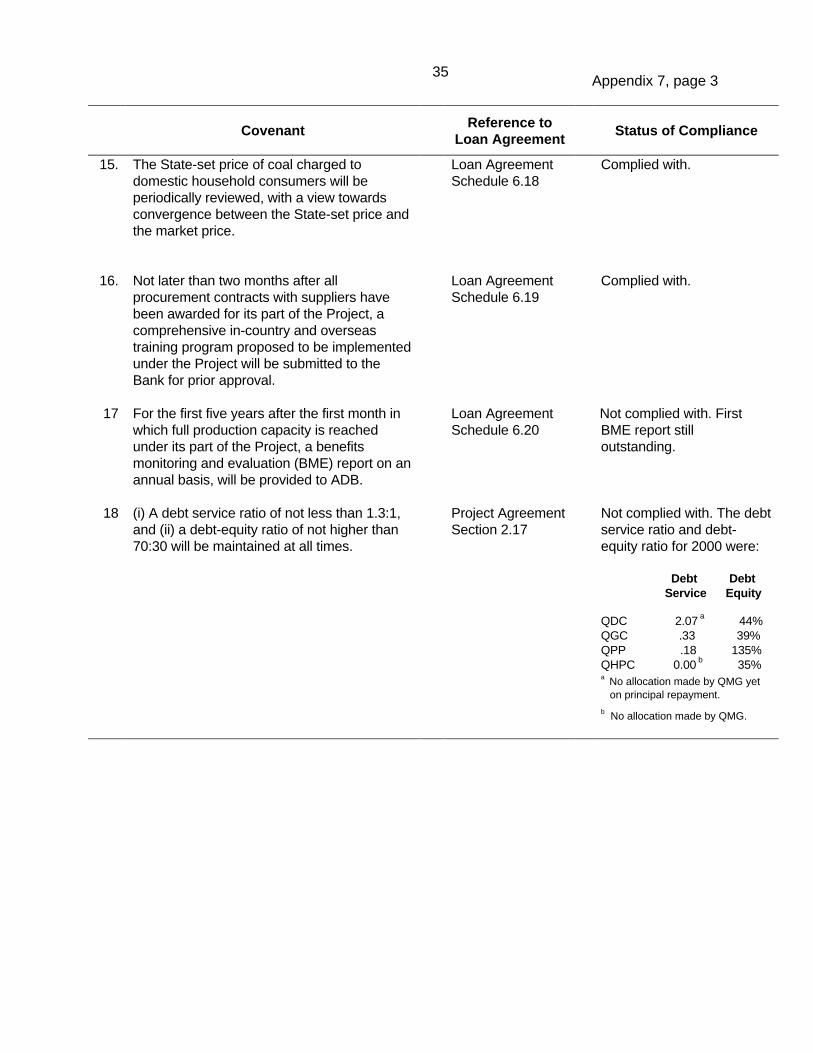
Appendix 7, page 3
Covenant Reference toLoan Agreement
Status of Compliance
15. The State-set price of coal charged todomestic household consumers will beperiodically reviewed, with a view towardsconvergence between the State-set price andthe market price.
Loan AgreementSchedule 6.18
Complied with.
16. Not later than two months after allprocurement contracts with suppliers havebeen awarded for its part of the Project, acomprehensive in-country and overseastraining program proposed to be implementedunder the Project will be submitted to theBank for prior approval.
Loan AgreementSchedule 6.19
Complied with.
17 For the first five years after the first month inwhich full production capacity is reachedunder its part of the Project, a benefitsmonitoring and evaluation (BME) report on anannual basis, will be provided to ADB.
Loan AgreementSchedule 6.20
Not complied with. FirstBME report stilloutstanding.
18 (i) A debt service ratio of not less than 1.3:1,and (ii) a debt-equity ratio of not higher than70:30 will be maintained at all times.
Project AgreementSection 2.17
Not complied with. The debtservice ratio and debt-equity ratio for 2000 were:
Debt Debt Service Equity
QDC 2.07 a 44%QGC .33 39%QPP .18 135%QHPC 0.00 b 35%a No allocation made by QMG yet on principal repayment.
b No allocation made by QMG.
35

1993 IIIIIIIV 0.300 0.065 0.300 0.065
Subtotal 0.300 0.065
1994 I 1.300 0.561 1.600 0.626 II 1.120 0.154 2.720 0.780 III 5.250 0.188 7.970 0.968 IV 3.740 0.299 11.710 1.267
Subtotal 11.410 1.202
1995 I 1.500 0.176 13.210 1.443 II 1.400 1.688 14.610 3.131 III 4.900 2.144 19.510 5.275 IV 4.600 3.517 24.110 8.792
Subtotal 12.400 7.525
1996 I 7.600 8.935 31.710 17.727 II 7.900 4.433 39.610 22.160 III 10.100 3.354 49.710 25.514 IV 5.100 13.967 54.810 39.481
Subtotal 30.700 30.689
1997 I 0.647 9.575 55.457 49.056 II 1.131 8.524 56.588 57.580 III 3.217 11.817 59.805 69.397 IV 0.948 3.081 60.753 72.478
Subtotal 5.943 32.997
1998 I 0.700 0.371 61.453 72.849 II 3.000 3.067 64.453 75.916 III 3.000 - 67.453 75.916 IV 2.000 5.006 69.453 80.922
Subtotal 8.700 8.444
1999 I 1.800 1.259 71.253 82.181 II 2.500 3.573 73.753 85.754 III 1.100 2.722 74.853 88.476 IV 2.800 0.884 77.653 89.360
Subtotal 8.200 8.438
2000 I 0.600 0.149 78.253 89.509 II 2.300 1.678 80.553 91.187 III - 1.654 80.553 92.841
Subtotal 2.900 3.481
Total 80.553 92.841 a Based on annual submissions by the EAs.Source: Loan and Financial Information System
Projection
Appendix 8, page 1
Year Quarter
LOAN DISBURSEMENTSTable A8.1: Quarterly and Cumulative Disbursements
($ million)
ActualCumulative
Projection a ActualAmount
36

Fig. A8.2: Projected and Actual Loan DisbursementsAnnual Disbursement Schedule
-
5.000
10.000
15.000
20.000
25.000
30.000
35.000
1993 1994 1995 1996 1997 1998 1999 2000
YEAR
$mill
ion
Projections Actual
Source: Loan and Financial Information System
Appendix 8, page 2
37

Fig. A8.1: Projected and Actual Loan Disbursements Cumulative Disbursement Schedule
-
10.000
20.000
30.000
40.000
50.000
60.000
70.000
80.000
90.000
100.000
1993 1994 1995 1996 1997 1998 1999 2000
YEAR
$mill
ion
Projections Actual
Source: Loan and Financial Information System
Appendix 8, page 3
38

1990 1991 1997 1998 1999 2000
SO2 0.229 0.207 0.148 0.126 0.093 0.055
TSP 0.216 0.196 0.224 0.221 0.191 0.143 NOx 0.064 0.064 0.052 0.034
CO2
CO 1.900 2.100 1.400 1.000
CO = carbon monoxide; CO2 = carbon dioxide; mg/m3 = milligrams per cubic meter; NOx = nitrogen oxides;SO2 = sulfur dioxide; TSP = total suspended particulates.
Source: Qingdao Municipal Government
Appendix 9
AIR POLLUTION INDICES FROM 1990 TO 2000
Air Quality in Qingdao Municipality (mg/m 3)
39

A. At Jiaozhouwan near Licun River Mouth (mg/l)
1990 1997 1998 1999 2000
BOD 300-800 54.05 40.10 34.20 12.70 COD 700-2000 264.30 264.30 177.70 65.00 SS 700-1500 193.00 73.00 149.00 31.60 NH3N 50-100 17.60 11.40 15.00 11.10
B.
Influent Effluent Influent Effluent Influent Effluent
COD 704 47 2,816 57 2,251 61.00BOD 325 8 831 10 770 12.00SS 479 8 2,049 15 1,441 11.00NH3N 20 1 40 4 44 8.00
C. At Qingdao Gas Company Wastewater Treatment Plant (mg/l)
Influent Effluent
COD 1,270 285 BOD 230 31 Phenol 250 0.5 Cyanide 2.37 0.43 NH3N 473 91.7
BOD = biological oxygen demand; COD = chemical oxygen demand; mg/l = milligrams per liter;NH3N = ammonia; SS = suspended solid.
Source: Qingdao Municipal Government
2000
Appendix 10
At Licun Wastewater Treatment Plant (mg/l)
WASTEWATER ANALYSIS AND WATER QUALITY
1998 1999
40

Appendix 11, page 1
COMPARISON OF TARGETS AND ACTUAL ACHIEVEMENTS
Subproject Target Actual
1. Part A: CoalGasification Plant -Qingdao Gas GroupCompany
a. 2 units of coke-making plantproducing 750,000 m3/day of coalgas and 413,000 t/y of coke
a. 2 units of coke-making plantproducing 400,000 m3/day of coalgas and 413,000 t/y of coke
b. Coal gas supply to 245,000households and 1,200 commercial/industrial consumers in old QingdaoCity
Average sale volume of712,500 m3/day
b. Coal gas supply to 262,704households with gas purified rate47.84 percent, and 838 commercial/industrial consumers in old QingdaoCity
Average sale volume of261,400 m3/day
c. By-products:- tar- coal ash- benzol- sulfur- anhydrous ammonia
c. By-products:- 15,453 t in the year 2000- 1,608 t in the year 2000- no- no- no
d. Wastewater treatment plant to treatwastewater to meet Class II waterquality standard
d. Wastewater treatment plant withcapacity of 3,360 t/day constructed.Wastewater treated to Class IIIwater quality standard
e. Water saving per year50 m3/hr
e. About 130,000 t/y wastewatertreated to Class III water qualitystandard. So far no water recycled.
f. Air discharge not exceeding SO2
0.5 mg/ m3 or daily average of 0.15mg/m3 or yearly average of 0.06mg/m3
f. Air discharge not exceeding SO2
0.5 mg/m3 or yearly average of0.06 mg/m3
g. Noise level: g. Class III permissible noise level met
h. Eliminate 60 percent of coal used inhouseholds and 35 percent ofcommercial and industrial coal (Total1.3 million t/y)
h. Elimination of 60 percent of coalused in households (0.54 million t)and 35 percent of commercial andindustrial coal (0.38 million t)(Total 0.92 million t/y)
i. Coal savings: 300,000 t/y i. Coal savings: 300,000 t/y
j. Reduce emission of:- SO2 by 40 percent (16,000 t/y)- CO2 by 5 percent (356,000 t/y)- Dust by 25 percent (15,000) t/y)- NOx by 3,800 t/y- CO by 18,000 t/y
j. Reduce emission of- SO2 by 36 percent- Not available- Dust by 6 percent- NOx by 2,116 t/y- CO by 17,036 t/y
41

Appendix 11, page 2
Subproject Target Actual
k. Gas price charged to consumers:- Residential = Y553/1000 m3
- Industrial and public = Y700/1000 m3
- Commercial = Y1300/100 m3
k. Gas price charged to consumers:- Residential = Y750/1000 m3
- Industrial and public =- Y1200/1000 m3
- Commercial = Y1500/1000 m3
l.
m.
n.
o.
l. Connection fee:
Minimum charge:Electricity Y0.2/kWhSteam Y11.0/GJ
Sales volume:
o. Decommissioning of oldgasification plant
l.
m.
n.
o.
Connection fee: Y2,200
Minimum charge: none
Sales Volume: 86.4 million m3 in 2000
Decommissioning of old gasificationplant in October1997
2. Part B: HeatGeneration atQingdao Power Plant
a.
b.
c.
3 x 12 MW back-pressure combinedheat and power turbo-generatorsproducing 36 MW of electricity, 400t/hour of steam and 25 MW ofcondensate for heat.
Part B and C will reduce emission ofSO2 by 18,000 t/y, soot by 13,000 t/yand slag by 71,000 t/y
Net coal savings of about200,000 t/y.
a.
b.
c.
One unit 12 MW combined heat andpower turbo-generator installed andin operation since 1999 producing12 MW of electricity and about 200t/hour of steam and 9 MW ofcondensate for heat. Installation ofsecond 12 MW turbo-generator inprogress. Third unit will only beinstalled when the first two unitscannot meet demand. Steam supplyand heat are dependent on thedemand under Part C.
Not available as only one turbo-generator in operation.
Net coal savings estimated at157,000 t/y.
3. Part C: PipelineNetwork forIndustrial Steamand District Heating– Qingdao Heat andPower Company
a. Provide 7.1 million gigajoules (GJ)steam to 92 percent of industrial/commercial users and districtheating to about 30,000 consumers(about 1.5 million m2 of heatingspace) over a 9 km2 area in Sifang,Taidong, and Shibei District in oldQingdao City
a. Steam and heat equivalent providedto 1.34 million GJ to28 industrial establishments and8 residential blocks with anestimated 25,000 households overa 9.2 km2 area in Sifang, Taidong,and Shibei District in old QingdaoCity. Average steam consumption is200 t/hour.
b. Coal savings of about 200,000 t/y. b. Coal savings of about 180,000 t/y.
c. Removal of about 283 small,inefficient industrial boilers.
c. 240 small and inefficient boilersshut down.
42

Appendix 11, page 3
Subproject Target Actual
d. Establishment of an environmentalprotection unit in QHPC
d. Environmental protection unit with2 staff established within QHPC.
e. Charges:Steam Y19/GJ
e. Charges:Steam Y99.8/t or Y37.1/GJ
4. Part D: Licun RiverWastewaterTreatment Plant –Qingdao CityDrainage Company
a. Two-stage wastewater treatmentplant (activated sludge) on LicunRiver in Cangkou District to treat80,000 m3 per day of wastewater andsewage discharged from factories,commercial buildings,and residential housing coveringa catchment area of 29 km2
(53,000 m3/day industrial wastewaterand 27,000 m3/dayof domestic sewage) equivalentto 14 percent of total industrialwastewater discharged and8 percent of total domestic sewagedischarged.
a. Two stage wastewater treatmentplant with a design capacity of80,000 m3/day constructed and inoperation since 1998. Averagevolume of wastewater treated was45,000 m3/day comprising 18,000m3/day of industrial wastewater and27,000 m3/day of domestic sewageequivalent to about 4 percent oftotal industrial wastewaterdischarged and8 percent of total domestic sewagedischarged.
b.
c.
d.
e.
f.
Sludge produced used foragriculture.
20 percent of energy requirementmet by utilizing sewage gasproduced.
Reduce:- BOD by 13,700 t/y- COD by 36,000 t/y- SS by 34,000 t/y
Water quality after treatment:- BOD 30 mg/l- SS 30 mg/l- COD 150 mg/l
Establishment of environmentalmonitoring division
b.
c.
d.
e.
f.
Sludge produced was initially usedfor landfill with municipal garbage.
Since early 2001, sludge producedhas been further treated to producebiomass gas (sewage gas producedwas between 160 to 340 m3/hour)to supply about20 percent of the energy used bythe plant (boiler fuel and to runturbine blower).
Reduce:- BOD by 11,954 t/y- COD by 31,185 t/y- SS by 22,376 t/y
Water quality after treatment:- BOD 10 mg/l- SS 11.3 mg/l- COD 55 mg/l- NH3N 4.3 mg/lSo far water treated was dischargedinto Jiaozhouwan Bay with norecycling.
Environment monitoring divisionwith 2 staff established.
43

Appendix 11, page 4
Subproject Target Actual
g. Charges for:- Industrial wastewater: Y1.45/ m3
- Commercial wastewater: Y1.79/ m3
- Domestic sewage: Y0.84/ m3
g. Charges for:- Industrial wastewater: Y0.8/m3
- Commercial wastewater: Y0.8/m3
- Domestic sewage: Y0.3/m3
BOD = biological oxygen demand; CO = carbon monoxide; CO2 = carbon dioxide; COD = chemical oxygen demand; GJ = gigajoules;km2 = square kilometers; m2 = square meters; m3 = cubic meters; mg = milligrams; mg/l = milligrams per liter; MW = megawatt;NH3N = ammonia; NOx = nitrogen oxides; SO2 = sulfur dioxide; SS = suspended solid; t/y = tons per year.
Source: Qingdao Municipal Government and Project Implementing Agencies
44

45
Year Ending December 31
INCOME STATEMENT
Sales 105.14 125.40 155.20Less: Sales Tax 0.48 0.75 Cost of Sales 149.59 168.26 177.26 Operating Expenses 18.67 26.65 28.68Operating Income (63.12) (69.98) (51.48)Nonoperating Income/(Expense) 52.37 51.64 66.21Interest Expense 0.31 0.13 13.93Net Income Before Tax (11.06) (18.21) 0.79Net Income After Tax (11.06) (18.21) 0.79
CASH FLOW STATEMENT
Net Income After Tax (11.06) (18.21) 0.79Add: Depreciation 24.72 41.78 46.77 Interest Expense 0.31 0.13 13.93Internal Cash Generation 13.97 23.69 61.49Borrowings 150.51 26.28 374.18Other Local Sources 70.49 21.64 57.80Total Sources of Funds 234.96 71.62 493.46
Capital Expenditures 1,075.07 4.74 36.07Debt Service 0.31 0.52 188.86Changes in Working Capital and Other Assets (858.49) 75.83 255.94Total Application of Funds 216.89 81.08 480.87Changes in Cash 18.08 (9.47) 12.59
BALANCE SHEET
Current Assets 180.29 207.19 395.96 Cash and Deposits 35.04 25.57 38.17 Accounts Rceivables 38.16 b 111.28 b 190.04 b
Inventories and Others 16.81 24.26 29.09 Others 92.86 46.08 92.47Net Fixed Assets 1,126.78 1,069.35 881.44Construction-in-Progress 18.53 42.30 216.14Total Assets 1,325.61 1,318.84 1,493.54
Current Liabilities 37.33 62.31 756.36 Accounts Payable 36.99 49.31 29.37 Current Portion of Long-term Debt 0.34 13.00 726.99Others 962.95 945.59 0.00Long-term Debt 126.80 126.63 286.00Equity 198.52 184.30 451.18Total Liabilities and Equity 1,325.61 1,318.84 1,493.54
Financial Indicators: Debt Service Coverage Ratio (times) 45.21 45.30 0.33 Debt / Debt plus Equity (% Debt) 0.39 0.41 0.39 Receivable Turnover (Months) n.a. n.a. n.a.a Accounts are for the Asian Development Bank-funded Project only.b Includes other receivables.Source: Qingdao Gas Group Company
1998 1999
Appendix 12, page 1
2000
FINANCIAL PERFORMANCE OF SUBPROJECT ENTERPRISESTable A12.1: Financial Performance of Qingdao Gas Group Company a
( in Y million )

46
Year Ending December 31
INCOME STATEMENT
Sales 25.40 38.16Less: Sales Tax 0.10 0.06 Cost of Sales 34.00 42.12Operating Income (8.70) (4.01)Non-Operating Income/(Expense) 0.00 0.00Interest Expense 24.62 29.51Net Income Before Tax (33.32) (33.52)Net Income After Tax (33.32) (33.52)
CASH FLOW STATEMENT
Net Income After Tax (33.32) (33.52)Add: Depreciation 9.28 9.28 Interest Expense 24.62 29.51Internal Cash Generation 0.58 5.26Borrowings 259.98 2.88Other Local SourcesTotal Sources of Funds 260.55 8.14
Capital Expenditures 231.54 2.44Debt Service 27.44 29.51Changes in Working Capital and Other Assets 11.40 (23.88)Total Application of Funds 270.38 8.07Changes in Cash (9.83) 0.08
BALANCE SHEET
Current Assets 39.61 47.56 Cash and Deposits 0.00 0.08 Accounts Rceivables 4.99 18.09 Inventories and Others 0.00 14.37 Others 33.27 15.03Net Fixed Assets 171.97 159.64Construction-in-Progress 43.28 43.55Total Assets 253.51 250.76
Current Liabilities 28.47 7.51 Accounts Payable 28.47 7.51 Current Portion of Long-term Debt 0.00 0.00Others (0.75) 48.02Long-term Debt 261.23 264.18Equity (35.44) (68.96)Total Liabilities and Equity 253.51 250.76
Financial Indicators: Debt Service Coverage Ratio (times) 0.02 0.18 Debt / Debt plus Equity (% Debt) 1.16 1.35 Receivable Comparator (Months) 2.39 5.77a Accounts are for the Asian Development Bank-funded Project only.Source: Qingdao Power Plant
1999 2000
Table A12.2: Financial Performance of Qingdao Power Plant a
Appendix 12, page 2
FINANCIAL PERFORMANCE OF SUBPROJECT ENTERPRISES
( in Y million )

47
Year Ending December 31
INCOME STATEMENT
Sales 2.15 3.67Less: Sales Tax 0.00 0.02 Cost of Sales 1.97 3.45 Operating Expenses 0.17 0.18Operating Income 0.01 0.01Non-Operating Income/(Expense) 0.00 0.00Interest Expense 0.00 0.00Net Income Before Tax 0.01 0.01Net Income After Tax 0.00 0.01
CASH FLOW STATEMENT
Net Income After Tax 0.00 0.01Add: Depreciation 1.23 1.23 Interest Expense 0.00 0.00Internal Cash Generation 1.23 1.24Borrowings 27.37 0.00Equity/Subsidy from the Government 19.89 12.67Total Sources of Funds 48.50 13.90
Capital Expenditures 36.65 9.72Debt Service c 0.00 0.00Changes in Working Capital and Other Assets 14.46 8.01Total Application of Funds 51.11 17.73Changes in Cash (2.61) (3.83)
BALANCE SHEET
Current Assets 35.21 25.54 Cash and Deposits 9.81 5.98 Accounts Rceivables 25.40 b 19.56 b
Inventories and Others 0.00 0.00 Others 12.14Net Fixed Assets 29.91 28.68Construction-in-Progress 139.52 149.24Total Assets 212.06 203.46
Current Liabilities 22.65 8.74 Accounts Payable 22.65 8.74 Current Portion of Long-term Debt 0.00 0.00Others 7.35Long-term Debt 69.01 69.01Equity 113.06 125.72Total Liabilities and Equity 212.06 203.46
Financial Indicators: Debt Service Coverage Ratio (times) c 0.00 0.00 Debt / Debt plus Equity (% Debt) 0.38 0.35 Receivable Turnover (Months) n.a. n.a. a Accounts are for Asian Development Bank-funded Project only.b Includes other receivables.c No allocation yet made by the Qingdao municipal government on principal repayment.Source: Qingdao Heat and Power Company
1999 2000
Table A12.3: Financial Performance of Qingdao Heat & Power Company a
Appendix 12, page 3
FINANCIAL PERFORMANCE OF SUBPROJECT ENTERPRISES
( in Y million )

48
Year Ending December 31
INCOME STATEMENT
Sales 15.92 24.41Less: Sales Tax 0.00 0.00 Cost of Sales 0.00 0.00 Operating Expenses 10.77 12.51Operating Income 5.15 11.90Non-Operating Income/(Expense) 0.00 0.00Interest Expense 6.47 12.21Net Income Before Tax (1.32) (0.31)Net Income After Tax (1.32) (0.31)
CASH FLOW STATEMENT
Net Income After Tax (1.32) (0.31)Add: Depreciation 12.16 13.34 Interest Expense 6.47 12.21Internal Cash Generation 17.31 25.24Borrowings 16.83 20.25Equity/Subsidy from the Government 0.27 0.11Total Sources of Funds 34.40 45.59
Capital Expenditures 28.09 52.45Debt Service 6.47 12.21Changes in Working Capital and Other Assets 6.08 (10.30)Total Application of Funds 40.64 54.36Changes in Cash (6.24) (8.77)
BALANCE SHEET
Current Assets 127.70 9.21 Cash and Deposits 13.58 4.81 Accounts Rceivables 5.33 4.40 Inventories and Others Others 108.79 0.00Net Fixed Assets 243.14 266.77Construction-in-Progress 16.50 31.97Total Assets 387.33 307.95
Current Liabilities 0.98 0.77 Accounts Payable 0.98 0.77 Current Portion of Long-term Debt 0.00 0.00Others 99.53 0.00Long-term Debt 115.03 135.27Equity 171.80 171.91Total Liabilities and Equity 387.33 307.95
Financial Indicators:
Debt Service Coverage Ratio (times) b 2.67 2.07 Debt / Debt plus Equity (% Debt) 0.40 0.44 Receivable Turnover (Months) 4.07 2.19a Accounts are for the Asian Development Bank-funded Project only.b No allocation yet made by the Qingdao municipal government on principal repayment.Source: Qingdao Drainage Company
1999 2000
Table A12.4: Financial Performance of Qingdao Drainage Company a
Appendix 12, page 4
FINANCIAL PERFORMANCE OF SUBPROJECT ENTERPRISES
( in Y million )

Appendix 13, page 1
FINANCIAL EVALUATION
1. The financial internal rate of return (FIRR) was reevaluated on the basis of financial dataand assumptions provided by the four enterprises. Capital costs were based on actualinvestments made for the Qingdao Environment Improvement Project (QEIP). Incrementalrevenues were based on sales of products and services associated with the investments madeunder the QEIP and were assumed to increase from the current production level to full capacityin the next several years. Operation and maintenance costs were based on the actual costspresented in the financial statements adjusted to reflect increases in volume. All revenues andexpenditures were recomputed in year 2000 prices.
2. The FIRRs of the four subprojects were recalculated at 2.5 percent for Part A,4.2 percent for Part B, 3.6 percent for Part C, and 2.7 percent for Part D, compared to FIRRsestimated at appraisal of 12.4 percent, 10.4 percent, 10.5 percent and 6.4 percent, respectively.The much lower FIRRs are mainly due to the lower-than-expected demand for the products andservices, combined with inadequate approved tariffs. The higher actual investment costs(except for Part C which has lower costs due to reduction in project scope), coupled withprolonged project implementation delays, have likewise contributed to the lower FIRRs. Theyare lower than the weighted average cost of capital (WACC) of 3.9 percent for Part A, 0.7percent for Part B, 5.4 percent for Part C, and 5.0 percent for Part D.
3. The estimated WACC in real terms was derived using the actual capital mix. The realinterest costs of loan funds were considered, while the cost of equity was assumed to be12 percent. A foreign exchange rate risk premium of 1.2 percent was assumed based on theforecast behavior between the United States dollar and the local currency. Income tax wasassumed at 33 percent and domestic inflation at an average of 3.8 percent per annum. Thehigher WACC calculated at appraisal was primarily due to the much higher foreign exchangerate risk premium of 12.0 percent assumed then.
49
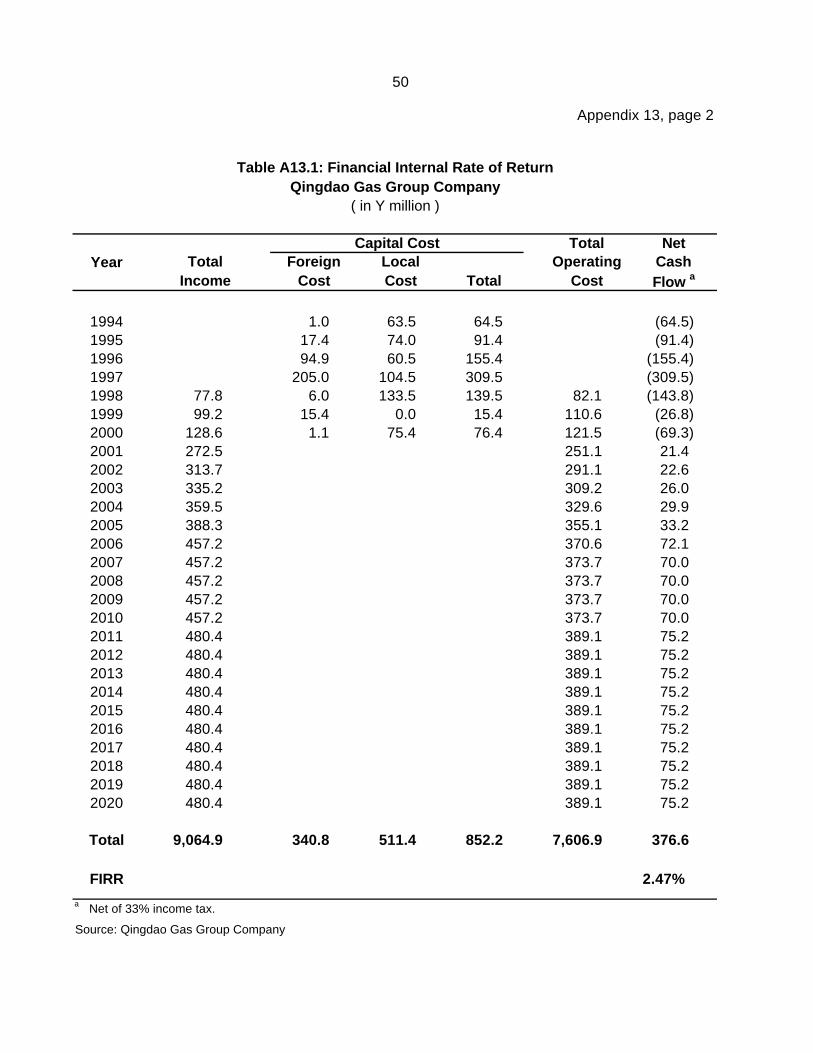
Year
1994 1.0 63.5 64.5 (64.5)1995 17.4 74.0 91.4 (91.4)1996 94.9 60.5 155.4 (155.4)1997 205.0 104.5 309.5 (309.5)1998 77.8 6.0 133.5 139.5 82.1 (143.8)1999 99.2 15.4 0.0 15.4 110.6 (26.8)2000 128.6 1.1 75.4 76.4 121.5 (69.3)2001 272.5 251.1 21.42002 313.7 291.1 22.62003 335.2 309.2 26.02004 359.5 329.6 29.92005 388.3 355.1 33.22006 457.2 370.6 72.12007 457.2 373.7 70.02008 457.2 373.7 70.02009 457.2 373.7 70.02010 457.2 373.7 70.02011 480.4 389.1 75.22012 480.4 389.1 75.22013 480.4 389.1 75.22014 480.4 389.1 75.22015 480.4 389.1 75.22016 480.4 389.1 75.22017 480.4 389.1 75.22018 480.4 389.1 75.22019 480.4 389.1 75.22020 480.4 389.1 75.2
Total 9,064.9 340.8 511.4 852.2 7,606.9 376.6
FIRR 2.47%
a Net of 33% income tax.
Source: Qingdao Gas Group Company
Appendix 13, page 2
Qingdao Gas Group CompanyTable A13.1: Financial Internal Rate of Return
Capital CostForeignTotal Local
CostCost Total Income
( in Y million )
TotalOperating
Cost
NetCashFlow a
50
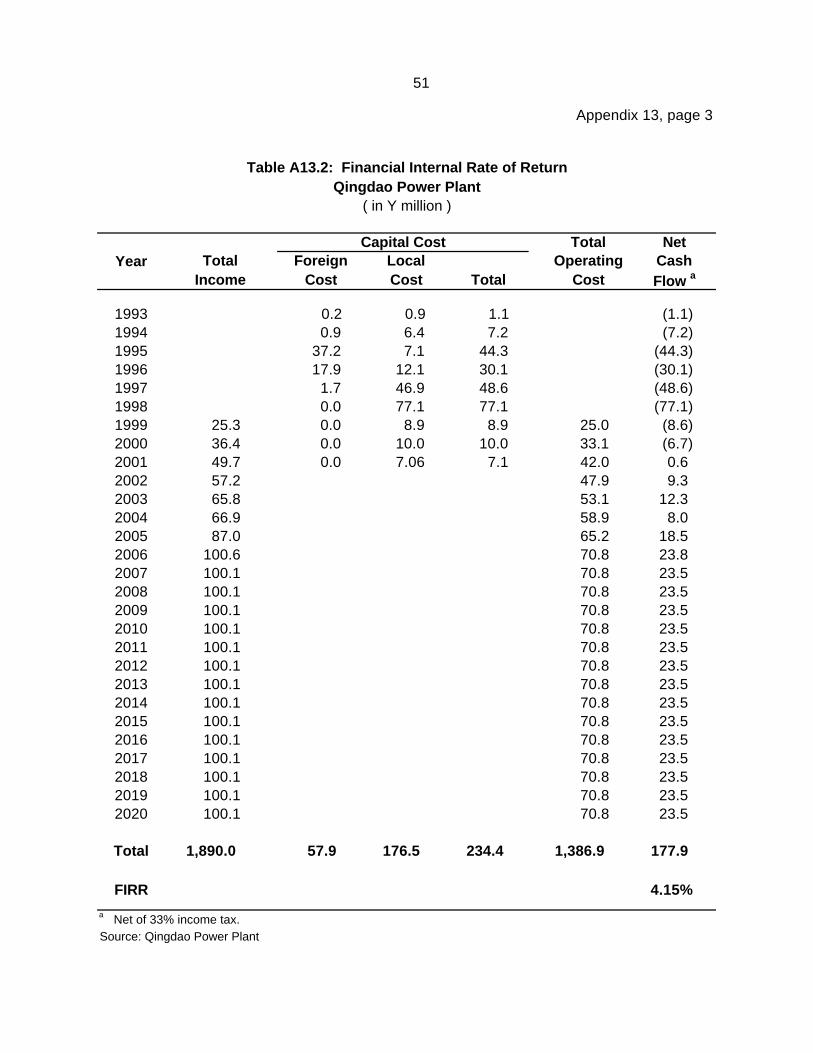
Year
1993 0.2 0.9 1.1 (1.1)1994 0.9 6.4 7.2 (7.2)1995 37.2 7.1 44.3 (44.3)1996 17.9 12.1 30.1 (30.1)1997 1.7 46.9 48.6 (48.6)1998 0.0 77.1 77.1 (77.1)1999 25.3 0.0 8.9 8.9 25.0 (8.6)2000 36.4 0.0 10.0 10.0 33.1 (6.7)2001 49.7 0.0 7.06 7.1 42.0 0.62002 57.2 47.9 9.32003 65.8 53.1 12.32004 66.9 58.9 8.02005 87.0 65.2 18.52006 100.6 70.8 23.82007 100.1 70.8 23.52008 100.1 70.8 23.52009 100.1 70.8 23.52010 100.1 70.8 23.52011 100.1 70.8 23.52012 100.1 70.8 23.52013 100.1 70.8 23.52014 100.1 70.8 23.52015 100.1 70.8 23.52016 100.1 70.8 23.52017 100.1 70.8 23.52018 100.1 70.8 23.52019 100.1 70.8 23.52020 100.1 70.8 23.5
Total 1,890.0 57.9 176.5 234.4 1,386.9 177.9
FIRR 4.15%
a Net of 33% income tax.Source: Qingdao Power Plant
Foreign
Appendix 13, page 3
Table A13.2: Financial Internal Rate of Return
NetCashTotal
Qingdao Power Plant( in Y million )
Income Flow a
Capital CostLocalCost Total
TotalOperating
CostCost
51

Year
1993 0.0 0.8 0.8 (0.8)1994 1.6 9.5 11.1 (11.1)1995 9.5 22.7 32.2 (32.2)1996 3.8 23.7 27.5 (27.5)1997 1.4 10.6 12.0 (12.0)1998 23.9 30.2 54.0 (54.0)1999 21.4 20.9 16.9 37.8 18.2 (34.6)2000 36.4 2.6 10.0 12.6 27.4 (3.6)2001 53.0 43.8 9.22002 58.3 48.8 9.52003 64.1 54.1 9.82004 71.4 60.1 10.72005 78.0 66.6 10.72006 86.2 70.1 15.72007 86.2 70.1 15.72008 86.2 70.1 15.72009 86.2 70.1 15.72010 86.2 70.1 15.72011 86.2 70.1 15.72012 86.2 70.1 15.72013 86.2 70.1 15.72014 86.2 70.1 15.72015 86.2 70.1 15.72016 86.2 70.1 15.72017 86.2 70.1 15.72018 86.2 70.1 15.72019 86.2 70.1 15.72020 86.2 70.1 15.7
Total 1,675.7 63.7 124.3 188.0 1,370.5 109.6
FIRR 3.59%a Net of 33% income tax.
Source: Qingdao Heat and Power Company
Table A13.3: Financial Internal Rate of Return
Appendix 13, page 4
Total
Qingdao Heat and Power Company( in Y million )
Income
Capital Cost
TotalLocalCost
ForeignCost
TotalFlow aCost
NetCashOperating
52

Year
1994 1.1 15.0 16.0 (16.0)1995 0.7 17.5 18.2 (18.2)1996 14.7 34.0 48.6 (48.6)1997 59.0 40.0 99.1 (99.1)1998 0.0 35.8 35.8 (35.8)1999 17.3 16.5 13.8 30.3 10.8 (23.8)2000 25.2 4.0 11.5 15.5 12.5 (2.8)2001 26.3 13.0 13.22002 26.3 13.0 13.22003 26.3 13.0 13.22004 26.3 13.0 13.22005 26.3 13.0 13.22006 35.0 13.0 19.12007 35.0 13.0 19.12008 35.0 13.0 19.12009 35.0 13.0 19.12010 35.0 13.0 19.12011 35.0 13.0 19.12012 35.0 13.0 19.12013 35.0 13.0 19.12014 35.0 13.0 19.12015 35.0 13.0 19.12016 35.0 13.0 19.12017 35.0 13.0 19.12018 35.0 13.0 19.12019 35.0 13.0 19.12020 35.0 13.0 19.1
Total 698.9 96.0 167.6 263.6 283.3 108.2
FIRR 2.67%a Net of 33% income tax.Source: Qingdao Drainage Company
Appendix 13, page 5
Table A13.4: Financial Internal Rate of Return
Total Operating
Capital CostTotal
Qingdao Drainage Company( in Y million )
Cost
NetCashFlow aIncome
ForeignCost Total
LocalCost
53

Appendix 14, page 1
ECONOMIC EVALUATION
1. The economic evaluation of the Qingdao Environmental Improvement Project (QEIP)was carried out following the same methodology that was used in the appraisal. Incrementalcosts and benefits were determined for each subproject to determine the net benefit stream.The economic life of the QEIP is assumed to be 20 years after full operation. All prices andcosts are expressed in year 2000 values.
2. The economic capital costs of the subprojects were derived from the actual financial costcomponents of the QEIP, and converted to their economic values by applying the conversionfactors1 commonly used for projects in People's Republic of China. For tradable items, the costswere translated into their border prices by using international market prices plus transport andhandling costs from the port to the project site. Taxes, import duties and all financial charges,including interest during construction have been excluded. The economic benefits were valuedin terms of (i) coal savings, which were derived by deducting the coal now consumed by theQEIP in the production of gas or steam from the total coal consumed before the QEIP andapplying the economic prices of coal; (ii) reduction in transportation cost achieved by avoidinglong distance and in-city transport and handling charges; and (iii) local environmental benefits.
3. The economic internal rate of return (EIRR) is recalculated at 7.7 percent for part A, and19.7 percent for parts B and C combined. As at appraisal, no EIRR was calculated for part D.The respective EIRRs estimated at appraisal were 12.7 percent for part A and 34.1 percent forcombined parts B and C. The low EIRRs are primarily due to higher investment costs coupledwith implementation delays, higher input costs, and reduced benefits as a result of lowerproduction.
1 The conversion factors used in this evaluation are 0.94 for civil works, 2.00 for skilled labor, 0.67 for unskilled labor,
and 0.95 for others.
54

55
Year
1994 60.2 (60.2)1995 85.3 (85.3)1996 145.7 (145.7)1997 295.9 (295.9)1998 59.0 137.1 45.9 (124.1)1999 71.2 14.8 41.4 15.12000 85.0 71.3 74.4 (60.8)2001 191.4 103.8 87.52002 215.2 115.7 99.62003 216.8 121.0 95.82004 216.8 126.3 90.52005 216.8 132.8 84.02006 241.3 136.8 104.52007 241.3 140.8 100.42008 241.3 140.8 100.42009 241.3 140.8 100.42010 241.3 140.8 100.42011 241.3 140.8 100.42012 241.3 140.8 100.42013 241.3 140.8 100.42014 241.3 140.8 100.42015 241.3 140.8 100.42016 241.3 140.8 100.42017 241.3 140.8 100.42018 241.3 140.8 100.42019 241.3 140.8 100.42020 241.3 140.8 100.4
TOTAL 4,890.9 810.3 2,869.7 1,210.9
EIRR 7.74%
Appendix 14, page 2
(in Y million)
Table 14.1: Economic Internal Rate of ReturnQingdao Gas Group Company
Incremental Benefit Capital Cost Net Benefit
Incremental Cost

56
Year
1993 1.8 (1.8)1994 22.0 (22.0)1995 61.6 (61.6)1996 77.2 (77.2)1997 144.7 (144.7)1998 111.8 (111.8)1999 28.3 37.7 5.0 (14.4)2000 36.7 24.7 5.9 6.02001 145.6 35.8 14.2 95.62002 169.5 11.6 157.92003 179.6 11.3 168.42004 184.1 11.7 172.42005 192.1 13.3 178.92006 199.2 16.1 183.22007 199.2 16.1 183.22008 199.2 16.1 183.22009 199.2 16.1 183.22010 199.2 16.1 183.22011 199.2 16.1 183.22012 199.2 16.1 183.22013 199.2 16.1 183.22014 199.2 16.1 183.22015 199.2 16.1 183.22016 199.2 16.1 183.22017 199.2 16.1 183.22018 199.2 16.1 183.22019 199.2 16.1 183.22020 199.2 16.1 183.2
TOTAL 3,924.5 517.3 314.2 3,093.0
EIRR 19.66%
Qingdao Power Plant and Heating ProjectsTable A14.2: Economic Internal Rate of Return
(in Y million)
Appendix 14, page 3
Incremental Benefit Capital Cost
Incremental Cost Net Benefit

Appendix 15, page 1
PROJECT PERFORMANCE RATING ASSESSMENT
Results/Remarks
A. Relevance
Relevance of project preparation to project output at the time ofapproval
No
Relevance of project output to achieve project goals and purposesat the time of approval Yes
Priority of the Project in the context of the development strategy atthe time of approval
Yes
Priority of the Project in the context of the development strategy ofAsian Development Bank (ADB) for the country at the time ofapproval
Yes
Priority of the Project in the context of the country’s developmentstrategy at the time of evaluation Yes
Priority of the Project in the context of one or more of ADB’sstrategic objectives at the time of evaluation Yes
Appropriate changes made at the midterm review and otherreviews to make the Project more relevant Yes
Percentage of subcriteria that met assessment 85Evaluation rating 2
B. Efficacy
Achievement of most project physical outcomes NoAchievement of most project intangible outcomes (e.g., technical
assistance) YesThe likelihood of project outcomes leading to project goals Yes
Percentage of subcriteria that met assessment 66Evaluation Rating 2
C. Efficiency
Manner of ADB’s internal processing of the Project YesOrganization and management of executing agency and
implementing agencies YesEffectiveness of project management NoEfficiency in recruitment of consultants and other procurement YesTimely and adequate availability of counterpart funding Yes
Percentage of subcriteria that met assessment 80Evaluation rating 2
57

Appendix 15, page 2
Results/Remarks
D. Sustainability
Availability of adequate and effective demand for project servicesand products
No
Probable operating and financial performance of the operationalentity and ability to recover costs No
Probability of the existence of appropriate maintenance policy andprocedures Yes
Probability of fund availability (cash flow) for continued operations,maintenance, and growth requirements
No
Probable availability of skills to continue project availability YesProbable availability of appropriate technology and equipment to
operate the Project YesProbable availability of the enabling environment (subsidies, tariffs,
prices, competitiveness, and political developments) in whichProject is operating at the time of evaluation Yes
Government ownership and commitment to the Project YesThe extent to which the operation affects the environment and the
renewable or nonrenewable resources YesThe extent to which community participation and beneficiary
incentives are adequate to maintain the Project benefits No
Percentage of subcriteria that met assessment 70Evaluation rating 2
E. Institutional Development and Other Impacts
Country formal laws, regulation, and procedures YesThe people’s informal norms and practices NoInstitutional or organizational strengthening YesInstitutional skill levels and capacities YesParticipatory attitudes of the society YesMacroeconomic or sector policy framework NoImpacts on poverty NoImpacts on environment YesImpacts on social organization NoImpacts on political developments No
Percentage of subcriteria that met assessment 40Evaluation Rating 1
58

Appendix 15, page 3
Table A12: Assessment of Project Overall Performance
Criteria Weights (%)Assessment
RatingWeighted
Rating
Relevance 20 2 0.40Efficacy 20 2 0.50Efficiency 20 2 0.40Sustainability 20 2 0.40Institutional and Other Development Impacts 15 1 0.15
Overall Rating 1.85 (Successful)
59