Embed Size (px)
Citation preview
ASIA-PACIFIC PRIVATE EQUITY REPORT 2016By Suvir Varma, Madhur Singhal and Johanne Dessard
Repeatable Models® is a registered trademark of Bain & Company, Inc. Copyright © 2016 Bain & Company, Inc. All rights reserved.
About Bain & Company’s Private Equity business
Bain & Company is the leading consulting partner to the private equity (PE) industry and its stakeholders. PE
consulting at Bain has grown fi vefold over the past 15 years and now represents about one-quarter of the fi rm’s
global business. We maintain a global network of more than 1,000 experienced professionals serving PE clients.
Our practice is more than triple the size of the next-largest consulting fi rm serving PE fi rms.
Bain’s work with PE fi rms spans fund types, including buyout, infrastructure, real estate and debt. We also work
with hedge funds, as well as many of the most prominent institutional investors, including sovereign wealth funds,
pension funds, endowments and family investment offi ces. We support our clients across a broad range of objectives:
• Deal generation: We help develop differentiated investment theses and enhance deal fl ow by profi ling industries,
screening companies and devising a plan to approach targets.
• Due diligence: We help support better deal decisions by performing due diligence, assessing performance
improvement opportunities and providing a post-acquisition agenda.
• Immediate post-acquisition: We support the pursuit of rapid returns by developing a strategic blueprint
for the acquired company, leading workshops that align management with strategic priorities and directing
focused initiatives.
• Ongoing value addition: We help increase company value by supporting revenue enhancement and cost
reduction and by refreshing strategy.
• Exit: We help ensure funds maximize returns by identifying the optimal exit strategy, preparing the selling
documents and prequalifying buyers.
• Firm strategy and operations: We help PE fi rms develop their own strategy for continued excellence, by devising
differentiated strategies, maximizing investment capabilities, developing sector specialization and intelligence,
enhancing fund-raising, improving organizational design and decision making, and enlisting top talent.
• Institutional investor strategy: We help institutional investors develop best-in-class investment programs across
asset classes, including PE, infrastructure and real estate. Topics we address cover asset-class allocation,
portfolio construction and manager selection, governance and risk management, and organizational design
and decision making. We also help institutional investors expand their participation in PE, including through
coinvestment and direct investing opportunities.
Asia-Pacifi c Private Equity Report 2016 | Bain & Company, Inc.
Page i
Contents
1. Asia-Pacifi c private equity: Record results, gathering clouds . . . . . . . . . . . . pg. 1
2. What happened in 2015? . . . . . . . . . . . . . . . . . . . . . . . . . . . . . . . . . . . . pg. 4
Investments: A year for the record books . . . . . . . . . . . . . . . . . . . . . . . . . pg. 4
Exits: Down but still healthy . . . . . . . . . . . . . . . . . . . . . . . . . . . . . . . . . . pg. 8
Returns: Sustained momentum—for now . . . . . . . . . . . . . . . . . . . . . . . . . pg. 10
Fund-raising: Winner take all . . . . . . . . . . . . . . . . . . . . . . . . . . . . . . . . pg. 11
3. Searching for opportunity amid a new normal . . . . . . . . . . . . . . . . . . . . pg. 14
The situation in China . . . . . . . . . . . . . . . . . . . . . . . . . . . . . . . . . . . . . pg. 14
Asset class and geographic diversifi cation gain steam . . . . . . . . . . . . . . . pg. 16
Coinvesting with limited partners . . . . . . . . . . . . . . . . . . . . . . . . . . . . . . pg. 18
The need to exert control . . . . . . . . . . . . . . . . . . . . . . . . . . . . . . . . . . . pg. 19
Sector opportunities amid macro changes . . . . . . . . . . . . . . . . . . . . . . . pg. 20
Diverse markets, different outlooks . . . . . . . . . . . . . . . . . . . . . . . . . . . . . pg. 24
4. Thriving in turbulence and uncertainty . . . . . . . . . . . . . . . . . . . . . . . . . . pg. 25
Creating a stormproof portfolio . . . . . . . . . . . . . . . . . . . . . . . . . . . . . . . pg. 26
Sourcing from a position of strength . . . . . . . . . . . . . . . . . . . . . . . . . . . . pg. 27
Building a battle-ready organization . . . . . . . . . . . . . . . . . . . . . . . . . . . pg. 29
5. Are your value-creation capabilities tuned for a new normal? . . . . . . . . . . pg. 30

Asia-Pacifi c Private Equity Report 2016 | Bain & Company, Inc.
Page ii
Asia-Pacifi c Private Equity Report 2016 | Bain & Company, Inc.
Page 1
1. Asia-Pacifi c private equity: Record results, gathering cloudsLooking back over the past year, it’s hard to imagine a more perplexing global economic landscape. Oil prices
unexpectedly plunged to record lows, global economic expansion slowed, currencies fl uctuated wildly—and then
there was China. As the growth rate of the world’s second-largest economy fell amid continued export weakness,
a staggering $5.1 trillion in wealth evaporated on the Shanghai Stock Exchange between mid-June and the end of August
2015, resulting in deep economic uncertainty about future GDP growth across the Asia-Pacifi c region and beyond.
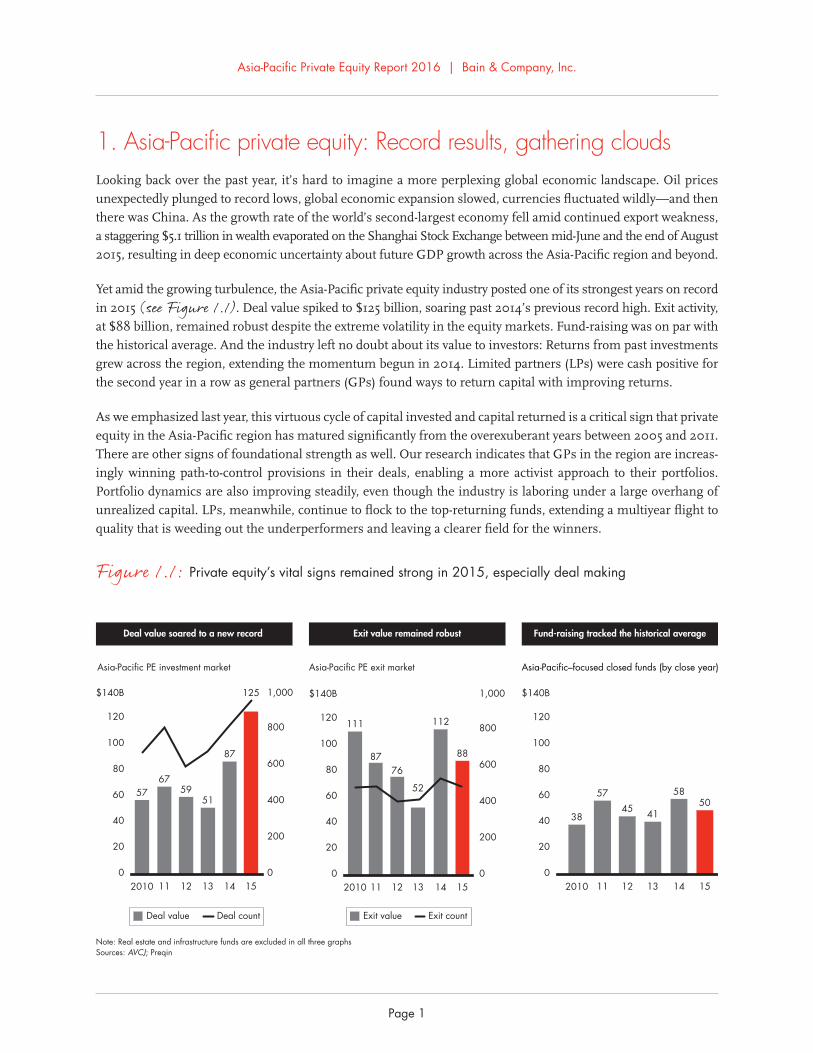
Yet amid the growing turbulence, the Asia-Pacifi c private equity industry posted one of its strongest years on record
in 2015 (see Figure 1.1). Deal value spiked to $125 billion, soaring past 2014’s previous record high. Exit activity,
at $88 billion, remained robust despite the extreme volatility in the equity markets. Fund-raising was on par with
the historical average. And the industry left no doubt about its value to investors: Returns from past investments
grew across the region, extending the momentum begun in 2014. Limited partners (LPs) were cash positive for
the second year in a row as general partners (GPs) found ways to return capital with improving returns.
As we emphasized last year, this virtuous cycle of capital invested and capital returned is a critical sign that private
equity in the Asia-Pacifi c region has matured signifi cantly from the overexuberant years between 2005 and 2011.
There are other signs of foundational strength as well. Our research indicates that GPs in the region are increas-
ingly winning path-to-control provisions in their deals, enabling a more activist approach to their portfolios.
Portfolio dynamics are also improving steadily, even though the industry is laboring under a large overhang of
unrealized capital. LPs, meanwhile, continue to fl ock to the top-returning funds, extending a multiyear fl ight to
quality that is weeding out the underperformers and leaving a clearer fi eld for the winners.
Figure 1.1: Private equity’s vital signs remained strong in 2015, especially deal making
0
20
40
60
80
100
120
$140B
0
200
400
600
800
1,000
57
11
67
12
59
13
51
14
87
15
Asia-Pacific PE investment market
2010
125
0
20
40
60
80
100
120
$140B
0
200
400
600
800
1,000
11
87
12
76
13
52
14
112
15
88
Asia-Pacific PE exit market
2010
111
0
20
40
60
80
100
120
$140B
2010
38
11
57
12
45
13
41
14
58
15
50
Asia-Pacific–focused closed funds (by close year)
Deal value soared to a new record Exit value remained robust Fund-raising tracked the historical average
Note: Real estate and infrastructure funds are excluded in all three graphsSources: AVCJ; Preqin
Deal value Deal count Exit value Exit count
Asia-Pacifi c Private Equity Report 2016 | Bain & Company, Inc.
Page 2
All of this adds up to a much stronger, more resilient industry. But the obvious question is whether the momen-
tum of the past two years can continue. As the macro story deteriorates, the industry is wading into unfamiliar
territory—namely, a slower growth environment where it will be much more diffi cult to fi nd good companies,
improve their performance and exit them with market-beating returns. Even a more resilient industry may have
trouble grappling with the serious challenges ahead.
For now, PE funds continue to fi nd deals. As equity markets fell in 2015, investors saw massive opportunities in
public-to-private transactions such as the China Renaissance–led $7.1 billion buyout of Qihoo 360 Technology.
Sovereign wealth funds (SWFs) and other large institutional investors have also remained active in the Asia-Pacifi c
region, giving resourceful GPs the opportunity to participate in a series of megadeals that might not have been
available otherwise. At the same time, more company owners, looking to fund growth or to retire, are warming to the
PE value proposition, which is increasing the pool of potential investments. And while many traditional industries
have languished, the Internet sector has bucked the downturn and continues to present attractive growth prospects.
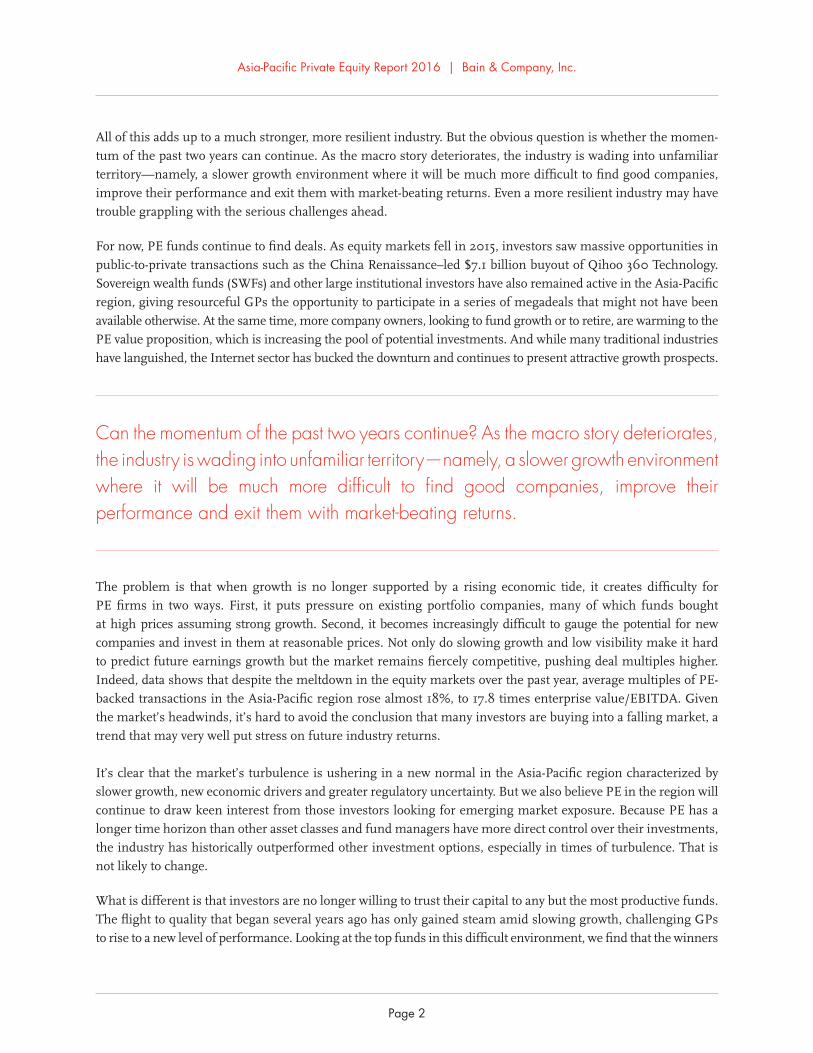
Can the momentum of the past two years continue? As the macro story deteriorates, the industry is wading into unfamiliar territory—namely, a slower growth environment where it will be much more diffi cult to fi nd good companies, improve their performance and exit them with market-beating returns.
The problem is that when growth is no longer supported by a rising economic tide, it creates diffi culty for
PE fi rms in two ways. First, it puts pressure on existing portfolio companies, many of which funds bought
at high prices assuming strong growth. Second, it becomes increasingly diffi cult to gauge the potential for new
companies and invest in them at reasonable prices. Not only do slowing growth and low visibility make it hard
to predict future earnings growth but the market remains fi ercely competitive, pushing deal multiples higher.
Indeed, data shows that despite the meltdown in the equity markets over the past year, average multiples of PE-
backed transactions in the Asia-Pacifi c region rose almost 18%, to 17.8 times enterprise value/EBITDA. Given
the market’s headwinds, it’s hard to avoid the conclusion that many investors are buying into a falling market, a
trend that may very well put stress on future industry returns.
It’s clear that the market’s turbulence is ushering in a new normal in the Asia-Pacifi c region characterized by
slower growth, new economic drivers and greater regulatory uncertainty. But we also believe PE in the region will
continue to draw keen interest from those investors looking for emerging market exposure. Because PE has a
longer time horizon than other asset classes and fund managers have more direct control over their investments,
the industry has historically outperformed other investment options, especially in times of turbulence. That is
not likely to change.
What is different is that investors are no longer willing to trust their capital to any but the most productive funds.
The fl ight to quality that began several years ago has only gained steam amid slowing growth, challenging GPs
to rise to a new level of performance. Looking at the top funds in this diffi cult environment, we fi nd that the winners
Asia-Pacifi c Private Equity Report 2016 | Bain & Company, Inc.
Page 3
share three broad characteristics:
• They have stormproofed their portfolios by dialing up their focus on portfolio activism, investing heavily in
the people and capabilities needed to maximize the value of their highest-potential companies and generate
the most compelling growth stories upon exit.
• They are sourcing from a position of strength by targeting the most resilient sectors, sharpening due diligence
to gain the clearest downside perspectives, and devising early, robust strategies for margin improvement,
incremental revenue growth and exit planning.
• They are reorganizing internally to devote more talent and resources to fi xing companies—in many cases,
shoring up turnaround and margin improvement skills. They are also adding depth to investment committee
processes by including specialists and others in the portfolio review process while creating stringent guide-
lines to focus resources where they matter most.
We’ve devoted Section 3 of this report to an examination of some of the key trends that will shape the Asia-Pacifi c
PE landscape in the coming year and beyond. In Section 4, we dig into how the most successful PE fi rms are
investing in the talent, resources and capabilities that will ensure they are ready to thrive amid today’s new normal.
More than ever, that means sharpening execution at every phase of the game—fi nding value at entry, adding
value during hold and ensuring a growth story at exit. The Asia-Pacifi c PE market is still ripe with opportunity.
But the winners will be those that take nothing for granted.
Asia-Pacifi c Private Equity Report 2016 | Bain & Company, Inc.
Page 4
2. What happened in 2015?Despite the macroeconomic uncertainty that began roiling the equity markets by midyear, 2015 in the Asia-Pacifi c
PE industry was all about building on the momentum that began in 2014—a year when deal value hit an all-time high,
exits broke out of a dispiriting three-year slump and fund-raising regained steam after two years in decline. Flush
with both capital and confi dence in 2015, GPs were eager to do deals and found ways to sustain a high level of
activity throughout the year even as the broader outlook in China deteriorated. Here is how the year unfolded.
Investments: A year for the record books
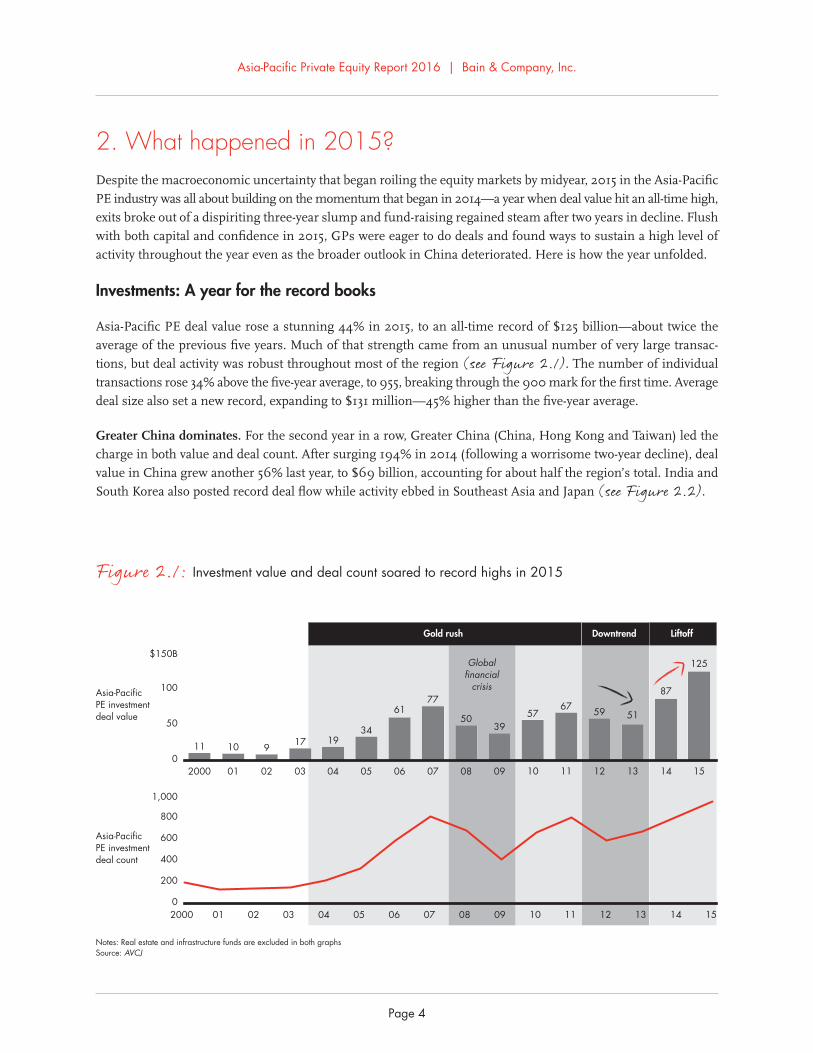
Asia-Pacifi c PE deal value rose a stunning 44% in 2015, to an all-time record of $125 billion—about twice the
average of the previous fi ve years. Much of that strength came from an unusual number of very large transac-
tions, but deal activity was robust throughout most of the region (see Figure 2.1). The number of individual
transactions rose 34% above the fi ve-year average, to 955, breaking through the 900 mark for the fi rst time. Average
deal size also set a new record, expanding to $131 million—45% higher than the fi ve-year average.
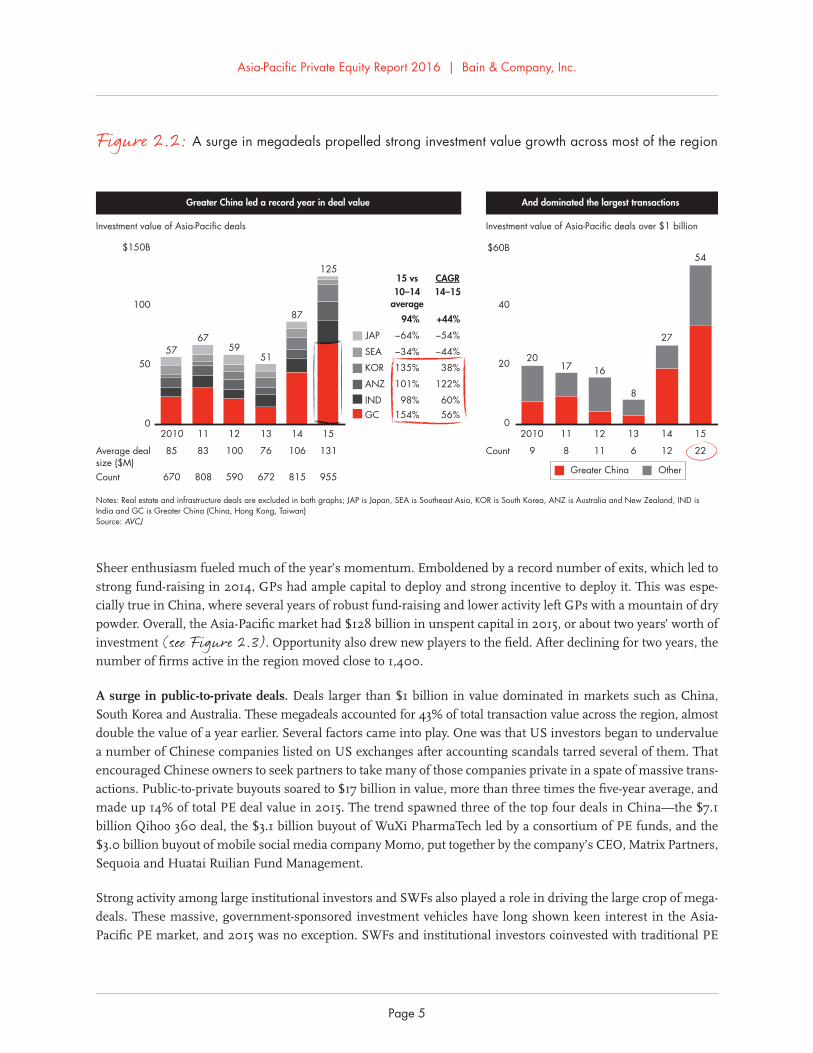
Greater China dominates. For the second year in a row, Greater China (China, Hong Kong and Taiwan) led the
charge in both value and deal count. After surging 194% in 2014 (following a worrisome two-year decline), deal
value in China grew another 56% last year, to $69 billion, accounting for about half the region’s total. India and
South Korea also posted record deal fl ow while activity ebbed in Southeast Asia and Japan (see Figure 2.2).
Figure 2.1: Investment value and deal count soared to record highs in 2015
Notes: Real estate and infrastructure funds are excluded in both graphsSource: AVCJ
0
50
100
$150B
2000
11
01
10
02
9
03
17
04
19
05
34
06
61
07
77
08
50
09
39
10
57
11
67
12
59
13
51
14
87
15
125
0
200
400
600
800
1,000
2000 01 02 03 04 05 06 07 08 09 10 11 12 13 14 15
Asia-Pacific PE investmentdeal value
Asia-Pacific PE investmentdeal count
Gold rush Downtrend
Globalfinancial
crisis
Liftoff
Asia-Pacifi c Private Equity Report 2016 | Bain & Company, Inc.
Page 5
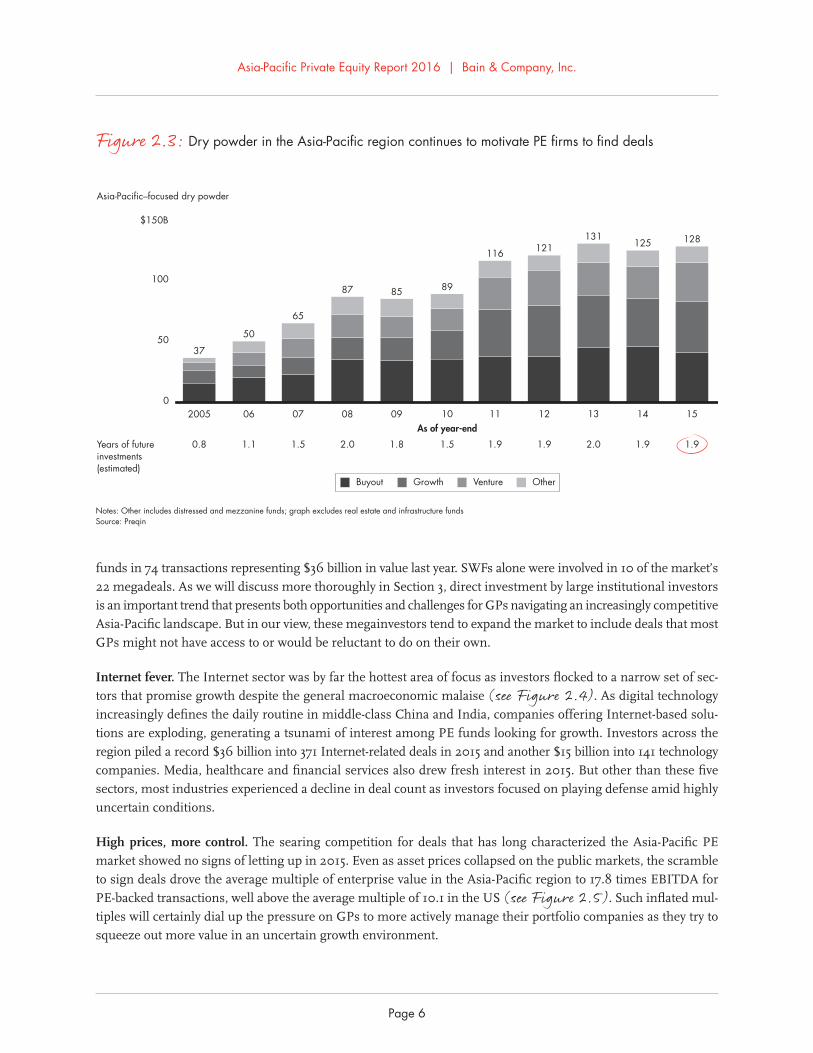
Sheer enthusiasm fueled much of the year’s momentum. Emboldened by a record number of exits, which led to
strong fund-raising in 2014, GPs had ample capital to deploy and strong incentive to deploy it. This was espe-
cially true in China, where several years of robust fund-raising and lower activity left GPs with a mountain of dry
powder. Overall, the Asia-Pacifi c market had $128 billion in unspent capital in 2015, or about two years’ worth of
investment (see Figure 2.3). Opportunity also drew new players to the fi eld. After declining for two years, the
number of fi rms active in the region moved close to 1,400.
A surge in public-to-private deals. Deals larger than $1 billion in value dominated in markets such as China,
South Korea and Australia. These megadeals accounted for 43% of total transaction value across the region, almost
double the value of a year earlier. Several factors came into play. One was that US investors began to undervalue
a number of Chinese companies listed on US exchanges after accounting scandals tarred several of them. That
encouraged Chinese owners to seek partners to take many of those companies private in a spate of massive trans-
actions. Public-to-private buyouts soared to $17 billion in value, more than three times the fi ve-year average, and
made up 14% of total PE deal value in 2015. The trend spawned three of the top four deals in China—the $7.1
billion Qihoo 360 deal, the $3.1 billion buyout of WuXi PharmaTech led by a consortium of PE funds, and the
$3.0 billion buyout of mobile social media company Momo, put together by the company’s CEO, Matrix Partners,
Sequoia and Huatai Ruilian Fund Management.
Strong activity among large institutional investors and SWFs also played a role in driving the large crop of mega-
deals. These massive, government-sponsored investment vehicles have long shown keen interest in the Asia-
Pacifi c PE market, and 2015 was no exception. SWFs and institutional investors coinvested with traditional PE
Figure 2.2: A surge in megadeals propelled strong investment value growth across most of the region
Greater China led a record year in deal value And dominated the largest transactions
Investment value of Asia-Pacific deals
2010
57
11
67
12
59
13
51
14
87
15
125
85 83 100 76 106 131
670 808 590 672 815 955Count
0
50
100
$150B
Average dealsize ($M)
2010
20
11
17
12
16
13
8
14
27
15
54
9 8 11 6 12 22
0
20
40
$60B
Count
Investment value of Asia-Pacific deals over $1 billion
ANZ
KOR
SEA
JAP
IND
15 vs CAGR10–14
average14–15
GC
−34%
135%
101%
94%
−64%
98%154%
−54%
−44%
+44%
38%
122%
60%56%
Greater China Other
Notes: Real estate and infrastructure deals are excluded in both graphs; JAP is Japan, SEA is Southeast Asia, KOR is South Korea, ANZ is Australia and New Zealand, IND is India and GC is Greater China (China, Hong Kong, Taiwan)Source: AVCJ
Asia-Pacifi c Private Equity Report 2016 | Bain & Company, Inc.
Page 6
funds in 74 transactions representing $36 billion in value last year. SWFs alone were involved in 10 of the market’s
22 megadeals. As we will discuss more thoroughly in Section 3, direct investment by large institutional investors
is an important trend that presents both opportunities and challenges for GPs navigating an increasingly competitive
Asia-Pacifi c landscape. But in our view, these megainvestors tend to expand the market to include deals that most
GPs might not have access to or would be reluctant to do on their own.
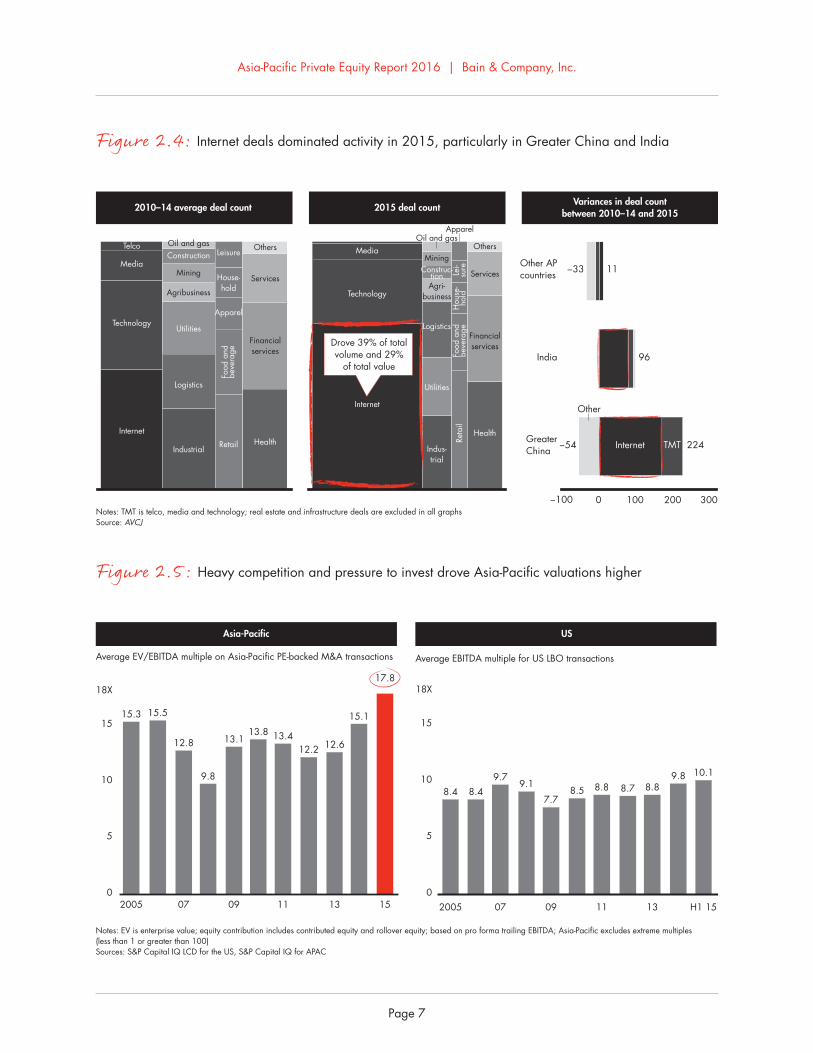
Internet fever. The Internet sector was by far the hottest area of focus as investors fl ocked to a narrow set of sec-
tors that promise growth despite the general macroeconomic malaise (see Figure 2.4). As digital technology
increasingly defi nes the daily routine in middle-class China and India, companies offering Internet-based solu-
tions are exploding, generating a tsunami of interest among PE funds looking for growth. Investors across the
region piled a record $36 billion into 371 Internet-related deals in 2015 and another $15 billion into 141 technology
companies. Media, healthcare and fi nancial services also drew fresh interest in 2015. But other than these fi ve
sectors, most industries experienced a decline in deal count as investors focused on playing defense amid highly
uncertain conditions.
High prices, more control. The searing competition for deals that has long characterized the Asia-Pacifi c PE
market showed no signs of letting up in 2015. Even as asset prices collapsed on the public markets, the scramble
to sign deals drove the average multiple of enterprise value in the Asia-Pacifi c region to 17.8 times EBITDA for
PE-backed transactions, well above the average multiple of 10.1 in the US (see Figure 2.5). Such infl ated mul-
tiples will certainly dial up the pressure on GPs to more actively manage their portfolio companies as they try to
squeeze out more value in an uncertain growth environment.
Figure 2.3: Dry powder in the Asia-Pacifi c region continues to motivate PE fi rms to fi nd deals
Asia-Pacific–focused dry powder
2005
37
06
50
07
65
08
87
09
85
10
89
11
116
12
121
13
131
14
125
15
128
1.9 2.0 1.9 1.90.8 1.1 1.5 2.0 1.8 1.5 1.9
0
50
100
$150B
Years of futureinvestments(estimated)
As of year-end
Buyout Growth Venture Other
Notes: Other includes distressed and mezzanine funds; graph excludes real estate and infrastructure fundsSource: Preqin
Asia-Pacifi c Private Equity Report 2016 | Bain & Company, Inc.
Page 7
Figure 2.4: Internet deals dominated activity in 2015, particularly in Greater China and India
2010–14 average deal count 2015 deal countVariances in deal count
between 2010–14 and 2015
Utilities
Mining
Logistics
Construc-tion
Apparel
Hou
se-
hold
Food
and
beve
rage
Reta
ilLe
i-su
re
Financialservices
Health
Services
Others
Indus-trial
Internet
Technology
Telco
Media
Internet
Technology
Media
Industrial
Utilities
Mining
AgribusinessAgri-
business
Logistics
ConstructionOil and gas
Oil and gas
Apparel
House-hold
Food
and
beve
rage
Retail
Leisure
Financialservices
Health
Services
Others
0 100 200 300
Internet TMT
Other
224−54
96
11−33
−100
GreaterChina
India
Other APcountries
Notes: TMT is telco, media and technology; real estate and infrastructure deals are excluded in all graphsSource: AVCJ
Drove 39% of totalvolume and 29%
of total value
Figure 2.5: Heavy competition and pressure to invest drove Asia-Pacifi c valuations higher
0
5
10
15
18X
2005
15.3 15.5
07
12.8
9.8
09
13.113.8
11
13.412.2
13
12.6
15.1
15
17.8
Average EV/EBITDA multiple on Asia-Pacific PE-backed M&A transactions
0
5
10
15
18X
Average EBITDA multiple for US LBO transactions
2005
8.4 8.4
07
9.79.1
09
7.78.5
11
8.8 8.7
13
8.89.8
H1 15
10.1
Asia-Pacific US
Notes: EV is enterprise value; equity contribution includes contributed equity and rollover equity; based on pro forma trailing EBITDA; Asia-Pacific excludes extreme multiples (less than 1 or greater than 100)Sources: S&P Capital IQ LCD for the US, S&P Capital IQ for APAC
Asia-Pacifi c Private Equity Report 2016 | Bain & Company, Inc.
Page 8
The good news is that they have increasingly found ways to gain more control over their investments. As we
mentioned last year, deals with path-to-control provisions are becoming ever more common in the Asia-Pacifi c
region as company owners get more comfortable with the PE value proposition. In 2015, a third of all deals in the
region gave investors a stake of more than 50%. Where new investors remained a minority, they were increasingly
able to negotiate participation in the most critical decisions related to operating the company. Those provisions
will be critical as GPs work with company management teams to execute strategies that create more value.
Exits: Down but still healthy
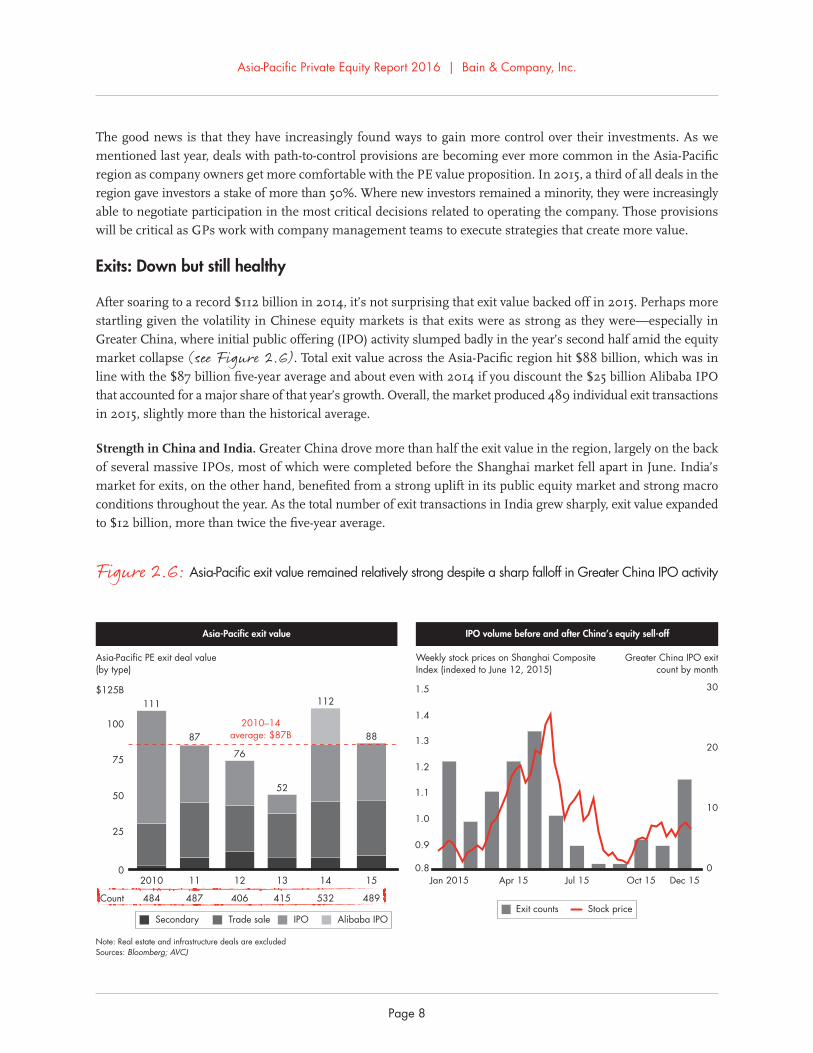
After soaring to a record $112 billion in 2014, it’s not surprising that exit value backed off in 2015. Perhaps more
startling given the volatility in Chinese equity markets is that exits were as strong as they were—especially in
Greater China, where initial public offering (IPO) activity slumped badly in the year’s second half amid the equity
market collapse (see Figure 2.6). Total exit value across the Asia-Pacifi c region hit $88 billion, which was in
line with the $87 billion fi ve-year average and about even with 2014 if you discount the $25 billion Alibaba IPO
that accounted for a major share of that year’s growth. Overall, the market produced 489 individual exit transactions
in 2015, slightly more than the historical average.
Strength in China and India. Greater China drove more than half the exit value in the region, largely on the back
of several massive IPOs, most of which were completed before the Shanghai market fell apart in June. India’s
market for exits, on the other hand, benefi ted from a strong uplift in its public equity market and strong macro
conditions throughout the year. As the total number of exit transactions in India grew sharply, exit value expanded
to $12 billion, more than twice the fi ve-year average.
Figure 2.6: Asia-Pacifi c exit value remained relatively strong despite a sharp falloff in Greater China IPO activity
Weekly stock prices on Shanghai Composite Index (indexed to June 12, 2015)
Asia-Pacific exit value IPO volume before and after China’s equity sell-off
Asia-Pacific PE exit deal value(by type)
2010–14average: $87B
2010
111
11
87
12
76
13
52
14
112
15
88
484 487 406 415 532 489
0
25
50
75
100
$125B
Count
Secondary Trade sale IPO Alibaba IPO
Note: Real estate and infrastructure deals are excludedSources: Bloomberg; AVCJ
0
10
20
30
Greater China IPO exitcount by month
Jan 2015 Apr 15 Jul 15 Oct 15 Dec 150.8
0.9
1.0
1.1
1.2
1.3
1.4
1.5
Exit counts Stock price
Asia-Pacifi c Private Equity Report 2016 | Bain & Company, Inc.
Page 9
Overall, IPOs accounted for $40 billion in total exit value, and trade sales (those with a strategic acquirer) delivered
another $38 billion. Secondary exits (asset sales between PE fi rms) remained a relatively small channel but grew
slightly to $10 billion in 2015. Most GPs expect secondary deals to expand as an exit channel since both sides of
the transaction see benefi ts—for sellers, a straight sale is more expeditious than an IPO, and buyers get a company
that another PE fi rm has already vetted.
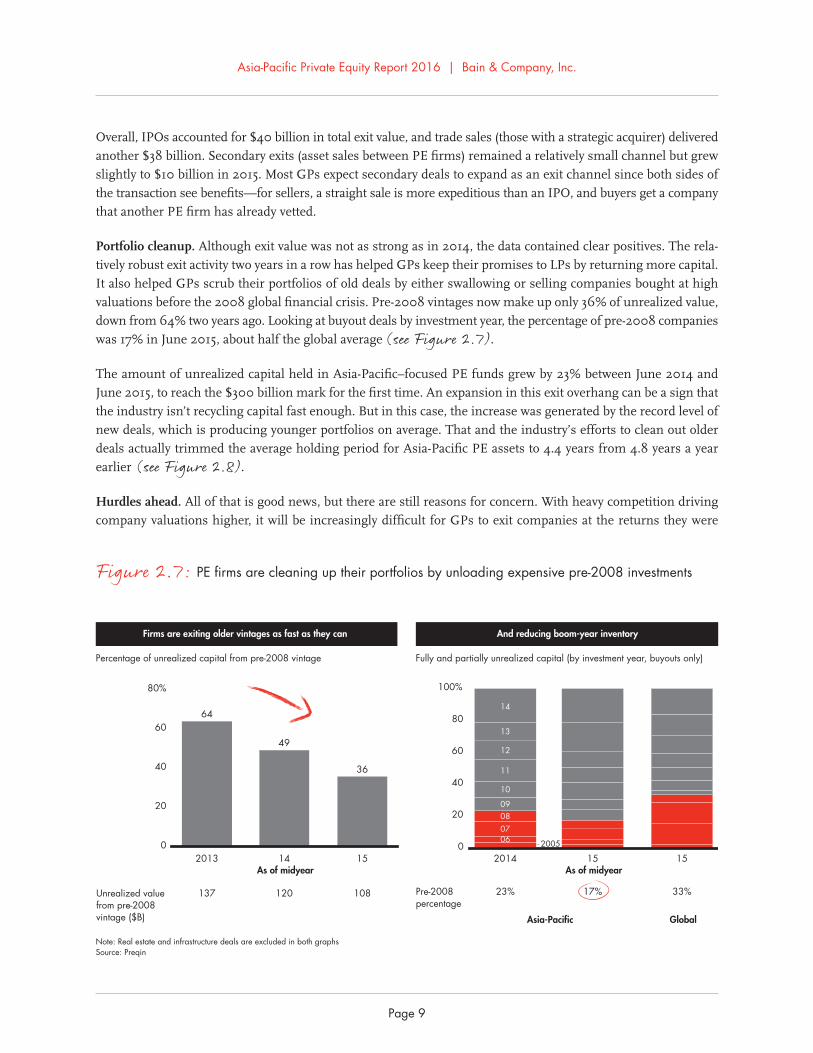
Portfolio cleanup. Although exit value was not as strong as in 2014, the data contained clear positives. The rela-
tively robust exit activity two years in a row has helped GPs keep their promises to LPs by returning more capital.
It also helped GPs scrub their portfolios of old deals by either swallowing or selling companies bought at high
valuations before the 2008 global fi nancial crisis. Pre-2008 vintages now make up only 36% of unrealized value,
down from 64% two years ago. Looking at buyout deals by investment year, the percentage of pre-2008 companies
was 17% in June 2015, about half the global average (see Figure 2.7).
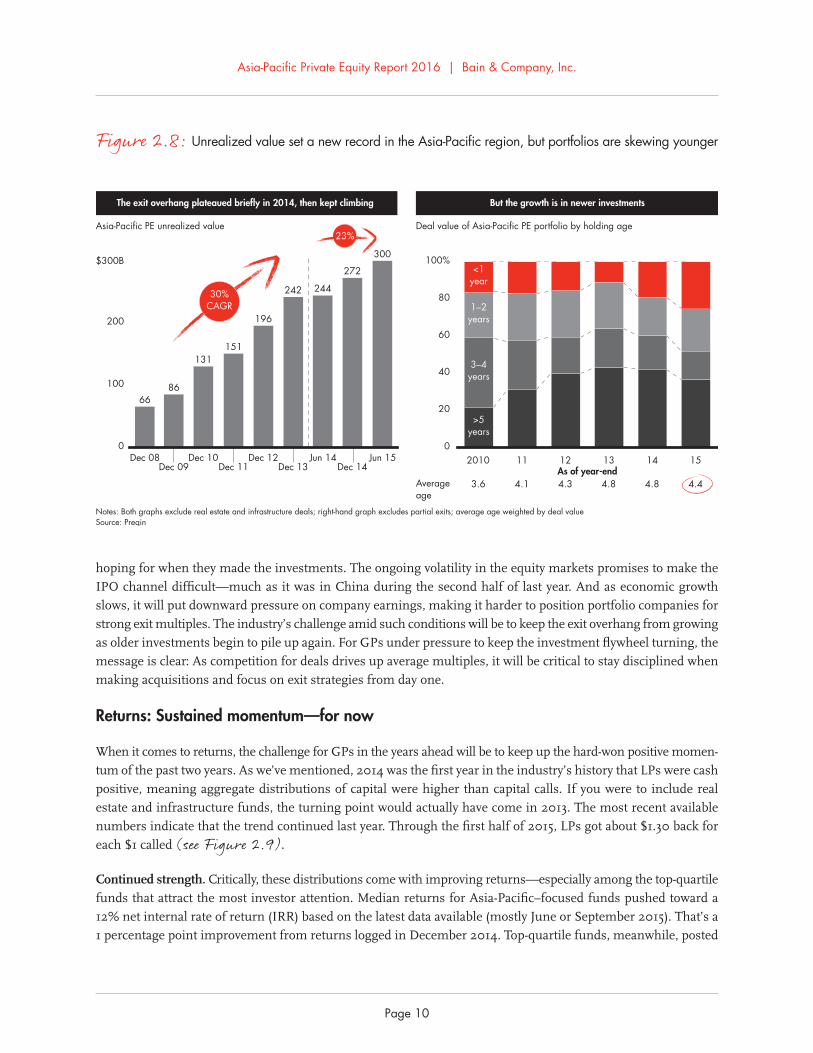
The amount of unrealized capital held in Asia-Pacifi c–focused PE funds grew by 23% between June 2014 and
June 2015, to reach the $300 billion mark for the fi rst time. An expansion in this exit overhang can be a sign that
the industry isn’t recycling capital fast enough. But in this case, the increase was generated by the record level of
new deals, which is producing younger portfolios on average. That and the industry’s efforts to clean out older
deals actually trimmed the average holding period for Asia-Pacifi c PE assets to 4.4 years from 4.8 years a year
earlier (see Figure 2.8).
Hurdles ahead. All of that is good news, but there are still reasons for concern. With heavy competition driving
company valuations higher, it will be increasingly diffi cult for GPs to exit companies at the returns they were
Figure 2.7: PE fi rms are cleaning up their portfolios by unloading expensive pre-2008 investments
0
20
40
60
80%
Percentage of unrealized capital from pre-2008 vintage
2013
64
14
49
15
36
137 120 108Unrealized value from pre-2008 vintage ($B)
Fully and partially unrealized capital (by investment year, buyouts only)
2014
200506070809
10
11
12
13
14
15 15
23% 17% 33%
0
20
40
60
80
100%
Pre-2008percentage
Firms are exiting older vintages as fast as they can And reducing boom-year inventory
As of midyear As of midyear
Asia-Pacific Global
Note: Real estate and infrastructure deals are excluded in both graphs Source: Preqin
Asia-Pacifi c Private Equity Report 2016 | Bain & Company, Inc.
Page 10
hoping for when they made the investments. The ongoing volatility in the equity markets promises to make the
IPO channel diffi cult—much as it was in China during the second half of last year. And as economic growth
slows, it will put downward pressure on company earnings, making it harder to position portfolio companies for
strong exit multiples. The industry’s challenge amid such conditions will be to keep the exit overhang from growing
as older investments begin to pile up again. For GPs under pressure to keep the investment fl ywheel turning, the
message is clear: As competition for deals drives up average multiples, it will be critical to stay disciplined when
making acquisitions and focus on exit strategies from day one.
Returns: Sustained momentum—for now
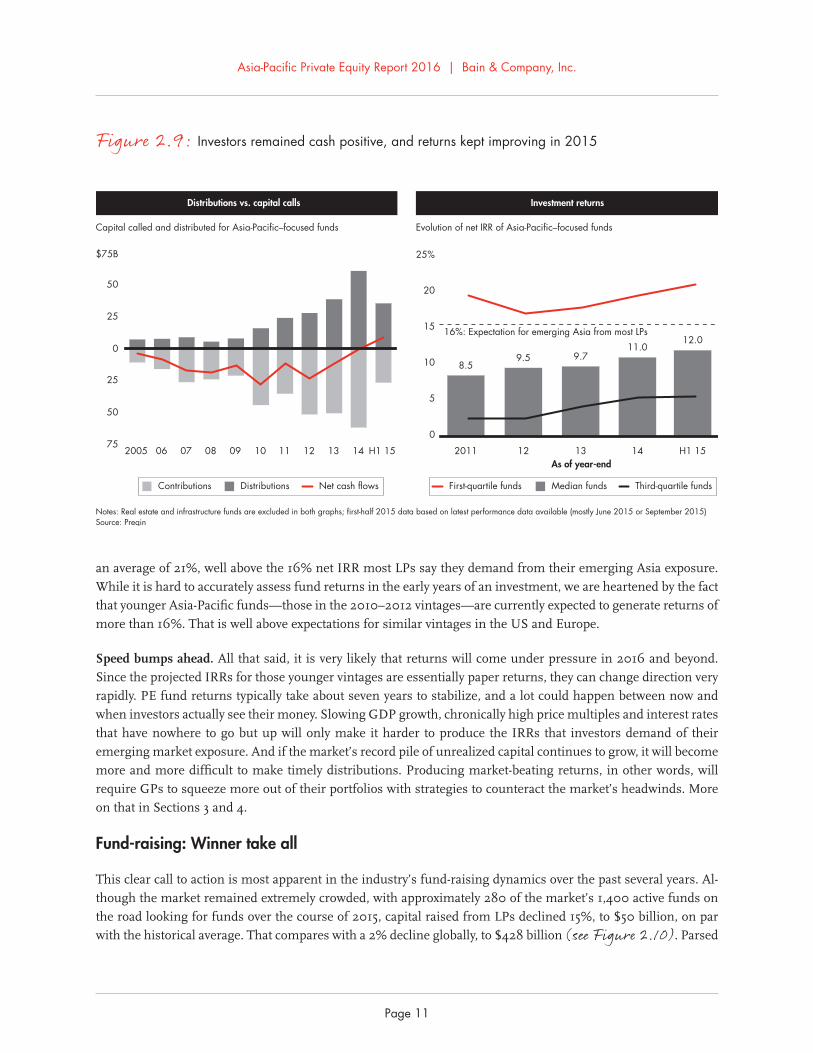
When it comes to returns, the challenge for GPs in the years ahead will be to keep up the hard-won positive momen-
tum of the past two years. As we’ve mentioned, 2014 was the fi rst year in the industry’s history that LPs were cash
positive, meaning aggregate distributions of capital were higher than capital calls. If you were to include real
estate and infrastructure funds, the turning point would actually have come in 2013. The most recent available
numbers indicate that the trend continued last year. Through the fi rst half of 2015, LPs got about $1.30 back for
each $1 called (see Figure 2.9).
Continued strength. Critically, these distributions come with improving returns—especially among the top-quartile
funds that attract the most investor attention. Median returns for Asia-Pacifi c–focused funds pushed toward a
12% net internal rate of return (IRR) based on the latest data available (mostly June or September 2015). That’s a
1 percentage point improvement from returns logged in December 2014. Top-quartile funds, meanwhile, posted
Figure 2.8: Unrealized value set a new record in the Asia-Pacifi c region, but portfolios are skewing younger
0
100
200
$300B
Dec 08
66
Dec 09
86
Dec 10
131
Dec 11
151
Dec 12
196
Dec 13
242
Jun 14
244
Dec 14
272
Jun 15
300
Asia-Pacific PE unrealized value Deal value of Asia-Pacific PE portfolio by holding age
2010
1–2years
3–4years
<1year
>5years
11 12 13 14 15
3.6 4.1 4.3 4.8 4.8 4.4
0
20
40
60
80
100%
Averageage
The exit overhang plateaued briefly in 2014, then kept climbing But the growth is in newer investments
As of year-end
Notes: Both graphs exclude real estate and infrastructure deals; right-hand graph excludes partial exits; average age weighted by deal valueSource: Preqin
30%CAGR
23%
Asia-Pacifi c Private Equity Report 2016 | Bain & Company, Inc.
Page 11
an average of 21%, well above the 16% net IRR most LPs say they demand from their emerging Asia exposure.
While it is hard to accurately assess fund returns in the early years of an investment, we are heartened by the fact
that younger Asia-Pacifi c funds—those in the 2010–2012 vintages—are currently expected to generate returns of
more than 16%. That is well above expectations for similar vintages in the US and Europe.
Speed bumps ahead. All that said, it is very likely that returns will come under pressure in 2016 and beyond.
Since the projected IRRs for those younger vintages are essentially paper returns, they can change direction very
rapidly. PE fund returns typically take about seven years to stabilize, and a lot could happen between now and
when investors actually see their money. Slowing GDP growth, chronically high price multiples and interest rates
that have nowhere to go but up will only make it harder to produce the IRRs that investors demand of their
emerging market exposure. And if the market’s record pile of unrealized capital continues to grow, it will become
more and more diffi cult to make timely distributions. Producing market-beating returns, in other words, will
require GPs to squeeze more out of their portfolios with strategies to counteract the market’s headwinds. More
on that in Sections 3 and 4.
Fund-raising: Winner take all
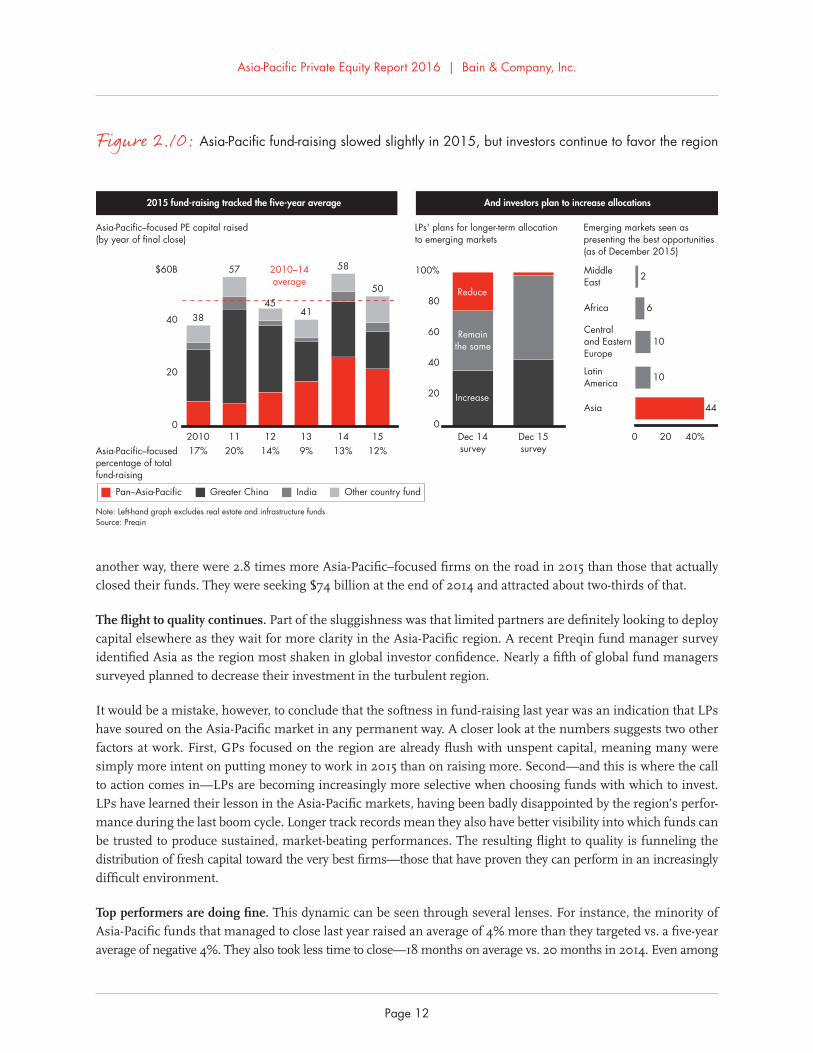
This clear call to action is most apparent in the industry’s fund-raising dynamics over the past several years. Al-
though the market remained extremely crowded, with approximately 280 of the market’s 1,400 active funds on
the road looking for funds over the course of 2015, capital raised from LPs declined 15%, to $50 billion, on par
with the historical average. That compares with a 2% decline globally, to $428 billion (see Figure 2.10). Parsed
Figure 2.9: Investors remained cash positive, and returns kept improving in 2015
75
50
25
0
25
50
$75B
2005 06 07 08 09 10 11 12 13 14 H1 15
Capital called and distributed for Asia-Pacific–focused funds
0
5
10
15
20
25%
16%: Expectation for emerging Asia from most LPs
2011
8.5
12
9.5
13
9.7
14
11.0
H1 15
12.0
As of year-end
Evolution of net IRR of Asia-Pacific–focused funds
Distributions vs. capital calls Investment returns
Contributions Distributions Net cash flows Median funds Third-quartile fundsFirst-quartile funds
Notes: Real estate and infrastructure funds are excluded in both graphs; first-half 2015 data based on latest performance data available (mostly June 2015 or September 2015)Source: Preqin
Asia-Pacifi c Private Equity Report 2016 | Bain & Company, Inc.
Page 12
another way, there were 2.8 times more Asia-Pacifi c–focused fi rms on the road in 2015 than those that actually
closed their funds. They were seeking $74 billion at the end of 2014 and attracted about two-thirds of that.
The fl ight to quality continues. Part of the sluggishness was that limited partners are defi nitely looking to deploy
capital elsewhere as they wait for more clarity in the Asia-Pacifi c region. A recent Preqin fund manager survey
identifi ed Asia as the region most shaken in global investor confi dence. Nearly a fi fth of global fund managers
surveyed planned to decrease their investment in the turbulent region.
It would be a mistake, however, to conclude that the softness in fund-raising last year was an indication that LPs
have soured on the Asia-Pacifi c market in any permanent way. A closer look at the numbers suggests two other
factors at work. First, GPs focused on the region are already fl ush with unspent capital, meaning many were
simply more intent on putting money to work in 2015 than on raising more. Second—and this is where the call
to action comes in—LPs are becoming increasingly more selective when choosing funds with which to invest.
LPs have learned their lesson in the Asia-Pacifi c markets, having been badly disappointed by the region’s perfor-
mance during the last boom cycle. Longer track records mean they also have better visibility into which funds can
be trusted to produce sustained, market-beating performances. The resulting fl ight to quality is funneling the
distribution of fresh capital toward the very best fi rms—those that have proven they can perform in an increasingly
diffi cult environment.
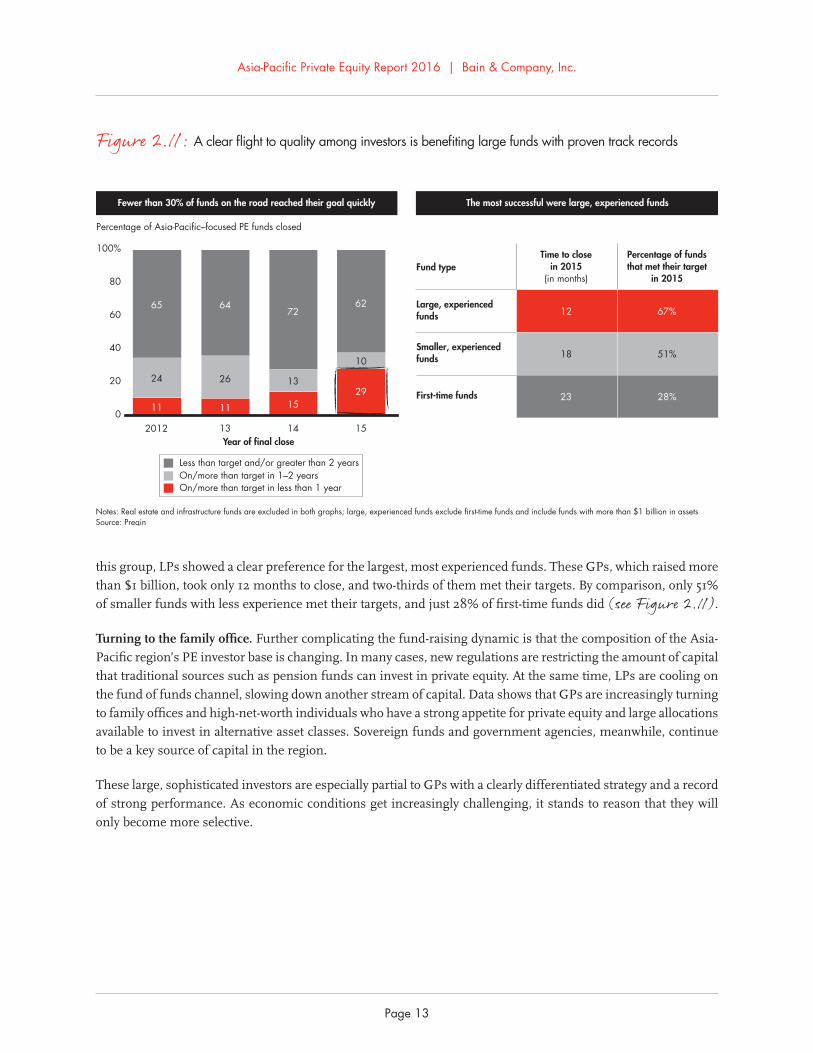
Top performers are doing fi ne. This dynamic can be seen through several lenses. For instance, the minority of
Asia-Pacifi c funds that managed to close last year raised an average of 4% more than they targeted vs. a fi ve-year
average of negative 4%. They also took less time to close—18 months on average vs. 20 months in 2014. Even among
Figure 2.10: Asia-Pacifi c fund-raising slowed slightly in 2015, but investors continue to favor the region
2015 fund-raising tracked the five-year average And investors plan to increase allocations
Asia-Pacific–focused PE capital raised (by year of final close)
2010–14average
2010
38
11
57
12 13
41
14
58
15
5045
17% 20% 14% 9% 13% 12%
0
20
40
$60B
Asia-Pacific–focusedpercentage of totalfund-raising
Pan–Asia-Pacific Greater China India Other country fund
0
20
40
60
80
100%
LPs' plans for longer-term allocationto emerging markets
Dec 14survey
Dec 15survey
Increase
Remainthe same
Reduce
0 20 40%
Asia 44
10
10
Africa 6
MiddleEast 2
Emerging markets seen as presenting the best opportunities (as of December 2015)
LatinAmerica
Note: Left-hand graph excludes real estate and infrastructure fundsSource: Preqin
Central and Eastern Europe
Asia-Pacifi c Private Equity Report 2016 | Bain & Company, Inc.
Page 13
this group, LPs showed a clear preference for the largest, most experienced funds. These GPs, which raised more
than $1 billion, took only 12 months to close, and two-thirds of them met their targets. By comparison, only 51%
of smaller funds with less experience met their targets, and just 28% of fi rst-time funds did (see Figure 2.11 ).
Turning to the family offi ce. Further complicating the fund-raising dynamic is that the composition of the Asia-
Pacifi c region’s PE investor base is changing. In many cases, new regulations are restricting the amount of capital
that traditional sources such as pension funds can invest in private equity. At the same time, LPs are cooling on
the fund of funds channel, slowing down another stream of capital. Data shows that GPs are increasingly turning
to family offi ces and high-net-worth individuals who have a strong appetite for private equity and large allocations
available to invest in alternative asset classes. Sovereign funds and government agencies, meanwhile, continue
to be a key source of capital in the region.
These large, sophisticated investors are especially partial to GPs with a clearly differentiated strategy and a record
of strong performance. As economic conditions get increasingly challenging, it stands to reason that they will
only become more selective.
Figure 2.11 : A clear fl ight to quality among investors is benefi ting large funds with proven track records
Fewer than 30% of funds on the road reached their goal quickly The most successful were large, experienced funds
0
20
40
60
80
100%
2012
11
24
65
13
11
26
64
14
15
13
72
15
29
10
62
Year of final close
Percentage of Asia-Pacific–focused PE funds closed
Fund type
Large, experiencedfunds
Smaller, experienced funds
Time to closein 2015
(in months)
Percentage of fundsthat met their target
in 2015
12 67%
18 51%
First-time funds 23 28%
On/more than target in less than 1 yearOn/more than target in 1–2 yearsLess than target and/or greater than 2 years
Notes: Real estate and infrastructure funds are excluded in both graphs; large, experienced funds exclude first-time funds and include funds with more than $1 billion in assetsSource: Preqin
Asia-Pacifi c Private Equity Report 2016 | Bain & Company, Inc.
Page 14
3. Searching for opportunity amid a new normal Private equity investing in the Asia-Pacifi c region has always centered on growth. Powered by legions of rising middle-
class consumers, this diverse collection of vibrant emerging economies has historically grown at a signifi cantly faster
pace than the rest of the world. The great preponderance of PE deals in the region have relied on growth strategies
aimed mostly at increasing a company’s topline—creating value by riding an industry tailwind, for instance, or
expanding geographically and adding new markets. Even in the wake of the global economic crisis in 2008, the
Asia-Pacifi c growth story endured. Since then, LPs have allocated $364 billion of fresh capital to funds that are fully
dedicated to the region. The number climbs to $1.1 trillion when you include funds with some Asia-Pacifi c focus.
So, has the sudden and sharp deceleration of China’s GDP growth over the past year called that growth story into
question? To some degree, we think this widespread concern is overblown.
Taken together, the Asia-Pacifi c economies still offer real GDP growth in the 4% range, well above the global average. Most
economists believe that India alone will continue to expand at 7% annually. With markets as diverse as Japan and Myanmar,
economic and investment prospects vary widely. But the Asia-Pacifi c region is hardly fading as an attractive place to put
the private equity value proposition to work. On the contrary, we believe that the region will continue to offer ample
opportunity to earn strong returns at an acceptable level of risk to investors looking for emerging market exposure.
The Asia-Pacifi c region will continue to offer ample opportunity to earn strong returns. What’s changing is the shape of those opportunities.
What is changing, however, is the shape of those opportunities. China remains the region’s center of gravity and
by far the biggest market for private equity. We believe that the profound shifts taking place there are ushering in
a new normal in which Asia-Pacifi c PE investors can no longer rely upon uninterrupted growth. At the same time,
asset prices throughout the region remain stubbornly high as record amounts of dry powder pressure GPs to do
deals amid stiff competition from cash-rich corporations seeking to buy growth to meet shareholder expectations.
Steep multiples may make it diffi cult to produce adequate returns, given the clouds ahead. This blend of deep
economic uncertainty and fi erce competition means that GPs will have to work harder across every link in the PE
value chain to fi nd attractive companies, increase their value and sell them at a premium.
In this section, we’ll explore the market contours of the region’s new normal and discuss in more detail how GPs
are trying to position themselves to win. As last year’s record-breaking deal activity demonstrated, the PE industry
can be extremely resourceful when it comes to putting money to work in a diffi cult environment. The question
is this: What do GPs and their investors have to do differently now that the steady tailwind of economic growth
can no longer be taken for granted?
The situation in China
Nowhere is this question more pressing than in China, where the massive sell-off on the Shanghai market refl ects
deep anxiety about the government’s ability to manage its transition from export-led hypergrowth to a more
Asia-Pacifi c Private Equity Report 2016 | Bain & Company, Inc.
Page 15
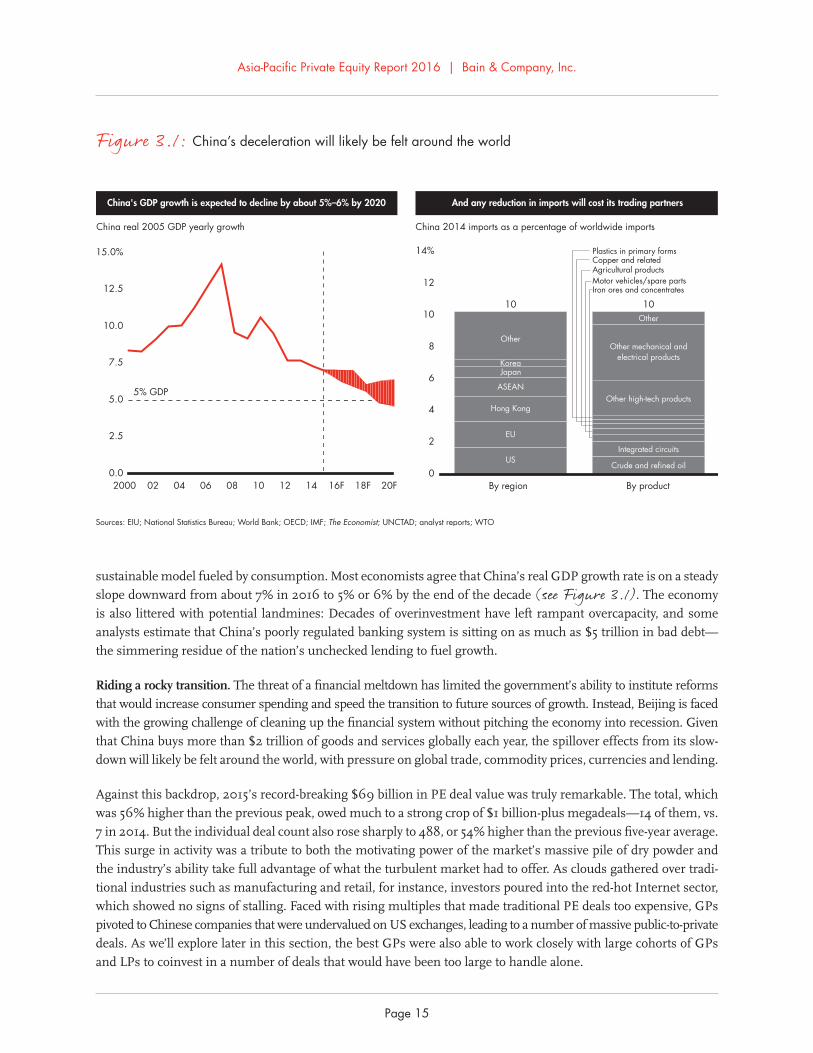
sustainable model fueled by consumption. Most economists agree that China’s real GDP growth rate is on a steady
slope downward from about 7% in 2016 to 5% or 6% by the end of the decade (see Figure 3.1). The economy
is also littered with potential landmines: Decades of overinvestment have left rampant overcapacity, and some
analysts estimate that China’s poorly regulated banking system is sitting on as much as $5 trillion in bad debt—
the simmering residue of the nation’s unchecked lending to fuel growth.
Riding a rocky transition. The threat of a fi nancial meltdown has limited the government’s ability to institute reforms
that would increase consumer spending and speed the transition to future sources of growth. Instead, Beijing is faced
with the growing challenge of cleaning up the fi nancial system without pitching the economy into recession. Given
that China buys more than $2 trillion of goods and services globally each year, the spillover effects from its slow-
down will likely be felt around the world, with pressure on global trade, commodity prices, currencies and lending.
Against this backdrop, 2015’s record-breaking $69 billion in PE deal value was truly remarkable. The total, which
was 56% higher than the previous peak, owed much to a strong crop of $1 billion-plus megadeals—14 of them, vs.
7 in 2014. But the individual deal count also rose sharply to 488, or 54% higher than the previous fi ve-year average.
This surge in activity was a tribute to both the motivating power of the market’s massive pile of dry powder and
the industry’s ability take full advantage of what the turbulent market had to offer. As clouds gathered over tradi-
tional industries such as manufacturing and retail, for instance, investors poured into the red-hot Internet sector,
which showed no signs of stalling. Faced with rising multiples that made traditional PE deals too expensive, GPs
pivoted to Chinese companies that were undervalued on US exchanges, leading to a number of massive public-to-private
deals. As we’ll explore later in this section, the best GPs were also able to work closely with large cohorts of GPs
and LPs to coinvest in a number of deals that would have been too large to handle alone.
Figure 3.1: China’s deceleration will likely be felt around the world
China's GDP growth is expected to decline by about 5%–6% by 2020 And any reduction in imports will cost its trading partners
China real 2005 GDP yearly growth China 2014 imports as a percentage of worldwide imports
0.0
2.5
5.0
7.5
10.0
12.5
15.0%
5% GDP
2000 02 04 06 08 10 12 14 16F 18F 20F0
2
4
6
8
10
12
14%
By region
US
EU
Hong Kong
ASEAN
JapanKorea
Other
10
By product
Crude and refined oil
Integrated circuits
Iron ores and concentratesMotor vehicles/spare partsAgricultural productsCopper and relatedPlastics in primary forms
Other high-tech products
Other mechanical andelectrical products
Other
10
Sources: EIU; National Statistics Bureau; World Bank; OECD; IMF; The Economist; UNCTAD; analyst reports; WTO
Asia-Pacifi c Private Equity Report 2016 | Bain & Company, Inc.
Page 16
A test for PE. As China’s economy continues to sink into uncertainty, it will test the industry’s resilience and
creativity. Few doubt that returns will come under pressure as GPs confront challenges from all directions. Anemic
growth in many sectors means that the average company’s profi ts are likely to weaken substantially. That and
sinking public equity values may ease pressure on price multiples in some sectors, but they will also cloud visibility
into the future, making it diffi cult to assess (and create) real value. Hot sectors such as the Internet, meanwhile,
are hypercompetitive, meaning multiples are soaring through the roof. That presents a growing bubble risk and
makes it diffi cult to buy with discipline.
All of this will challenge GPs’ ability to put massive amounts of dry powder to work profi tably. And the exit environment
won’t be any easier. Despite two years of strong exit activity in China, the backlog of unrealized value is likely to rise
in the years ahead, given increasing pressure on portfolio company earnings, a weakening IPO channel and the likeli-
hood that potential corporate buyers will turn inward to focus on defending their core operations or invest elsewhere.
Capital outfl ow. One fi nal note regarding China’s impact on the global PE market: As we’ve already mentioned,
China’s economy is so large and so central to the global economic fabric that its slowdown will surely be felt
around the world. But there are two other impacts that will affect PE investors. First, as LPs wait for clarity in
China, they will likely direct capital allocations elsewhere. Second, outbound M&A is soaring in China as large
domestic companies look aggressively for diversifi cation and market entry elsewhere around the world. Both of
these factors are creating an investment capital outfl ow that is already increasing competition for deals in more
stable and attractive PE markets. In the Asia-Pacifi c region, activity in India or Southeast Asia may benefi t from
this capital reallocation. But GPs there can also expect competition for deals from cash-rich Chinese corporate
buyers eyeing opportunities in their markets.
Asset class and geographic diversifi cation gain steam
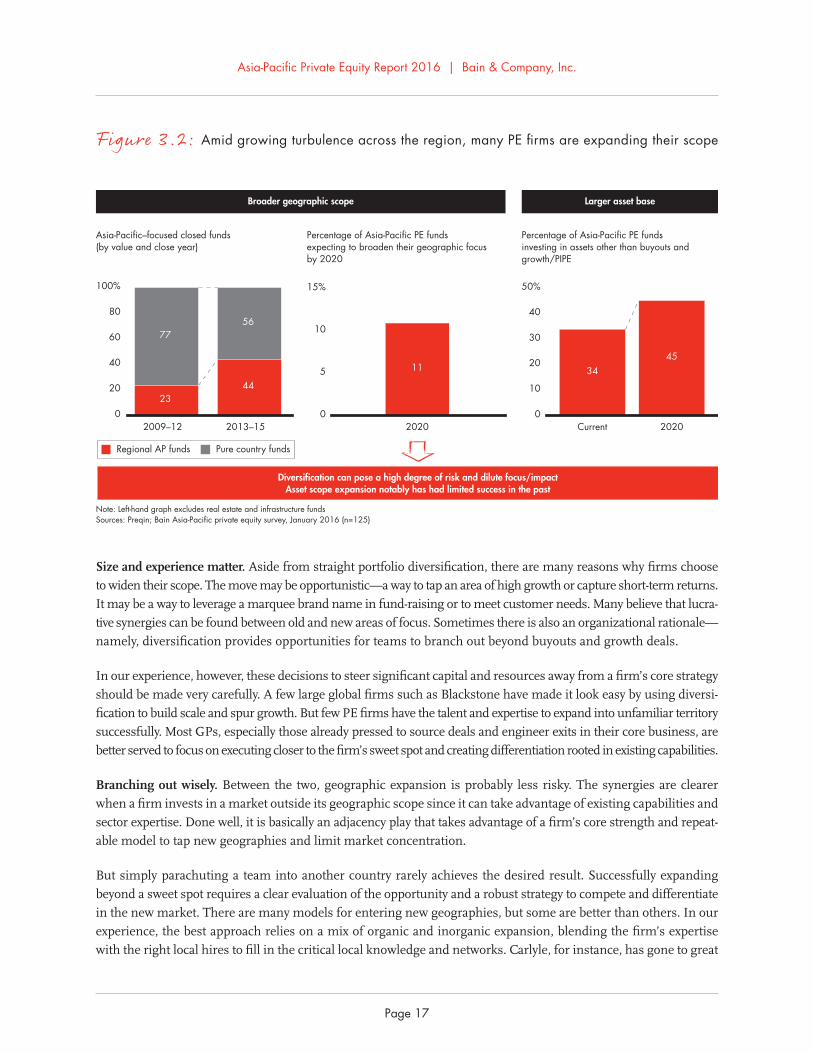
As volatility and competition mount across the region, we are seeing an increasing number of GPs seeking to di-
versify their risk by expanding the scope of their investments (see Figure 3.2). A trend toward geographic ex-
pansion has been building for several years as fi rms try to limit their exposure to any single Asia-Pacifi c market.
Increasingly, they are also taking steps to add new asset classes—setting up hedge funds, for instance, or investing
in nontraditional areas such as debt instruments, real estate and infrastructure.
As appealing as diversifi cation might seem in an increasingly challenging environment, however, it can also pose
a high degree of risk. Asset class expansion, in particular, typically offers few operational synergies and can dilute
focus at a time when staying on point is critical.
Increasing appetite. About a third of the GPs in our survey said they invest in nontraditional asset classes, and 45% of
them indicated they would be broadening their scope to include such investments over the next fi ve years. One prime
example emerged in January 2016, when KKR said it had formed a partnership with China Orient Asset Management
and COS-Capital to focus on credit and distressed debt opportunities in China, with a key focus on the real estate sector.
Around 11% of respondents, meanwhile, said that they plan to increase their geographic scope over the next fi ve
years. Indonesia’s Northstar, for instance, has broadened its area of activity to cover other countries in Southeast
Asia, while Vogo in South Korea recently recast itself as a pan-Asia fund. Many GPs are also doing cross-border
deals (defi ned as investments placed in geographies where the fi rm has no on-the-ground presence). A good example
is TPG’s India team, which led a $53 million investment in Sri Lanka’s Asiri Hospital. China’s GSR Ventures recently
raised a $5 billion fund to invest globally in companies focused on accessing China’s market.
Asia-Pacifi c Private Equity Report 2016 | Bain & Company, Inc.
Page 17
Size and experience matter. Aside from straight portfolio diversifi cation, there are many reasons why fi rms choose
to widen their scope. The move may be opportunistic—a way to tap an area of high growth or capture short-term returns.
It may be a way to leverage a marquee brand name in fund-raising or to meet customer needs. Many believe that lucra-
tive synergies can be found between old and new areas of focus. Sometimes there is also an organizational rationale—
namely, diversifi cation provides opportunities for teams to branch out beyond buyouts and growth deals.
In our experience, however, these decisions to steer signifi cant capital and resources away from a fi rm’s core strategy
should be made very carefully. A few large global fi rms such as Blackstone have made it look easy by using diversi-
fi cation to build scale and spur growth. But few PE fi rms have the talent and expertise to expand into unfamiliar territory
successfully. Most GPs, especially those already pressed to source deals and engineer exits in their core business, are
better served to focus on executing closer to the fi rm’s sweet spot and creating differentiation rooted in existing capabilities.
Branching out wisely. Between the two, geographic expansion is probably less risky. The synergies are clearer
when a fi rm invests in a market outside its geographic scope since it can take advantage of existing capabilities and
sector expertise. Done well, it is basically an adjacency play that takes advantage of a fi rm’s core strength and repeat-
able model to tap new geographies and limit market concentration.
But simply parachuting a team into another country rarely achieves the desired result. Successfully expanding
beyond a sweet spot requires a clear evaluation of the opportunity and a robust strategy to compete and differentiate
in the new market. There are many models for entering new geographies, but some are better than others. In our
experience, the best approach relies on a mix of organic and inorganic expansion, blending the fi rm’s expertise
with the right local hires to fi ll in the critical local knowledge and networks. Carlyle, for instance, has gone to great
Figure 3.2: Amid growing turbulence across the region, many PE fi rms are expanding their scope
Asia-Pacific–focused closed funds(by value and close year)
Percentage of Asia-Pacific PE fundsexpecting to broaden their geographic focus by 2020
Percentage of Asia-Pacific PE fundsinvesting in assets other than buyouts andgrowth/PIPE
Broader geographic scope Larger asset base
0
20
40
60
80
100%
2009–12
23
77
2013–15
44
56
Regional AP funds Pure country funds
0
10
20
30
40
50%
Current
34
2020
45
0
5
10
15%
2020
11
Diversification can pose a high degree of risk and dilute focus/impactAsset scope expansion notably has had limited success in the past
Note: Left-hand graph excludes real estate and infrastructure fundsSources: Preqin; Bain Asia-Pacific private equity survey, January 2016 (n=125)
Asia-Pacifi c Private Equity Report 2016 | Bain & Company, Inc.
Page 18
lengths to build local contacts since it began expanding its footprint in the region in the late 1990s. Central to its
strategy has been a board of prominent Asian offi cials and business people assembled by former US President
and Carlyle adviser George H.W. Bush. This group helps open doors and fi nd investments. But each Carlyle offi ce
also needs a well-rounded team of professionals on the ground to put capital to work profi tably.
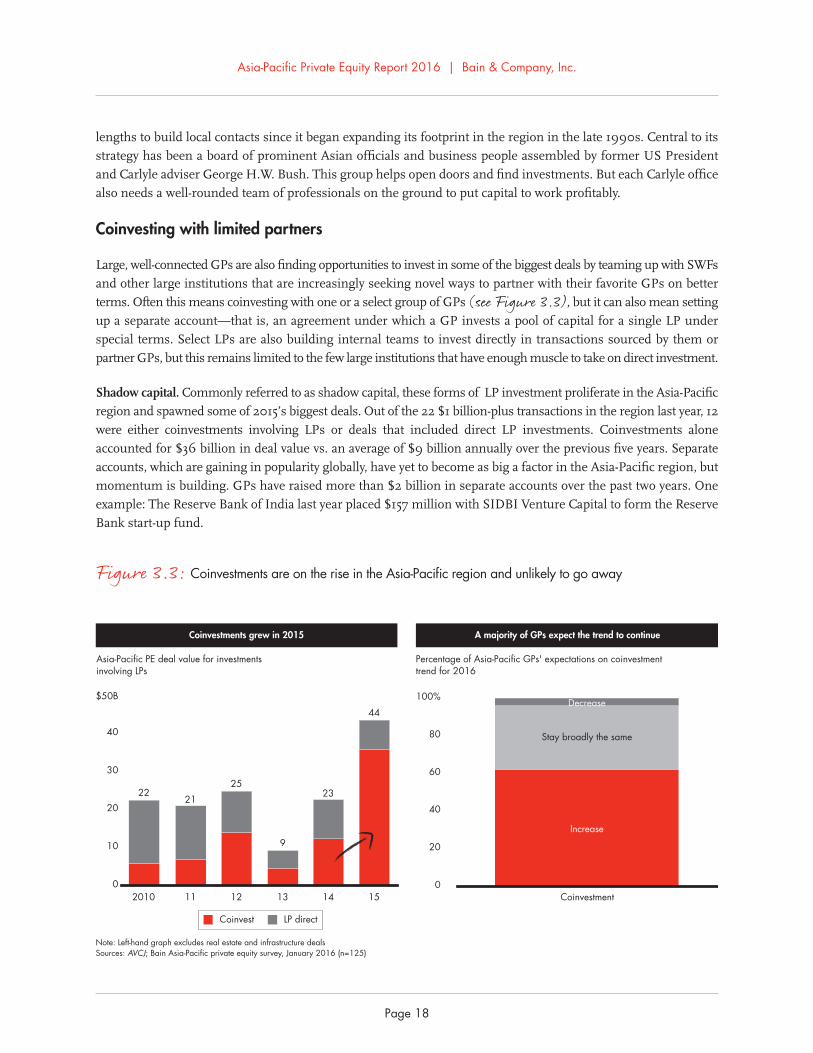
Coinvesting with limited partners
Large, well-connected GPs are also fi nding opportunities to invest in some of the biggest deals by teaming up with SWFs
and other large institutions that are increasingly seeking novel ways to partner with their favorite GPs on better
terms. Often this means coinvesting with one or a select group of GPs (see Figure 3.3), but it can also mean setting
up a separate account—that is, an agreement under which a GP invests a pool of capital for a single LP under
special terms. Select LPs are also building internal teams to invest directly in transactions sourced by them or
partner GPs, but this remains limited to the few large institutions that have enough muscle to take on direct investment.
Shadow capital. Commonly referred to as shadow capital, these forms of LP investment proliferate in the Asia-Pacifi c
region and spawned some of 2015’s biggest deals. Out of the 22 $1 billion-plus transactions in the region last year, 12
were either coinvestments involving LPs or deals that included direct LP investments. Coinvestments alone
accounted for $36 billion in deal value vs. an average of $9 billion annually over the previous fi ve years. Separate
accounts, which are gaining in popularity globally, have yet to become as big a factor in the Asia-Pacifi c region, but
momentum is building. GPs have raised more than $2 billion in separate accounts over the past two years. One
example: The Reserve Bank of India last year placed $157 million with SIDBI Venture Capital to form the Reserve
Bank start-up fund.
Figure 3.3: Coinvestments are on the rise in the Asia-Pacifi c region and unlikely to go away
Coinvestments grew in 2015 A majority of GPs expect the trend to continue
Asia-Pacific PE deal value for investments involving LPs
0
10
20
30
40
$50B
2010
22
11
21
12
25
13
9
14
23
15
44
0
20
40
60
80
100%
Coinvestment
Increase
Stay broadly the same
Decrease
Percentage of Asia-Pacific GPs' expectations on coinvestment trend for 2016
Coinvest LP direct
Note: Left-hand graph excludes real estate and infrastructure dealsSources: AVCJ; Bain Asia-Pacific private equity survey, January 2016 (n=125)
Asia-Pacifi c Private Equity Report 2016 | Bain & Company, Inc.
Page 19
LPs have gravitated toward more direct investment for several reasons. The most obvious is that direct investment
can produce better returns since LPs tend to enjoy better fee structures in coinvestments and structured accounts.
These arrangements give LPs more control over outcomes, premium access to the best GPs and the chance to
enhance their internal investment management capabilities. But they also generate controversy. Because shadow
capital isn’t counted in fund-raising totals, it is hard for other investors to know exactly what infl uence a side arrange-
ment with an unnamed large investor may be having on a GP’s behavior. Some observers also see LPs looming as
competition in a crowded market for attractive deals.
More opportunity than threat. In our survey, only 11% of respondents viewed large institutions or SWFs as a threat.
Most recognize that shadow capital tends to expand the pie, not claim an undue share of it. In practice, the presence
of large, well-connected investors in the market allows an elite group of GPs to take on bigger deals than they
would otherwise be able to do. And because SWFs have unique relationships with government entities, they also
get access to deals in the Asia-Pacifi c region that would never be available to others. For many GPs, coinvestments
and separate accounts burnish relationships with important, deep-pocketed investors. That can be a welcome
sweetener in a tough Asia-Pacifi c fund-raising market.
One thing that’s clear about shadow capital is that it’s not going away. SWFs have long been major players on the
Asia-Pacifi c PE scene, and other large institutions see strong reasons to keep allocating a portion of their capital to
a more direct form of PE investment. Among the GPs in our survey, 62% said that they expect coinvestments to
increase in 2016. For most of them, the spread of shadow capital is less a threat than an opportunity to participate
in some of the region’s biggest, most important transactions.
The need to exert control
As appealing as diversifi cation or coinvestment may be, the key to thriving amid slower growth and turbulence for
most PE fi rms will be shoring up their core value proposition. As we’ve said, the region’s rising tide of steady
economic growth in years past tended to lift all boats and propel even average companies to higher valuations. As
growth ebbs, however, it will become proportionally harder to create value without making signifi cant changes to
a portfolio company’s operations, management team and strategy. The power to exert such infl uence has often
been missing in the Asia-Pacifi c region—especially in the minority deal situations that have tended to dominate
the region’s PE investing activity. But that is changing as GPs increasingly gravitate toward transactions that offer
signifi cantly more control over investment outcomes.
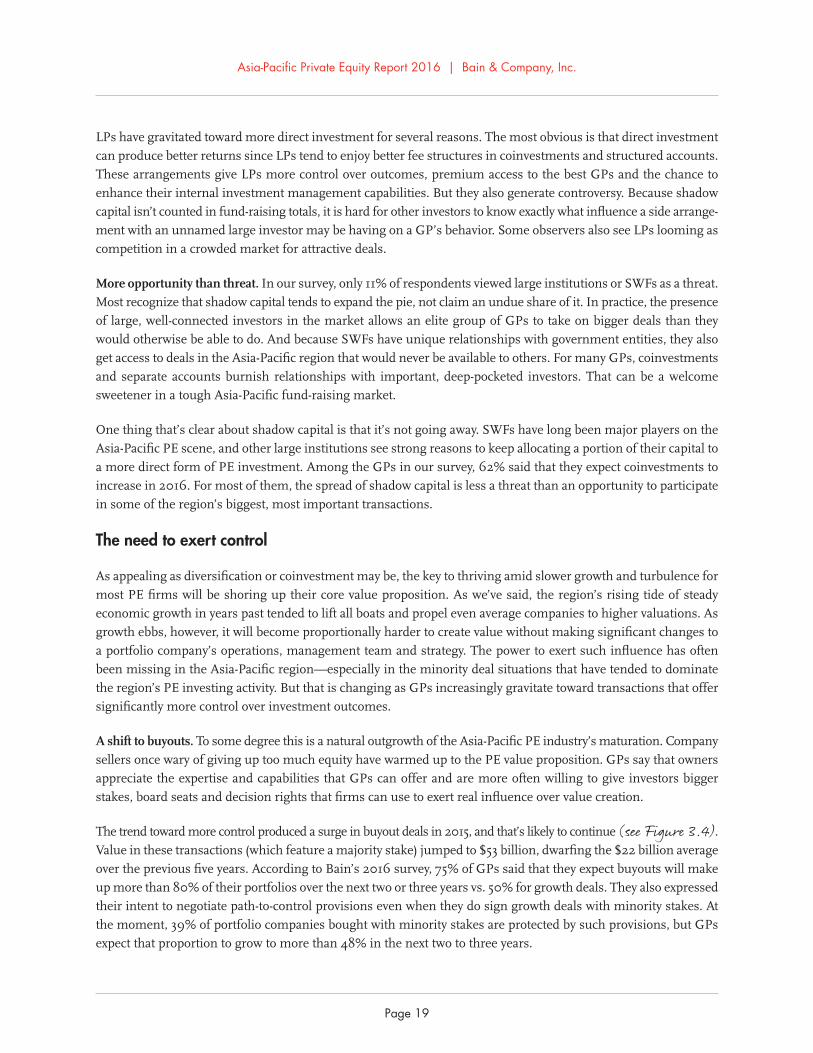
A shift to buyouts. To some degree this is a natural outgrowth of the Asia-Pacifi c PE industry’s maturation. Company
sellers once wary of giving up too much equity have warmed up to the PE value proposition. GPs say that owners
appreciate the expertise and capabilities that GPs can offer and are more often willing to give investors bigger
stakes, board seats and decision rights that fi rms can use to exert real infl uence over value creation.
The trend toward more control produced a surge in buyout deals in 2015, and that’s likely to continue (see Figure 3.4).
Value in these transactions (which feature a majority stake) jumped to $53 billion, dwarfi ng the $22 billion average
over the previous fi ve years. According to Bain’s 2016 survey, 75% of GPs said that they expect buyouts will make
up more than 80% of their portfolios over the next two or three years vs. 50% for growth deals. They also expressed
their intent to negotiate path-to-control provisions even when they do sign growth deals with minority stakes. At
the moment, 39% of portfolio companies bought with minority stakes are protected by such provisions, but GPs
expect that proportion to grow to more than 48% in the next two to three years.
Asia-Pacifi c Private Equity Report 2016 | Bain & Company, Inc.
Page 20
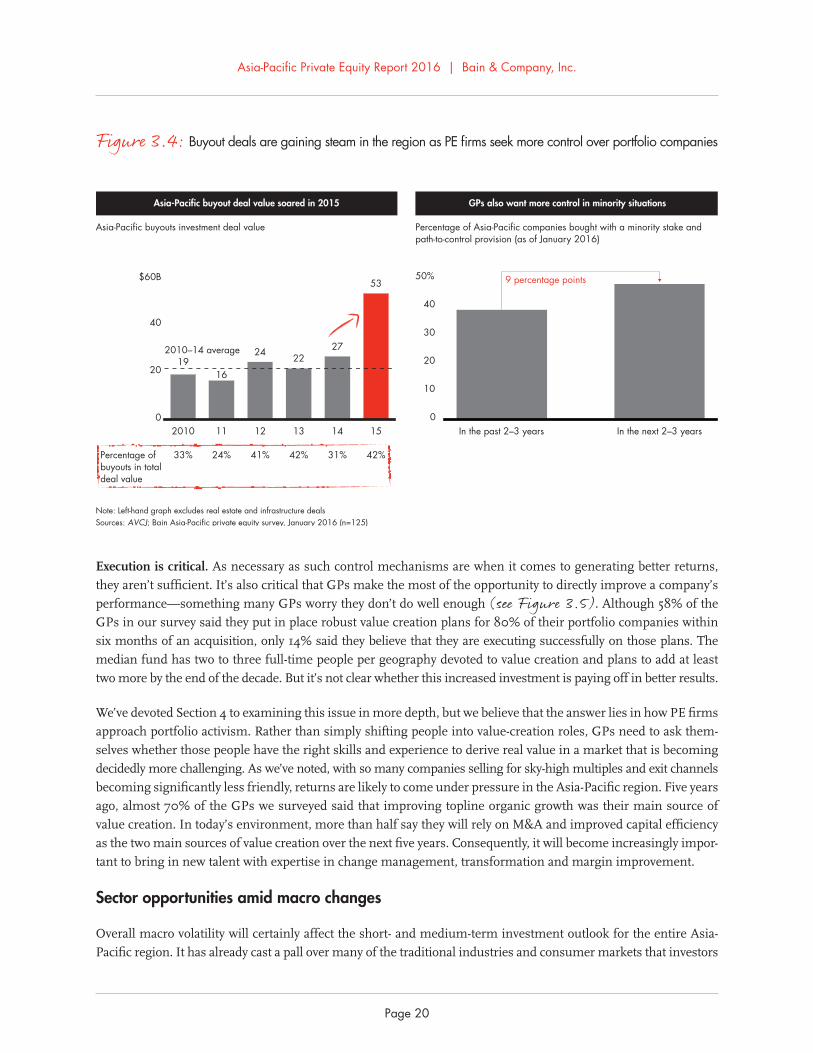
Execution is critical. As necessary as such control mechanisms are when it comes to generating better returns,
they aren’t suffi cient. It’s also critical that GPs make the most of the opportunity to directly improve a company’s
performance—something many GPs worry they don’t do well enough (see Figure 3.5). Although 58% of the
GPs in our survey said they put in place robust value creation plans for 80% of their portfolio companies within
six months of an acquisition, only 14% said they believe that they are executing successfully on those plans. The
median fund has two to three full-time people per geography devoted to value creation and plans to add at least
two more by the end of the decade. But it’s not clear whether this increased investment is paying off in better results.
We’ve devoted Section 4 to examining this issue in more depth, but we believe that the answer lies in how PE fi rms
approach portfolio activism. Rather than simply shifting people into value-creation roles, GPs need to ask them-
selves whether those people have the right skills and experience to derive real value in a market that is becoming
decidedly more challenging. As we’ve noted, with so many companies selling for sky-high multiples and exit channels
becoming signifi cantly less friendly, returns are likely to come under pressure in the Asia-Pacifi c region. Five years
ago, almost 70% of the GPs we surveyed said that improving topline organic growth was their main source of
value creation. In today’s environment, more than half say they will rely on M&A and improved capital effi ciency
as the two main sources of value creation over the next fi ve years. Consequently, it will become increasingly impor-
tant to bring in new talent with expertise in change management, transformation and margin improvement.
Sector opportunities amid macro changes
Overall macro volatility will certainly affect the short- and medium-term investment outlook for the entire Asia-
Pacifi c region. It has already cast a pall over many of the traditional industries and consumer markets that investors
Figure 3.4: Buyout deals are gaining steam in the region as PE fi rms seek more control over portfolio companies
Asia-Pacific buyout deal value soared in 2015 GPs also want more control in minority situations
Asia-Pacific buyouts investment deal value Percentage of Asia-Pacific companies bought with a minority stake and path-to-control provision (as of January 2016)
2010
19
11
16
12
24
13
22
14
27
15
53
2010–14 average
33% 24% 41% 42% 31% 42%
0
20
40
$60B
Percentage ofbuyouts in totaldeal value
0
10
20
30
40
50%
In the past 2–3 years
In the next 2–3 years
9 percentage points
Note: Left-hand graph excludes real estate and infrastructure dealsSources: AVCJ; Bain Asia-Pacific private equity survey, January 2016 (n=125)
Asia-Pacifi c Private Equity Report 2016 | Bain & Company, Inc.
Page 21
have favored in recent decades. But longer term, the world’s center of gravity is clearly shifting back toward the
Asia-Pacifi c region, laying a fi rm foundation for future growth. By 2025, the region will be home to a staggering 4
billion people—four times as many as in North America and Europe combined. Their lives will be fundamentally
different than they are now, with important demographic shifts ushering in new spending patterns and behaviors.
These markets are becoming older, wealthier and technically more sophisticated. The region is learning to produce
more for domestic consumption, and exports increasingly consist of higher-value goods. Over time, this combination
promises to rekindle substantial growth, and forward-looking PE investors are already staking out claims in those
sectors likely to benefi t. The list that follows is hardly exhaustive, but it does give a sense of where investors are
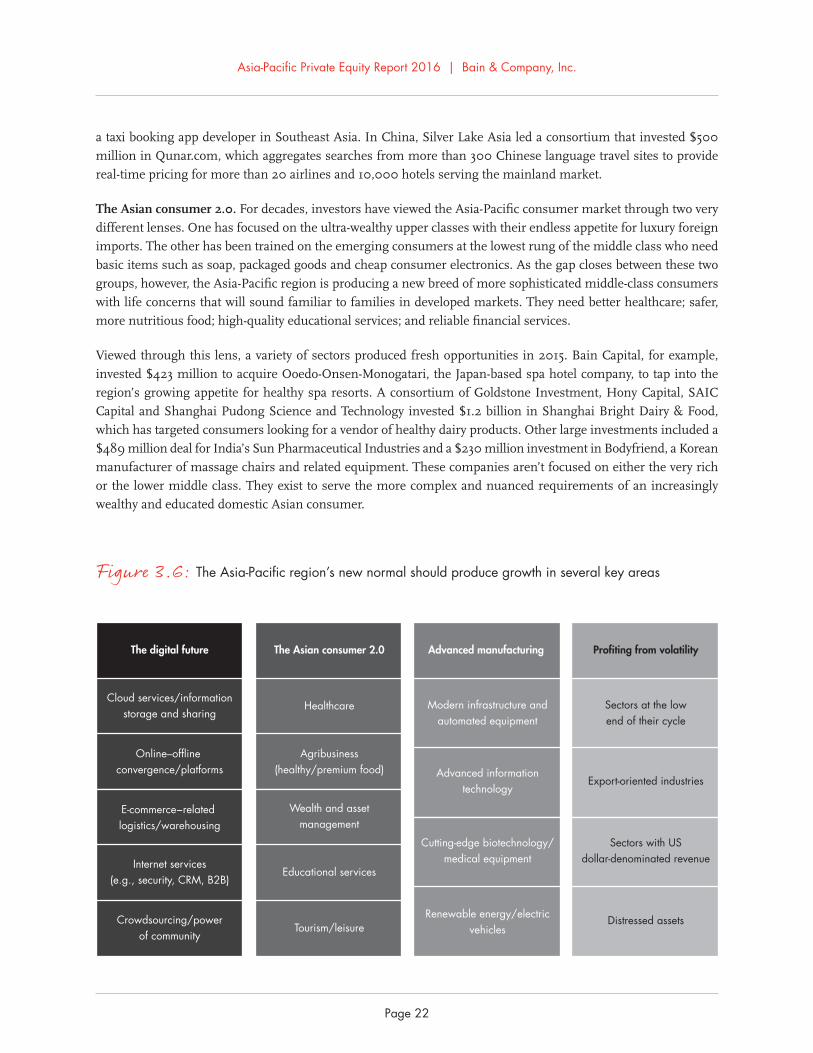
looking next as the Asia-Pacifi c region matures (see Figure 3.6).
The digital future. As we’ve mentioned, Internet-related investments dominated deal count and value in 2015 as
investors fl ocked to the one sector that seemed immune to economic pressure. The resulting spike in deal multi-
ples should raise red fl ags for any investor hoping to join the party in 2016. But there is also good reason to believe
that digital technology will continue to reshape people’s lives globally and create ongoing opportunities for investors.
The digital transformation of the consumer experience that many take for granted in developed markets is still
gaining steam in many Asia-Pacifi c economies. Not only is it creating sweeping change in many consumer and
B2B industries but innovations such as cloud services and near-zero-cost connectivity are enabling companies
with limited resources to harness capabilities that can match (or beat) those of much larger rivals, accelerating
penetration of many categories. That has led to large investments in a variety of sectors and geographies. For example,
Coatue Management, Tiger Global Management, SoftBank and others pooled $350 million to invest in GrabTaxi,
Figure 3.5: More Asia-Pacific funds plan to focus on value creation but say they need to execute more consistently
GPs plan to add talent focused exclusively on value creation But execution of value creation plans is an issue
Full-time equivalent employees per geography focusing exclusivelyon a portfolio company's value creation
Perspectives of Asia-Pacific GPs on their currentvalue-creation performance
0
20
40
60
80
100%
Robust value-creationplan within 6 months
Value-creation plans implementedsuccessfully with intended results
Done for >80% ofportfolio companies
Done for 50%–80% ofportfolio companies
Done for 25%–50%of portfolio companies
Done for 5%–20%of portfolio companies
Very rarely done (0%–5%)
0
20
40
60
80
100%
Current In 3–5 years
<1 full-time person
2–3 people
3–5 people
5–10 people
>10 people
~1 person
Source: Bain Asia-Pacific private equity survey, January 2016 (n=125)
Asia-Pacifi c Private Equity Report 2016 | Bain & Company, Inc.
Page 22
a taxi booking app developer in Southeast Asia. In China, Silver Lake Asia led a consortium that invested $500
million in Qunar.com, which aggregates searches from more than 300 Chinese language travel sites to provide
real-time pricing for more than 20 airlines and 10,000 hotels serving the mainland market.
The Asian consumer 2.0. For decades, investors have viewed the Asia-Pacifi c consumer market through two very
different lenses. One has focused on the ultra-wealthy upper classes with their endless appetite for luxury foreign
imports. The other has been trained on the emerging consumers at the lowest rung of the middle class who need
basic items such as soap, packaged goods and cheap consumer electronics. As the gap closes between these two
groups, however, the Asia-Pacifi c region is producing a new breed of more sophisticated middle-class consumers
with life concerns that will sound familiar to families in developed markets. They need better healthcare; safer,
more nutritious food; high-quality educational services; and reliable fi nancial services.
Viewed through this lens, a variety of sectors produced fresh opportunities in 2015. Bain Capital, for example,
invested $423 million to acquire Ooedo-Onsen-Monogatari, the Japan-based spa hotel company, to tap into the
region’s growing appetite for healthy spa resorts. A consortium of Goldstone Investment, Hony Capital, SAIC
Capital and Shanghai Pudong Science and Technology invested $1.2 billion in Shanghai Bright Dairy & Food,
which has targeted consumers looking for a vendor of healthy dairy products. Other large investments included a
$489 million deal for India’s Sun Pharmaceutical Industries and a $230 million investment in Bodyfriend, a Korean
manufacturer of massage chairs and related equipment. These companies aren’t focused on either the very rich
or the lower middle class. They exist to serve the more complex and nuanced requirements of an increasingly
wealthy and educated domestic Asian consumer.
Figure 3.6: The Asia-Pacifi c region’s new normal should produce growth in several key areas
The digital future
Cloud services/informationstorage and sharing
Online–offline convergence/platforms
E-commerce−related logistics/warehousing
Internet services(e.g., security, CRM, B2B)
Crowdsourcing/powerof community
The Asian consumer 2.0
Healthcare
Agribusiness(healthy/premium food)
Wealth and assetmanagement
Educational services
Tourism/leisure
Advanced manufacturing
Modern infrastructure andautomated equipment
Advanced informationtechnology
Cutting-edge biotechnology/medical equipment
Renewable energy/electricvehicles
Profiting from volatility
Sectors at the lowend of their cycle
Export-oriented industries
Sectors with USdollar-denominated revenue
Distressed assets
Asia-Pacifi c Private Equity Report 2016 | Bain & Company, Inc.
Page 23
Advanced manufacturing. Led by China and India, the bold vision of most advanced Asia-Pacifi c economies is to
graduate beyond the region’s legacy of low-cost manufacturing and me-too product offerings to create modern,
high-tech industrial sectors to rival those in developed markets. Perhaps the most comprehensive expression of
this ambition is the “Made in China 2025” initiative introduced by Chinese offi cials last year. China’s tax and invest-
ment policy has long focused on incentivizing industry to use innovation to climb up the value chain to compete
in more technologically advanced industries. Made in China 2025 focuses on helping companies become world
class across the entire production process in 10 key sectors: advanced information technology, automated machine
tools and robotics, aerospace and aeronautical equipment, high-tech shipping, modern rail systems, new-energy
vehicles, power equipment, agricultural equipment, new materials, and biopharma/advanced medical equipment.
The Asia-Pacifi c region is producing a new breed of more sophisticated middle-class consumers with life concerns that will sound familiar to families in developed markets.
The Chinese government is also stepping up support for these sectors. A government-sponsored vehicle called the
Shanghai Integrated Circuit Investment Fund, for instance, has announced plans to invest about $3 billion in
three Shanghai-based chipmakers, with a quarter going to Semiconductor Manufacturing International Corporation,
China’s largest and most advanced semiconductor foundry.
Looking more broadly at the Asia-Pacifi c region, many PE funds have bet on the increased demand for green energy.
A good example is the consortium of ADIA, Goldman Sachs and Global Environment Fund, which invested about
$700 million in ReNew Power over the past few years, including $265 million in 2015, hoping to participate in the
growing demand for renewable energy in India.
Profi ting from volatility. As with any period of cyclical weakness and volatility, the current environment is presenting
opportunities for sophisticated contrarians. The gloomy global growth outlook, sinking oil and commodity prices,
erratic currencies and potential upward movement on interest rates are all attracting the attention of value-hungry
investors. Hony Capital, for instance, last November invested $355 million in Santos, a major Australian oil and
gas company. EMR Capital and Farallon Capital anted up $775 million to acquire PT Agincourt Resources, the
Indonesia gold and silver mining group. The eroding credit environment is presenting opportunities for distressed
investment/special situation specialists. KKR, for one, has overweighted its portfolios toward distressed invest-
ments partly because it believes that China’s structural investment slowdown is creating distressed opportunities
in that country’s overleveraged corporate sector. KKR also sees a knock-on effect among China’s trading partners
in emerging markets, especially India and Indonesia.
There’s no doubt that investors with a clear understanding of a specifi c market can do well playing cycles amid
heavy volatility, but it remains a highly risky strategy in most cases. Making it work usually requires bringing to
bear other mechanisms to create value by improving performance and assessing risk. Success requires exquisite
timing both at purchase and at exit.
Asia-Pacifi c Private Equity Report 2016 | Bain & Company, Inc.
Page 24
Fund-raising successes pushing GPs to put capital to workDeal flow helped by softeningvaluations and cheap capitalExposure to resource sector, China and weak housing marketExits likely to slow
GP networks building upAttractive alternative to ChinaASEAN benefitsScarce large assets High valuations and competitionMacro issues in Malaysia,Thailand, Indonesia
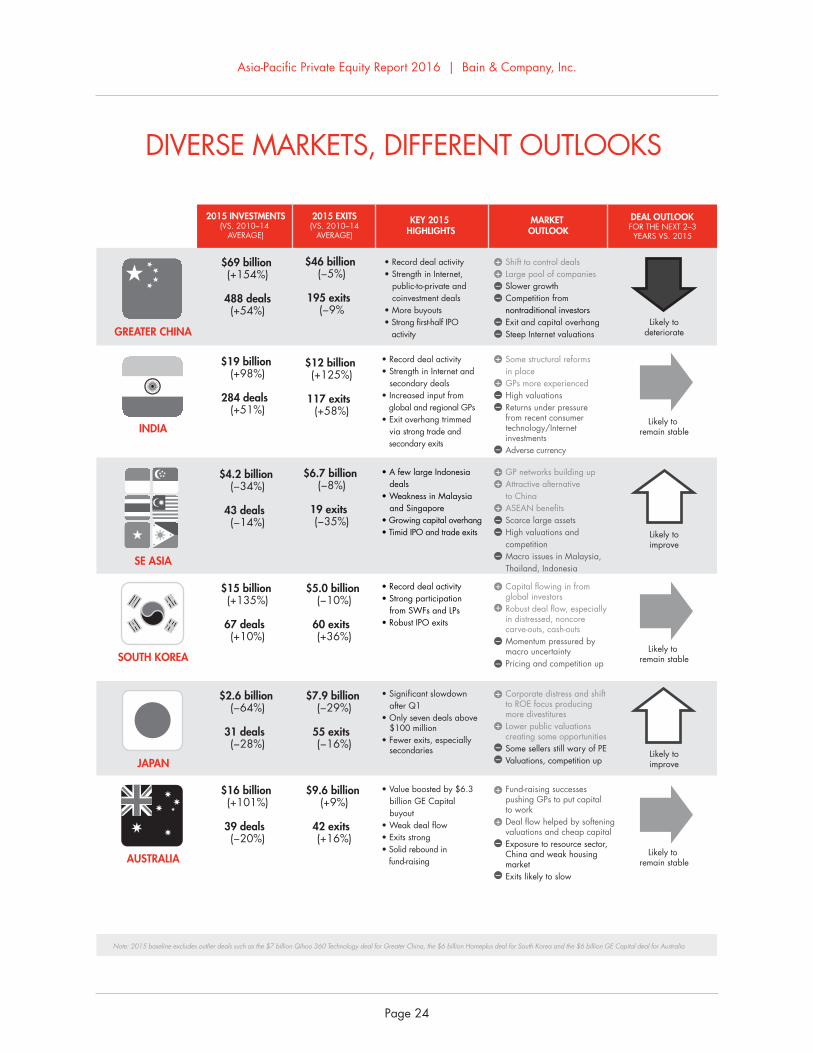
Note: 2015 baseline excludes outlier deals such as the $7 billion Qihoo 360 Technology deal for Greater China, the $6 billion Homeplus deal for South Korea and the $6 billion GE Capital deal for Australia
2015 INVESTMENTS(VS. 2010–14
AVERAGE)
2015 EXITS(VS. 2010–14
AVERAGE)
KEY 2015 HIGHLIGHTS
MARKET OUTLOOK
DEAL OUTLOOK FOR THE NEXT 2–3 YEARS VS. 2015
AUSTRALIA
JAPAN
SOUTH KOREA
SE ASIA
INDIA
GREATER CHINALikely to
deteriorate
Likely to remain stable
Likely toimprove
Likely toimprove
Likely to remain stable
Likely to remain stable
$69 billion (+154%)
488 deals(+54%)
$19 billion (+98%)
284 deals (+51%)
$4.2 billion (−34%)
43 deals (−14%)
$15 billion (+135%)
67 deals (+10%)
$2.6 billion (−64%)
31 deals (−28%)
$16 billion (+101%)
39 deals (−20%)
$46 billion (−5%)
195 exits (−9%
$12 billion (+125%)
117 exits (+58%)
$6.7 billion (−8%)
19 exits (−35%)
$5.0 billion (−10%)
60 exits (+36%)
$7.9 billion (−29%)
55 exits (−16%)
$9.6 billion (+9%)
42 exits (+16%)
• Record deal activity• Strength in Internet, public-to-private and coinvestment deals• More buyouts• Strong first-half IPO activity
• Record deal activity• Strength in Internet and secondary deals • Increased input from global and regional GPs• Exit overhang trimmed via strong trade and secondary exits
• Record deal activity• Strong participation from SWFs and LPs • Robust IPO exits
• A few large Indonesia deals• Weakness in Malaysia and Singapore• Growing capital overhang• Timid IPO and trade exits
• Significant slowdown after Q1 • Only seven deals above $100 million• Fewer exits, especially secondaries
• Value boosted by $6.3 billion GE Capital buyout• Weak deal flow• Exits strong• Solid rebound in fund-raising
DIVERSE MARKETS, DIFFERENT OUTLOOKS
Shift to control dealsLarge pool of companiesSlower growthCompetition from nontraditional investorsExit and capital overhangSteep Internet valuations
+−
+
+
−
+
++
−
+
+
−
−
+
+
−−
+
+
−
−
−
−
−
−
−
−−
+
Some structural reformsin placeGPs more experienced High valuationsReturns under pressurefrom recent consumer technology/Internet investmentsAdverse currency
Capital flowing in fromglobal investorsRobust deal flow, especiallyin distressed, noncore carve-outs, cash-outsMomentum pressured bymacro uncertaintyPricing and competition up
Corporate distress and shiftto ROE focus producing more divestituresLower public valuationscreating some opportunitiesSome sellers still wary of PEValuations, competition up
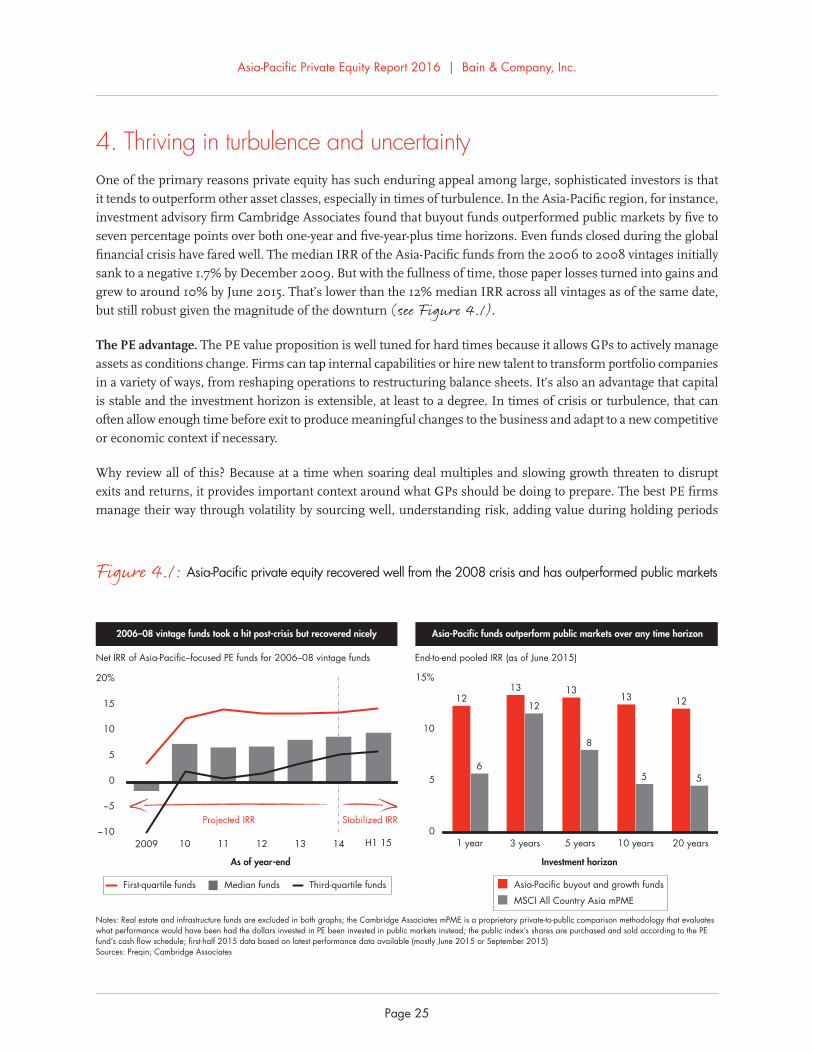
Asia-Pacifi c Private Equity Report 2016 | Bain & Company, Inc.
Page 25
4. Thriving in turbulence and uncertaintyOne of the primary reasons private equity has such enduring appeal among large, sophisticated investors is that
it tends to outperform other asset classes, especially in times of turbulence. In the Asia-Pacifi c region, for instance,
investment advisory fi rm Cambridge Associates found that buyout funds outperformed public markets by fi ve to
seven percentage points over both one-year and fi ve-year-plus time horizons. Even funds closed during the global
fi nancial crisis have fared well. The median IRR of the Asia-Pacifi c funds from the 2006 to 2008 vintages initially
sank to a negative 1.7% by December 2009. But with the fullness of time, those paper losses turned into gains and
grew to around 10% by June 2015. That’s lower than the 12% median IRR across all vintages as of the same date,
but still robust given the magnitude of the downturn (see Figure 4.1).
The PE advantage. The PE value proposition is well tuned for hard times because it allows GPs to actively manage
assets as conditions change. Firms can tap internal capabilities or hire new talent to transform portfolio companies
in a variety of ways, from reshaping operations to restructuring balance sheets. It’s also an advantage that capital
is stable and the investment horizon is extensible, at least to a degree. In times of crisis or turbulence, that can
often allow enough time before exit to produce meaningful changes to the business and adapt to a new competitive
or economic context if necessary.
Why review all of this? Because at a time when soaring deal multiples and slowing growth threaten to disrupt
exits and returns, it provides important context around what GPs should be doing to prepare. The best PE fi rms
manage their way through volatility by sourcing well, understanding risk, adding value during holding periods
Figure 4.1: Asia-Pacifi c private equity recovered well from the 2008 crisis and has outperformed public markets
55
8
12
6
2006–08 vintage funds took a hit post-crisis but recovered nicely Asia-Pacific funds outperform public markets over any time horizon
Net IRR of Asia-Pacific–focused PE funds for 2006–08 vintage funds End-to-end pooled IRR (as of June 2015)
−10
0
5
10
15
20%
−5
2009 10 11 12 13
Projected IRR Stabilized IRR
14 H1 15
As of year-end
0
5
10
15%
1 year
12
3 years
13
5 years
13
10 years
13
20 years
12
Investment horizon
Asia-Pacific buyout and growth funds
MSCI All Country Asia mPME
Median fundsFirst-quartile funds Third-quartile funds
Notes: Real estate and infrastructure funds are excluded in both graphs; the Cambridge Associates mPME is a proprietary private-to-public comparison methodology that evaluates what performance would have been had the dollars invested in PE been invested in public markets instead; the public index’s shares are purchased and sold according to the PE fund’s cash flow schedule; first-half 2015 data based on latest performance data available (mostly June 2015 or September 2015)Sources: Preqin; Cambridge Associates
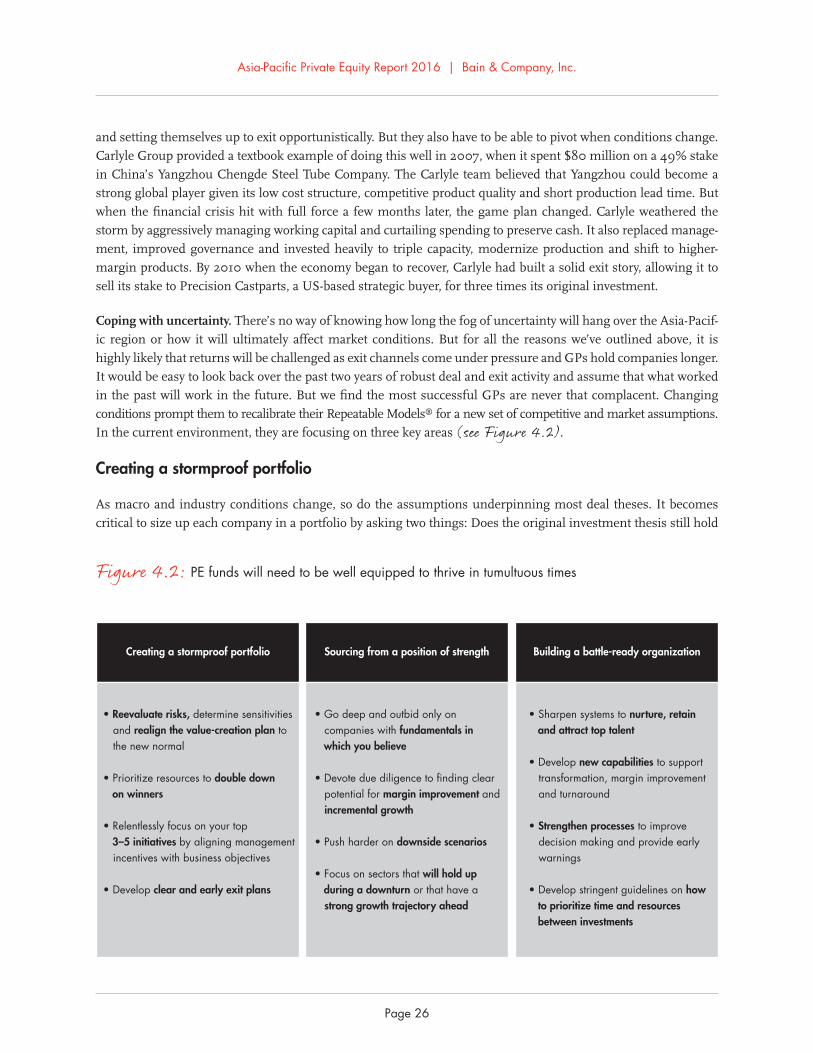
Asia-Pacifi c Private Equity Report 2016 | Bain & Company, Inc.
Page 26
and setting themselves up to exit opportunistically. But they also have to be able to pivot when conditions change.
Carlyle Group provided a textbook example of doing this well in 2007, when it spent $80 million on a 49% stake
in China’s Yangzhou Chengde Steel Tube Company. The Carlyle team believed that Yangzhou could become a
strong global player given its low cost structure, competitive product quality and short production lead time. But
when the fi nancial crisis hit with full force a few months later, the game plan changed. Carlyle weathered the
storm by aggressively managing working capital and curtailing spending to preserve cash. It also replaced manage-
ment, improved governance and invested heavily to triple capacity, modernize production and shift to higher-
margin products. By 2010 when the economy began to recover, Carlyle had built a solid exit story, allowing it to
sell its stake to Precision Castparts, a US-based strategic buyer, for three times its original investment.
Coping with uncertainty. There’s no way of knowing how long the fog of uncertainty will hang over the Asia-Pacif-
ic region or how it will ultimately affect market conditions. But for all the reasons we’ve outlined above, it is
highly likely that returns will be challenged as exit channels come under pressure and GPs hold companies longer.
It would be easy to look back over the past two years of robust deal and exit activity and assume that what worked
in the past will work in the future. But we fi nd the most successful GPs are never that complacent. Changing
conditions prompt them to recalibrate their Repeatable Models® for a new set of competitive and market assumptions.
In the current environment, they are focusing on three key areas (see Figure 4.2).
Creating a stormproof portfolio
As macro and industry conditions change, so do the assumptions underpinning most deal theses. It becomes
critical to size up each company in a portfolio by asking two things: Does the original investment thesis still hold
Figure 4.2: PE funds will need to be well equipped to thrive in tumultuous times
Creating a stormproof portfolio
• Reevaluate risks, determine sensitivities and realign the value-creation plan to the new normal
• Prioritize resources to double down on winners
• Relentlessly focus on your top 3–5 initiatives by aligning management incentives with business objectives
• Develop clear and early exit plans
• Go deep and outbid only on companies with fundamentals in which you believe
• Devote due diligence to finding clear potential for margin improvement and incremental growth
• Push harder on downside scenarios
• Focus on sectors that will hold up during a downturn or that have a strong growth trajectory ahead
• Sharpen systems to nurture, retain and attract top talent
• Develop new capabilities to support transformation, margin improvement and turnaround
• Strengthen processes to improve decision making and provide early warnings
• Develop stringent guidelines on how to prioritize time and resources between investments
Sourcing from a position of strength Building a battle-ready organization
Asia-Pacifi c Private Equity Report 2016 | Bain & Company, Inc.
Page 27
water? And if not, what must be done to maximize value in a new, more diffi cult environment? This is essentially
a repeat of the due diligence process through the lens of economic disruption. It involves reevaluating the risks
emerging from the new macro environment, gaining a fresh understanding of the company’s sensitivities to those
risks and realigning the value-creation plan to thrive in this new normal.
The next step is to prioritize where the fi rm will spend its limited resources. It’s often tempting for PE fi rms to
overinvest in losing deals as they try to steer the company back on track. But thriving in turbulence requires fi rms
to adhere to a simple principle: Double down on the winners and minimize your losses. Where a company ranks
along this spectrum is a function of how much equity is at risk and how much investment is required to drive an
adequate level of value. In our experience, fi rms need to adopt a disciplined, systematic approach to drawing these
priorities if they want to avoid the impulse to throw good money after bad.
With huge piles of unspent capital waiting to be put to work, GPs in the Asia-Pacifi c region are under heavy pressure to fi nd deals and close them. But as rising asset prices collide with slowing economic growth, it is especially critical to approach the market with discipline.
That said, the strength of private equity is that it is patient capital. Firms too often trip up by overreacting to short-
term volatility and lose faith in the fundamentals that attracted them to the company in the fi rst place. Once it
becomes clear which companies should get the most attention, it is time to go to work to bring those fundamentals
to full potential. If conditions have deteriorated rapidly, these companies might need a short-term strategy to help
them ride out the storm—raising cash through balance sheet adjustments or selective cost cutting, for instance,
combined with plans to enhance revenue right away. This will give the fi rm and management time to thought-
fully adjust the longer-term value-creation plan, refocusing management attention by tying incentives to executing
on the top three to fi ve initiatives that will truly make a difference.
The GPs that fi nd the most opportune exits amid diffi cult conditions typically aren’t the benefi ciaries of good timing
or fortune. They have been preparing the company for exit almost from day one so that they can seize the best
opportunity when it arrives. They identify potential buyers early, decide on the most likely timetable for exit and
tailor their value-creation plan accordingly. In effect, they put themselves in a potential buyer’s shoes and ask what
set of value-creation strategies will build the most compelling exit story. Then, when the exit horizon draws near, the
fi rm is ready to optimize in-year EBITDA and cash fl ow to present buyers with the most attractive asset possible.
Sourcing from a position of strength
With huge piles of unspent capital waiting to be put to work, GPs in the Asia-Pacifi c region are under heavy pressure
to fi nd deals and close them. But as rising asset prices collide with slowing economic growth, it is especially critical
to approach the market with discipline. We fi nd that the most effective GPs have internalized a set of capabilities
that allow them to walk the line between taking appropriate risks and paying too much for assets. As macro conditions
become more challenging, successful GPs become more focused on their sweet spot and concentrate on the funda-
Asia-Pacifi c Private Equity Report 2016 | Bain & Company, Inc.
Page 28
mentals they understand and believe in most. That gives them the confi dence to go deep on fewer companies and
build a thesis that allows them to outbid others from a position of greater knowledge and insight. They assess
opportunities for what they really are, not what either wishful thinking or excessive pessimism make them appear
to be.
Macro uncertainty also means that GPs need to push harder on downside scenarios to develop a clear understanding
of what would happen to a company’s value if the worst were to occur. Very often this requires an honest reassessment
of existing capabilities. How well, for instance, does the fi rm really understand the interplay of macroeconomic
and microeconomic factors that affect its portfolios? Few anticipated the black swan plunge in oil prices over the
past year. But the GPs that have avoided the most pain are those that understood in advance how such an event
would affect their companies and were prepared to pull the right levers when the moment came to act.
Most often, however, fi nding the right opportunities as economic growth slows means reorienting the fi rm’s
thinking around what will create value in the new environment. As we’ve noted, many portfolios in the Asia-Pacifi c
region have benefi ted historically from strong tailwinds that propelled organic revenue growth. Without that
macro support, premium value will more often come from performance improvement. That might mean ferreting
out ways to zero-budget aspects of production or the supply chain to fi nd effi ciencies that boost margins. It could
involve expanding the topline via M&A or adding capabilities to take advantage of an untapped market adjacency.
Cost reduction is rarely enough to produce a winner on its own. But combining margin improvement with revenue
expansion can be a powerful way to counteract economic malaise.
Macro uncertainty means that GPs need to push harder on downside scenarios to develop a clear understanding of what would happen to a company’s value if the worst were to occur. Very often this requires an honest reassessment of existing capabilities. How well, for instance, does the fi rm really understand the interplay of macroeconomic and microeconomic factors that affect its portfolios?
As we pointed out in Section 3, it can also make a big difference to scout deals in key sectors where growth is
likely to hold up even as macro conditions deteriorate. Our view is that GPs need to be disciplined in such situations—
it can be perilous to drift too far from the fi rm’s sweet spot in pursuit of seemingly attractive sectors. But fi rms
with a clear understanding of industry dynamics and a strong deal thesis can fi nd value and growth amid even the
worst conditions. A good example is Sequoia Capital’s $23 million investment in India’s Prizm Payment Services,
with $15 million committed in 2008. Prizm deploys and operates point-of-sale and ATM-based payment systems
for banks and fi nancial services companies. Convinced that there was a gap between the demand and supply of
ATMs and sensing the potential to substantially increase the company’s footprint, Sequoia’s team decided to back
Prizm, which was perfectly positioned to take advantage of the growing use of debit and credit cards in India.
Amid a global fi nancial crisis, Sequoia provided capital and expertise to help make it happen and focused early on
crafting a clear exit strategy. When Japan’s Hitachi came looking for an entry to India’s burgeoning fi nancial services
market in 2013, it latched onto Prizm, offering a multiple of fi ve times Sequoia’s initial investment.
Asia-Pacifi c Private Equity Report 2016 | Bain & Company, Inc.
Page 29
Building a battle-ready organization
What we’ve been talking about in the previous two sections is portfolio activism—the need for PE fi rms to create
their own tailwind instead of relying on economic expansion to propel returns. Most of the GPs we surveyed recognize
the growing importance of adding heft in this area. Today, 41% of the GPs in our survey use an internal team to
manage post-acquisition value creation for almost all their companies, and more than half said they would do so
over the next three to fi ve years. Moreover, 55% employ external help for more than half their companies, and that
number should grow to 73% in the coming years. As we noted, however, strong execution is another matter: Only
a small minority of fi rms believe that they execute as planned on value creation. Most often, in other words, the
resources put in place to boost value aren’t doing the job.
There is no right model for improving the fi rm’s ability to execute more consistently. But all successful efforts
begin with attracting, retaining and nurturing top talent to drive the effort forward. That requires doubling down
on efforts to identify, elevate and retain star talent both within the fi rm and at portfolio companies. But it also
means assessing what skills will be needed to thrive in the new normal and building those capabilities either
internally or by tapping specialized external resources.
Only a small minority of fi rms believe that they execute as planned on value creation. Most often, the resources put in place to boost value aren’t doing the job.
Transforming companies to thrive in a more diffi cult environment, for instance, may require procurement specialists
to rework the sourcing strategy or experts in salesforce effectiveness who can put in systems to boost the topline.
CVC Capital Partners has addressed this issue by creating an operations team to work with existing deal and
capital markets teams to set up a structured value-creation approach within its portfolio companies. Other fi rms
have achieved a similar result by using a mix of inside and outside resources.
In our experience, PE funds also have to look at how they make decisions, starting with the investment committee (IC).
Too often, the fi rm lacks a full understanding of how macro and competitive dynamics will affect portfolio companies.
They need to assess whether they have the proper processes in place to bring the people with key knowledge and
insights into decisions. They should ask whether the committee is meeting often enough and using the right data
to assess performance. Once investments are made, the IC needs stringent guidelines to ensure that the fi rm is
allocating resources to the portfolio companies with the highest potential to produce market-beating returns.
The best GPs take a forensic approach to their past investments to diagnose what led to success and what produced
failure. They can then build decision tools based on those factors to force deal teams to assess how prospective
acquisitions stack up. They also use this knowledge to create proprietary performance metrics to help track portfolio
companies and provide early warning signs before an investment veers too far off course. The result is that the
fi rm can take a proactive approach to value creation, confi dent that deal teams have a solid handle on the risks and
opportunities ahead. The objective is to dial up the fi rm’s intelligence and market radar to ensure more consistent
market-beating results.

Asia-Pacifi c Private Equity Report 2016 | Bain & Company, Inc.
Page 30
5. Are your value-creation capabilities tuned for a new normal? A year ago in this space we made the observation that the most successful PE fi rms around the world share a key
trait: They quickly transition from thinking as acquirers to acting as value creators. As Asia-Pacifi c growth slows,
this has never been a more essential attribute. In fact, we would argue that the best acquirers in many ways are
value creators. The clarity of their insights, the quality of their due diligence and the discipline with which they
price assets all represent the initial steps in mobilizing the right value-creation strategy and executing on it. As we
did last year, we’d like to end this report with a set of questions designed to help fi rms that are preparing for a more
challenging future assess where they stand in terms of value-creation capabilities. These questions will also help
fi rms consider how they might adjust their priorities to build more sustainable performance.
Have you stormproofed your portfolio?
• Do you understand how the new normal will affect your current holdings?
• Is there consensus among your deal and operating partners about which portfolio companies have the potential
to go from good to great?
• Does your fi rm back those companies with suffi cient resources to help them become big winners?
• Are company management and operating partners aligned on the short list of priority initiatives that will
really move the needle on equity value creation?
• Do you have clear exit plans in place to help maximize your returns?
Are you sourcing from a position of strength?
• Do you relentlessly focus on your sweet spot and outbid only on companies with fundamentals that you
understand and believe in?
• Do you have a clear understanding of how the sectors you invest in will hold up during a downturn and how
those risks will affect your companies?
• Does your due diligence produce clarity on opportunities for incremental growth, margin improvement and
downside risks?
Are you building a battle-ready organization?
• Has your fi rm developed the internal capabilities or a network of specialists that it can call on to help produce
margin improvement or turnaround initiatives at portfolio companies?
• Does your investment committee have processes in place to drive more informed, consistent decision making?
• Does your fi rm have stringent guidelines about how to prioritze time and resources?
• Have you sharpened your HR systems to ensure that you are nurturing your key people and attracting the
best talent from outside the fi rm?

Asia-Pacifi c Private Equity Report 2016 | Bain & Company, Inc.
Page 31
As we’ve stressed throughout this report, there’s little doubt that the Asia-Pacifi c private equity industry will be
challenged to repeat 2015’s performance in the coming years. Yet we’re more than confi dent that the best fi rms
will adapt and thrive amid slower growth and fi erce competition. Over the past several years, PE has proven its
value to both company owners in the region and global investors looking for a potent source of superior investment
returns. But make no mistake—the market will continue to reward only those fi rms that can adjust to the Asia-
Pacifi c region’s new normal to produce consistent, market-beating performance.
Asia-Pacifi c Private Equity Report 2016 | Bain & Company, Inc.
Page 32
Market defi nition
The Asia-Pacifi c private equity market as defi ned for this report
Includes
• Investments and exits with announced values of more than $10 million
• Investments and exits completed in the Asia-Pacifi c region: Greater China (China, Taiwan and Hong Kong), India, Japan, South Korea, Australia, New Zealand, Southeast Asia (Singapore, Indonesia, Malaysia, Thailand, Vietnam, the Philippines, Laos, Cambodia, Brunei and Myanmar) and other countries in the region.
• Investments that have closed and those at the agreement-in-principle or defi nitive agreement stage
Excludes
• Franchise funding, seed and R&D deals
• Any non-PE, non-VC deals (e.g., M&A, consolidations)
• Real estate and infrastructure (e.g., airport, railroad, highway and street construction; heavy construction; ports and containers; and other transport infrastructure)
This work is based on secondary market research, analysis of fi nancial information available or provided to Bain & Company and a range of interviews with industry participants. Bain & Company has not independently verifi ed any such information provided or available to Bain and makes no representation or warranty, express or implied, that such information is accurate or complete. Projected market and fi nancial information, analyses and conclusions contained herein are based on the information described above and on Bain & Company’s judgment, and should not be construed as defi nitive forecasts or guarantees of future performance or results. The information and analysis herein does not constitute advice of any kind, is not intended to be used for investment purposes, and neither Bain & Company nor any of its subsidiaries or their respective offi cers, directors, shareholders, employees or agents accept any responsibility or liability with respect to the use of or reliance on any information or analysis contained in this document. This work is copyright Bain & Company and may not be published, transmitted, broadcast, copied, reproduced or reprinted in whole or in part without the explicit written permission of Bain & Company.
Key contacts in Bain’s Global Private Equity practice
Global: Hugh MacArthur ([email protected])Asia-Pacifi c: Suvir Varma ([email protected]) Australia: Simon Henderson ([email protected]) Greater China: Weiwen Han ([email protected]) and Kiki Yang ([email protected]) India: Arpan Sheth ([email protected]) Japan: Jim Verbeeten ([email protected]) Korea: Wonpyo Choi ([email protected]) Southeast Asia: Sebastien Lamy ([email protected]) Europe, Middle East and Africa: Graham Elton ([email protected])Americas: Daniel Haas ([email protected])
Reporters and news media: Please direct requests toDan Pinkney [email protected]: +1 646 562 8102
Acknowledgments
This report was prepared by Suvir Varma, a Bain & Company partner based in Singapore who leads the fi rm’s Asia-Pacifi c Private Equity practice; Madhur Singhal, a partner based in Mumbai and a member of Bain’s India Private Equity practice; and a team led by Johanne Dessard, practice area director of Bain’s Asia-Pacifi c Private Equity practice.
The authors wish to thank Vinit Bhatia, Michael Thorneman, Weiwen Han, Kiki Yang, Sebastien Lamy, Usman Akhtar, Arpan Sheth, Srivatsan Rajan, Wonpyo Choi, Jim Verbeeten, Simon Henderson and Nic Di Venuto for their con-tributions; Rahul Singh for his analytic support and research assistance; and Michael Oneal for his editorial support.
We are grateful to Preqin and Asian Venture Capital Journal (AVCJ) for the valuable data that they provided and for their responsiveness.

For more information, visit www.bain.com
Shared Ambit ion, True Re sults
Bain & Company is the management consulting fi rm that the world’s business leaders come to when they want results.
Bain advises clients on strategy, operations, technology, organization, private equity and mergers and acquisitions. We develop
practical, customized insights that clients act on and transfer skills that make change stick. Founded in 1973, Bain has 53 offi ces
in 34 countries, and our deep expertise and client roster cross every industry and economic sector. Our clients have outperformed
the stock market 4 to 1.
What sets us apart
We believe a consulting fi rm should be more than an adviser. So we put ourselves in our clients’ shoes, selling outcomes, not
projects. We align our incentives with our clients’ by linking our fees to their results and collaborate to unlock the full potential
of their business. Our Results Delivery® process builds our clients’ capabilities, and our True North values mean we do the right
thing for our clients, people and communities—always.