Embed Size (px)
Citation preview
Asia Pacific Journal of Research in Business Management Vol. 8, Issue 7, July 2017 Impact Factor: 5.16, ISSN: (2229-4104)
www.skirec.org Email Id: [email protected]
An International Double-Blind, Peer Reviewed, Refereed Open Access Journal - Included in the International Indexing Directories
Page 32
A STUDY OF INVESTOR’S BEHAVIOR TOWARDS VARIOUS INVESTMENT AVENUES IN
WARANGAL CITY
Dr. P. Amaraveni
Asst. Professor, Department of Commerce & Business Management,
Kakatiya University, Warangal, Telangana State
Mrs M Archana
Ph.D. Research Scholar, Department of Commerce & Business Management,
Kakatiya University, Warangal
ABSTRACT
In this modern era, money plays an important role in one’s life. In order to overcome the problems
in future they have to invest their money. There are a lot of investment choices such as bank, Gold,
Real estate, post office services, mutual funds and one must select the most appropriate one.
Savings of the people are invested in assets depending on their risk and return demands, Safety of
money, Liquidity, the available avenues for investment, from various financial institutions, etc.
Investors are investing their surplus money with the different objectives such as profit, security,
returns and Income stability etc.
The objective of the study is to determine the various alternative investments and the factors while
selecting the investment avenues and relationship between the savings and investment patterns
among preferred investor’s behaviour towards investment Avenues of the individual investors of
Warangal city by different age group. The data collected through structured questionnaire
administered to 100 respondents working in different sectors at Warangal city. It was found from
the analysis that there is relationship between Annual Savings and Age, Income, Sector wise
Employment, Education of people at Warangal city. Analysis has been done through various
statistical tools i.e., simple percentages, ranking and Chi Square test etc. The majorities of the
respondents are prefer first priority by Insurance and Pension Schemes and main purpose of
investment is that steady income and earn high return within short period.
KEY WORDS: Annual Income, Savings, Demographic factors, Investment avenues, Investor’s
Behaviour, Dimensions of Investment Choices, Awareness of Investment Options.

Asia Pacific Journal of Research in Business Management Vol. 8, Issue 7, July 2017 Impact Factor: 5.16, ISSN: (2229-4104)
www.skirec.org Email Id: [email protected]
An International Double-Blind, Peer Reviewed, Refereed Open Access Journal - Included in the International Indexing Directories
Page 33
INTRODUCTION
Investment is the employment of funds with the aim of getting return on it. In general terms,
investment means the use of money for hope of making more money. Investment refers to the
concept of deferred consumption, which involves purchasing of an asset, giving a loan or keeping
funds in a bank account with the aim of generating future returns. Investment is the commitment of
funds which have been saved from current consumption with the hope that some benefits will be
received in future. Thus, it is a reward for waiting for money. Investment is putting money into an
asset with the expectation of capital appreciation, dividends, or interest earnings.
There are two types of investments such as economic investment and financial investment.
Economic investment means addition to the capital stock of the society which is used in the
production of other goods such as formation of new and productive capital in the form of new
construction and producer’s durable instrument such as plant and machinery, inventories and
human capital.
Financial Investment is an allocation of monetary resources to assets that are expected to yield
some gain or return over a given period of time. It means an exchange of financial claims such as
shares and bonds, real estate, etc. People invest their funds in shares, debentures, fixed deposits,
national saving certificates, life insurance policies, provident fund etc. Investment is a commitment
of funds to derive future income in the form of interest, dividends, rent, premiums, pension benefits
and the appreciation of the value of their principal capital.
The “Investor” can be an individual, a government, a pension fund, or a corporation and in all cases,
the investor is trading a known rupee amount today for some expected future stream of payments
that will be greater than the current outlay.
All personal investing is designed in order to achieve certain objectives i.e., may be tangible such as
buying a car, house etc. and intangible objectives such as social status, security etc. similarly, these
objectives may be classified as financial or personal objectives. Financial objectives are safety,
profitability, and liquidity. Personal or individual objectives may be related to personal
characteristics of individuals such as family commitments, status, dependents, educational
requirements, income, consumption and provision for retirement etc. Elements of investments are
Risk and Return relationship, Time, Liquidity, Tax savings. Diversification of funds is an important
principle of investment for earning higher rate of interest.
INVESTMENT ALTERNATIVES
Investment alternatives are available into two broad categories, viz, financial assets and real assets.
Financial assets are paper (or electronic) claim on some issues such as the government or a
Asia Pacific Journal of Research in Business Management Vol. 8, Issue 7, July 2017 Impact Factor: 5.16, ISSN: (2229-4104)
www.skirec.org Email Id: [email protected]
An International Double-Blind, Peer Reviewed, Refereed Open Access Journal - Included in the International Indexing Directories
Page 34
corporate body. The important financial assets are equity shares, corporate debentures, government
securities, and deposit with banks, post office schemes, mutual fund shares, insurance policies, and
derivative instruments. Real assets are represented by tangible assets like residential house,
commercial property, agricultural farm, gold, precious stones, and art. As the economy advances,
the relative importance of financial assets tends to increase.
Investors are free to select any one or more alternative avenues depending upon their needs. All
categories of investors are equally interested in safety, liquidity and reasonable return on the funds
invested by them. In India, investment alternatives are continuously increasing along with new
developments in the financial market. Investment is now possible in corporate securities, public
provident fund, mutual fund etc. Thus, wide varieties of investment avenues are now available to
the investors.
The investor has to choose Proper Avenue depending upon his specific need, risk preference, and
returns expected. Different avenues are:
i. Safe/Low Risk Avenues: Savings Account, Bank Fixed Deposits, Public Provident fund,
Government Securities, etc.
ii. Moderate Risk Avenues: Mutual Funds, Life Insurance, Debentures, Bonds.
iii. High Risk Avenues: Equity Share Market, Commodity Market, FOREX Market.
iv. Traditional Avenues: Real Estate (property), Gold/Silver, Chit Funds.
v. Emerging Avenues: Virtual Real Estate, Hedge Funds/Private Equity Investments, Art.
ELEMENTS OF INVESTMENTS
The Elements of Investments are as follows:
i. Return: Investors has expectations of additional income in order to gain returns in the form of
both current income and capital gain or loss which arises by the increase or decrease of the
security price. Based on investors’ expectations, the investors can decide whether they want
more investments into various investment avenues.
ii. Safety & Security: Safety & Security refers to the protection of investor principal amount and
expected rate of return from their investments against financial risks at all times. Investors
always prefer safety about him/her capital.
iii. Risk: Risk is the chance of loss i.e., interest, dividend or principal amount due to variability of
returns on an investment. The principles of risks and reward are inseparable. Generally higher
risk may mean a potentially higher reward, while a lower risk will mean a lower reward. The
ability of risk tolerance differs from one investor to another. It depends on several factors such
as the individual financial responsibilities, environment, basic personality, life cycle etc.
Asia Pacific Journal of Research in Business Management Vol. 8, Issue 7, July 2017 Impact Factor: 5.16, ISSN: (2229-4104)
www.skirec.org Email Id: [email protected]
An International Double-Blind, Peer Reviewed, Refereed Open Access Journal - Included in the International Indexing Directories
Page 35
Therefore, understanding the investor’s capacity to take on risk becomes a crucial factor in
investment decision making.
iv. Liquidity: Liquidity refers to the ability of an investment ready to convert in the form of cash.
Liquidity means that investment is easily realizable, saleable or marketable. Generally an
investor’s prefer safety and high liquidity for his/her investment with minimum risk and
maximum returns. When the liquidity is high, the return may be low.
v. Tax Saving: The investors should get the benefit of tax exemption from the investments, which
provide tax exemption to the investor. The tax saving investments increases the return on
investment. Therefore, the investors should also think of saving income tax and invest money in
order to maximize the return on investment.
vi. Past market trends: Sometimes history repeats itself sometimes investor’s learning from their
mistakes. The investors need to understand how various asset classes have performed in the
past before planning for their finances.
vii. Investment horizon: It is the period that the investor can keep his money invested. The time
period depends on the attitude of the investor who follows a ‘buy and hold’ policy. The longer
the time-horizon, the greater are the returns that should be accepted. Further, the risk element
reduces with time.
viii. Investible surplus: It is basically refers to how much money the individual able to keep aside for
investments.
ix. Investment need: It refers to how much money does the investor needs at the time of maturity.
This helps the investor to determine the amount of money that they need to invest every month
or year to reach the magic figure.
x. Lifestyle: Investors want to ensure that their assets can meet their financial needs over their
lifetimes.
xi. Value for money: Investors want to minimize the costs of managing their assets and their
financial needs.
xii. Peace of mind: Investors do not want to worry about the day to day movements of markets and
their present and future financial security. Achieving the sum of these objectives depends very
much on the investor having all their assets and needs managed centrally, with portfolios
planned to meet lifetime needs, with one overall investment strategy ensuring that the
disposition of assets will match individual needs and risk preferences.

Asia Pacific Journal of Research in Business Management Vol. 8, Issue 7, July 2017 Impact Factor: 5.16, ISSN: (2229-4104)
www.skirec.org Email Id: [email protected]
An International Double-Blind, Peer Reviewed, Refereed Open Access Journal - Included in the International Indexing Directories
Page 36
Behavioural Influences on Savings & Investments:
The principal objective of an investment is to make money. In the early years, investment was based
on performance, forecasting, market timing and there was also a huge gap between available
returns and actually received returns which forced them to search for the reasons. They committed
fundamental mistakes in the decision-making process. In other words, they make irrational
investment decisions. In recognizing these mistakes and means to avoid them, to transform the
quality of investment decisions and results, they realized the impact of several cognitive and
psychological errors psychology in investment decisions. Several years ago, the researchers began to
study the field of Behavioral Finance to understand the psychological processes driving these
mistakes. Behavioral finance attempts to identify the behavioral biases commonly exhibited by
investors and also provides strategies to overcome them.
Thus, behavioral finance is the application of scientific research on the psychological, social and
emotional contributions to market participants and market price trends. It also studies the
psychological and sociological factors that influence the financial decision making process of
individual groups and entities. The field of “behavioral finance” has evolved that attempts to better
understand and explain how emotions and cognitive errors influence investors and the decision-
making process. Every investor differs from the others in all aspects due to various factors like
demographic factor, socioeconomic background, educational level, sex, age and race. An optimum
investment decision plays an active role and is a significant consideration. Investor is a rational being
who will always act to maximize his financial gain.
Investors’ have to develop a positive vision, foresight, perseverance and drive. Every investor differ
from others in all aspects due to various factors like demographic factors which includes socio-
economic background, educational attainment level, age, race and sex. The most crucial challenge
faced by the investors is in the area of investment decisions. An optimum investment decision plays
an active role and is a significant consideration. In designing the investment portfolio, the investor
should consider their financial goals, risk tolerance level, and other constraints.
Investment behavior refers to the attitudes perception of the individuals and institutions in placing
their savings in various types of financial assets, more commonly known as securities. An investor is
a person who scarifies the present in order to reap the benefits for the future. The benefits may be
in the form of capital appreciation, income in the form of dividends, bonus, retirement benefits and
many other benefits. The objectives of the investor may be as follows:
1. To minimize the risk
2. To maximize the returns
Asia Pacific Journal of Research in Business Management Vol. 8, Issue 7, July 2017 Impact Factor: 5.16, ISSN: (2229-4104)
www.skirec.org Email Id: [email protected]
An International Double-Blind, Peer Reviewed, Refereed Open Access Journal - Included in the International Indexing Directories
Page 37
3. To hedge against inflation
4. Liquidity
5. To Tax benefits.
REVIEW OF LITERATURE
D. S. Chaiubey and Rajat P.Dimri (2009) in their research article, “Investment Pattern: A
Psychographic Study of Investors of Garhwal Region of Uttrakhand” identify the investment
perceptions and their behavior for designing effective investment policies. Analysis indicates the
shifting trend of investors from post office and other government investment schemes to
investments in banks, mutual funds and equity etc.
Mehta and Aggarwal (2011) observed that there is association of demographic profiles and
personality type of investor with investment choice. The differences among genders were found to
be significant for provident funds, fixed deposits, and real estate. Females were found more
conservative than males. The investors in the higher age groups preferred post office as an
investment option compared to the investors in the lower age groups. Most of the investors
preferred to consult their family members for making investment.
Sanjay Kanti Das (2012) summarized that the bank deposits remain the most popular instrument of
investment followed by insurance and small saving scheme to get benefit of safety and security of
their life and investment. It was found that there is a need for increasing the financial literacy among
the middle class households.
Lalit Mohan Kathuria & Kanika Singhania (2012) concluded that private sector banking employees
were investing a larger portion of their savings into safe and risk-free investment avenues, like
employee provident fund, public provident fund and life insurance policy and only forty per cent of
the respondents had high level of awareness regarding various investment avenues.
Securities and Exchange Board of India (SEBI) and NCEAR (2000) ‘Survey of Indian Investors’ had
been report that Safety and Liquidity were the primary considerations which determined the choice
of an asset. In this paper we are trying to find out the Factors which influence individual investment
decision, the difference in the perception of Investors in the investing process on the basis of Age
and the difference in perception of the Investors on the basis of Gender.
Age and stage of the population will also affect the fraction of aggregate income spent (Fisher J,
1952). Both ends of the age distribution, the old and the young tend to spend a higher proportion of
their incomes than those in the middle do. The savings-income ratio is small for younger groups,
high for middle age groups, and again low among old age groups (Ashok Kumar, et al, 1985).
Asia Pacific Journal of Research in Business Management Vol. 8, Issue 7, July 2017 Impact Factor: 5.16, ISSN: (2229-4104)
www.skirec.org Email Id: [email protected]
An International Double-Blind, Peer Reviewed, Refereed Open Access Journal - Included in the International Indexing Directories
Page 38
Kumar Singh (2006) analyse the investment pattern of people in Bangalore city and Bhubaneswar
analysis of the study was undertaken with the help of survey conducted. It is concluded that in
Bangalore investors are more aware about various investment avenues and the risk associated with
that. And in Bhubaneswar, investors are more conservative in nature and they prefer to invest in
those avenues where risk is less like bank deposits, small savings, post office savings etc.
A study of investor behavior on investment avenues in Mumbai Fenil was undertaken by
Brahmabhatt, P.S Raghu Kumari, and Dr. Shamira Malekar. In this study they analysed the investor
behavior and their preferences. The objectives for their study were to understand about various
investment avenues available in the market, to understand the pattern of investors while making the
investments, & to find out the factors that investors consider before investing. Through their study it
was revealed that people like to invest in stock market. The percentages of income they make as
investment depend on their annual income.
A study on people's preference in investment behavior was made by N. Geetha & Dr M. Ramesh.
The objectives were to analyse the factor that influence investment behavior of the people & to
study the attitude of the respondents towards different investment choices. In this study they
concluded that the respondents were medium aware of the available investment choices, but they
were not aware of the stock market, equity & debentures.
OBJECTIVES
i. The main objective of the present study is to determine the various alternative investments and
the factors that influence the investment decisions.
ii. To know the investor’s behavior towards investment avenues.
iii. To study the elements of investments.
iv. To examine the behavioral influences of investors on savings and investments.
v. To analyse the investors preferences and income wise preferences and age wise preference for
investment avenues.
vi. To find out the objectives behind the investments.
SCOPE OF THE STUDY
In today’s competitive environment a lot of investment avenues are being provided by various Public
and private financial organizations, people are totally confused to decide where to make an
investment. The present study was mainly focuses to understand the awareness level of the people
on various investment opportunities from various financial institutions, factors considered for
investment, and also to understand behavior of investors in gaining a better understanding of what
an investor look for in investment avenues. This study aims to gain knowledge about key factors that

Asia Pacific Journal of Research in Business Management Vol. 8, Issue 7, July 2017 Impact Factor: 5.16, ISSN: (2229-4104)
www.skirec.org Email Id: [email protected]
An International Double-Blind, Peer Reviewed, Refereed Open Access Journal - Included in the International Indexing Directories
Page 39
influence investment behavior and ways these factors impact investment risk tolerance and decision
making process among men and women and among different age groups.
RESEARCH METHODOLOGY
The study was based on primary data as well as secondary data. Primary data collected by
administering a questionnaire on 100 respondents of working population of Warangal City. Since the
aim of the survey is to allow every person to list his/her opinion about investment avenues.
Secondary data collected from various books, Journals, magazines & websites etc. In order to
analyse the collected data, Simple percentages, ranks and Chi Square test were used.
The Personal Factors such as gender, qualification and work status, and income and life stage are
analysed through a structured questionnaire. The behavioral factors of the investors such as
emotional risk tolerance, financial literacy level and various other factors have been analysed.
LIMITATIONS OF THE STUDY
i. The Sample size was very limited to 100 Investors it may or may not be represented with the
entire population.
ii. The study have been conducted to analyse some factors effecting investment behavior of
investors
iii. The survey is conducted only in Warangal City. So, it provides idea of that particular regions’
investment pattern and their preference only.
iv. Scope of the study is limited to the selected investment instruments only.
DATA ANALYSIS AND INTERPRETATION
DEMOGRAPHIC INFORMATION
The demographic profile of the sample respondent constitutes a significant component in
understanding their social structure. The variables that relate to structural position of the
respondents are age, education, occupation, income, savings and investments. The age analysis
helps in classifying the investors to indicate existing population structure of the sample area.
Education affects employment chances and values of the investors towards society. Occupation
reflects the change from primary to new and traditional ones. The ever changing scenario with
regard to income, expenditure, saving reflects changes in standard of living of the respondents and
quality of life.
Asia Pacific Journal of Research in Business Management Vol. 8, Issue 7, July 2017 Impact Factor: 5.16, ISSN: (2229-4104)
www.skirec.org Email Id: [email protected]
An International Double-Blind, Peer Reviewed, Refereed Open Access Journal - Included in the International Indexing Directories
Page 40
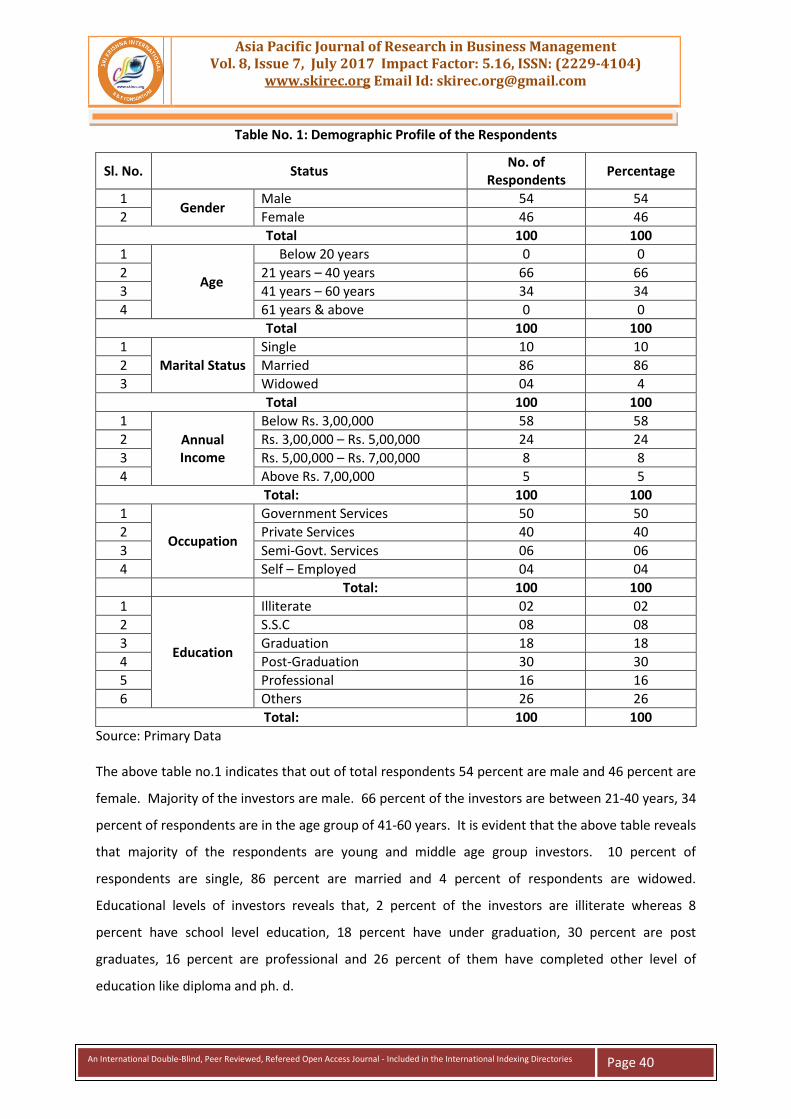
Table No. 1: Demographic Profile of the Respondents
Sl. No. Status No. of
Respondents Percentage
1 Gender
Male 54 54
2 Female 46 46
Total 100 100
1
Age
Below 20 years 0 0
2 21 years – 40 years 66 66
3 41 years – 60 years 34 34
4 61 years & above 0 0
Total 100 100
1
Marital Status
Single 10 10
2 Married 86 86
3 Widowed 04 4
Total 100 100
1
Annual Income
Below Rs. 3,00,000 58 58
2 Rs. 3,00,000 – Rs. 5,00,000 24 24
3 Rs. 5,00,000 – Rs. 7,00,000 8 8
4 Above Rs. 7,00,000 5 5
Total: 100 100
1
Occupation
Government Services 50 50
2 Private Services 40 40
3 Semi-Govt. Services 06 06
4 Self – Employed 04 04
Total: 100 100
1
Education
Illiterate 02 02
2 S.S.C 08 08
3 Graduation 18 18
4 Post-Graduation 30 30
5 Professional 16 16
6 Others 26 26
Total: 100 100
Source: Primary Data
The above table no.1 indicates that out of total respondents 54 percent are male and 46 percent are
female. Majority of the investors are male. 66 percent of the investors are between 21-40 years, 34
percent of respondents are in the age group of 41-60 years. It is evident that the above table reveals
that majority of the respondents are young and middle age group investors. 10 percent of
respondents are single, 86 percent are married and 4 percent of respondents are widowed.
Educational levels of investors reveals that, 2 percent of the investors are illiterate whereas 8
percent have school level education, 18 percent have under graduation, 30 percent are post
graduates, 16 percent are professional and 26 percent of them have completed other level of
education like diploma and ph. d.

Asia Pacific Journal of Research in Business Management Vol. 8, Issue 7, July 2017 Impact Factor: 5.16, ISSN: (2229-4104)
www.skirec.org Email Id: [email protected]
An International Double-Blind, Peer Reviewed, Refereed Open Access Journal - Included in the International Indexing Directories
Page 41
58 percent of investors income levels of below Rs. 3,00,000 per annum, 24 percent of the investors
have annual income between Rs. 3,00,000 – Rs. 5,00,000, 8 percent of investors have annual income
level between Rs. 5,00,000 – Rs. 7,00,000 and 5 percent have an income above Rs. 7,00,000. Out of
100 respondents, nearly 50 percent of investors are in Government services, whereas 6 percent of
investors are doing their own business, 40 percent are private employees and 4 percent are semi –
government service employees.
INVESTOR’S PREFERENCES FOR THE INVESTMENT AVENUES: Table 2 shows the preference of
sample respondents in percentage on the basis of the main avenues of Investment as Bank Deposits,
Post Office, Land and Building, Gold/Silver, Mutual Funds etc.
Table No. 2: Investor’s preferences for the Investment Avenues
Rank Bank / Post
office Schemes Insurance /
Pension Schemes Share market / Mutual funds
Real Estate
Bullions / Ornaments
1 31% 40% 10% 14% 5%
2 32% 27% 6% 11% 24%
3 23% 27% 9% 9% 32%
4 24% 18% 12% 29% 17%
5 17% 8% 33% 17% 25%
Source: Primary Data
The data provided in table No.2 revealed that 40 percent investors preferred their first priority of
investment is insurance product, 32 percent investors select bank deposits as a second preferable
investment avenue, Bullion market was preferred by 32 percent respondents as a third choice for
their investment, 29 percent of respondents select real estate and 33 percent respondents select
share market are least preferred investment avenue among sample investors.
INCOME WISE PREFERENCES FOR INVESTMENT AVENUE: Table 3 provides information about
preferences and choice to particular investment opportunity by income, sample respondents are
classified in four income classes i.e., Below Rs. 3,00,000, Rs. 3,00,000 – Rs. 5,00,000, Rs. 5,00,000 –
Rs. 7,00,000 and Above Rs. 7,00,000.
Table No. 3: Income wise preferences for Investment Avenue
Sl. No.
Annual Income
Bank / Post
office Deposits
Insurance & Pensions Schemes /
Share Market / Mutual funds
Real Estate
Bullions / Ornaments
1 Below Rs. 3,00,000 38 26 10 10 20
2 Rs. 3,00,000 – Rs. 5,00,000 18 30 10 6 16
3 Rs. 5,00,000 – Rs. 7,00,000 8 18 - 10 8
4 Above Rs. 7,00,000 6 12 - 6 6
Source: Primary Data

Asia Pacific Journal of Research in Business Management Vol. 8, Issue 7, July 2017 Impact Factor: 5.16, ISSN: (2229-4104)
www.skirec.org Email Id: [email protected]
An International Double-Blind, Peer Reviewed, Refereed Open Access Journal - Included in the International Indexing Directories
Page 42
CHI-SQUARE TEST
Chi-square test is applied in statistics to test the goodness of fit to verify the distribution of observed
data with assumed theoretical distribution. Therefore it is a measure to study the divergence of
actual and expected frequencies. It is commonly used to compare observed data with data we would
expect to obtain according to a specific hypothesis framed earlier. To study the relationship between
the annual income and preference of Investment Avenue of the respondents, the Chi-square test has
been applied.
(O-E) 2
Chi-square test (χ2) = ------------
E
O= Observed frequency, E= Expected frequency, Df = Degree of Freedom
Df= (r-1) (c-1) (R= row, C= column)
NULL HYPOTHESIS: There is no significant relationship between annual income of the respondents
and the preference of Investment Avenue.
Results of Chi Square test
Degree of Freedom 12
Table value at 5 percent level 21.0
Calculated value 23.33
Since the calculated Chi Square value is greater than the table value at 5 percent level of
significance, the null hypothesis is rejected. Hence there is a significant relationship between annual
income of the respondents and their preferences for investment avenues.
AGE WISE PREFERENCES FOR INVESTMENT AVENUE: Table 4 provides information of respondent’s
choice of investment by age, sample respondents are categorized by four below 20 years, 21years –
40 years,
41 years – 60 years, 61& above years.
Table No. 4: Age wise preferences for Investment Avenue
Sl. No.
Age Bank / Post office Deposits
Insurance & Pensions Schemes /
Share Market / Mutual funds
Real Estate
Bullions / Ornaments
1 Below 20 years - - - - -
2 21 years – 40 years 44 46 14 18 30
3 41 years – 60 years 26 32 4 16 22
4 61 years & above - - - - -
Source: Primary Data

Asia Pacific Journal of Research in Business Management Vol. 8, Issue 7, July 2017 Impact Factor: 5.16, ISSN: (2229-4104)
www.skirec.org Email Id: [email protected]
An International Double-Blind, Peer Reviewed, Refereed Open Access Journal - Included in the International Indexing Directories
Page 43
To study the relationship between the age and preference of Investment Avenue of the
respondents, the Chi-square test has been applied.
NULL HYPOTHESIS: There is no significant relationship between age of the respondents and their
preference of Investment Avenue.
Results of Chi Square test
Degree of Freedom 4
Table value at 5 percent level 9.4
Calculated value 8.41
Since the calculated Chi Square value is less than the table value at 5 percent level of significance,
the null hypothesis is accepted. Hence there is no significant relationship between age of the
respondents and their preferences for investment avenues.
OBJECTIVES OF INVESTMENT: Various objectives are motivates investors to invest their surplus
income in different available avenues according to their preference, comfort ability and risk
tolerance capacity. Table 5 shows responses of sample investor towards different type objectives
which have high emotional importance for investor.
Table No. 5: Objectives of Investment
Sl. No. Variables Percentage of Respondents
1 Short term profit seeking / steady income 27
2 Long term profit seeking / freedom from risk 21
3 Tax benefits 16
4 Future security 15
5 Others ( Education, Marriage, Emergencies) 21
Total: 100
Source: Primary Data
The above table reveals that 27 percent of the respondents objectives of investment are their steady
income and short term profit seeking from their investment, 21 of investors felt that their objective
behind the investment is long term future needs, 16 percent feel that they invest for tax benefits, 15
percent for future security and 21 percent for other such as children education, daughter’s
marriage and overcome their future emergencies.

Asia Pacific Journal of Research in Business Management Vol. 8, Issue 7, July 2017 Impact Factor: 5.16, ISSN: (2229-4104)
www.skirec.org Email Id: [email protected]
An International Double-Blind, Peer Reviewed, Refereed Open Access Journal - Included in the International Indexing Directories
Page 44
RELATIONSHIP BETWEEN ANNUAL INCOME AND OBJECTIVES OF INVESTMENT: Table 6 provides
information of respondent’s objective of investment by annual income.
Table No. 6: Relationship between Annual Income and Objectives of Investment
Sl. No.
Annual Income Steady Income
Long term Profit
Seeking
Tax Benefits
Future Security
Others
1 Below Rs. 3,00,000 40 30 14 18 20
2 Rs. 3,00,000 – Rs. 5,00,000 8 10 18 4 2
3 Rs. 5,00,000 – Rs. 7,00,000 4 8 4 10 -
4 Above Rs. 7,00,000 2 8 8 8 6
Source: Primary Data
To study the relationship between annual income and objectives of Investment of the respondents,
the Chi-square test applied.
NULL HYPOTHESIS: There is no significant relationship between annual income of the respondents
and their objectives of Investment Avenue.
Results of Chi Square test
Degree of Freedom 12
Table value at 5 percent level 21.0
Calculated value 95.7
Since the calculated Chi Square value is greater than the table value at 5 percent level of
significance, the null hypothesis is rejected. Hence there is a significant relationship between annual
income of the respondents and objectives of investment.
INVESTORS AWARENESS ON INVESTMENT AVENUES: An investment decision depends upon the
availability of information regarding the investment opportunities which are collected by an investor
from different references as by self-awareness, advices of consultants & brokers’, friends and family
members.
Table No. 7: Investors Awareness on Investment Avenues
Sl. No. Particulars No. of Respondents Percentage
1 Self-Awareness 40 40
2 Financial advisor / consultant / Broker’s advice 12 12
3 Family Members / Friends 40 40
4 SEBI, BSE/NSE Websites 08 08
Total: 100 100
Source: Primary Data
From the above table 3, it is identified that 40 percent respondents have select their investment
opportunity by their self-awareness and 40 percent of respondents influenced by their decision
Asia Pacific Journal of Research in Business Management Vol. 8, Issue 7, July 2017 Impact Factor: 5.16, ISSN: (2229-4104)
www.skirec.org Email Id: [email protected]
An International Double-Blind, Peer Reviewed, Refereed Open Access Journal - Included in the International Indexing Directories
Page 45
through family members and friends, 12 percent respondents through financial and broker’s advice
and 8 percent of respondents through SEBI, BSE/NSE Websites.
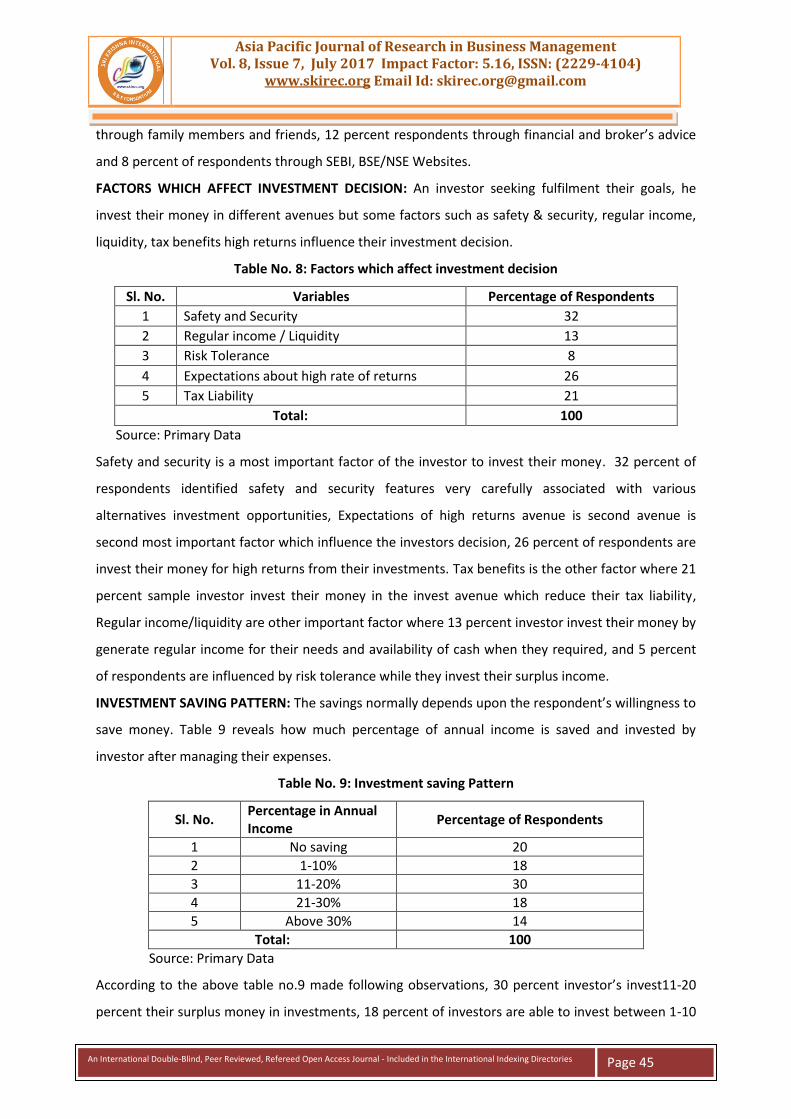
FACTORS WHICH AFFECT INVESTMENT DECISION: An investor seeking fulfilment their goals, he
invest their money in different avenues but some factors such as safety & security, regular income,
liquidity, tax benefits high returns influence their investment decision.
Table No. 8: Factors which affect investment decision
Sl. No. Variables Percentage of Respondents
1 Safety and Security 32
2 Regular income / Liquidity 13
3 Risk Tolerance 8
4 Expectations about high rate of returns 26
5 Tax Liability 21
Total: 100
Source: Primary Data
Safety and security is a most important factor of the investor to invest their money. 32 percent of
respondents identified safety and security features very carefully associated with various
alternatives investment opportunities, Expectations of high returns avenue is second avenue is
second most important factor which influence the investors decision, 26 percent of respondents are
invest their money for high returns from their investments. Tax benefits is the other factor where 21
percent sample investor invest their money in the invest avenue which reduce their tax liability,
Regular income/liquidity are other important factor where 13 percent investor invest their money by
generate regular income for their needs and availability of cash when they required, and 5 percent
of respondents are influenced by risk tolerance while they invest their surplus income.
INVESTMENT SAVING PATTERN: The savings normally depends upon the respondent’s willingness to
save money. Table 9 reveals how much percentage of annual income is saved and invested by
investor after managing their expenses.
Table No. 9: Investment saving Pattern
Sl. No. Percentage in Annual Income
Percentage of Respondents
1 No saving 20
2 1-10% 18
3 11-20% 30
4 21-30% 18
5 Above 30% 14
Total: 100
Source: Primary Data
According to the above table no.9 made following observations, 30 percent investor’s invest11-20
percent their surplus money in investments, 18 percent of investors are able to invest between 1-10
Asia Pacific Journal of Research in Business Management Vol. 8, Issue 7, July 2017 Impact Factor: 5.16, ISSN: (2229-4104)
www.skirec.org Email Id: [email protected]
An International Double-Blind, Peer Reviewed, Refereed Open Access Journal - Included in the International Indexing Directories
Page 46
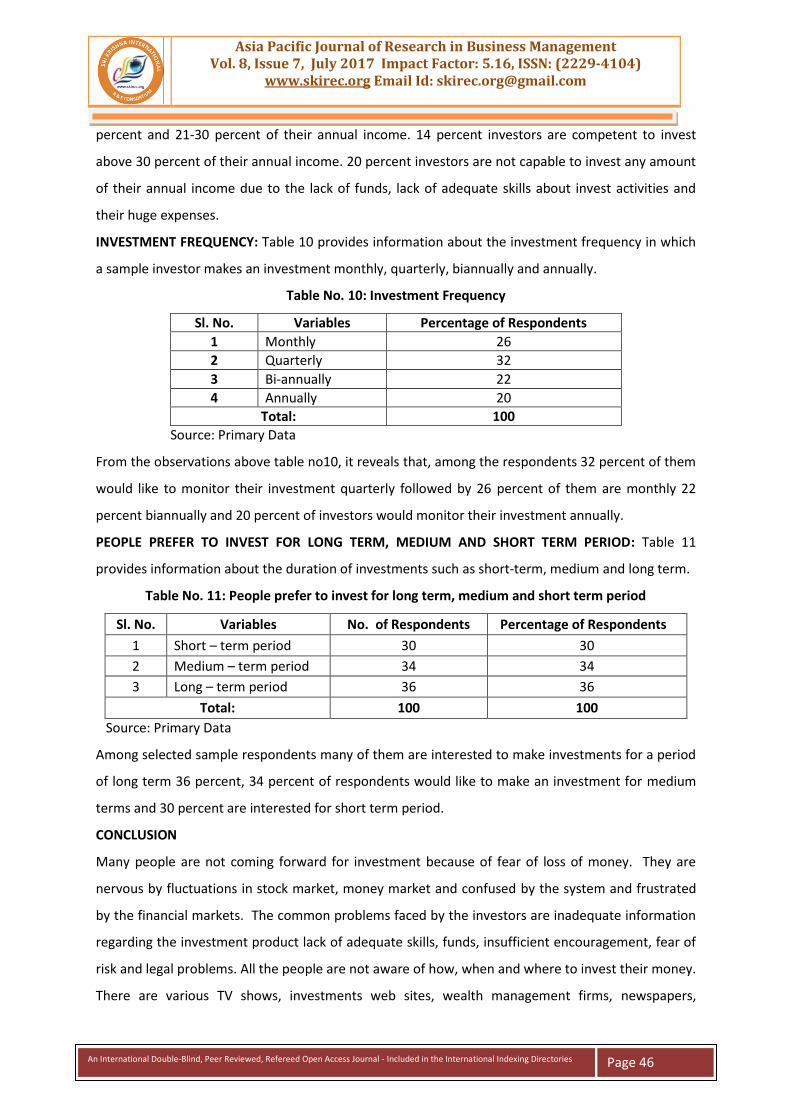
percent and 21-30 percent of their annual income. 14 percent investors are competent to invest
above 30 percent of their annual income. 20 percent investors are not capable to invest any amount
of their annual income due to the lack of funds, lack of adequate skills about invest activities and
their huge expenses.
INVESTMENT FREQUENCY: Table 10 provides information about the investment frequency in which
a sample investor makes an investment monthly, quarterly, biannually and annually.
Table No. 10: Investment Frequency
Sl. No. Variables Percentage of Respondents
1 Monthly 26
2 Quarterly 32
3 Bi-annually 22
4 Annually 20
Total: 100
Source: Primary Data
From the observations above table no10, it reveals that, among the respondents 32 percent of them
would like to monitor their investment quarterly followed by 26 percent of them are monthly 22
percent biannually and 20 percent of investors would monitor their investment annually.
PEOPLE PREFER TO INVEST FOR LONG TERM, MEDIUM AND SHORT TERM PERIOD: Table 11
provides information about the duration of investments such as short-term, medium and long term.
Table No. 11: People prefer to invest for long term, medium and short term period
Sl. No. Variables No. of Respondents Percentage of Respondents
1 Short – term period 30 30
2 Medium – term period 34 34
3 Long – term period 36 36
Total: 100 100
Source: Primary Data
Among selected sample respondents many of them are interested to make investments for a period
of long term 36 percent, 34 percent of respondents would like to make an investment for medium
terms and 30 percent are interested for short term period.
CONCLUSION
Many people are not coming forward for investment because of fear of loss of money. They are
nervous by fluctuations in stock market, money market and confused by the system and frustrated
by the financial markets. The common problems faced by the investors are inadequate information
regarding the investment product lack of adequate skills, funds, insufficient encouragement, fear of
risk and legal problems. All the people are not aware of how, when and where to invest their money.
There are various TV shows, investments web sites, wealth management firms, newspapers,

Asia Pacific Journal of Research in Business Management Vol. 8, Issue 7, July 2017 Impact Factor: 5.16, ISSN: (2229-4104)
www.skirec.org Email Id: [email protected]
An International Double-Blind, Peer Reviewed, Refereed Open Access Journal - Included in the International Indexing Directories
Page 47
magazines; journals are available, which provide guidelines on investment of hard earned money.
Still many people are not putting their funds in proper investment avenues. Majority of the
respondents (40 percent) prefer insurance products as their first priority, followed by 32 percent
bank deposits, 27 percent of the investors invest for short term profit seeking and 40 percent of the
respondents know the investment avenues by self-awareness and family members and websites. 32
percent prefer investment for safety and security and 26 percent prefer for high rate of returns. 36
percent of respondents prefer to invest for long term period. There is a significant relationship
between annual income and their preferences for investment avenues and there is no significance
relationship between age of the respondents and their preferences for investment avenues. The
study finds that there is a significant relationship between the income of the respondents and the
objectives of investment.

Asia Pacific Journal of Research in Business Management Vol. 8, Issue 7, July 2017 Impact Factor: 5.16, ISSN: (2229-4104)
www.skirec.org Email Id: [email protected]
An International Double-Blind, Peer Reviewed, Refereed Open Access Journal - Included in the International Indexing Directories
Page 48
REFERENCES
1. Dr. Varsha Virani, Saving and Investment Pattern of School Teachers – A Study with reference to
Rajkot city, Gujarat, Journal of research in Commerce & Business Management, Volume No. 2,
Issue No. 4, ISSN – 22771166.
2. Megha Goyal & Dr. Anukrati Sharma, A Study of Investment Behaviour of Middle Income Group
towards different kinds of Investment avenues, IOSR Journal of Business and Management, e-
ISSN: 2278-487X, p-ISSN: 2319-7668, Volume 16, Issue8. Ver. IV (Aug. 2014) pp 01-10.
3. Ashly Lynn Joseph, Dr. M. Prakash, A Study on preferred Investment Avenues among the People
and Factors considered for investment, International Journal of Management and Commerce
Innovations, Volume No.2, Issue 1, pp(120-129), ISSN 23487585.
4. P. Bhanu sireesha, Ch. Sreelaxmi, Impact of Demographics on select Investment Avenues – A
case study of twin cities of Hyderabad and Secunderabad, India, International Journal of
Marketing, Financial Services and Management, Reseach, Volume. 2, No.6, June (2013), ISSN
2277-3622.
5. Amlan Jyoti Sharma, The Behavioural Finance: A Challenge or replacement to efficient market
concept, The Standard International Journals, Volume. 2, No.6, August – 2014, ISSN 2321 – 242X.
6. Dr. Babaraju K. Bhatt, Ms Apurva A. Chauhan, Behavioural Finance: A New Paradigm of Finance,
International Journal of Application or Innovation in Engineering & Management, Volume.3,
Issue 2, February, 2014, ISSN 2319-4847.
7. Heena Kothari, Investors Behaviour towards Investment Avenues: A Study with reference to
Indore City, Altius Shodh Journal of Management and Commerce, ISSN 2348-8891.
8. Saloni Reheja, Bhuvan Lamba, Behaviour of Investor towards Investment, Indian Journal of
applied Research, Volume 3, Issue 10, October, 2013, ISSN 2249-555X.
9. R. Jayasathya and G Retha, A Study on Investor’s Investment Pattern in various Avenues
(empirical study in Coimbatore City), Global Journal for Research Analysis, Volume 3, Issue 1,
January, 2014, ISSN No. 2277-8160.
10. How Household save & Invest: Evidence from NCAER Household Survey (July 2011), Sponsored
by Securities and Exchange Board of India.